Article

Effects of Elevated Carbon Dioxide and Salinity on the Microbial Diversity in Lithifying Microbial Mats

1
Space Life Science Lab, University of Florida, Merritt Island, FL 32953, USA
2
Department of Plant Pathology and Microbiology, University of California Riverside, Riverside, CA 92521, USA
3
Department of Marine Sciences, University of Connecticut, Groton, CT 06340, USA
*
Author to whom correspondence should be addressed.
Minerals 2014, 4(1), 145-169; https://doi.org/10.3390/min4010145
Submission received: 9 January 2014 / Revised: 7 March 2014 / Accepted: 10 March 2014 / Published: 14 March 2014
(This article belongs to the Special Issue CO2 Sequestration by Mineral Carbonation: Challenges and Advances)

Abstract

:
Atmospheric levels of carbon dioxide (CO2) are rising at an accelerated rate resulting in changes in the pH and carbonate chemistry of the world’s oceans. However, there is uncertainty regarding the impact these changing environmental conditions have on carbonate-depositing microbial communities. Here, we examine the effects of elevated CO2, three times that of current atmospheric levels, on the microbial diversity associated with lithifying microbial mats. Lithifying microbial mats are complex ecosystems that facilitate the trapping and binding of sediments, and/or the precipitation of calcium carbonate into organosedimentary structures known as microbialites. To examine the impact of rising CO2 and resulting shifts in pH on lithifying microbial mats, we constructed growth chambers that could continually manipulate and monitor the mat environment. The microbial diversity of the various treatments was compared using 16S rRNA gene pyrosequencing. The results indicated that elevated CO2 levels during the six month exposure did not profoundly alter the microbial diversity, community structure, or carbonate precipitation in the microbial mats; however some key taxa, such as the sulfate-reducing bacteria Deltasulfobacterales, were enriched. These results suggest that some carbonate depositing ecosystems, such as the microbialites, may be more resilient to anthropogenic-induced environmental change than previously thought.

1. Introduction

The Earth’s climate has naturally fluctuated over its 4.6 billion year history [1], however, it is the recent, rapid change in climate that has been cause for concern, as it is unclear how these anthropogenic changes will impact the taxonomic and functional diversity of many lithifying microbial ecosystems [2]. Of the various components of climate change, the accumulation of fossil-fuel derived carbon dioxide (CO2) in the atmosphere and the subsequent uptake by the world’s oceans has been of particular concern, as the global carbon cycle is closely linked to the biogeochemical cycling of nutrients and may impact the microbes that mediate these cycles [3,4,5]. With anthropogenic emissions expected to continue (~6.3 × 10¹⁵ g/year), it is anticipated that approximately half of the CO2 released will remain in the atmosphere each year [6]. This rise in atmospheric CO2 is mitigated, in part, by the world’s oceans. Oceanic uptake accounts for the removal of approximately 1.7 × 10¹⁵ g of CO2 annually [6] and represents the largest sink of atmospheric CO2 in the global carbon cycle. However, as ocean uptake and the partial pressure of CO2 (pCO2) in seawater increases, there is a decreased saturation of calcium carbonate (CaCO3) and an increase in hydrogen ion concentrations [H+], which in the 20th century caused an 0.1 unit drop in global oceanic pH [7]. Another 0.3–0.4 unit drop is expected over the 21st century if atmospheric CO2 levels continue to increase unabated [8]. Therefore, it is important to assess the impact that rising CO2 and resulting ocean acidification have on lithifying microbial ecosystems. An improved understanding the microbial response to such perturbations may potentially enable predictions to be made regarding how complex marine communities may be affected by future anthropogenic changes and may also facilitate our interpretation of past climates through the analysis of the paleo record.
To address these issues we used modern microbialites as a model system to determine whether such changes in the environment are reflected in the microbial diversity and community structure of these ecosystems. Microbialites are carbonate build-ups that are derived from mineral precipitation and/or the trapping and binding activities of benthic lithifying microbial mats [9]. Microbialites are found across the globe in a wide variety of aquatic habitats (e.g., freshwater, hypersaline, marine), have a long geologic record [10]. The microbial mats associated with these structures are characterized by high metabolic activity and extensive biologically induced carbonate mineralization, an important component of the global carbon cycle [11,12]. Biogeochemical and microbial diversity analyses have revealed several key functional groups associated with lithifying mats including: aerobic heterotrophic bacteria, oxygenic phototrophs, anoxygenic phototrophs, sulfate-reducing bacteria, sulfide-oxidizing bacteria, and fermentative bacteria [13,14,15,16,17,18,19]. Together the cell-to-cell interactions between these organisms generate light-driven geochemical nutrient gradients and organo-sedimentary framework, which facilitate the precipitation of calcium carbonate and the formation of the microbialite structures [12].
Microbialites have also been shown to be amenable to laboratory cultivation and experimental manipulation [20,21]. Samples of microbialites collected from the open marine stromatolites of Highborne Cay, The Bahamas have been shown to undergo extensive deposition of aragonite, a polymorph of calcium carbonate under simulated environmental conditions [21]. Diversity analyses of the laboratory-cultivated microbialites indicate that the communities share extensive similarity with the natural stromatolite populations from which the inocula are derived [21,22]. In this study we used laboratory-cultivated microbialites to examine the impact of elevated atmospheric CO2 on the microbial diversity, morphology, and extent of carbonate precipitation within the communities. For control purposes, we conducted these CO2 manipulations in parallel with normal and elevated salinity conditions, as salinity has been previously shown to influence and control ecotype diversity and function of microbial mats populations [23,24,25,26]. Together, these experimental manipulations of the microbialites assess the sensitivity of these metabolically active communities to perturbations in CO2, pH and salinity as well as delineate those taxa within the lithifying microbial mats that differentially respond to these changing environmental conditions.

2. Experimental Section

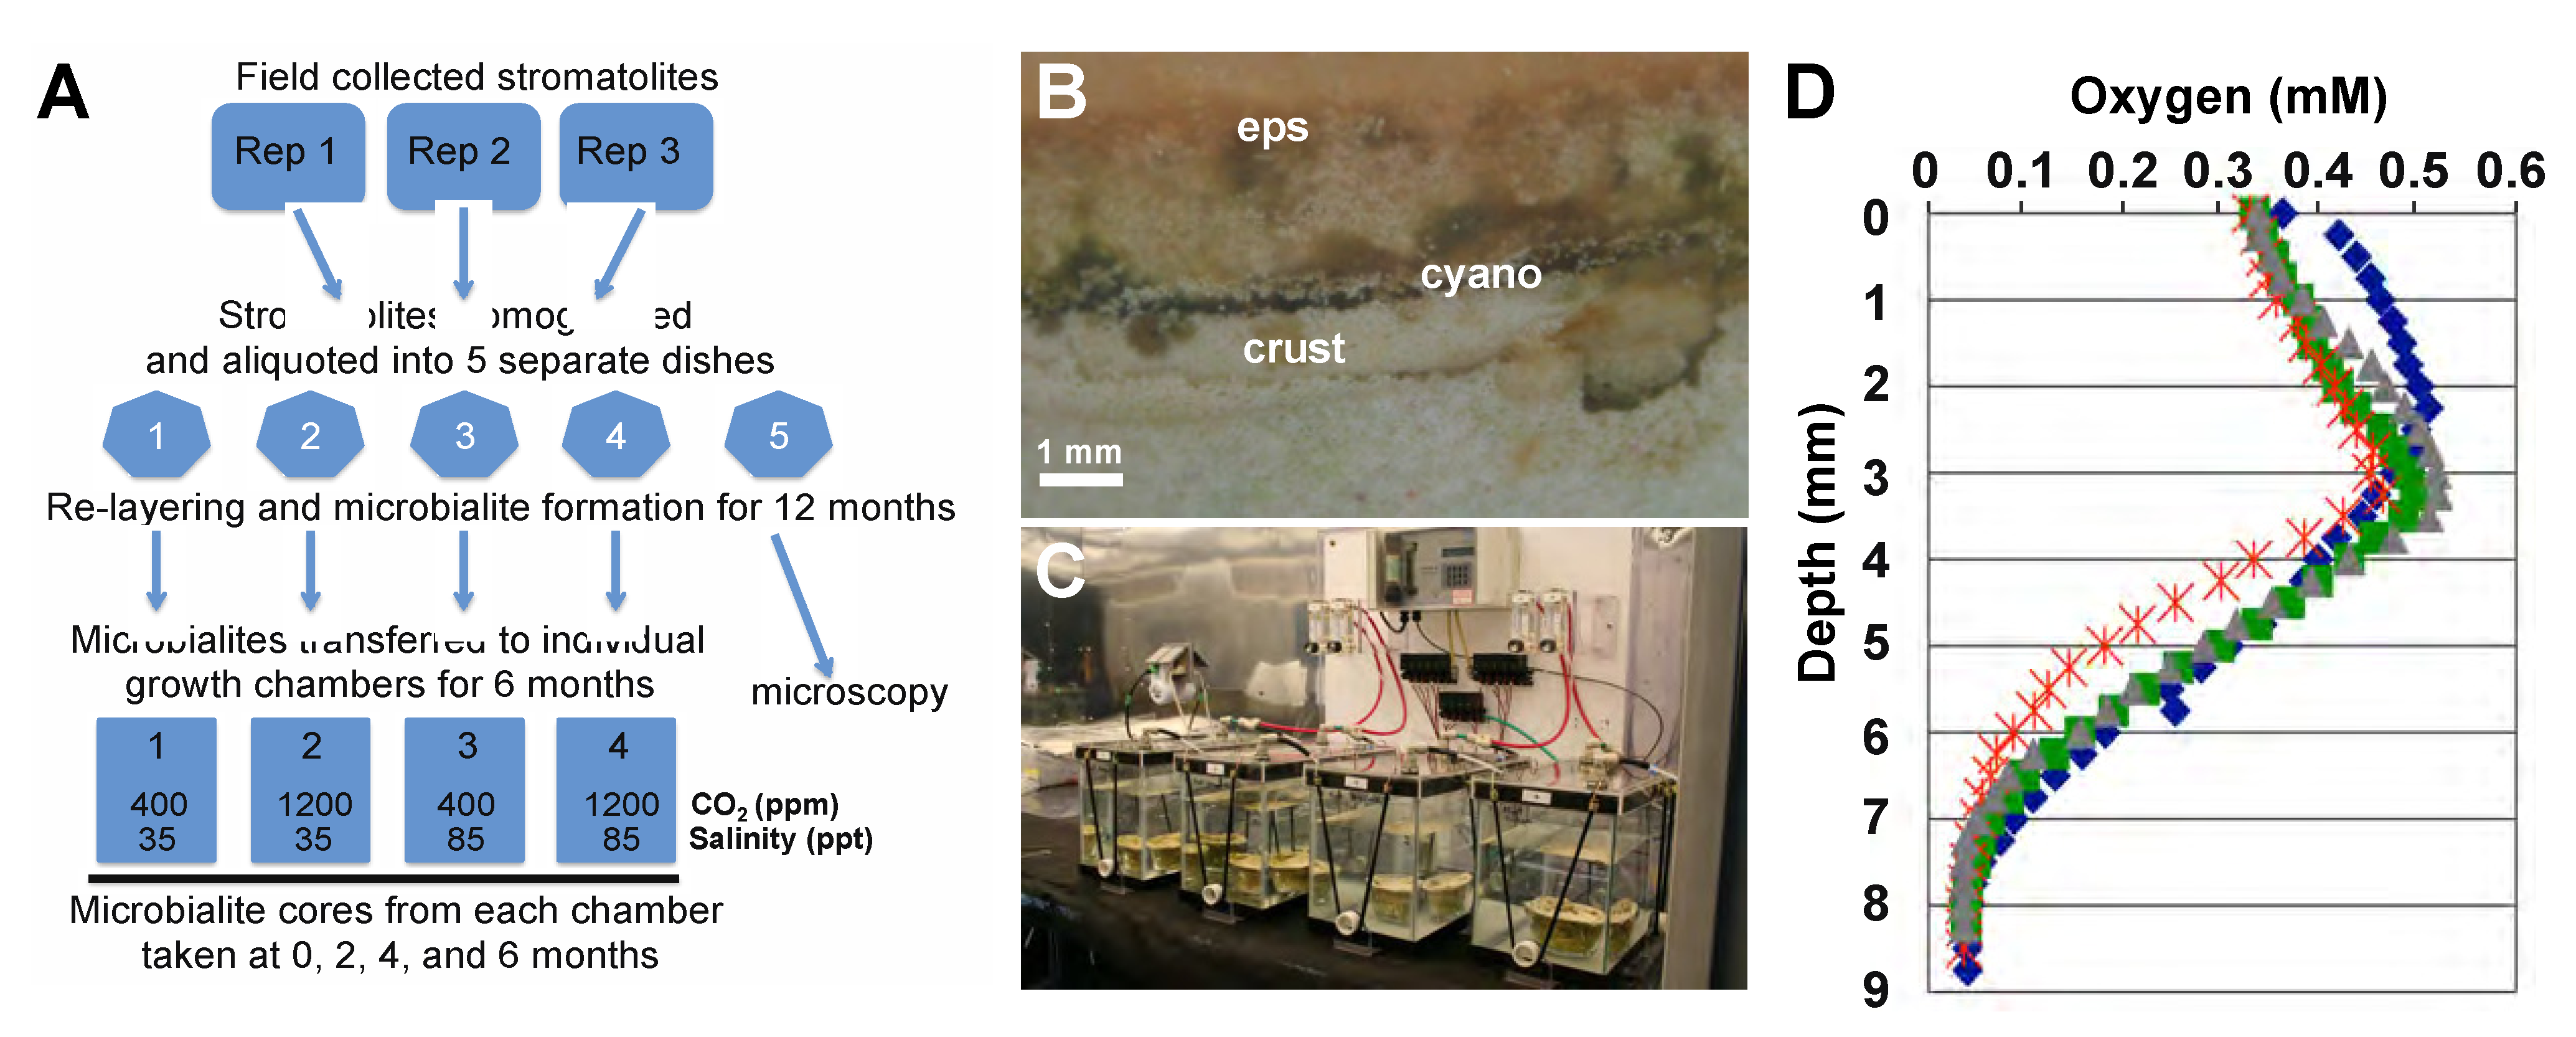
2.1. Lithifying Microbial Mat Cultivation

An overview of the experimental design is depicted in Figure 1A. Briefly, samples of natural stromatolite forming mats, were collected from Site 8 [27] of the island of Highborne Cay, The Bahamas and transported to the University of Florida Space Life Science Lab. There, three 5 g sections of field-collected stromatolites were homogenized and aliquoted to five sterile Pyrex dishes containing sterilized ooids to a depth of 1 cm (Figure 1A). The homogenization was intended to evenly distribute the microbial ecotypes within the replicate microbialites. The microbialite slurries were maintained for 12 months under ambient conditions (28 °C; 35‰ artificial seawater (Instant Ocean, Mentor, OH, USA); 400 parts per million per volume (ppmv) CO2 under a light regime of 500 μE/m2/s on a 12 h light/dark cycle) to promote re-layering and mineralization [28]. Sterilized ooids were added monthly to a depth of 1 mm to mimic the burial events experienced by natural stromatolitic mats [29,30]. At the end of the cultivation period one of the replicate microbialites was sacrificed to ensure that the layered morphology and lithification previously described [21] were present (Figure 1A,B) and the remaining microbialites were transferred to individualized growth chambers (as described below). The transfer of the microbialites to the environmental growth chambers marks the start of the environmental manipulations and is referred to as T0 (i.e., Time = 0 months).

2.2. Construction of Environmental Manipulation Chambers

Four independent chambers were constructed to house microbialites under a range of environmental growth conditions (Figure 1C). The chambers were maintained at 28 °C and 500 μE/m2/s of light on a 12 h light/dark cycle. The base of each chamber consisted of a 2.5-gallon aquarium that was filled with artificial seawater (35‰; Instant Ocean, Blacksburg, VA, USA) and was circulated by a 15 mm, 100 L/h pump (Koralia, Bassano del Grappa, Italy). Salinity of the seawater was measured weekly using a refractometer and pH was measured using a standard 350 pH meter (Beckman, Brea, CA, USA). Each aquarium was covered with a custom clear acrylic lid with neoprene seals that was secured to the top of the tank with bungee cords (Figure 1C). The lid contained two gas port fittings and one temperature probe. The automatic monitor and control of CO2 flux within the chambers was accomplished using electronic input/output hardware and programmable software (Ultimate ADS, Opto22, Temecula, CA, USA). A diagram of the gas flow and data collection is presented in supplemental Figure S1. To monitor the CO2 levels an infrared CO2 gas analyzer (WMA-4, PP Systems, Amesbury, MA, USA) was connected to two separate manifolds (Isonic M1, Mead Fluid Dynamics, Chicago, IL, USA) with four input and four output gas solenoids (Isonic V1 2-way, Mead Fluid Dynamics). Each of the chambers was connected with two 1/8” ID Teflon tubing to the gas solenoids. Two manifolds and 10 gas solenoids were used for sampling CO2 levels whereas one manifold with four gas solenoids was used to add CO2 when required to maintain CO2 set point. Gas was sampled from each chamber for 1 min at a rate of 300 mL/min and the gas sample was returned to the same chamber. After each measurement the sampling manifolds were purged with ambient air for 1 min before the next CO2 sample was measured. Each chamber was monitored every 8 min. The CO2 values and the temperature values for each chamber were saved to a local data server Command Monitor Data System (CMDS), Space Life Science Lab, Merritt Island, FL, USA. When the CO2 level was less than the set point the CO2 gas solenoid opened for 1 s with 99% CO2 gas at 21.37 kPa for each chamber independently. This “round robin” sampling method was continuous throughout the six-month exposure period.

2.3. Microelectrode Depth Profiling of Oxygen

To ensure the reproducibility of the layered lithifying microbial mats, depth profiles of oxygen production were generated using a Clark needle electrode (Microscale Measurements, The Hague, The Netherlands) with an outer diameter of 0.4 mm and a sensing tip diameter of ca. 20 μm [31,32]. A Unisense PA2000 picoammeter (Unisense, Arhus, Denmark) with customized variable polarization was used to register the oxygen signal. Profiles were measured in 0.2-mm increments within 1 h of peak photosynthetic activity with the aid of a motorized ministage MM-3M-EX-2.0 (Unisense, Arhus, Denmark) and a programmable Servo 3000 MC4B controller box (National Aperture, Salem, NH, USA). Profiles were generated for each microbialite in triplicate after the 12-month re-layering period right before they were incubated in the environmental flux chambers.

2.4. Sampling and DNA Extraction from Microbialites

Cores of the lithifying microbial mats were collected in triplicate at the start of the environmental manipulation (T0) and at two months intervals (T2, T4, T6). Cores were taken using a modified sterile 1-cc syringe with the luer lock removed and immediately frozen (−80 °C) within the syringe to maintain spatial integrity of the mat. To isolate DNA from the mat samples, the frozen cores were carefully removed from the syringe and sectioned vertically into three to four subsections, each weighing between 40 and 100 mg. The vertical sections were added to individual cryotubes each containing a sterile zirconia bead cocktail composed of 0.2 g of 0.1 mm beads, 0.2 g of 0.7 mm beads, and 0.2 g of 2.4 mm beads (BioSpec Products, Inc., Bartlesville, OK, USA). Total genomic DNA was extracted using a xanthogenate-based procedure and a modified PowerSoil DNA isolation kit (MoBio, Carlsbad, CA, USA) as previously described [18,26]. DNA concentrations were determined fluorescently using the Quant-iT™ PicoGreen® dsDNA Assay Kit (Invitrogen, Carlsbad, CA, USA).
Figure 1. Overview of experimental design, microbialites and environmental manipulation chambers. (A) Flow chart depicting the experimental design; (B) Cross section of microbialites at the end of the re-layering period (T0) depicting the three primary layers: biofilm layer rich in exopolymeric substances (eps); cyanobacterial (cyano); and aragonite-fused grain crust (crust); (C) Independent growth chambers were used to house microbialites and manipulate environmental conditions; (D) Oxygen depth profiles of microbialites at T0; Chamber 1 (blue), Chamber 2 (green), Chamber 3 (red), and Chamber 4 (grey).
Minerals 04 00145 g001

2.5. Amplicon Library Synthesis, Barcode Labeling and Sequencing

To determine changes in microbial community composition under the various environmental conditions, a 16S rRNA gene amplicon library was generated for each chamber treatment (n = 4) at each time point (n = 4). The forward primer used in all the polymerase chain reaction (PCR) amplification reactions was identical to the primer used by Hamady et al. [33] and consisted of the 454 primer B, a two-base linker, and the bacterial 16S rRNA gene primer 27F [34]. The reverse primer was a composite of the 454 primer A, a unique barcode oligonucleotide sequence, a two-base linker and the bacterial 16S rRNA gene primer 338R [33]. Sixteen unique barcoded sequences were developed each representing an individual incubation chamber (C1, C2, C3, or C4) at one specific time point (T0, T2, T4, or T6). All primers used in this study are listed in supplementary Table S1. The final PCR conditions for each reaction were as follows: 1X cloned Pfu Reaction Buffer (Stratagene, La Jolla, CA, USA), 280 μM deoxyribonucleotides (dNTPs), 100 μg/mL Bovine Serum Albumin (BSA), 600 nM of each primer, 1.0 ng genomic DNA, 0.5 U Cloned Pfu Turbo DNA Polymerase (Stratagene), and water to 25 μL. The reactions were held at 95 °C for 3 min, followed by 35 cycles of amplification at 95 °C for 1 min, 64 °C for 1 min, and 75 °C for 3 min. A final extension was carried out at 75 °C for 7 min. PCR reactions were run in triplicate and the products purified using the UltraClean™ PCR Clean-up DNA Purification Kit (MoBio). The replicate PCR reactions were quantified using the Quant-iT™ PicoGreen® dsDNA Assay Kit (Invitrogen) and pooled in equimolar concentrations. The amplicon libraries (n = 16) were sequenced using GS-FLX chemistry (454 Life Sciences, Branford, CT, USA) at the University of Florida Interdisciplinary Center for Biotechnology Research. The raw sequences and quality files have been deposited at the NCBI sequencing read archive under project number SRA043726.

2.6. Analysis of Pyrosequencing Sequencing Data

Pyrosequence data was processed, analyzed, and classified using the open-source mothur software package [35]. Raw sequencing reads were assessed for quality using the following criteria. Any sequence that did not contain an exact match to the primer, contained ambiguous reads, or had a quality score below 27 were removed from the analysis [36]. Short reads below 200 bp were also removed to improve quality [37], as were reads longer than 400 bp due to limitations with the GS-FLX chemistry (454 Life Sciences, Branford, CT, USA). The remaining high quality sequences were dereplicated and the primer sequences were removed. The reverse complement of the sequences was used for analysis as sequencing was performed from the reverse primer.
The resulting dataset was aligned in mothur to a bacterial SILVA 16S rRNA gene template using the nearest alignment space termination (NAST) algorithm. Chimeric sequences were identified and removed using the mothur implementation of Chimera Slayer [38]. No sequence mask was used in this analysis as it has been previously shown to reduce the diversity observed between sequences [39]. The alignment was trimmed such that all reads aligned to exactly the same region. To identify and remove potential pyrosequencing errors the libraries were analyzed with the pre.cluster function in mothur that uses a single linkage preclustering (SLP)-based algorithm [40]. Once any error-prone sequences were removed a pairwise distance matrix was generated and reads were clustered into operational taxonomic units (OTUs) at 3% using the furthest neighbor method [41]. Representative sequences from each OTU were classified at a 70% confidence threshold using a naïve Bayesian approach [42]. The reference database used for classification was composed of unique, full-length bacterial sequences from the SILVA SSU Ref v102 database as previously described [19].
Libraries were normalized within mothur to account for the effect of sampling depth on alpha-diversity measurements. Normalization was accomplished by subsampling, in triplicate, 1502 sequences from each library. The number of randomly subsampled sequences represents 75% of the sequences in the least represented library. The average value of these replicate subsamples was used to compute the Chao1 non-parametric species richness estimate, Shannon indices, the Shannon-based richness estimate, and Good’s coverage estimate.

2.7. Community Comparisons between Treatments

To compare phylogenetic distances between various microbialite treatments a community analysis was performed using Fast UniFrac [43,44]. Fast UniFrac analyses were also completed to assess whether the Alphaproteobacteria and Deltaproteobacteria contributed to the community structure and were impacted by environmental changes. Reads classified to these taxa were removed from the different bacterial 16S rRNA gene library to create three artificial libraries. Principal coordinate analysis (PCoA) was carried out on weighted and normalized data using Fast UniFrac.

3. Results

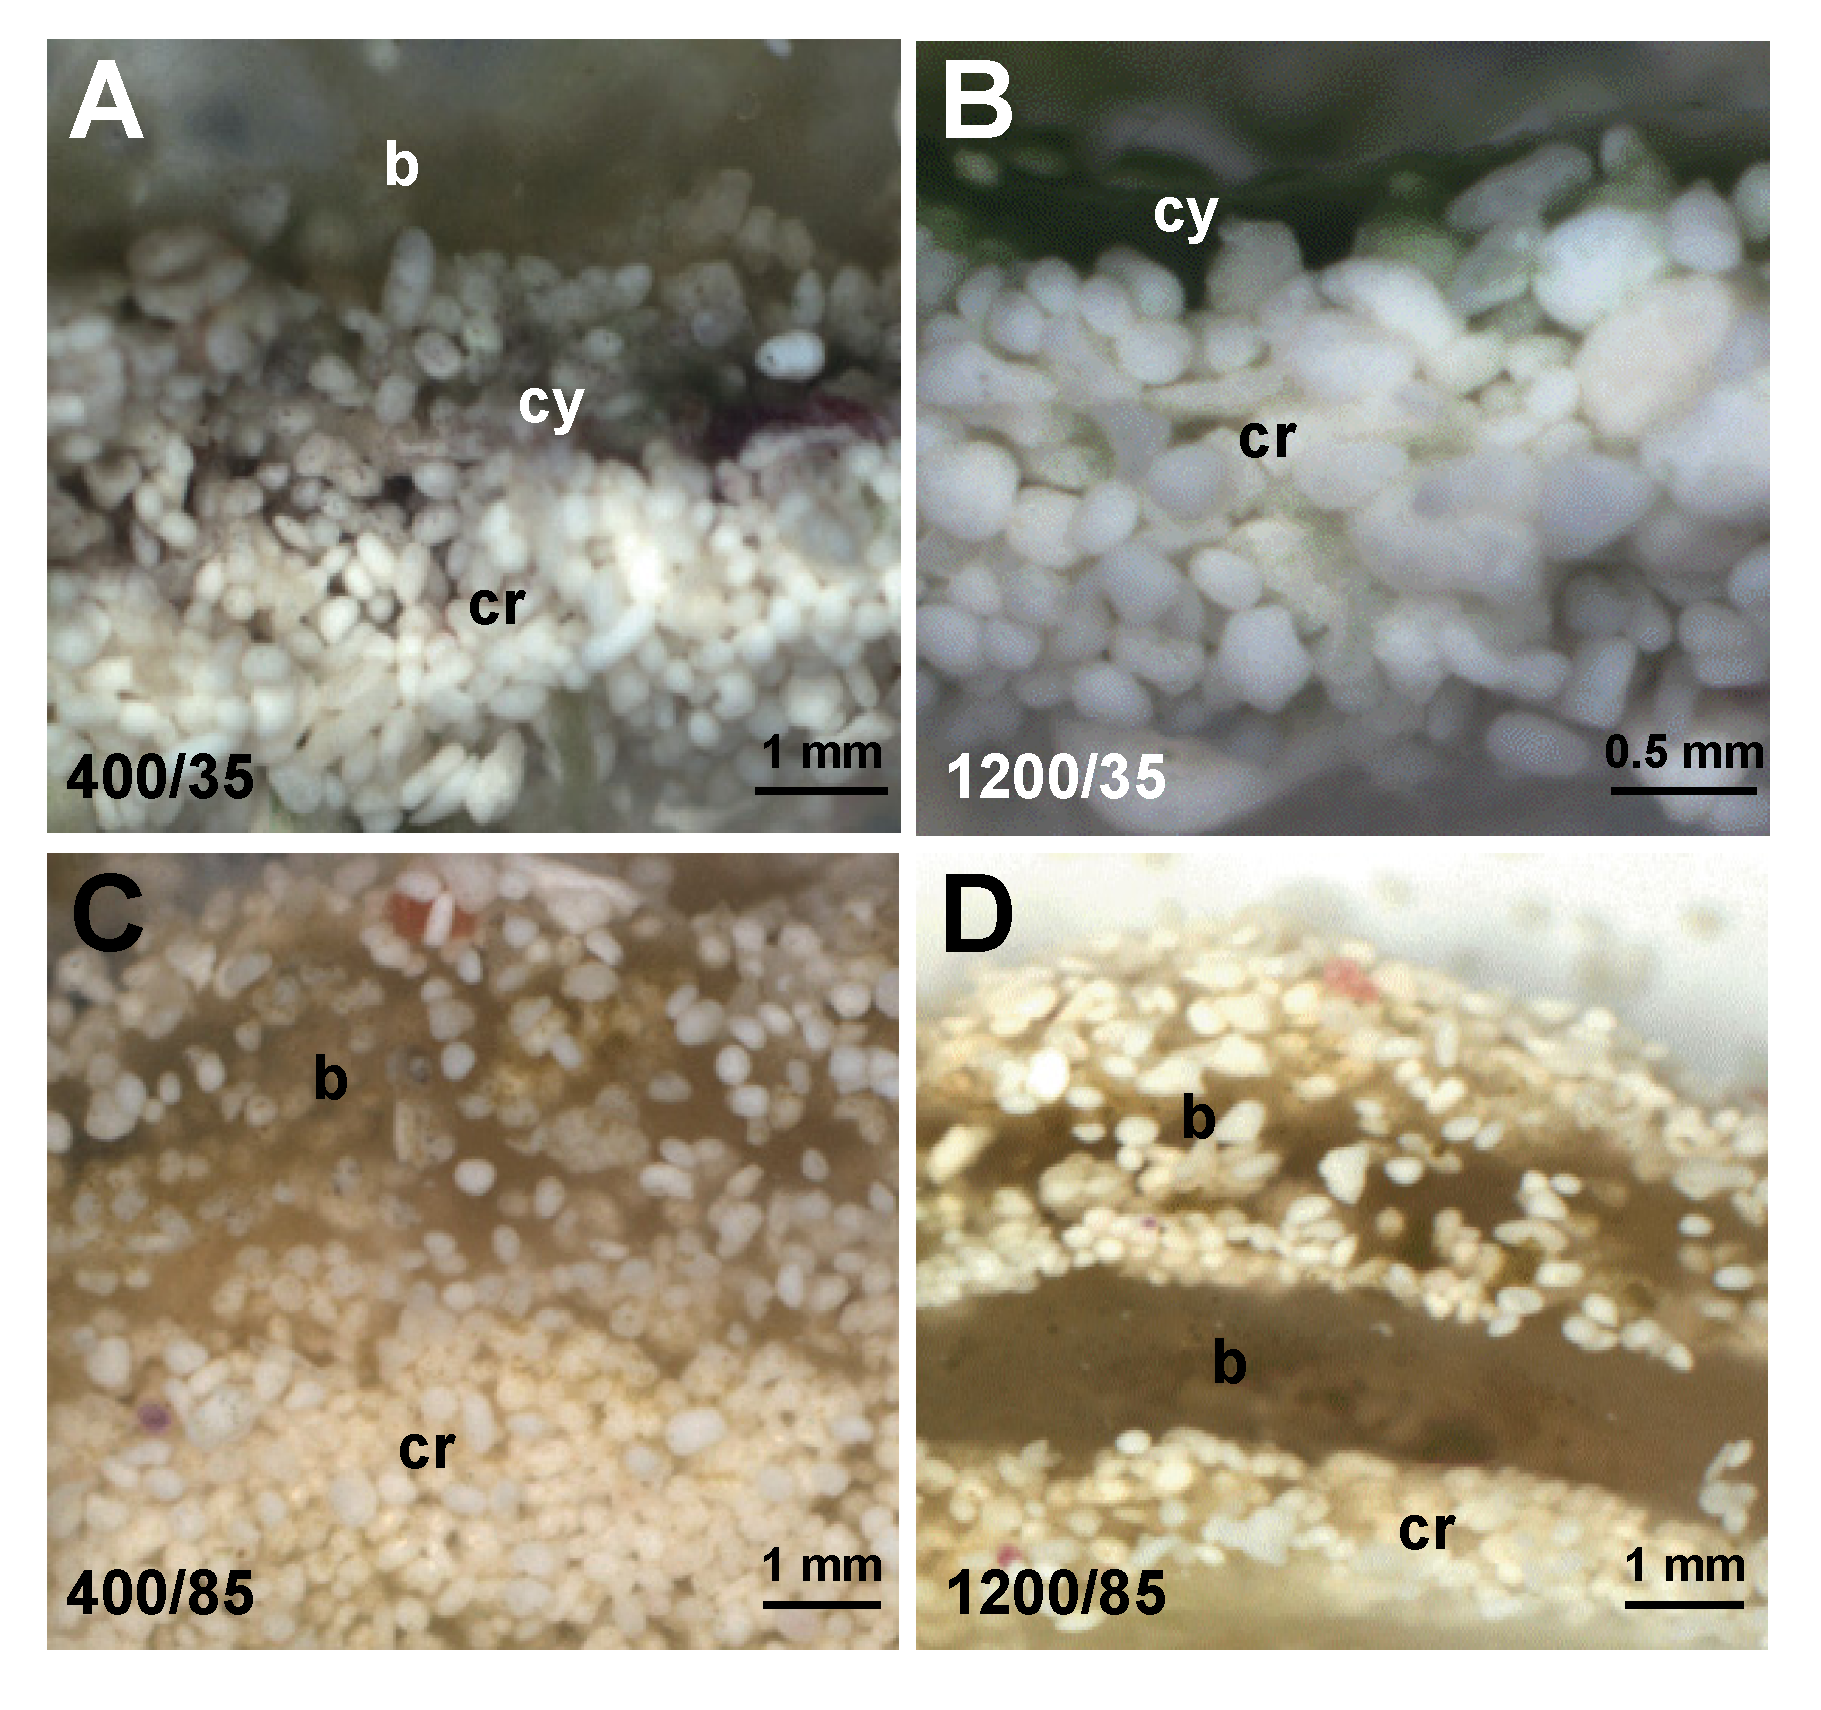
3.1. Microbialite Incubations under Variable Environmental Conditions

Microbialites were cultivated in the laboratory for 12 months at which time they ranged in thickness from between 10 and 12 mm and contained an area of 16 cm2 for each replicate. During this cultivation period the growth conditions mimicked that of the natural environment in terms of temperature (28 °C), pH (8.2) and ambient levels of carbon dioxide (390 ppmv). After cultivation, the mats formed three prominent layers including a thick (2–3 mm) superficial exopolymeric substance (EPS) layer, a pronounced cyanobacterial layer (<1 mm) and a micritic layer comprised of calcium carbonate (Figure 1B). The morphology and extent of carbonate deposition of these multilayer communities were consistent between mat replicates and with previous artificial microbialite models [21]. To further assess the reproducibility of the microbialites oxygen profiles were generated for each of the replicates just prior to incubation in the environmental growth chambers. Microelectrode analysis was conducted in triplicate for each mat replicate generating O2 profiles between 11:30 am and 12:30 pm. All replicates showed a similar oxygen distribution with a single oxygen peak between 2.4 and 3.5 mm beneath the mat surface (0.47–0.52 mM). One of the three replicate profiles for each starting microbialite community is depicted in Figure 1D. The results indicated that the distribution and activity of the photosynthetic layers between the microbialite replicates was uniform.
After assessing the oxygen activity the replicates were placed in the environmental growth chambers and sealed with acrylic lids. This point marks the start of the experimental manipulations of the environmental conditions and is referred to as T0. Microbialites were incubated in the chambers for six months under four environmental treatments, which are summarize in Table 1. For the duration of the experiment the lithifying mats in Chamber 1 served as the ambient controls in which the salinity was maintained at 35‰ and the concentration of carbon dioxide (CO2) in the atmospheric headspace was maintained at 400 ppmv. In Chamber 2 microbialites were exposed to normal salinity (35‰) but CO2 levels were raised to three times current ambient levels at 1200 ppmv. This level was chosen as it represents the theoretical limit of ribulose-1,5-bisphosphate carboxylase oxygenase (RuBisCO), an enzyme that catalyzes the first major step of CO2 fixation [45]. In Chamber 3 the CO2 levels were kept at ambient conditions (400 ppmv); however, the salinity was increased to 85‰, as that is a level often found in hypersaline microbial mat environments [26,46,47]. In Chamber 4 both the salinity and the CO2 levels were increased to 85‰ and 1200 ppmv, respectively, to assess the synergistic effects of both parameters. The headspace of the chambers was monitored every 8 min for the duration of the experiment and a one month sample of CO2 readings is visualized in supplemental Figure S2, indicating a relatively tight control over the CO2 levels.
The pH of all chambers at the beginning of the experiment was 8.2 and was monitored weekly. The mean pH readings for the duration of the experiment are listed in Table 1. In the control Chamber 1 the pH ranged from 8.2 at the beginning and rose to 8.6 by the end of the experiment. In Chamber 2 the pH rapidly decreased to 7.7 in the first month but then increased back to 8.2 by the second month. In Chamber 3 the pH slowly dropped to 7.9 in the first two months then stabilized for the remaining three months. A similar trend was observed in Chamber 4 with the pH rapidly dropping from 8.2 to 7.7 in the first two months then stabilizing at 7.8 for the remaining experiment.
Table 1. Environmental parameters of microbialite incubations.
Chamber[CO2] (ppm)Salinity (‰)pH 1 (± std)Temperature 2 (°C)
1400358.47 (± 0.18)30
21200358.13 (± 0.05)30
3400858.01 (± 0.12)30
41200857.83 (± 0.19)30
Notes: 1 Mean of weekly pH readings taken for 6 months; all chambers started with pH 8.2; 2 Temperatures within chambers fluctuated between 29.8 and 31.2 °C.

3.2. Comparison of Small Subunit rRNA Gene Diversity in the Microbialites Exposed to Environmental Changes

Four bacterial 16S rRNA gene amplicon libraries were generated for each environmental chamber at 0, 2, 4, and 6 months of exposure representing a vertical profile of each sampled mat. Each of the 16 libraries were labeled with a unique oligonucleotide barcode and pyrosequenced generating a total of 100,514 sequences with an average length of 328 bp. After screening for quality 65,701 sequences were retained with an average length of 300 bp. The remaining sequences were sorted by barcode, aligned and analyzed with the mothur OTU-based pipeline [35]. The high quality sequencing reads recovered from mats in each chamber ranged from 13,785 to 20,245 sequences, which were then clustered into OTUs at 97% sequencing similarity using mothur (Table 2). Rarefraction curves were generated for each of the 16 libraries and results indicated that although sequencing was not saturated for each library there were even levels of sequencing (supplemental Figure S3). Classification and community analysis of the microbialite reads were based on the variable 2 (V2) region of the 16S rRNA gene.
The bacterial libraries recovered from OTU analysis of the four chambers were composed of sequences with similarity to 13 different phyla (Figure 2). A comparison of recovered sequences of the microbial mat treatments over six months indicated that the relative abundances of most phyla exhibited few distinctive changes. However, in the three dominant phyla Bacteroidetes, Cyanobacteria, and Proteobacteria differences in enrichments at the Order level were detectable. In the Bacteroidetes there were 7099 sequences recovered from the pyrosequencing analysis with most sequences (68%) classified to the order level. In most Bacteroidetes orders detected in the mats there were no differences observed between treatments. However, there was a 3-fold increase in the number of recovered sequences from the order Flavobacteriales under elevated CO2 levels as well as a 10-fold increased in sequences similar to the facultative anaerobic Muricauda. Both these enrichments occurred to a lesser extent in Chamber 4 where both CO2 and salinity was increased. Under ambient CO2 and elevated saline conditions there was a 3-fold increase in the order Sphingobacteriales and a 50-fold increase in the number of recovered sequences associated with the unclassified Bacteroidetes clone BD2-2 isolated from marine sediments.
Table 2. Alpha diversity measures for 16S rRNA gene amplicon library from microbialites exposed to variable CO2 and salinity levels.
ChamberChamber 1 (400/35) 1Chamber 2 (1200/35)
Time (Months)T0 2T2T4T6T0T2T4T6
Sequences21063503426639101526412626706894
Base Pairs 3239309314296240316309315
OTUs 43698656316114536835171200
Singlets 4202472329318260304271614
Doublets 46213292857110382201
OTUs 4,5 > 5% (Sum)2 (22%)0 (0%)3 (22%)2 (18%)0 (0%)0 (0%)1 (7%)1 (7%)
OTUs 4,5 > 1% (Sum)17 (58%)15 (20%)17 (47%)18 (45%)22 (36%)15 (27%)21 (44%)11 (30%)
Equalized sequences 615021502150215021502150215021502
Shannon (confidence)4.30 (0.09)5.69 (0.06)4.78 (0.08)4.87 (0.08)5.35 (0.07)5.36 (0.06)4.97 (0.08)5.32 (0.08)
Evenness0.760.910.810.820.880.890.840.86
Chao1 (confidence) 7559
(468/698)
1092
(938/1304)
730
(610/907)
766
(640/950)
912
(775/1106)
741
(641/887)
772
(644/961)
1066
(910/1281)
% Coverage 889%80%86%86%83%86%86%80%
ChamberChamber 3 (400/85) 1Chamber 4 (1200/85)
Time (Months)T0 2T2T4T6T0T2T4T6
Sequences23803789570583712086395851695242
Base Pairs 3235318298313241315308314
OTUs 4440584482452257426721618
Singlets 4226300242214143230388299
Doublets 4751046348356011387
OTUs 4,5 > 5% (Sum)2 (22%)0 (0%)1 (8%)3 (26%)2 (45%)2 (24%)2 (16%)2 (13%)
OTUs 4,5 > 1% (Sum)21 (55%)26 (52%)28 (68%)21 (67%)14 (68%)20 (62%)16 (47%)19 (47%)
Equalized sequences 615021502150215021502150215021502
Shannon (confidence)4.57 (0.09)4.90 (0.07)4.35 (0.07)4.01 (0.08)3.41 (0.11)4.16 (0.09)4.74 (0.08)4.75 (0.08)
Evenness0.780.840.800.760.640.750.810.83
Chao1 (confidence) 7676
(564/844)
749
(616/948)
490
(391/653)
345
(283/453)
449
(349/620)
514
(416/673)
850
(689/1087)
626
(518/792)
% Coverage 888%87%91%94%92%91%85%89%
Notes: 1 Values in parenthesis indicate the levels of CO2 and salinity, respectively, in each chamber; 2 Time reflected in 0, 2, 4, and 6 months from the start of the lithifying mat incubations; 3 Average length of quality-trimmed reads in base pairs; 4 Values were calculated based on a 97% similarity threshold; 5 Number of operational taxonomic units (OTUs) at 97% similarity threshold or higher that represent greater than 5 or 1% of the population. The percentage of the total community these OTUs represent are in parentheses; 6 Number of randomized sequences used to generate the diversity measures; 7 Values in parentheses represent the lower and upper boundaries of the 95% confidence interval; 8 Percent coverage of the amplicon libraries using the Goods’ coverage estimator formula (1-[N-singlets]/[N]).
Figure 2. Comparison of taxonomic diversity based on operational taxonomic units (OTUs) within the four treatments at 0 (T0), 2 (T2), 4 (T4) and 6 (T6) months. Histograms reflect the relative abundance as the percent of total sequences clustered into specific bacterial phyla, or sub-phyla, using a Bayesian approach at a confidence interval of ≥70%. The parameters within each environmental chamber are listed in parentheses and include the CO2 and salinity levels, respectively.
Minerals 04 00145 g002
Cyanobacterial sequences recovered from OTU-based analysis at the start of the experiment ranged from 10% to 25% indicating some variation within the starting microbialite communities. However, in mats exposed to higher salinity levels (Chambers 3 and 4) the cyanobacterial populations decreased to less than 5% of the recovered sequences by month six. The decrease in Cyanobacteria occurred early on in the experiment with a drop from 20% to 25% of the recovered sequences to between 5% and 7% in the first two months of the experiment. Of the 4863 recovered cyanobacterial sequences most (87%) were unable to be classified using the Bayesian approach even at a confidence interval of 70%. Of the remaining reads that were classifiable the order Oscillatoriales and Pleurocapsales showed a decrease in the number of recovered sequences under elevated salinity (Figure 3). Only chloroplasts showed an increased representation under elevated salinity, all of which were unclassifiable beyond the order level. Under elevated CO2 levels there were no changes in the overall number of Cyanobacteria sequences recovered from mats, however, there were changes at the order level including an increase in Pleurocapsales, with sequences similar to Pleurocapsa and Staneria spp. There was also an increase in the number of Oscillatoriales sequences recovered from elevated CO2 conditions most of many of which (64%) shared similarity to Pseudoanabena spp.
The most prominent enrichments in relative abundance occurred in the OTUs classified as Proteobacteria, specifically the subphyla Deltaproteobacteria (Figure 4). Under elevated CO2 levels Desulfobacterales, an order containing sulfate-reducing bacteria showed an increase at the end of the six-month period, irrespective of the salinity levels. Another increase in Deltaproteobacteria occurred in the order Desulfarculales, which appeared to be correlated with a rise in salinity. In Chamber 3 this Desulfarculales went from 2% of the recovered sequences at T0 to 17% of the community at T6. In Chamber 4 the levels of Desulfarculales went from undetectable at T0 to almost 3% of the sequences at T6. There were also several changes in Alphaproteobacteria within the lithifying mat treatments including the Rhodobacterales, which showed a sharp drop in the number of recovered sequences under both CO2 and salinity treatments. The drop in Rhodobacterales roughly corresponded to an increase in the order Rhodospirillales. Other changes to the Proteobacteria, such as a decrease in the number of recovered sequences with similarity to Burkholderiales, Rhizobiales, and Caulobacteriales do not appear to be treatment-specific, as fewer recovered sequences were detected in the control Chamber 1 as well.
Figure 3. Classified cyanobacterial sequences from OTUs that could be assigned to a specific order by a Bayesian approach at a confidence interval ≥ 70%. The cyanobacterial populations were compared at the start (T0) and at the end of the six-month incubation (T6). The environmental treatments include: C1, 400 ppmv CO2 and 35‰ salinity; C2, 1200 ppmv CO2 and 35‰ salinity; C3, 400 ppmv CO2 and 85‰ salinity; and C4, 1200 ppmv CO2 and 85‰ salinity.
Minerals 04 00145 g003

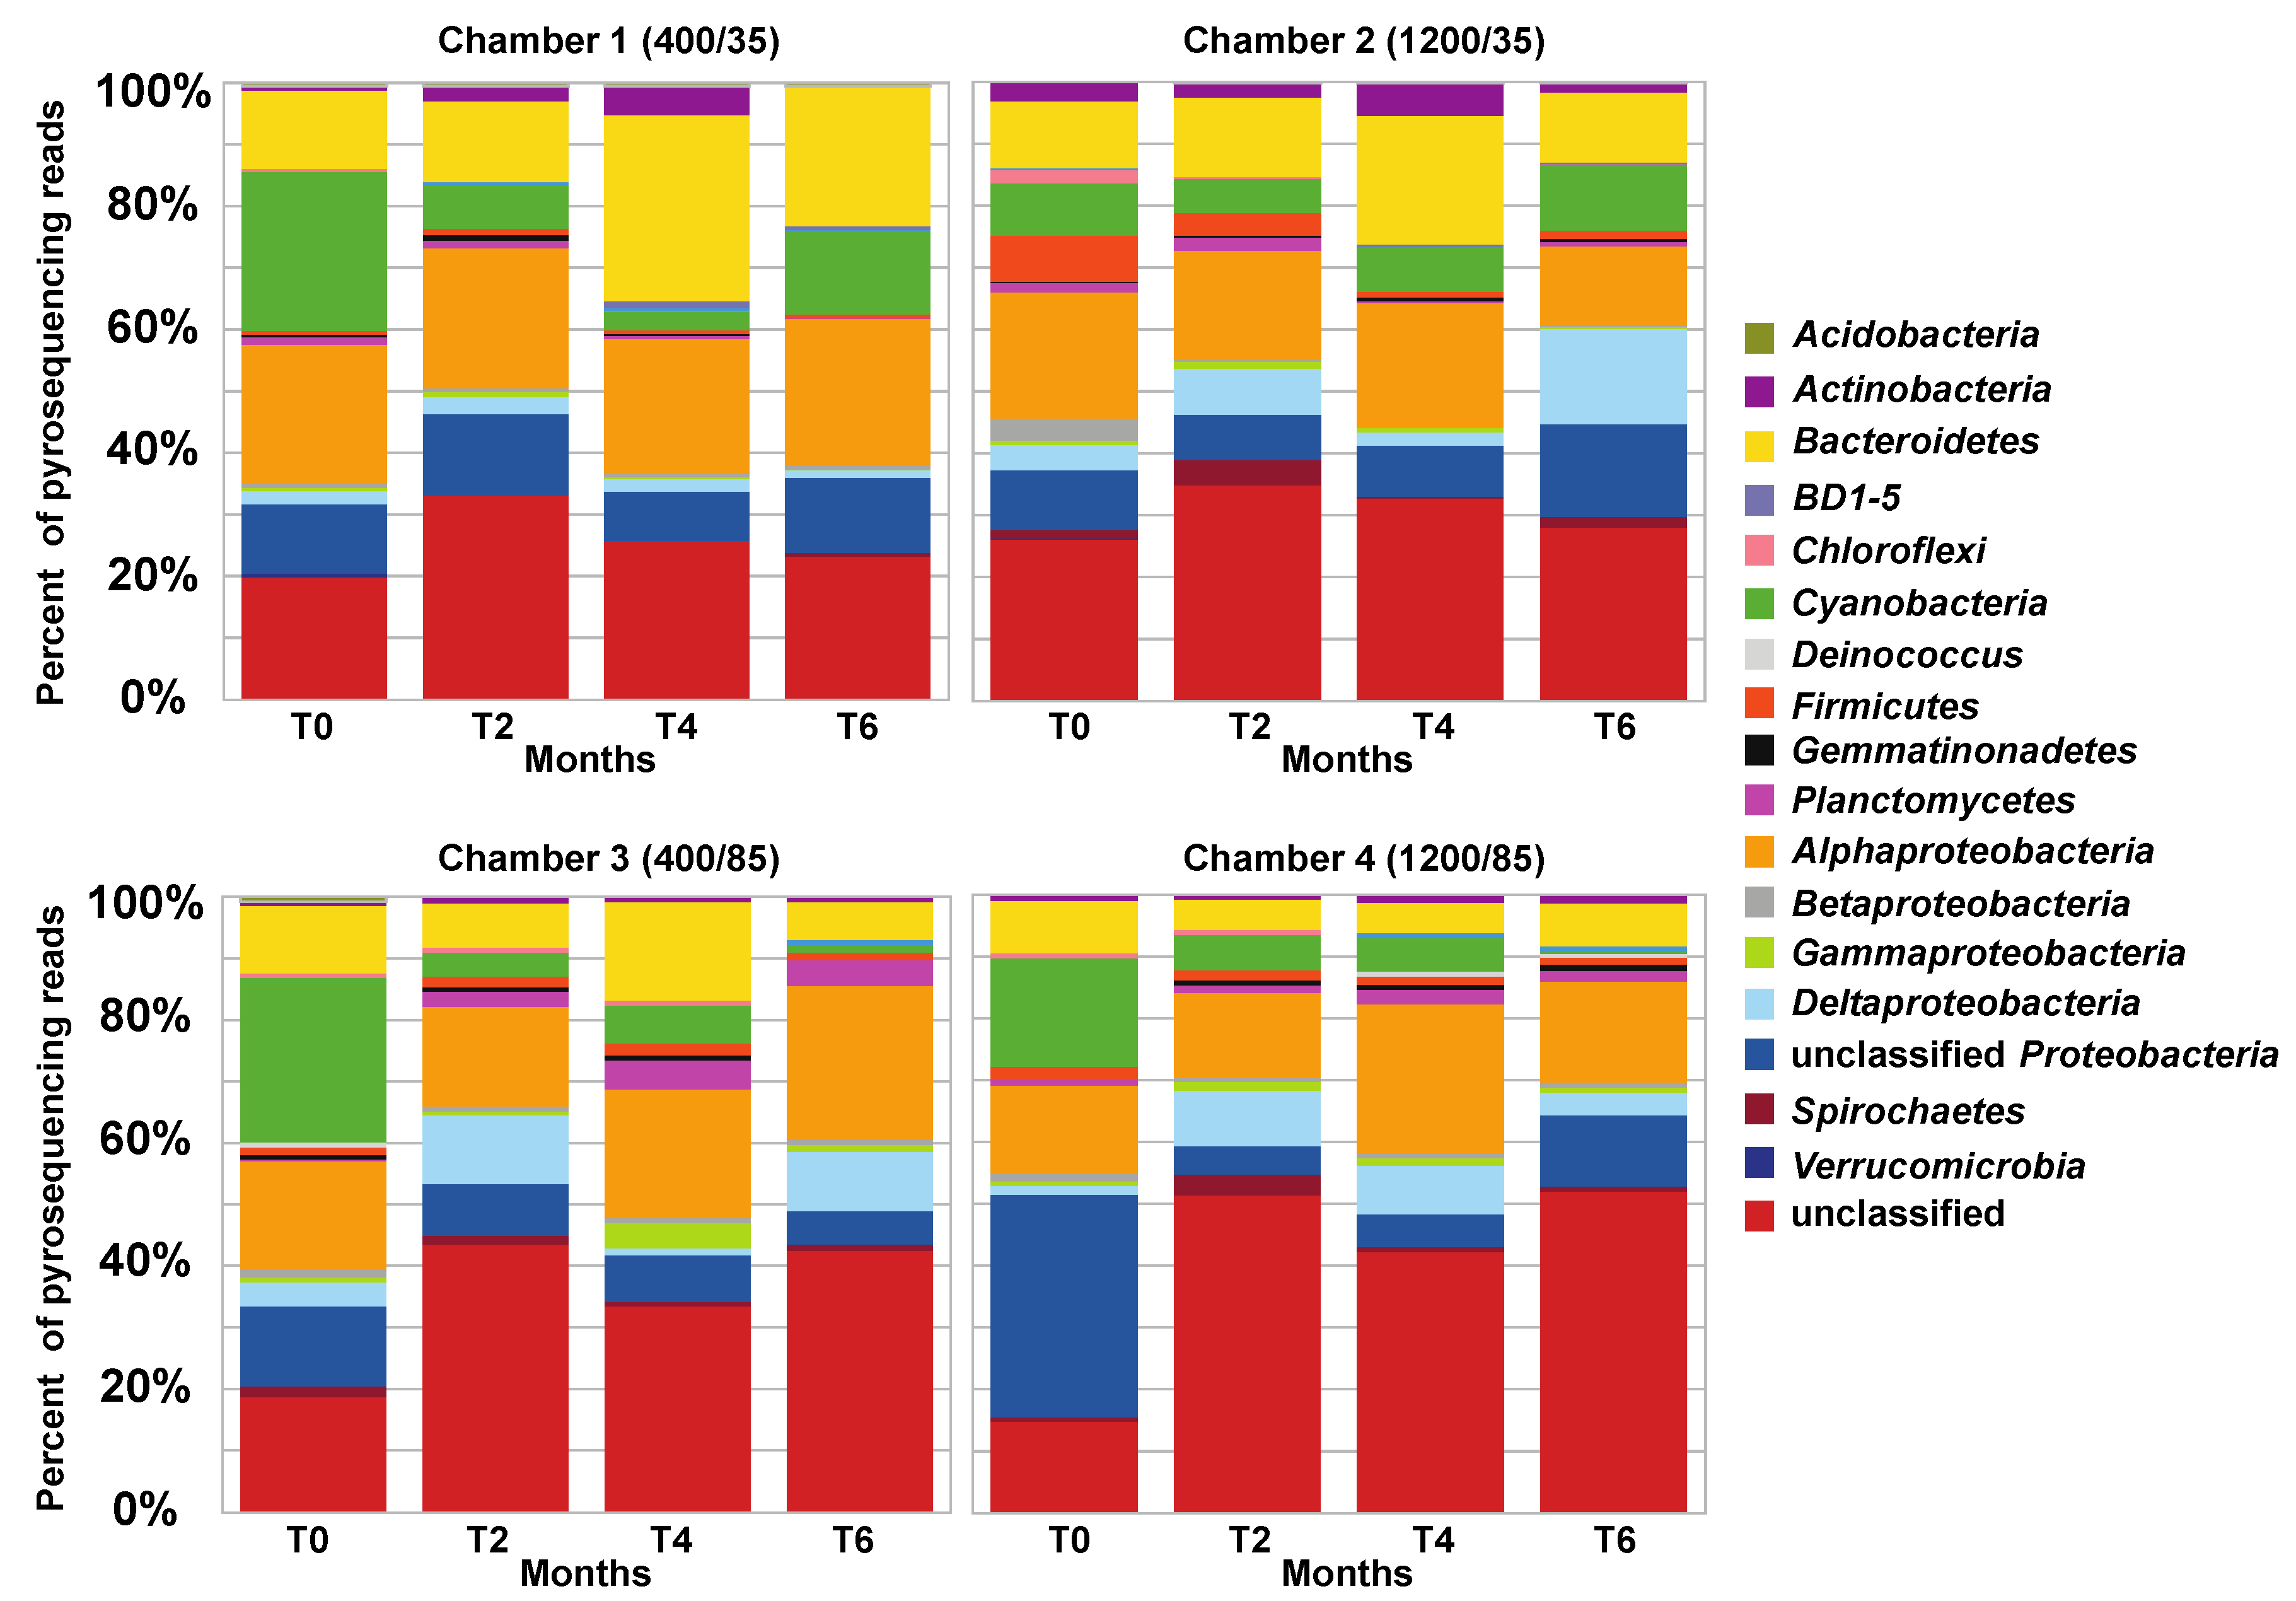
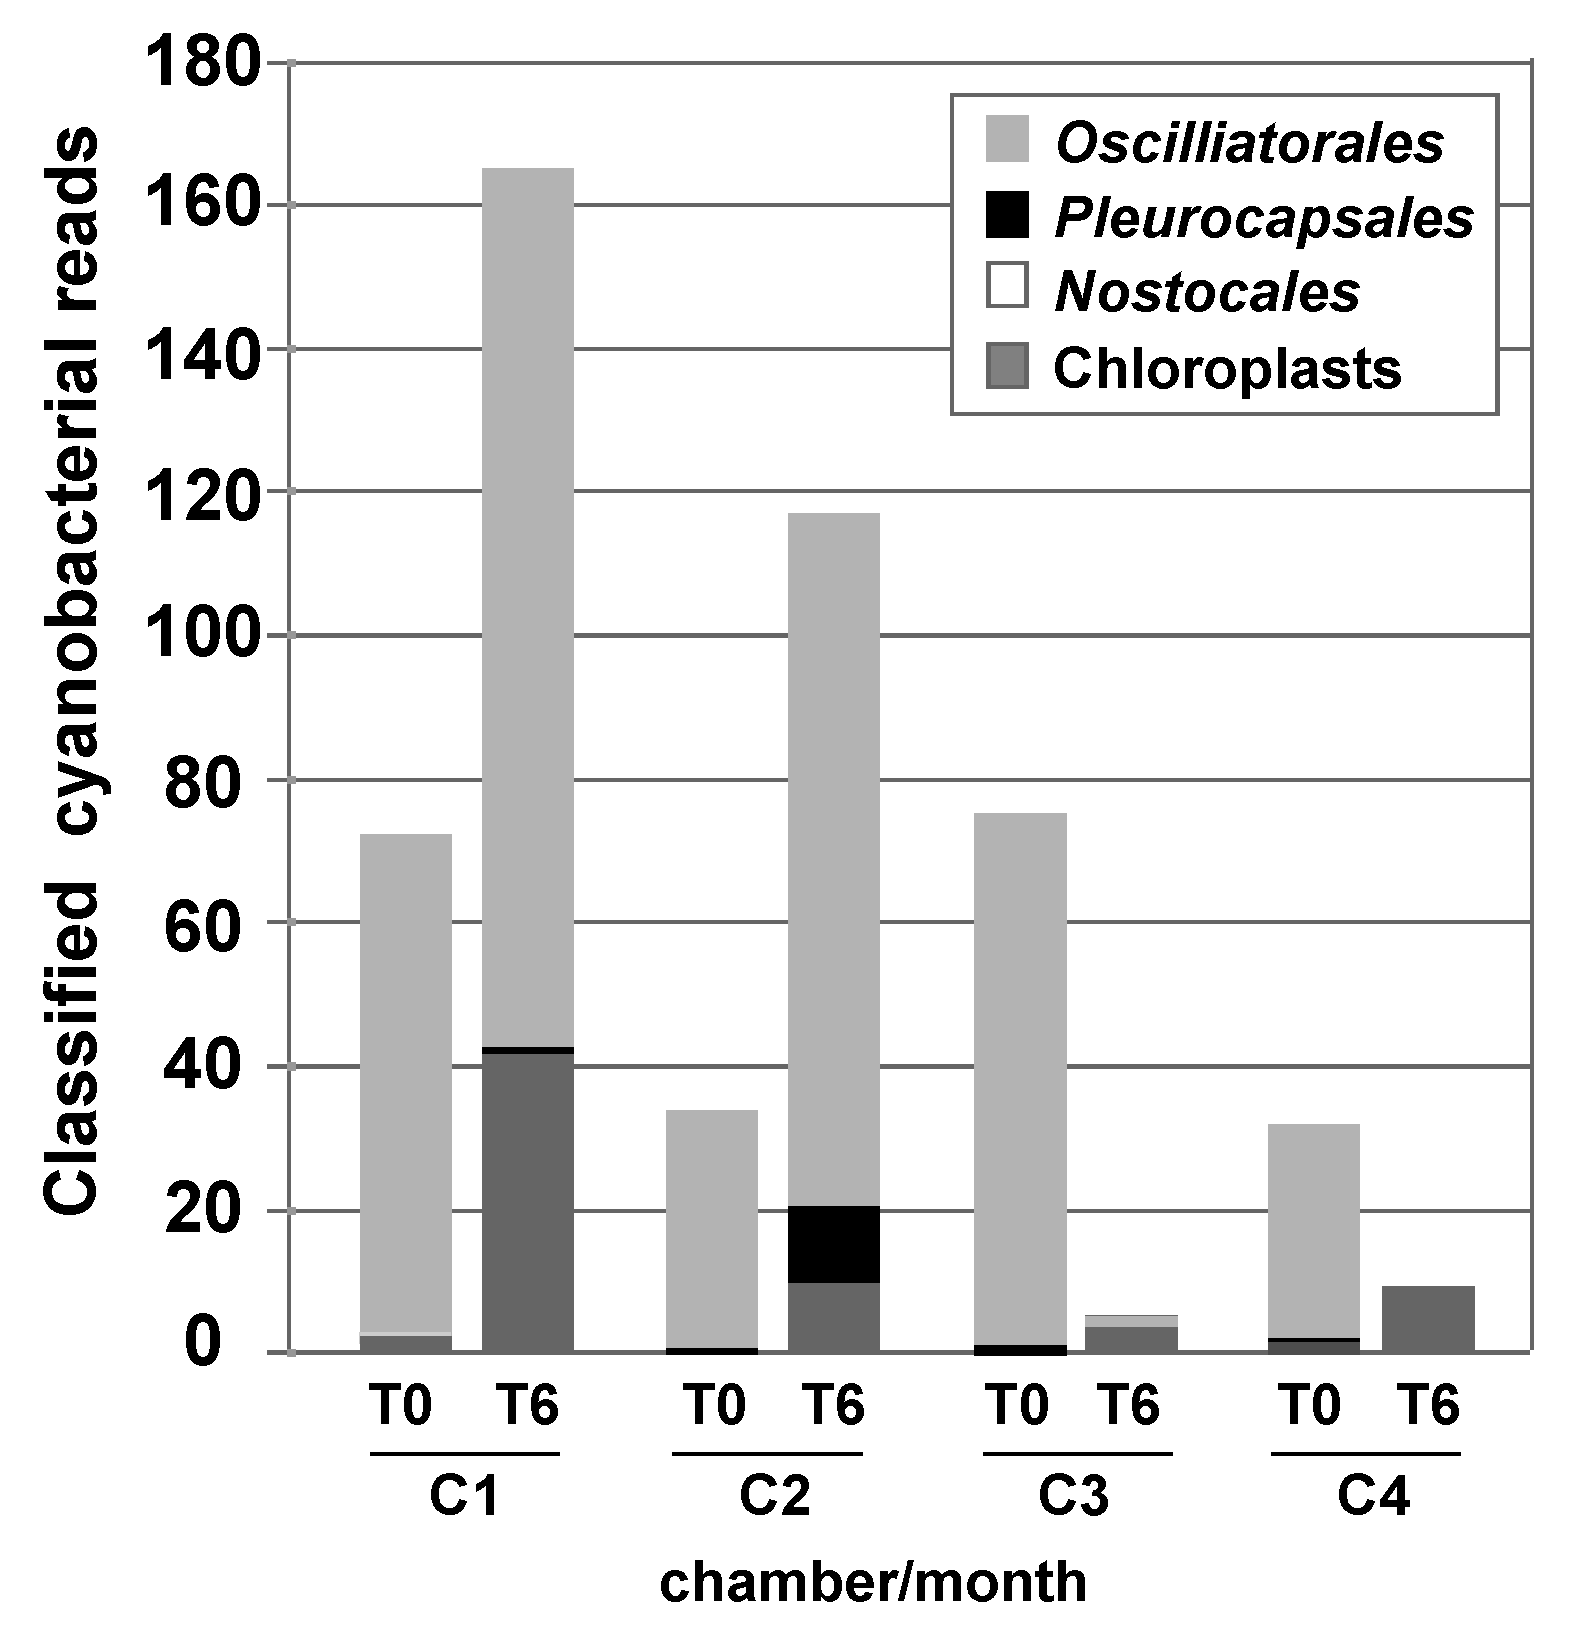
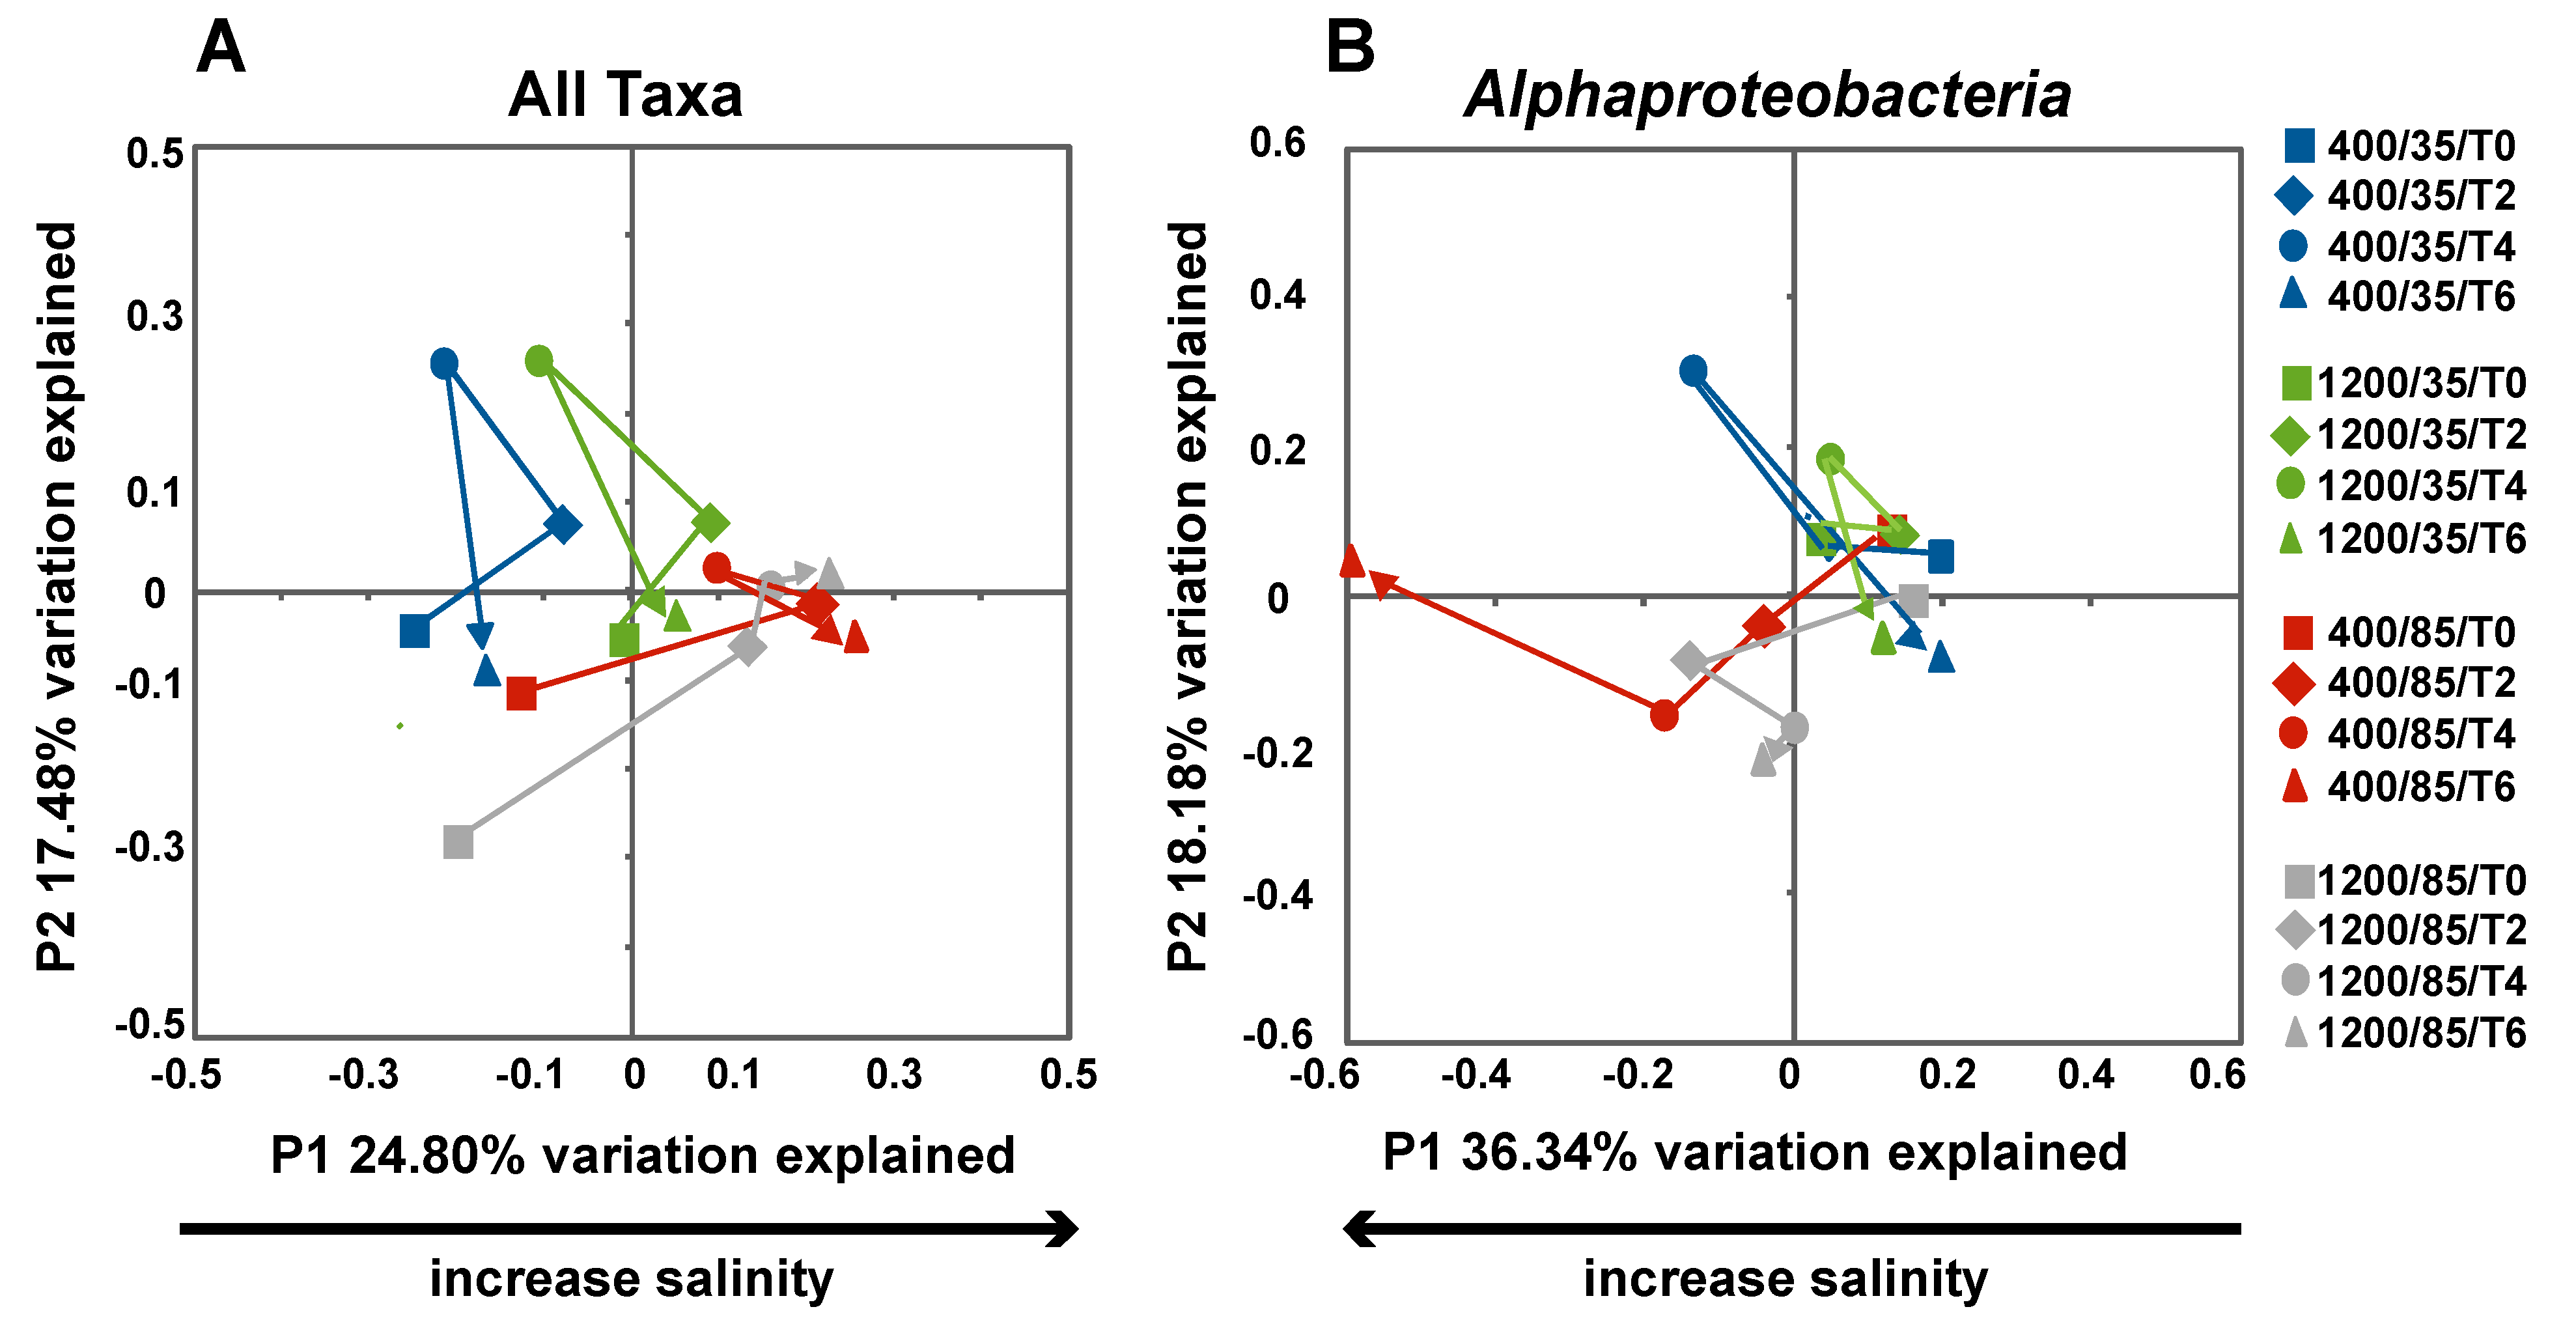
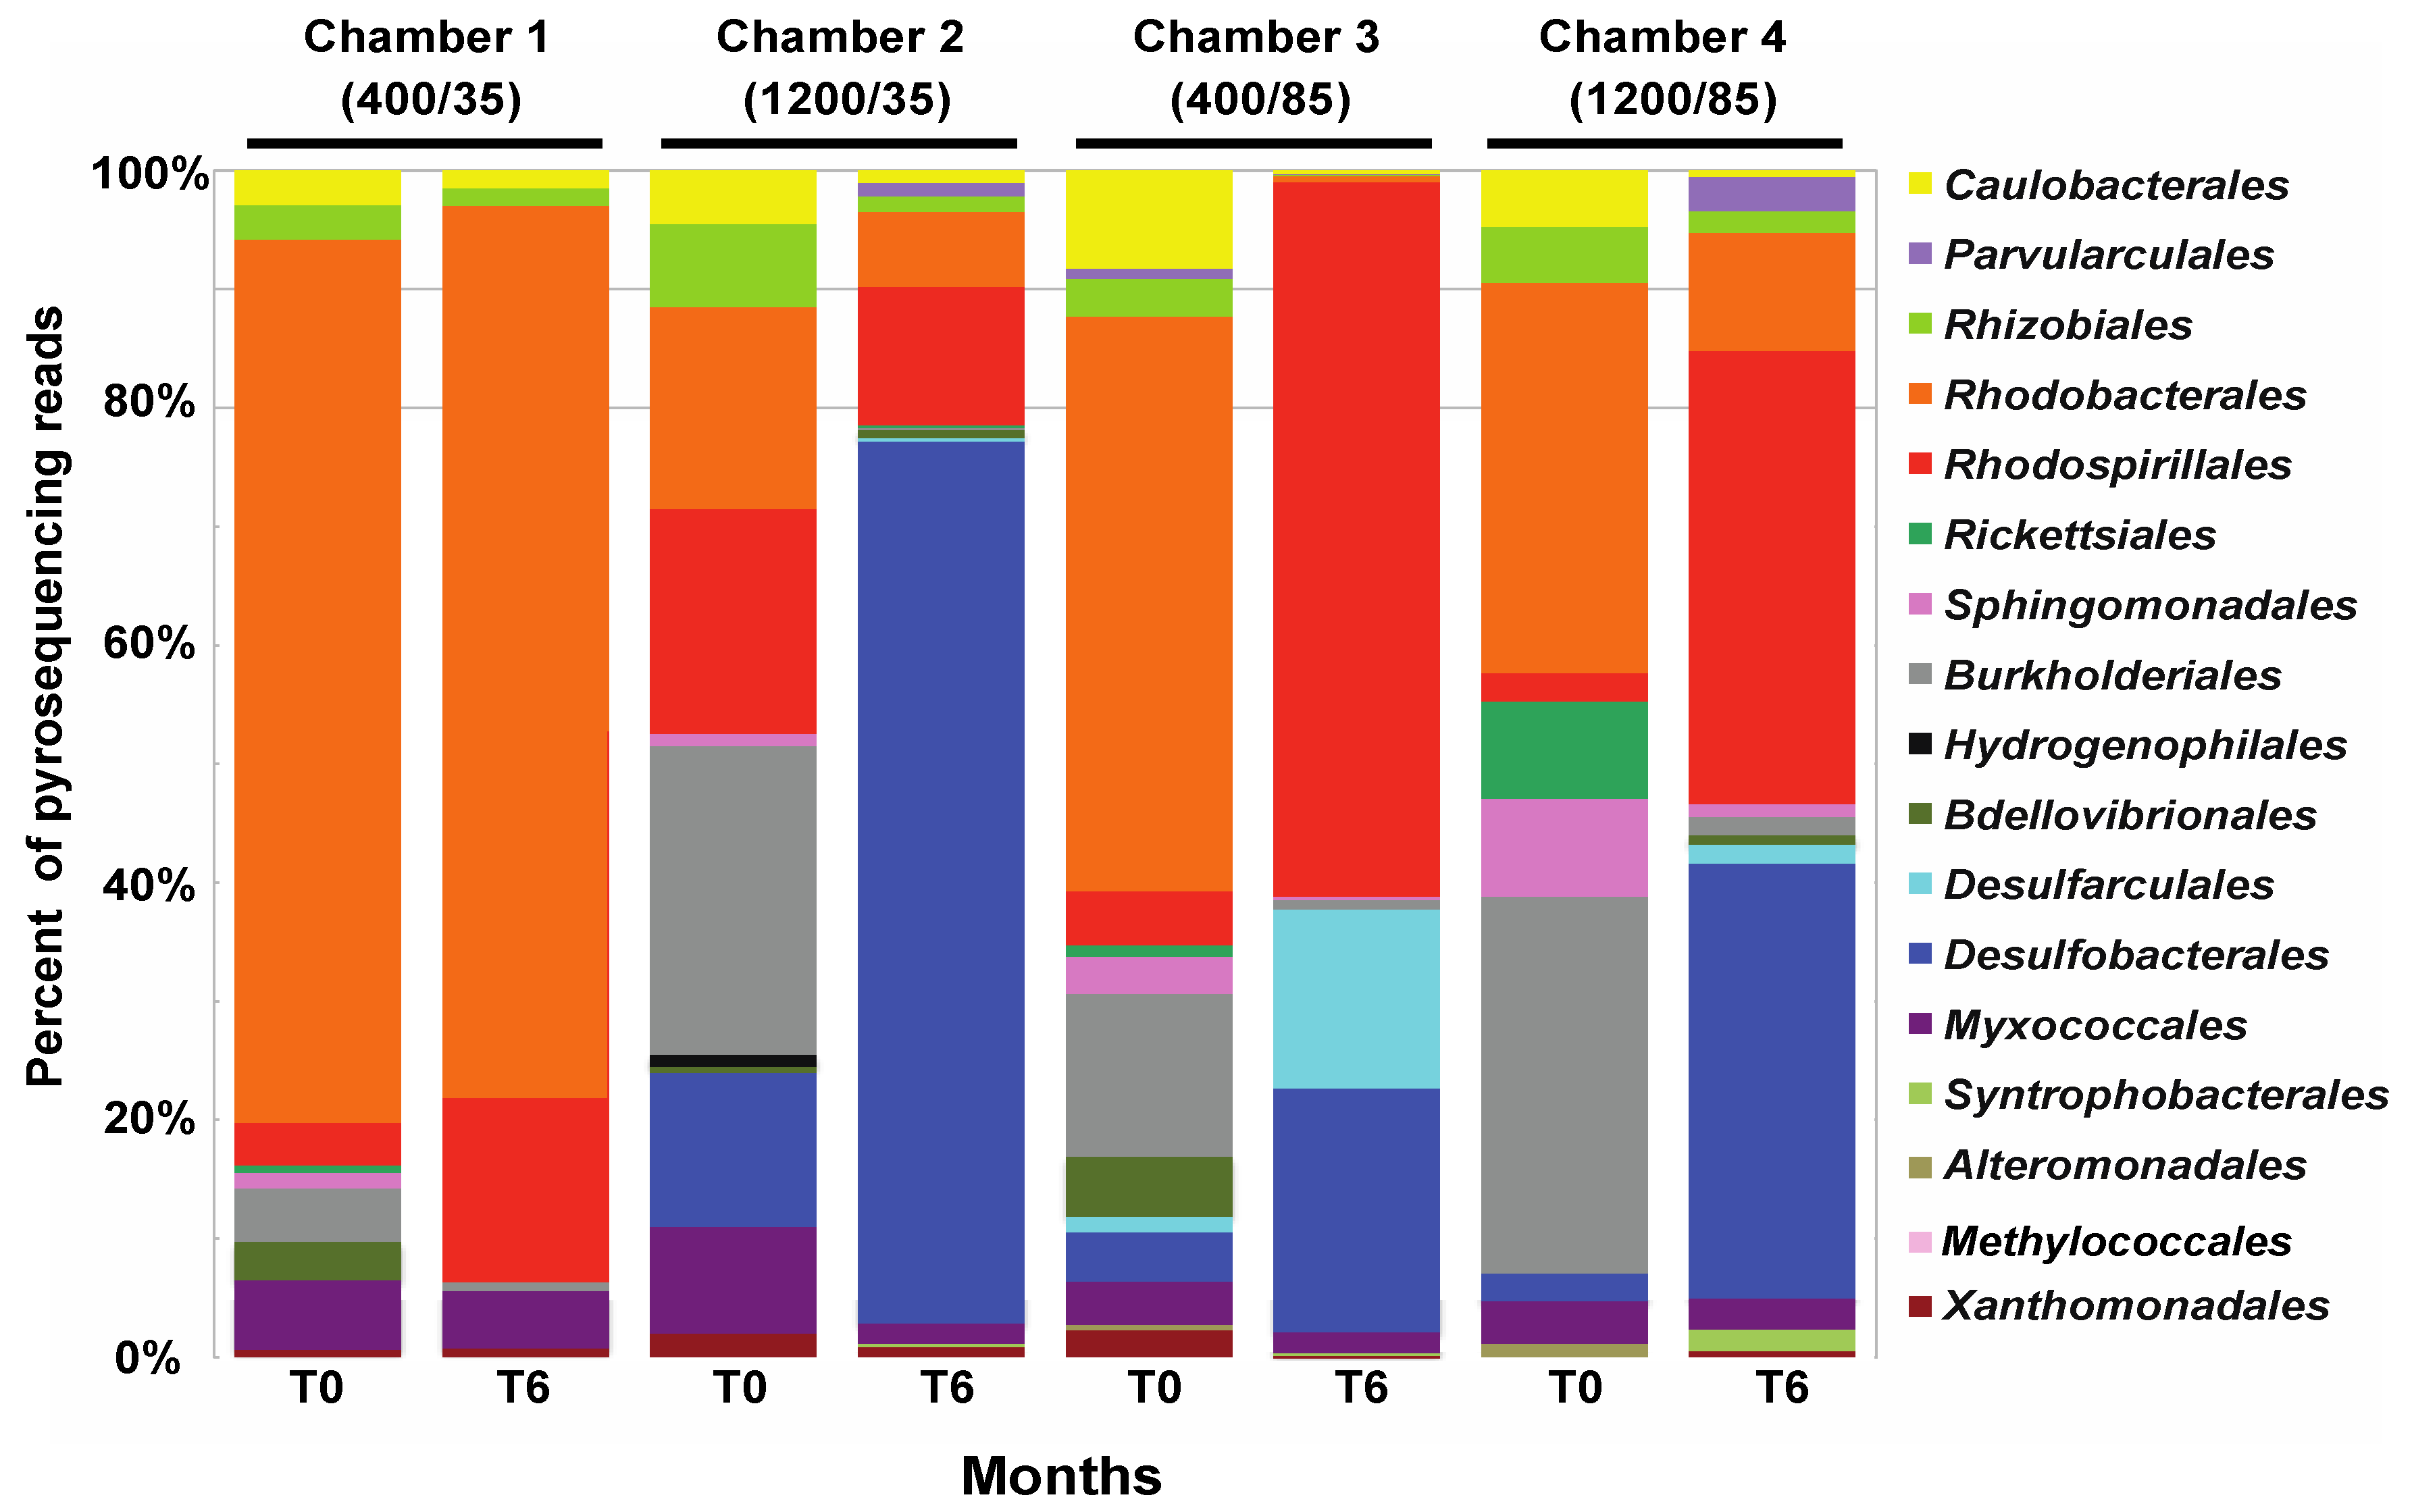
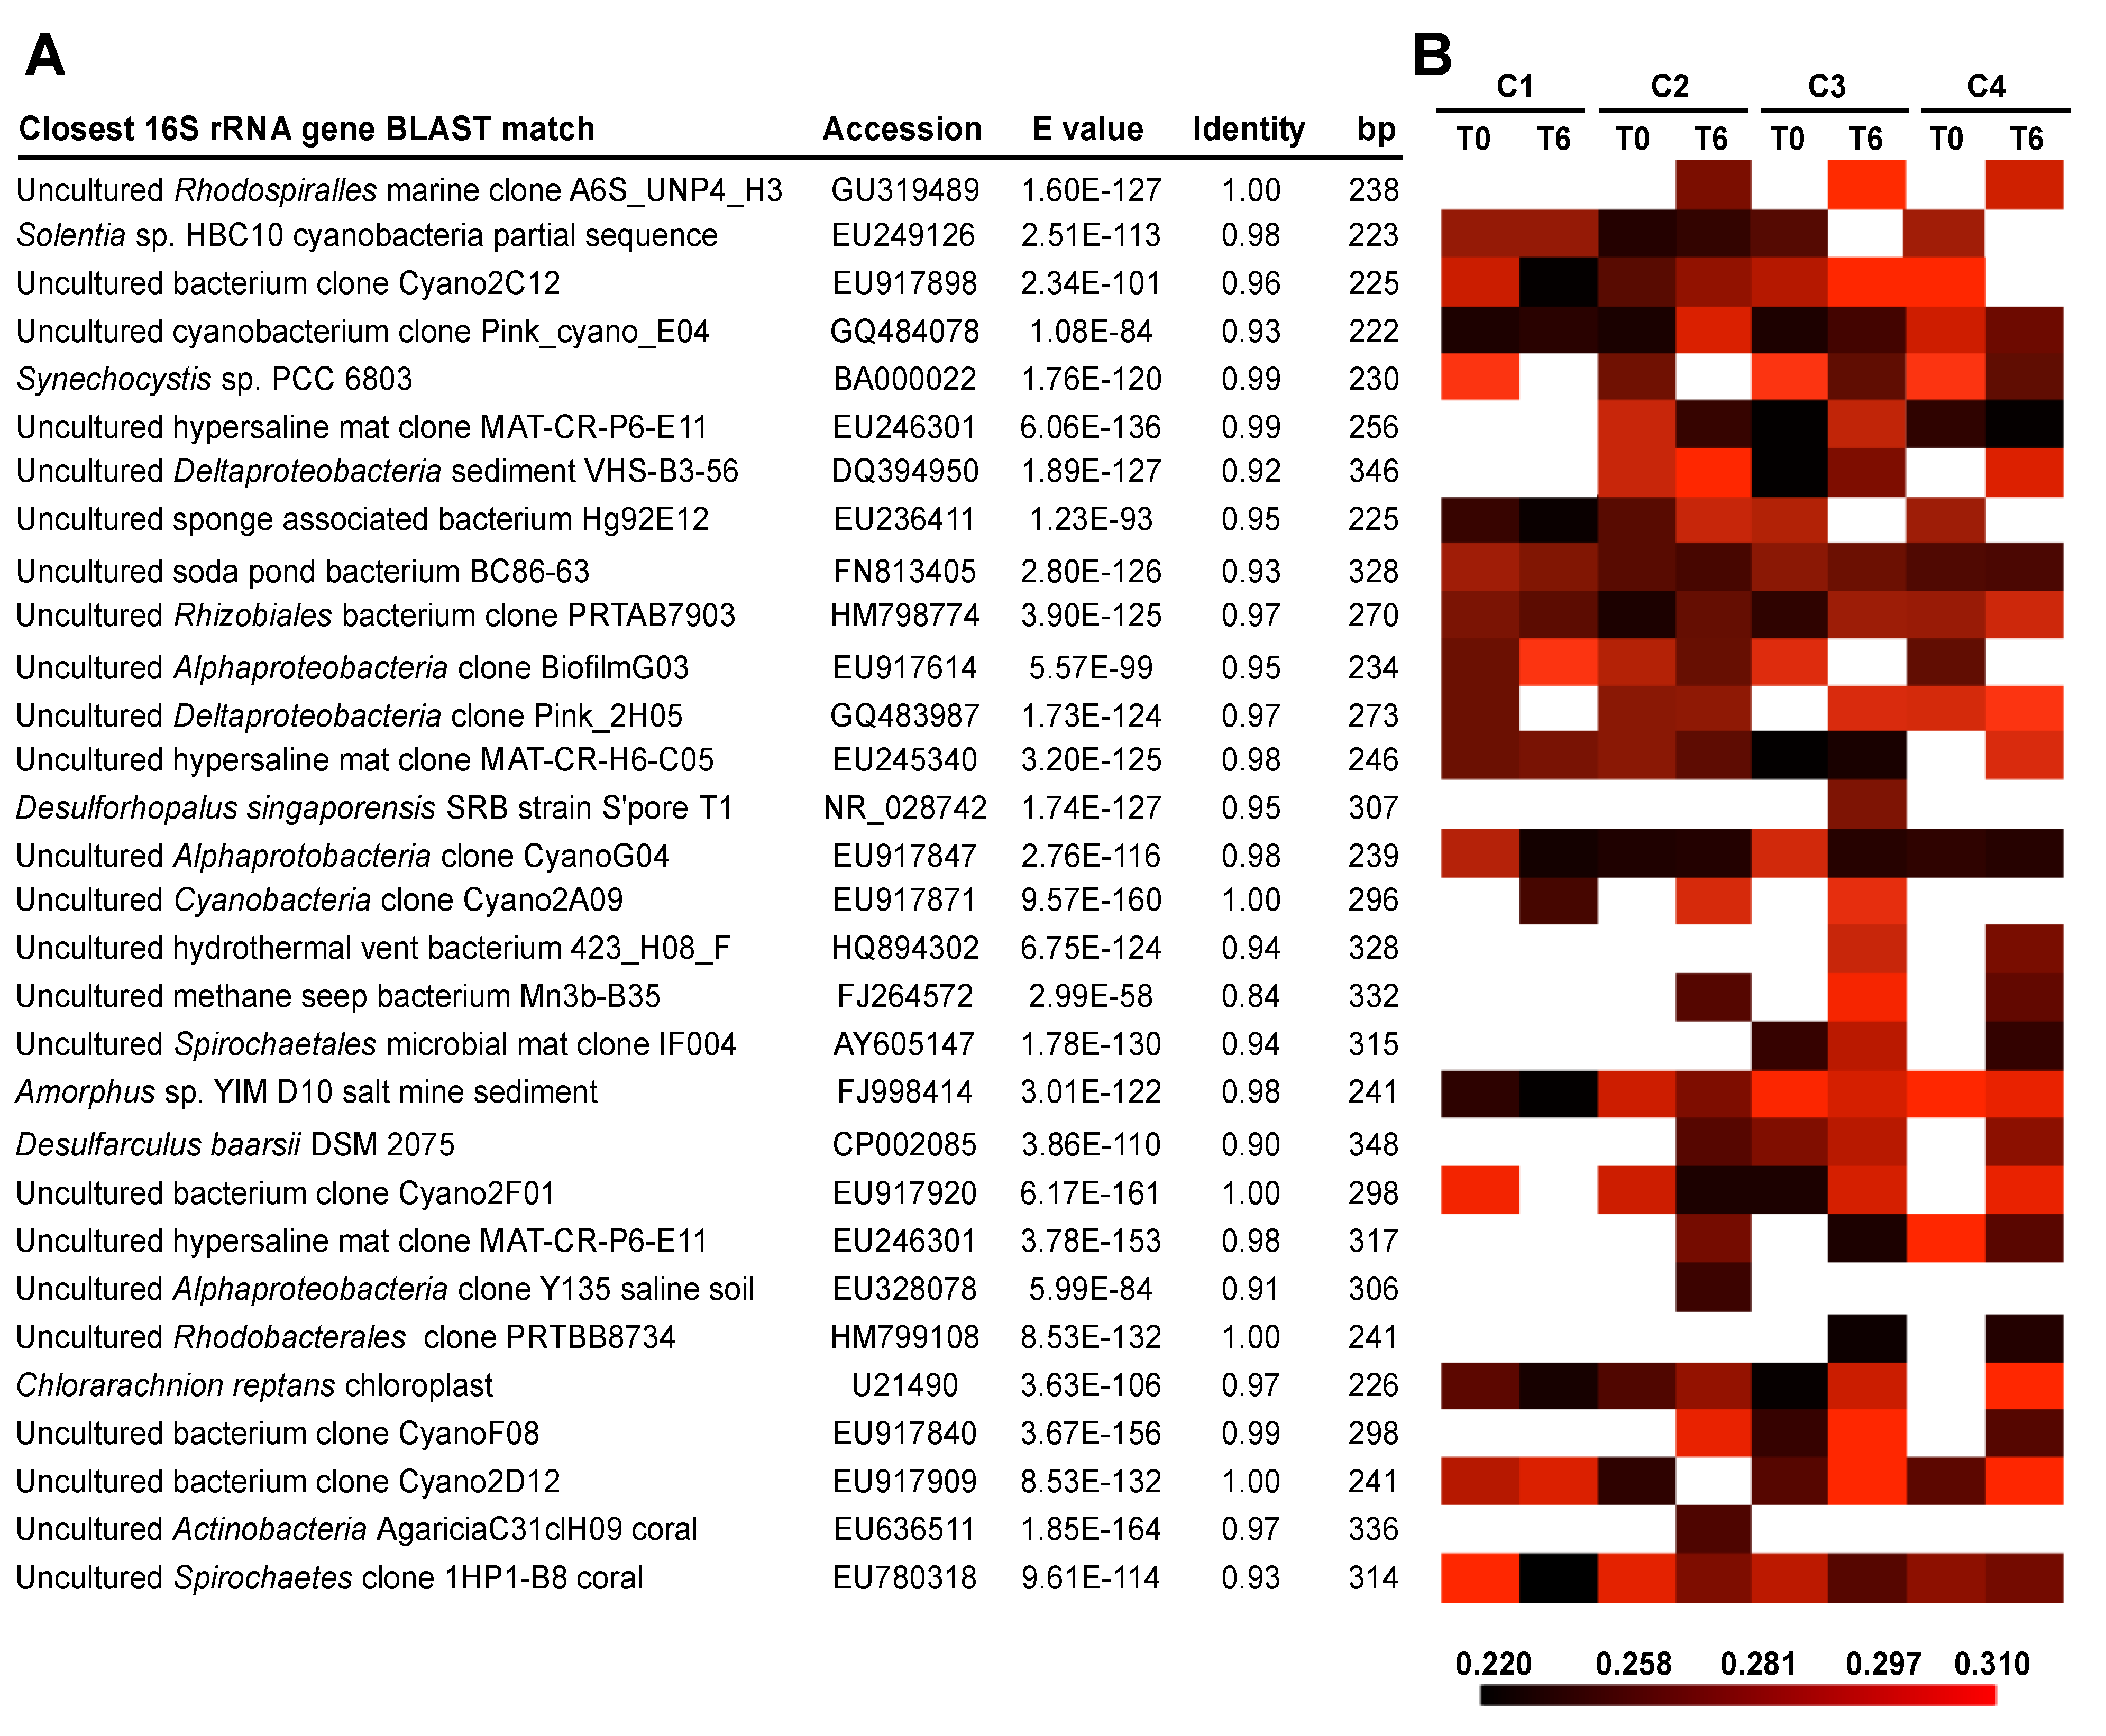
3.3. Effects of Environment on Microbialite Community Structure and Key Taxa

To assess the effects of elevated CO2 and salinity on the bacterial community structure of the mats, sequences recovered from all 16 libraries were compared using Fast UniFrac [43,44]. A principle coordinate analysis plot was generated from weighted and normalized Fast UniFrac data and visualized in Figure 5. Results indicated that salinity had a more profound impact on the microbial mat community than the elevated CO2 and accounted for approximately 24.80% of the variation for all reads (Figure 5A). The shift in population in response to salinity occurred within the first two months of the experiment as those sequences derived from elevated salinity mat samples at T2, T4, and T6 appear clustered together. Elevated CO2 (1200 ppmv) appeared to have little effect on the mat communities after a six-month incubation.
Figure 4. Comparisons of dominant proteobacterial lineages based on OTU analyses in microbialite treatments at 0 (T0) and 6 (T6) months. The histograms represent the percent of classified sequences that could be assigned to an order by a Bayesian approach at a confidence interval ≥ 70% against the SILVA SSU REF v102 database. The environmental parameters within each environmental chamber are listed in parentheses and include the CO2 and salinity levels, respectively.
Minerals 04 00145 g004
To assess whether certain taxa were also impacted by changes in CO2 and salinity we isolated sequences associated with Alphaproteobacteria and Deltaproteobacteria, and compared the overall changes. When only Alphaproteobacteria reads were considered 36.34% of the variation could be explained by the increase in salinity resulting a visible shift under elevated salinity conditions (Figure 5B), however, but no apparent change in response to elevated CO2. When all deltaproteobacterial sequences were considered this subphylum showed only a modest shift in response to both elevated CO2 and salinity compared to control mats (data not shown). Similar results were found when Actinobacteria, Bacteroidetes, and Cyanobacteria were each examined independently (data not shown).
To complement the Fast UniFrac analysis we also examined those OTUs that comprised > 1% of the total population (Table 2) and monitored changes in their relative abundance over time (Figure 6). Of the 30 most abundant OTUs recovered from the mat communities almost half (n = 13) shared sequence similarity to ecotypes known to associate with lithifying and hypersaline microbial mats. The remaining recovered OTUs shared sequence similarity to organisms associated with corals, salt mines, methane seeps and saline soils (Figure 6). As in the FastUnifrac analysis the relative abundance for the several of the sequences increased under elevated salinity (85‰) especially those sequences with similarity to hypersaline mat communities. The diversity of these enriched ecotypes was widespread and shared similarity to Rhodospiralles, Rhizobiales, sulfate-reducing Deltaproteobacteria, and Cyanobacteria. Of the dominant ecotypes two appeared to be negatively impacted by salinity: one that has similarity to an euendolithic cyanobacterium Solentia sp., which is an important carbonate precipitating organism in Highborne Cay stromatolites [29,48]; and the other shared similarity to a sponge isolate. Only four of the top 30 OTUs increased in relative abundance under elevated CO2. Three of these sequences shared similarity to unclassified cyanobacterial clones recovered from Highborne Cay microbialites, and the fourth to a Proteobacteria clone associated with a marine sponge.
Figure 5. Principal coordinate analysis of bacterial 16S rRNA gene libraries for the 16 lithifying mat libraries using Fast UniFrac. (A) Analysis of all sequencing reads recovered from the microbialites. Plot of the first two principal coordinate axes, which represent 24.80% (P1) and 17.48% (P2) of the variations detected between treatments; (B) Plot of first two principal coordinate axes generated from Fast UniFrac analysis of only the Alphaproteobacteria reads. Axes represent 36.34% (P1) and 18.18% (P2) of the variation between mat samples. Symbols represent bacterial sequences from each mat library with squares representing samples taken at time 0 months (T0); diamonds, 2 months (T2); circles, 4 months (T4); and triangles, 6 months (T6). Color of symbols reflect the environmental treatment: blue (400 ppmv CO2, 35‰ salinity); green (1200 ppmv CO2, 35‰); red (400 ppmv CO2, 85‰); and grey (1200 ppmv CO2, 85‰). Colored arrows within indicate changes in community structure over time.
Minerals 04 00145 g005
Lastly, we compared the overall morphology of the communities, as well as looked for presence or absence of carbonate precipitation within the microbialites at the end of the six-month incubation. Microscopic analysis showed a distinctive difference in the overall morphology of the microbialites at the end of the experiment (Figure 7). The control mats (Figure 7A) retained the three dominant layers characteristic of the laboratory cultivated microbialites including an EPS-rich biofilm layer, a cyanobacteria layer and a micritic crust layer comprised of fused sand grains with extensive colonization of the euendolithic Solentia spp. On the surface of those microbialites exposed to elevated CO2 (Chamber 2), there was a pronounced photosynthetic layer composed of primarily of Pleurocapsa-like coccoid cyanobacteria. There was very little EPS-rich biofilm on the surface of these microbialites, however, there was a pronounced crust layer of calcium carbonate-fused sand grains underneath the cyanobacteria layer as visualized by light microscopy (Figure 7B). In those mats exposed to elevated salinity (Chambers 3 and 4), there was a dramatic shift in the morphology of the mat including a thickening of the biofilm layer and absence of the cyanobacterial layer (Figure 7C,D). Individual ooid sand grains punctuated the biofilm layer due to the monthly addition of sterile ooids, but these grains did not form a fused micritic layer within the EPS-rich material. In both cases, however, a crust layer was visible with microscopy underneath the EPS-rich layer ranging in thickness of between 1 and 2.5 mm.
Figure 6. Changes in bacterial diversity of microbialites under elevated CO2 and salinity treatments. (A) Basic Local Alignment Search Tool (BLAST) analysis of OTUs that represent >1% of total recovered 16S rRNA gene pyrosequencing reads; (B) Heatmap depicting changes in relative abundance during CO2 and salinity manipulations at 0 (T0) and 6 (T6) months. Legend in lower right corner reflects colors associated with the relative abundance for each OTU within each treatment scaled at a log10 abundance value. White blocks indicate that an OTU was not found in a treatment. The environmental treatments include: C1, 400 ppmv CO2 and 35‰ salinity; C2, 1200 ppmv CO2 and 35‰ salinity; C3, 400 ppmv CO2 and 85‰ salinity; and C4, 1200 ppmv CO2 and 85‰ salinity.
Minerals 04 00145 g006
Figure 7. Morphological characterization of microbialites after six-month incubation. Each light-level micrograph depicts a cross section of the microbialites. (A) Microbialites incubated under ambient environmental conditions for the duration of the six month incubation retain the three primary layers: EPS-rich biofilm (b), cyanobacterial (cy) and fused ooid crust (cr); (B) Microbialites incubated under elevated CO2 levels have a pronounced cyanobacterial (cy) layer overlaying a micritic crust (cr) layer; (C,D) Microbialites incubated under elevated salinity have no visible cyanobacterial layer and a pronounced caramel colored EPS-rich biofilm (b) layer overlaying a micritic crust (cr). The environmental parameters within each environmental treatment are listed in the lower left corner and include the CO2 and salinity levels, respectively.
Minerals 04 00145 g007

4. Discussion

The results of this study provided evidence that (i) CO2 levels three times that of current ambient conditions did not significantly alter the overall bacterial diversity associated with carbonate-depositing microbial mats over a period of six months, however, a few key taxa were enriched, (ii) elevated CO2 caused a transient drop in pH in the surrounding water of the microbialites, which then increased within the first two months of the environmental manipulation, and (iii) an increase in seawater salinity caused a change in the mat morphology and a pronounced shift in the microbialite community structure.

4.1. Changes in Microbial Diversity in Response to Elevated CO2 and Salinity

A comparison of the alpha-diversity indices of mat communities revealed no changes to the mat populations when exposed to CO2 levels three times that of current levels (Table 2). Although the number of recovered OTUs in Chamber 2 increased at T6 this is likely due the increase in recovery of high quality sequences from this treatment. When a normalized sequence data set was used for analysis there was no significant differences in diversity richness and relative abundance as determined by the Shannon indices and evenness, respectively (Table 2). These results were similar to the taxonomic analyses of the mat sequences where the relative proportions of phyla were comparable between ambient and elevated CO2 treatments throughout the six-month manipulation (Figure 3). Similar results have been observed in terrestrial soil communities. In experimental grassland plots exposed to 650 ppmv of CO2 there was no detectable increase in the species richness of the communities even after five years of exposure [49], although increases in biomass have been frequently observed and may be the result of increase carbon sequestration in the soils [50,51,52].
The lack of change in the overall microbial diversity of the microbialites may also reflect the adaptive nature of these communities to environmental perturbations, including atmospheric CO2. Fossil evidence indicates that microbialites have been present on Earth for billions of years [9,10] and in the past few hundred millions have experienced a wide range of CO2 fluctuation from current levels to upwards 25 times present atmospheric levels during the early Cambrian (542 Ma) [53,54]. In mats and microbialites dominated by cyanobacteria these communities have adapted to these fluctuating CO2 levels through the regulation of CO2-concentrating mechanisms, which are present in all cyanobacteria [54,55]. Microbialites often are the first post-mass extinction ecosystems observed in the fossil record [56]. The results of this study suggest that an increase to 1200 ppmv is not high enough to profoundly alter the community composition in the lithifying mats, however, additional manipulations are needed to assess whether higher CO2 levels, such as those associated with past climate change, can significantly alter microbialite community structure [57].
Although there were no overall changes to the species richness under elevated CO2 during the six month period of our experiment, there were enrichments of key taxa most notably sulfate-reducing bacteria associated with the order Desulfobacterales. Organic carbon is generated through photosynthesis via the fixation of CO2, causing a shift in carbonate equilibrium (i.e., dissociation of HCO3 to CO2 and OH). This results in an increase in carbonate alkalinity, which in the presence of free Ca2+ results in the precipitation of CaCO3 [58,59]. In microbial mats a large fraction of the photosynthetically-fixed organic carbon is terminally oxidized anaerobically producing bicarbonate (HCO3). This also increases carbonate alkalinity favoring CaCO3 precipitation. A recent study in hypersaline mats of Guerrero Negro, Mexico, estimated that nearly all the photosynthetically-fixed CO2 was excreted as fermentation products during nighttime by cyanobacteria and that sulfate reducing bacteria consumed virtually all of this carbon and H2 [60]. In microbialites, sulfate reduction has been directly correlated to CaCO3 precipitation and the formation of micritic crusts [15,58]. Previous studies have calculated that in microbialites between 49% and 63% of the total organic carbon is mineralized through sulfate reduction indicating that this metabolism is a dominant process in lithifying mats [15]. The persistence of a carbonate crust under elevated CO2 conditions and the enrichment of Desulfobacterales under elevated CO2 may reflect the increased availability of organic carbon under elevated CO2 for sulfate reduction. Recent studies [61,62] demonstrated that the type of organic carbon metabolized by sulfate-reducing bacteria impacts the pH; modeling and culture experiments revealed that oxidation of some electron donors (i.e., formate, H2) increased the pH, while others (i.e., lactate, ethanol) decreased the pH. A variety of different fermentation products have been found in cyanobacteria [63] and a shift in community metabolism, especially in fermentation pathways of the cyanobacteria, could have accounted for the drop in pH followed by an increase observed in the current study. Additionally, a shift of community metabolism to favor H2, formate, acetate and glycolate production could result in an increase in diversity and abundance of sulfate-reducing bacteria, accompanied by a slight increase in pH resulting from the metabolism of the anaerobic heterotrophs [62]. An argument based on modeling efforts was made that shifts in fermentation patterns would not affect the lithification potential [64,65] and further investigations are needed. Similar increases in sulfate-reducing Desulfobacterales have been seen in atmospheric manipulations of soils. In two independent experiments where soils were exposed to CO2 flux conditions Deltaproteobacteria, specifically the Desulfobacterales were enriched under high CO2 [66,67]. Precipitation of calcium carbonate was shown on extracellular nanoglobules produced by Desulfonatronum lacustre in laboratory experiments [68] and sulfate-reducing bacteria cell surfaces have been shown to promote carbonate precipitation as well. [69]. Therefore, an increase in sulfate-reducing bacteria diversity and/or abundance may increase the microbial mat lithification potential. Clearly, microbial mats and microbialites are complex ecosystems in which the entire community determines the CaCO3 precipitation potential [11,15,16,62].

4.2. Changes in pH During Environmental Manipulations and Impact on Community

The absorption of anthropogenic CO2 by the oceans has been identified as a major cause for the recent reduction in global pH, increased levels of dissolved inorganic carbon (DIC) and lowered CaCO3 saturation rates [8,70,71,72]. However, the impact of ocean acidification and shifts in carbonate chemistry on marine microbial ecosystems is complicated by the fact that many marine microbial communities, including lithifying mats, already experience localized pH fluctuations [2,15,47]. In the experimental manipulations of microbialites there was a pronounced drop in pH from pH 8.2 to 7.7 that occurred within the first week of exposure to 1200 ppmv CO2 levels. However, this decrease in pH was transient and the pH increased to 8.1 by week four (data not shown) resulting in a mean pH of 8.13 for the microbialites at 1200 ppmv CO2 (Table 1). As outlined above, this pattern can easily be attributed to changes in fermentation patterns yielding different organic substrates (e.g., organic acids) available to the sulfate-reducing population. This change could have a major impact on the CaCO3 precipitation by the microbial community [61,62]. These results suggest that although the microbial diversity did not profoundly change during the experiment, the metabolic activity of the mat community may have been impacted in response to elevated pCO2. Similar results have been seen in both natural and laboratory experiments where phytoplankton blooms occurred in response to increased levels of CO2 resulting in rapid (i.e., few days) increases in pH from 7.9 to 8.1 in mesocosm experiments [73] and 7.9–8.8 in natural Antarctic coastal waters [74]. In both cases the increase in pH was attributed to an increase in photosynthetic utilization of the dissolved CO2.
In the lithifying mats a similar process may be occurring where the synergism of both photosynthesis and sulfate reduction increases the carbonate deposition within the microbialites [12]. Together, the combined microbial community metabolisms drive the alkalinity engine, which subsequently generates microenvironments within the microbialites that facilitate carbonate precipitation [11]. In addition to the metabolisms that promote precipitation in lithifying mats have been shown to exhibit other metabolic activities, such as sulfide-oxidation, respiration and fermentation, which can lead to an increase in dissolved organic carbon and promote carbonate dissolution [16]. It is balance between all metabolic activities that impacts the net carbonate precipitation rate [12]. Therefore the results of the environmental manipulations in the microbialites, including the control mats, suggesting that in these 2.5-gallon aquarium environments there was a net increase in those metabolisms that promote precipitation, thus shifting the water towards an increased saturation index and elevated pH and maintaining the carbonate crust layer of the lithifying microbial mats. Future studies that examine the community metatranscriptome under rising CO2 levels are needed to determine whether the functional genes contained within the community are differentially regulated under the rising CO2 conditions, as well as activity measurements to determine if the metabolic activities (e.g., photosynthesis, aerobic and anaerobic heterotrophy, sulfide-oxidation) change or increase with rising pCO2.

4.3. Impact of Salinity on Microbialite Diversity

Analysis of the recovered microbialite sequences indicated that changes in salinity had a more profound influence on microbial diversity and community structure than exposures to 1200 ppmv of CO2. The impact of salinity on diversity and community structure of microbial mats has been known for several decades [23,25,75,76,77,78] and provided an ideal control group to compare the impact of different environmental factors on microbialites. An overall comparison of all taxa under ambient and elevated salinity conditions revealed a pronounced shift in the community structure as determined by Fast UniFrac (Figure 5). Even when individual phyla and subphyla (i.e., Actinobacteria, Bacteroidetes, Cyanobacteria, Deltaproteobacteria) were removed from the Fast UniFrac dataset (data not shown) the overall shift in the community structure in response to salinity was present indicating that salinity imposes a widespread affect on lithifying mat organisms. Of the many taxa to be impacted by the increase in salinity the Alphaproteobacteria showed a change in relative abundance of key taxa including an enrichment of Rhodospirillales (Figure 3), a group of purple-sulfur phototrophs that has been shown to be enriched in many hypersaline habitats [79,80].
Salinity has also been previously shown to significantly impact the metabolic activity of hypersaline mats under gradients and flux conditions [23,77,81]. Specifically, hypersalinity impedes rates of photosynthesis and nitrogen fixation and limits microbial uptake of dissolved organic carbon [23,82,83]. It is thought that these effects are due to changes in gas solubility of CO2 and increased diffusion barriers to the release of O2 under elevated salinity resulting in photooxidation in the mat, as O2 is a direct inhibitor of the carbon fixing enzyme RuBisCO [77]. In this study a similar phenomenon of decreased photosynthesis may be occurring in the microbialites under environmental change, which can be reflected in three lines of evidence. First, there was a decrease in recovered Cyanobacteria sequences from mats exposed to elevated salinity with a 15-fold drop in Chamber 3 (400 ppmv; 85‰) and a three-fold drop in Chamber 4 (1200 ppm; 85‰), coupled with the loss of a pronounced cyanobacterial layer in those mats exposed to elevated salinity (Figure 7). Second, although morphological analysis revealed a reduction of the cyanobacterial layer in the elevated saline treatments, there was, however, a distinctive increase in the thickness of the biofilm layer of the mats with an excess production of exopolymeric substances (EPS) compared to the control mat treatments (Figure 7). EPS production has been shown to be stimulated under high salt stress [84,85], which is a significant energetic exercise to those organisms producing it. A thicker or denser EPS matrix may influence the diffusion rates of biogeochemical molecules such as O2, Ca2+, Mg2+, which that may impact rates of carbonate precipitation [11,86]. In addition to cyanobacteria, sulfate-reducing could have produced a significant part of the EPS material. These organisms have been shown to produce copious amounts of EPS material, especially under hypersaline conditions [87]. Sequences recovered from microbialites exposed to elevated salinity also showed enrichments of taxa with high similarity to sulfate-reducing bacteria of the orders Desulfarculales and Desulfobacterales. The EPS generated by sulfate reducing bacteria have been shown to contain many negatively charged moieties with a high binding capacity for metals and a strong potential to exchange H+ and Ca2+ ions with the surrounding environment [87]. EPS content is an important factor to consider as it has been shown to have a significant impact on levels of free Ca2+ potentially altering CaCO3 precipitation rates (19). EPS isolated from sulfate-reducing bacteria has been shown to have a lower Ca2+ binding capacity under decreased pH (11). Lastly, the observed flux in pH also provided evidence that the lithifying microbial mat metabolism plays an important role in regulating and controlling the morphology and composition of the microbialite community structure under environmental change. This is due to the fact that under elevated CO2, there was a decrease in the mean pH in Chambers 3 (400 ppmv/85‰) and 4 (1200 ppmv/85‰) to 8.01 and 7.83, respectively. In Chamber 3 the decline was steady over the six-month period, whereas in Chamber 4 there was a sharp drop from pH 8.2 to 7.7 in the first two months then a graduate increase to only 7.8 over the last four months suggesting that the inhibition of key metabolisms such as photosynthesis under elevated salinity may impede the mats ability to respond or adapt to rising CO2 levels.

5. Conclusions

These results indicate that the microbial diversity and morphology of modern lithifying mat communities are robust and do not profoundly change in response to rapid changes in atmospheric CO2 and pH. The results also suggest these communities are potentially more ecologically resilient to the recent anthropogenic changes in climate than other marine ecosystems. The resiliency of these communities to rapid environmental changes may make these microbialites useful models for further experimentation to examine the molecular mechanisms by which the mats adapt to environmental change and to examine the impact of additional environmental factors. Rising CO2 and decreases in pH are just one aspect of climate and habitat change. Additional changes, such as temperature flux, are also important variables in understanding the response of carbonate-depositing microbial ecosystems to climate change [88]. Recent studies have shown that temperature is an important selection factor with regard to the type of surface community on open marine stromatolites [30]. Although temperature flux was beyond the scope of this pilot experiment, future studies can examine the synergistic effects that temperature, CO2 and pH can play on the formation and development of these lithifying mat communities. Together, these underlying mechanisms coupled with an understanding of the organisms that participate in these processes can improve our interpretation of the paleo record and potentially serve as proxies to delineate the microbial response to both past and future climate change.

Acknowledgments

This project was supported by the National Aeronautics and Space Administration (NASA) Florida Space Grant Consortium, University of Florida Innovation Award and the University of Florida’s Interdisciplinary Center for Biotechnology Research. A National Science Foundation Research Experiences for Undergraduates grant (NSF0649198) awarded to the University of Florida Department of Microbiology and Cell Science, University of Florida supported Steven Ahrendt.

Author Contributions

Jamie S. Foster designed the overall experimental concept. Steven R. Ahrendt, Jennifer M. Mobberley and Jamie S. Foster completed the 16S rRNA gene analysis. Pieter T. Visscher completed the microelectrode profiling. Lawrence L. Koss designed and constructed the environmental chamber system. All authors contributed in the preparation and writing of the manuscript.

Conflicts of Interest

The authors declare no conflict of interest.

References

  1. Kasting, J.F. Earth’s early atmosphere. Science 1993, 259, 920–926. [Google Scholar] [CrossRef]
  2. Joint, I.; Doney, S.C.; Karl, D.M. Will ocean acidification affect marine microbes? Int. Soc. Microb. Ecol. J. 2010, 5, 1–7. [Google Scholar]
  3. Azam, F. Microbial control of oceanic carbon flux: the plot thickens. Science 1998, 280, 694–696. [Google Scholar] [CrossRef]
  4. Falkowski, P.; Scholes, R.J.; Boyle, E.; Canadell, J.; Canfield, D.; Elser, J.; Gruber, N.; Hibbard, K.; Hogberg, P.; Linder, S.; et al. The global carbon cycle: A test of our knowledge of earth as a system. Science 2000, 290, 291–296. [Google Scholar] [CrossRef]
  5. Joos, F.; Plattner, G.K.; Stocker, T.F.; Marchal, O.; Schmittner, A. Global warming and marine carbon cycle feedbacks on future atmospheric CO2. Science 1999, 284, 464–467. [Google Scholar] [CrossRef]
  6. Post, W.M.; Izaurralde, R.C.; Jastrow, J.D.; McCarl, B.A.; Amonette, J.E.; Bailey, V.L.; Jardine, P.M.; West, T.O.; Zhou, J.Z. Enhancement of carbon sequestration in US soils. Bioscience 2004, 54, 895–908. [Google Scholar] [CrossRef]
  7. Hoegh-Guldberg, O.; Mumby, P.J.; Hooten, A.J.; Steneck, R.S.; Greenfield, P.; Gomez, E.; Harvell, C.D.; Sale, P.F.; Edwards, A.J.; Caldeira, K.; et al. Coral reefs under rapid climate change and ocean acidification. Science 2007, 318, 1737–1742. [Google Scholar] [CrossRef]
  8. Orr, J.C.; Fabry, V.J.; Aumont, O.; Bopp, L.; Doney, S.C.; Feely, R.A.; Gnanadesikan, A.; Gruber, N.; Ishida, A.; Joos, F.; et al. Anthropogenic ocean acidification over the twenty-first century and its impact on calcifying organisms. Nature 2005, 437, 681–686. [Google Scholar] [CrossRef] [Green Version]
  9. Burne, R.V.; Moore, L.S. Microbialites: Organosedimentary deposits of benthic microbial communities. Palaios 1987, 2, 241–254. [Google Scholar] [CrossRef]
  10. Grotzinger, J.P.; Knoll, A.H. Stromatolites in Precambrian carbonates: Evolutionary mileposts or environmental dipsticks? Annu. Rev. Earth Planet. Sci. 1999, 27, 313–358. [Google Scholar] [CrossRef]
  11. Dupraz, C.; Visscher, P.T. Microbial lithification in marine stromatolites and hypersaline mats. Trends Microbiol. 2005, 13, 429–438. [Google Scholar] [CrossRef]
  12. Dupraz, C.; Reid, R.P.; Braissant, O.; Decho, A.W.; Norman, R.S.; Visscher, P.T. Processes of carbonate precipitation in modern microbial mats. Earth Sci. Rev. 2009, 96, 141–162. [Google Scholar] [CrossRef]
  13. Visscher, P.T.; Van Gemerden, H. Sulfur Cycling in Laminated Marine Microbial Ecosystems. In Biogeochemistry of Global Change; Oremland, R.S., Ed.; Chapman and Hall: London, UK, 1993; pp. 672–690. [Google Scholar]
  14. Van Gemerden, H. Microbial mats: A joint venture. Mar. Geol. 1993, 113, 3–25. [Google Scholar] [CrossRef]
  15. Visscher, P.T.; Reid, R.P.; Bebout, B.M.; Hoeft, S.E.; Macintyre, I.G.; Thompson, J.A. Formation of lithified micritic laminae in modern marine stromatolites (Bahamas): The role of sulfur cycling. Am. Mineral. 1998, 83, 1482–1493. [Google Scholar]
  16. Visscher, P.T.; Stolz, J.F. Microbial mats as bioreactors: Populations, processes and products. Palaeogeogr. Palaeoclimatol. Palaeoecol. 2005, 219, 87–100. [Google Scholar] [CrossRef]
  17. Baumgartner, L.K.; Spear, J.R.; Buckley, D.H.; Pace, N.R.; Reid, R.P.; Visscher, P.T. Microbial diversity in modern marine stromatolites, Highborne Cay, Bahamas. Environ. Microbiol. 2009, 11, 2710–2719. [Google Scholar] [CrossRef]
  18. Foster, J.S.; Green, S.J.; Ahrendt, S.R.; Hetherington, K.L.; Golubic, S.; Reid, R.P.; Bebout, L. Molecular and morphological characterization of cyanobacterial diversity in the marine stromatolites of Highborne Cay, Bahamas. Int. Soc. Microb. Ecol. J. 2009, 3, 573–587. [Google Scholar]
  19. Mobberley, J.M.; Ortega, M.C.; Foster, J.S. Comparative microbial diversity analyses of modern marine thrombolitic mats by barcoded pyrosequencing. Environ. Microbiol. 2012, 14, 82–100. [Google Scholar] [CrossRef]
  20. Warthmann, R.; Vasconcelos, C.; Bittermann, A.G.; McKenzie, J.A. The Role of Purple Sulphur Bacteria in Carbonate Precipitation of Modeern and Possibly Early Precambian Stromatolites. In Lecture Notes in Earth Sciences: Advances in Stromatolites Geobiology; Reitner, J., Quéric, N.V., Arp, G., Eds.; Springer: Berlin, Germany, 2011; Volume 131, pp. 141–149. [Google Scholar]
  21. Havemann, S.A.; Foster, J.S. Comparative characterization of the microbial diversities of an artificial microbialite model and a natural stromatolite. Appl. Environ. Microbiol. 2008, 74, 7410–7421. [Google Scholar] [CrossRef]
  22. Foster, J.S.; Green, S.J. Microbial Diversity in Modern Stromatolites. In Cellular Origin, Life in Extreme Habitats and Astrobiology: Interactions with Sediments; Seckbach, J., Tewari, V., Eds.; Springer: Berlin, Germany, 2011; pp. 385–405. [Google Scholar]
  23. Pinckney, J.; Paerl, H.W.; Bebout, B.M. Salinity control of benthic microbial mat community production in a Bahamian hypersaline lagoon. J. Exp. Mar. Biol. Ecol. 1995, 187, 223–237. [Google Scholar] [CrossRef]
  24. Pinckney, J.; Paerl, H.W.; Reid, R.P.; Bebout, B.M. Ecophysiology of stromatolitic microbial mats, Lee Stocking Island, Exuma Cays, Bahamas. Microb. Ecol. 1995, 29, 19–37. [Google Scholar]
  25. Abed, R.M.; Kohls, K.; de Beer, D. Effect of salinity changes on the bacterial diversity, photosynthesis and oxygen consumption of cyanobacterial mats from an intertidal flat of the Arabian Gulf. Environ. Microbiol. 2007, 9, 1384–1392. [Google Scholar] [CrossRef]
  26. Green, S.J.; Blackford, C.; Bucki, P.; Jahnke, L.L.; Prufert-Bebout, L. A salinity and sulfate manipulation of hypersaline microbial mats reveals stasis in the cyanobacterial community structure. Int. Soc. Microb. Ecol. J. 2008, 2, 457–470. [Google Scholar]
  27. Andres, M.S.; Reid, R.P. Growth morphologies of modern marine stromatolites: A case study from Highborne Cay, Bahamas. Sediment. Geol. 2006, 185, 319–328. [Google Scholar] [CrossRef]
  28. Paterson, D.M.; Aspden, R.J.; Visscher, P.T.; Consalvey, M.; Andres, M.S.; Decho, A.W.; Stolz, J.; Reid, R.P. Light-dependant biostabilisation of sediments by stromatolite assemblages. PLoS One 2008, 3, e3176. [Google Scholar] [CrossRef] [Green Version]
  29. Reid, R.P.; Visscher, P.T.; Decho, A.W.; Stolz, J.F.; Bebout, B.M.; Dupraz, C.; Macintyre, I.G.; Paerl, H.W.; Pinckney, J.L.; Prufert-Bebout, L.; et al. The role of microbes in accretion, lamination and early lithification of modern marine stromatolites. Nature 2000, 406, 989–992. [Google Scholar] [CrossRef]
  30. Bowlin, E.M.; Klaus, J.; Foster, J.S.; Andres, M.; Custals, L.; Reid, R.P. Environmental controls on microbial community cycling in modern marine stromatolites. Sediment. Geol. 2012, 263–264, 45–55. [Google Scholar]
  31. Visscher, P.T.; Beukema, J.; van Gemerden, H. In situ characterization of sediments: Measurement of oxygen and sulfide profiles with a novel combined needle electrode. Limnol. Oceanogr. 1991, 36, 1476–1480. [Google Scholar] [CrossRef]
  32. Myshrall, K.; Mobberley, J.M.; Green, S.J.; Visscher, P.T.; Havemann, S.A.; Reid, R.P.; Foster, J.S. Biogeochemical cycling and microbial diversity in the modern marine thrombolites of Highborne Cay, Bahamas. Geobiology 2010, 8, 337–354. [Google Scholar] [CrossRef]
  33. Hamady, M.; Walker, J.J.; Harris, J.K.; Gold, N.J.; Knight, R. Error-correcting barcoded primers for pyrosequencing hundreds of samples in multiplex. Nat. Methods 2008, 5, 235–237. [Google Scholar] [CrossRef]
  34. Lane, D.J. 16S/23S rRNA Sequencing. In Nucleic Acid Techniques in Bacterial Systematics; Stackebrandt, E., Goodfellow, M., Eds.; John Wiley & Sons: Hoboken, NJ, USA, 1991; pp. 115–175. [Google Scholar]
  35. Schloss, P.D.; Westcott, S.L.; Ryabin, T.; Hall, J.R.; Hartmann, M.; Hollister, E.B.; Lesniewski, R.A.; Oakley, B.B.; Parks, D.H.; Robinson, C.J.; et al. Introducing mothur: Open-source, platform-independent, community-supported software for describing and comparing microbial communities. Appl. Environ. Microbiol. 2009, 75, 7537–7541. [Google Scholar] [CrossRef]
  36. Kunin, V.; Engelbrektson, A.; Ochman, H.; Hugenholtz, P. Wrinkles in the rare biosphere: Pyrosequencing errors can lead to artificial inflation of diversity estimates. Environ. Microbiol. 2010, 12, 118–123. [Google Scholar] [CrossRef]
  37. Huse, S.M.; Huber, J.A.; Morrison, H.G.; Sogin, M.L.; Welch, D.M. Accuracy and quality of massively parallel DNA pyrosequencing. Genome Biol. 2007, 8, R143. [Google Scholar] [CrossRef]
  38. Haas, B.J.; Gevers, D.; Earl, A.M.; Feldgarden, M.; Ward, D.V.; Giannoukos, G.; Ciulla, D.; Tabbaa, D.; Highlander, S.K.; Sodergren, E.; et al. Chimeric 16S rRNA sequence formation and detection in Sanger and 454-pyrosequenced PCR amplicons. Genome Res. 2011, 21, 494–504. [Google Scholar] [CrossRef]
  39. Schloss, P.D. The effects of alignment quality, distance calculation method, sequence filtering, and region on the analysis of 16S rRNA gene-based studies. PLoS Comput. Biol. 2010, 6, e1000844. [Google Scholar] [CrossRef]
  40. Huse, S.M.; Welch, D.M.; Morrison, H.G.; Sogin, M.L. Ironing out the wrinkles in the rare biosphere through improved OTU clustering. Environ. Microbiol. 2010, 12, 1889–1898. [Google Scholar] [CrossRef]
  41. Schloss, P.D.; Handelsman, J. Introducing DOTUR, a computer program for defining operational taxonomic units and estimating species richness. Appl. Environ. Microbiol. 2005, 71, 1501–1506. [Google Scholar] [CrossRef]
  42. Wang, Q.; Garrity, G.M.; Tiedje, J.M.; Cole, J.R. Naive Bayesian classifier for rapid assignment of rRNA sequences into the new bacterial taxonomy. Appl. Environ. Microbiol. 2007, 73, 5261–5267. [Google Scholar] [CrossRef]
  43. Lozupone, C.; Hamady, M.; Knight, R. UniFrac: An online tool for comparing microbial community diversity in a phylogenetic context. BMC Bioinform. 2006, 7, 371. [Google Scholar] [CrossRef]
  44. Hamady, M.; Lozupone, C.; Knight, R. Fast UniFrac: Facilitating high-throughput phylogenetic analyses of microbial communities including analysis of pyrosequencing and PhyloChip data. Int. Soc. Microb. Ecol. J. 2010, 4, 17–27. [Google Scholar]
  45. Badger, M.R.; Bek, E.J. Multiple Rubisco forms in proteobacteria: Their functional significance in relation to CO2 acquisition by the CBB cycle. J. Exp. Bot. 2008, 59, 1525–1541. [Google Scholar] [CrossRef]
  46. Burns, B.P.; Goh, F.; Allen, M.; Neilan, B.A. Microbial diversity of extant stromatolites in the hypersaline marine environment of Shark Bay, Australia. Environ. Microbiol. 2004, 6, 1096–1101. [Google Scholar] [CrossRef]
  47. Dupraz, C.; Visscher, P.T.; Baumgartner, L.K.; Reid, R.P. Microbe-mineral interactions: Early carbonate precipitation in a hypersaline lake (Eleuthera Island, Bahamas). Sedimentology 2004, 51, 1–21. [Google Scholar] [CrossRef]
  48. Macintyre, I.G.; Prufert-Bebout, L.; Reid, R.P. The role of endolithic cyanobacteria in the formation of lithified lamiae in Bahamian stromatolites. Sedimentology 2000, 47, 915–921. [Google Scholar] [CrossRef]
  49. Grüter, D.; Schmid, B.; Brandl, H. Influence of plant diversity and elevated atmospheric carbon dioxide levels on belowground bacterial diversity. BMC Microbiol. 2006, 6, 68. [Google Scholar] [CrossRef] [Green Version]
  50. Sadowsky, M.; Schortemeyer, M. Soil microbial responses to increased concentrations of atmospheric CO2. Glob. Chang. Biol. 1997, 3, 217–224. [Google Scholar]
  51. Grayston, S.J.; Campbell, C.D.; Lutze, J.L.; Gifford, R.M. Impact of elevated CO2 on the metabolic diversity of microbial communities in N-limited grass wards. Plant Soil 1998, 203, 289–300. [Google Scholar] [CrossRef]
  52. Khodadad, C.L.; Zimmerman, A.R.; Green, S.J.; Uthandi, S.; Foster, J.S. Taxa-specific changes in soild microbial composition induced by pyrogenic carbon amendments. Soil Biol. Biochem. 2011, 43, 385–392. [Google Scholar] [CrossRef]
  53. Rothman, D.H. Atmospheric carbon dioxide levels for the last 500 million years. Proc. Natl. Acad. Sci. USA 2002, 99, 4167–4171. [Google Scholar] [CrossRef]
  54. Riding, R. Cyanobacterial calcification, carbon dioxide concentration mechanisms, and Proterozoic-Cambrian changes in atmospheric composition. Geobiology 2006, 4, 299–316. [Google Scholar] [CrossRef]
  55. Badger, M.R.; Price, G.D.; Long, B.M.; Woodger, F.J. The environmental plasticity and ecological genomics of the cyanobacterial CO2 concentrating mechanism. J. Exp. Bot. 2006, 57, 249–265. [Google Scholar]
  56. Myshrall, K.L.; Dupraz, C.; Visscher, P.T. Patterns in Microbialites Throughout Geolotic Time: Is the Present Really the Key to the Past? In Experimental Approaches to Understanding Fossil Organisms; Hembree, D.I., Platt, B.F., Smith, J.J., Eds.; Springer: Berlin, Germany, 2014; Volume 41. [Google Scholar]
  57. Berner, R.A. GEOCARBSULF: A combined model for Phanerozoic atmospheric O2 and CO2. Geochim. Cosmochim. Acta 2006, 70, 5653–5664. [Google Scholar] [CrossRef]
  58. Visscher, P.T.; Reid, R.P.; Bebout, B.M. Microscale observations of sulfate reduction: Correlation of microbial activity with lithified micritic laminae in modern marine stromatolites. Geology 2000, 28, 919–922. [Google Scholar] [CrossRef]
  59. Baumgartner, L.K.; Reid, R.P.; Dupraz, C.; Decho, A.W.; Buckley, D.H.; Spear, J.R.; Przekop, K.M.; Visscher, P.T. Sulfate reducing bacteria in microbial mats: Changing paradigms, new discoveries. Sediment. Geol. 2006, 185, 131–145. [Google Scholar] [CrossRef]
  60. Lee, J.Z.; Burow, L.C.; Woebken, D.; Everroad, R.C.; Kubo, M.D.; Spormann, A.M.; Weber, P.K.; Pett-Ridge, J.; Bebout, B.M.; Hoehler, T.M. Fermentation couples Chloroflexi and sulfate-reducing bacteria to Cyanobacteria in hypersaline microbial mats. Front. Microbiol. 2014, 5. [Google Scholar] [CrossRef]
  61. Gallagher, K.L.; Dupraz, C.; Visscher, P.T. Two opposing effects of sulfate reduction on carbonate precipitation in normal marine, hypersaline, and alkaline environment. Geology 2014, 42, 313–314. [Google Scholar] [CrossRef]
  62. Gallagher, K.L.; Kading, T.J.; Braissant, O.; Dupraz, C.; Visscher, P.T. Inside the alkalinity engine: The role of electron donors in the organomineralization potential of sulfate-reducing bacteria. Geobiology 2012, 10, 518–530. [Google Scholar] [CrossRef]
  63. Stal, L.J.; Moezelaar, R. Fermentation in cyanobacteria. FEMS Microbiol. Rev. 1997, 21, 179–211. [Google Scholar] [CrossRef]
  64. Meister, P. Two opposing effects of sulfate reduction on carbonate precipitation in normal marine, hypersaline, and alkaline environments: Comment. Geology 2013, 41, 499–502. [Google Scholar] [CrossRef]
  65. Meister, P. Two opposing effects of sulfate reduction on carbonate precipitation in normal marine, hypersaline, and alkaline environments: Reply. Geology 2014, 42, e315. [Google Scholar] [CrossRef]
  66. Castro, H.F.; Classen, A.T.; Austin, E.E.; Norby, R.J.; Schadt, C.W. Soil microbial community responses to multiple experimental climate change drivers. Appl. Environ. Microbiol. 2010, 76, 999–1007. [Google Scholar] [CrossRef]
  67. DeAngelis, K.M.; Silver, W.L.; Thompson, A.W.; Firestone, M.K. Microbial communities acclimate to recurring changes in soil redox potential status. Environ. Microbiol. 2010, 12, 3137–3149. [Google Scholar] [CrossRef]
  68. Aloisi, G.; Gloter, A.; Kruger, M.; Wallmann, K.; Guyot, F.; Zuddas, P. Nucleation of calcium carbonate on bacterial nanoglobules. Geology 2006, 34, 1017–1020. [Google Scholar] [CrossRef]
  69. Bosak, T.; Newman, D.K. Microbial nucleation of calcium carbonate in the Precambrian. Geology 2003, 31, 577–580. [Google Scholar] [CrossRef]
  70. Feely, R.A.; Sabine, C.L.; Lee, K.; Berelson, W.; Kleypas, J.; Fabry, V.J.; Millero, F.J. Impact of anthropogenic CO2 on the CaCO3 system in the oceans. Science 2004, 305, 362–366. [Google Scholar] [CrossRef]
  71. Feely, R.A.; Sabine, C.L.; Hernandez-Ayon, J.M.; Ianson, D.; Hales, B. Evidence for upwelling of corrosive “acidified” water onto the continental shelf. Science 2008, 320, 1490–1492. [Google Scholar]
  72. Takahashi, T.; Sutherland, S.C.; Feely, R.A.; Wanninkhof, R. Decadel change of surface water pCO2 in the North Pacific: A synthesis of 35 years of observation. J. Geophys. Res. 2006, 111. [Google Scholar] [CrossRef]
  73. Gilbert, J.A.; Field, D.; Huang, Y.; Edwards, R.; Li, W.; Gilna, P.; Joint, I. Detection of large numbers of novel sequences in the metatranscriptomes of complex marine microbial communities. PLoS One 2008, 3, e3042. [Google Scholar] [CrossRef] [Green Version]
  74. Shibca, S.V.; Hedgpeth, D.W.; Park, P.K. Dissolved Oxygen and pH Increases by Primary Production in the Surface Water of Arthur Harboe, Antarctica 1970–1971. In Adaptation within Antarctic Ecosystems: Proceedings of the Third SCAR Symposium on Antactic Biology; Smithsonian Institution: Washington, DC, USA, 1977; pp. 83–97. [Google Scholar]
  75. Felix, E.A.; Rushforth, S.R. The alga flora of the Great Salt Lake. Nova Hedwig. 1979, 31, 163–194. [Google Scholar]
  76. Potts, M. Blue-green algae (Cyanophyta) in marine coastal environments of the Sinai peninusla: Distribution, zonation, stratification and taxonomic diversity. Phycologia 1980, 19, 60–73. [Google Scholar] [CrossRef]
  77. Garcia-Pichel, F.; Kühl, M.; Nübel, U.; Muyzer, G. Salinity-dependent limitation of photosynthesis and oxygen exchange in microbial mats. J. Phycol. 1999, 35, 227–238. [Google Scholar] [CrossRef]
  78. Casamayor, E.O.; Massana, R.; Benlloch, S.; Ovreas, L.; Diez, B.; Goddard, V.J.; Gasol, J.M.; Joint, I.; Rodriguez-Valera, F.; Pedros-Alio, C. Changes in archaeal, bacterial and eukaryal assemblages along a salinity gradient by comparison of genetic fingerprinting methods in a multipond solar saltern. Environ. Microbiol. 2002, 4, 338–348. [Google Scholar] [CrossRef]
  79. Caumette, P.; Matheron, R.; Raymond, N.; Relexans, J.C. Microbial mats in the hypersaline ponds of Meditteranean salterns (Salins-de-Giraud, France). FEMS Microbiol. Ecol. 1994, 13, 273–286. [Google Scholar]
  80. Fourçans, A.; de Oteyza, T.G.; Wieland, A.; Solé, A.; Diestra, E.; van Bleijswijk, J.; Grimalt, J.O.; Kühl, M.; Esteve, I.; Muyzer, G.; et al. Characterization of functional bacterial groups in a hypersaline microbial mat community (Salins-de-Giraud, Camargue, France). FEMS Microbiol. Ecol. 2004, 51, 55–70. [Google Scholar]
  81. Visscher, P.T.; Dupraz, C.; Braissant, O.; Gallagher, K.L.; Glunk, C.; Casillas, L.; Reed, R.E.S. Biogeochemistry of Carbon Cycling in Hypersaline Mats: Linking the Present to the Past Through Biosignatures. In Cellular Origin, Life in Extreme Habitats and Astrobiology; Seckbach, J., Oren, A., Eds.; Springer: Berlin, Germany, 2010; Volume 14, pp. 443–468. [Google Scholar]
  82. Paerl, H.W.; Steppe, T.F.; Buchan, K.C.; Potts, M. Hypersaline cyanobacterial mats as indicators of elevated tropical hurricane activity and associated climate change. Ambio 2003, 32, 87–90. [Google Scholar]
  83. Yannarell, A.C.; Paerl, H.W. Effects of salinity and light on organic carbon and nitrogen uptake in a hypersaline microbial mat. FEMS Microbiol. Ecol. 2007, 62, 345–353. [Google Scholar] [CrossRef]
  84. Liu, H.B.; Buskey, E.J. Hypersalinity enhances the production of extracellular polymeric substances (EPS) in the Texas brown tide alga, Aureoumbra lagunensis (Pelagophyceae). J. Phycol. 2000, 36, 71–77. [Google Scholar] [CrossRef]
  85. Abdullahi, A.S.; Underwood, G.J.C.; Gretz, M.R. Extracellular matric assembly in diatoms (Bacillariophyceae). V. Environmental effects on polysaccharide synthesis in the model diatom, Phaeodactylum tricornutum. J. Phycol. 2006, 42, 363–378. [Google Scholar] [CrossRef]
  86. Kawaguchi, T.; Decho, A.W. Isolation and biochemical characterization of extracellular polymeric secretions (EPS) from modern soft marine stromatolites (Bahamas) and its inhibitory effect on CaCO3 precipitation. Prep. Biochem. Biotechnol. 2002, 32, 51–63. [Google Scholar] [CrossRef]
  87. Braissant, O.; Decho, A.W.; Dupraz, C.; Glunk, C.; Przekop, K.M.; Visscher, P.T. Exopolymeric substances of sulfate-reducing bacteria: Interactions with calcium at alkaline pH and implication for formation of carbonate minerals. Geobiology 2007, 5, 401–411. [Google Scholar] [CrossRef]
  88. Bissett, A.; Reimer, A.; de Beer, D.; Shiraishi, F.; Arp, G. Metabolic microenvironmental control by photosynthetic biofilms under changing macroenvironmental temperature and pH conditions. Appl. Environ. Microbiol. 2008, 74, 6306–6312. [Google Scholar]

