
Influence of Anionic Surfactant on Saturated Hydraulic Conductivity of Loamy Sand and Sandy Loam Soils
by
Zhenyang Peng
1,2,*, 
Christophe J. G. Darnault
3,
Fuqiang Tian
1,
Philippe C. Baveye
4 and
Hongchang Hu
1 1
Department of Hydraulic Engineering, State Key Laboratory of Hydroscience and Engineering, Tsinghua University, Beijing 100084, China
2
Key Laboratory of Water Cycle and Related Land Surface Processes, Institute of Geographic Sciences and Natural Resources Research, Chinese Academy of Sciences, Beijing 100084, China
3
Department of Environmental Engineering and Earth Sciences, Laboratory of Hydrogeoscience and Biological Engineering, L.G. Rich Environmental Laboratory, Clemson University, 342 Computer Court, Anderson, SC 29625, USA
4
Unité ECOSYS, AgroParisTech, Université Paris-Saclay, Avenue Lucien Brétignières, Thiverval-Grignon 78850, France
*
Author to whom correspondence should be addressed.
Water 2017, 9(6), 433; https://doi.org/10.3390/w9060433
Submission received: 20 December 2016
/
Revised: 24 April 2017
/
Accepted: 22 May 2017
/
Published: 15 June 2017
(This article belongs to the Special Issue Water and Solute Transport in Vadose Zone)
Abstract
:Surfactants released into the terrestrial environment in large amounts can potentially alter the physical, chemical and biological properties of soils, particularly the saturated hydraulic conductivity (Ks). Unfortunately findings regarding this process are quite limited. In this study, column tests were used to analyze the effects of Aerosol 22, a widely used anionic surfactant, on Ks of loamy sand and sandy loam soils. Solutions were injected into columns from the bottom with controlled pressure heads. Both the overall Ks of columns and the Ks of 6 layers at distances of 0–1 cm, 1–3 cm, 3–5 cm, 5–7 cm, 7–9 cm, and 9–10 cm from the bottom, were continuously monitored before and after the surfactant injections. Results showed that the overall Ks of all columns decreased after 2–4 pore volumes of the surfactant injections. However, stabilization and even increase at the beginning of the surfactant injection was also observed due to the different Ks variations in different layers. Specifically, a surfactant injection of 2–4 pore volumes continuously decreased the Ks of the 0–1 cm layers which yielded a Ks reduction of two orders of magnitude and dominated the Ks variations of the column. In contrast, an increase in the Ks of the 1–3 cm and 3–5 cm layers was more likely, while Ks variation of the 5–10 cm layers was less likely. We hypothetically attributed the Ks variations to the swelling of clay, the collapse of soil aggregates and subsequent particle displacements from surfactant adsorption, which caused pore clogging in the bottom 0–1 cm layer and higher porosities in the layers above. The adsorption of the surfactant aggregates and crystallization were also possibly thought to cause a pore clogging in the bottom layer thus decrease the surfactant concentration from the inlet, the severity of which affects these layers less at greater distances from the inlet. In view of the uncertainty showed by the experimental results, we also suggest to include more replicate columns in future studies, so as to increase the repeatability of the measurements.
1. Introduction
Greywater has long been regarded as a potential reusable water resource for irrigating household lawns and gardens with approximately 20 million hectares of farmland worldwide now irrigated mainly with wastewater [1,2]. The use of such wastewater has been recognized as an important management option for farmland irrigation, especially in arid regions, where water resources are scarce and wastewater is the only or the major water resource [3]. Surfactants, the widely used chemical additives in household cleaning and personal care products [4], are generally the dominant source of xenobiotic organic compounds found in sewage and municipal wastewater [5,6], and their concentrations meet or exceed several or even tens of grams per kilogram [7,8,9,10]. Consequently, large amounts of surfactants are regularly released into the terrestrial environment, particularly in developing countries where wastewater is poorly treated or simply untreated before irrigation [11]. Even in developed countries such as the United States, an estimated 5% of domestically produced Linear Alkylbenzene Sulfonates (LAS) reaches the aquatic environment by several routes [12], which is a considerable amount given the millions of tons of annual consumption [13]. Surfactants are not all degradable in aquifers; they may be adsorbed on mineral surface and sediments, or transported with aqueous solutions [14]. Kuhnt (1993) demonstrated how the adsorbed surfactants can change the physical, chemical, and biological properties of soils [15], e.g., create water-repellent soils [16], and evidence also suggests that accumulated surfactant in soils is harmful to both agricultural productivity and environmental sustainability [17,18].
The wide application of surfactant occurs essentially because of its amphiphilic property [19]. Although surfactants exist as monomeric molecules in aqueous solutions at low concentrations, the molecules will aggregate into micelles when the concentration reaches the critical micelle concentration (CMC). At this point, the hydrophobic non-polar regions make maximum contact with one another to form a hydrocarbon-like core, with the hydrophilic polar-regions in maximum contact with water [19]. This formation of micelles will in turn (1) reduce the surface tension and interfacial tension of the aqueous solution [9,15,16]; and (2) enhance the solubility of water-insoluble compounds such as hydrophobic organic compounds (HOC) [9,14]. The resulting surfactants may then be potentially used in the in-situ flushing of HOC from soils [20,21].
In addition to the reduction of the liquid/solid interfacial tension, the surfactant in the soils will also increase the contact angle between the liquid and minerals; thus causing a reduction in capillary rise [3,22]. However, Law and Kunze (1966) argued that water molecules are adsorbed more strongly on the oxygen-hydrogen groups of the adsorbed surfactant, which should in turn increase the capillary rise [23]. Although surfactants are commonly introduced into soils to improve infiltration capacity, in their column tests Abu-Zreig et al. (2003) observed a decreased in the infiltration rate when the surfactant was applied [3]. However in their analysis, Lehrsch et al. (2011) observed an identical tension infiltration in both the presence and the absence of the surfactant [24]. In their comparison of three surfactants (Triton X-100, Aerosol 22 and HDTMA) on the infiltration rate of three soil types (clay, clay loam, and loam), Mingorance et al. (2007) observed that each surfactant shifted the infiltration rate at various levels for a given soil type, with a specific surfactant either increasing or decreasing the infiltration rate in the various soils under study [25]. Kuhnt (1993) noted that surfactant may either increase or decrease the infiltration rate, with the shift depending upon the degree of soil water repellency, the method employed to apply the surfactant, and the effects of the surfactant on surface tension and the liquid/solid contact angle [15].
The infiltration tests noted above may have also implied the uncertain influence of surfactant on saturated hydraulic conductivity (Ks). Specifically, Mingorance et al. (2007) observed a decrease of Ks of the tested soils in the presence of Aerosol 22 and HDTMA, but in the presence of Triton X-100 [25]. Nevertheless, it is now accepted that a decrease in Ks will occur with the application of a surfactant. Specifically in their study of disturbed and undisturbed soil samples, Misra and Sivongxay (2009) reported a dramatic decrease of Ks after treatment with greywater, within a range of 84% and 95%; moreover, these reductions appeared irreversible since the use of tap water to further leach the greywater-treated soil caused a further reduction in Ks [4]. In a similar study, Liu and Roy (1995) injected sodium dodecylsulfate (SDS), sodium dodecylbenzene sulfonate (SDBS), and sodium metaphosphate (Calgon) into different soil-sand mixtures. In all scenarios except that of pure sand, Ks decreased sharply from the moment of injection, and the cumulative reduction in Ks was up to 0.5–2 orders of magnitude after the injection of 3–7 pore volumes of surfactant solution [20].
Abu-Zreig et al. (2003) determined that the surface tension and contact angle were not the mechanisms behind the Ks reduction, since water in saturated soils moves mainly in large pores, in which the capillary force does not predominate [3]. Many studies were undertaken to analyze the collapse of soil aggregates induced by anionic surfactant [15,25,26]. Since the reduced surface tension leads to higher wettability of primary particles, aggregates lose their stability more easily making the particles more prone to dispersion. Consequently, soil pores may be clogged by these displaced particles. Additionally, Na+ is electrolyzed from various sorts of anionic surfactants in aqueous solution, resulting in high sodium adsorption ration (SAR), which is also believed to have an adverse effect on the stability of soil aggregates [4,20,27]. For example, in their study of sulphonic induced changes to the pore radius and pore size distribution in sandy loam and loam, Abu-Zreig et al. (2003) found that the shape factors of these both increased by more than 50%, with a corresponding decrease in the penetration coefficient between 16% and 18% [3]. However, the influence of cationic surfactants on soil processes differs from the anionic counterparts, as they are most likely to be adsorbed on minerals [28,29]. This adsorption changes the surface of the soil particles from hydrophilic to hydrophobic, and the consequent displacement of water leads to a higher aggregate stability [15]. It is also possible that the surfactant induced Ks reduction may be from surfactant precipitation when divalent cations such as Ca2+ and Mg2+ are dissolved in aqueous solution [30,31,32]. Such a reduction, which occurs frequently in salinized or alkalized soil, could be the primary reason of Ks reduction [20].
As Abu-Zreig et al. (2003) and Misra and Sivongxay (2009) observed, data on the changes of soil hydraulic properties from the use of surfactants is both limited and controversial [3,4]. Specifically, the Ks variations inferred by the infiltration tests described above may not be fully reliable, given the possibility of air trap and preferential flow occurrence during infiltration. Moreover, previous studies emphasized elucidating the overall Ks of the columns, with little data derived on the variation of the Ks profile. Thus in this study, we sought to examine the influence of the anionic surfactant, which is the most widely used surfactant in industry [12,33], on the Ks of various soil types and, more importantly, to assess the Ks responses in soils with difference distances from the injection point of the surfactant.
2. Material and Method
2.1. Soil Preparation
A total of four soil types collected from fallow pastures in Kankakee County, Illinois and cultivated pastures in Cache County, Utah were used in this study. The collected soils were stored in lidded buckets at room temperature for experiments after been air-dried at 37 °C and been sieved by a 2 mm mesh.
Particle size analysis using the pipette method showed that all four soil types were rich in sand (Table 1) [34], while the contents of clayey particles varied between 7.9% and 19.5%. Therefore, using the USDA (United States Department of Agriculture) texture soil classification the soils were categorized as either sandy loam or loamy sand and subdivided into four series of soils—Sparta, Gilford, Lewiston, and Greenson—in consideration of their origins. The results of the ignition loss study suggested that the organic matter content of the four soils, falling with a range of 3.4% to 4.2%, did not differ greatly. The electrical conductivity (EC) and pH were obtained by measuring the saturated soil paste extracts [35], and the cation exchange capacities (CEC) were measured using the sodium acetate/ammonium acetate replacement method. As shown in Table 1, the pH of the Gilford soil was notably lower than the other three soils, all of which were close to that of the neutral solution. The cation contents of Lewiston and Greenson were much higher than the Sparta and Gilford samples, however, resulting in higher ECs of saturation extracts. Nevertheless, the ECs of the four soils, none of which were deemed to be salinized or alkalized, were lower than 1 dS/m.
2.2. Surfactant
The surfactant used in this study is Aerosol 22 (Sigma-Aldrich co., St. Louis, MO, USA). It is an anionic surfactant in which the sulfo-group acts as the dominant hydrophilic head, and it is widely used as dispersing and solubilizing agents, e.g., in lime soap and paint. The specifications of this chemical are listed in Table 2.
2.3. Apparatus and Procedure
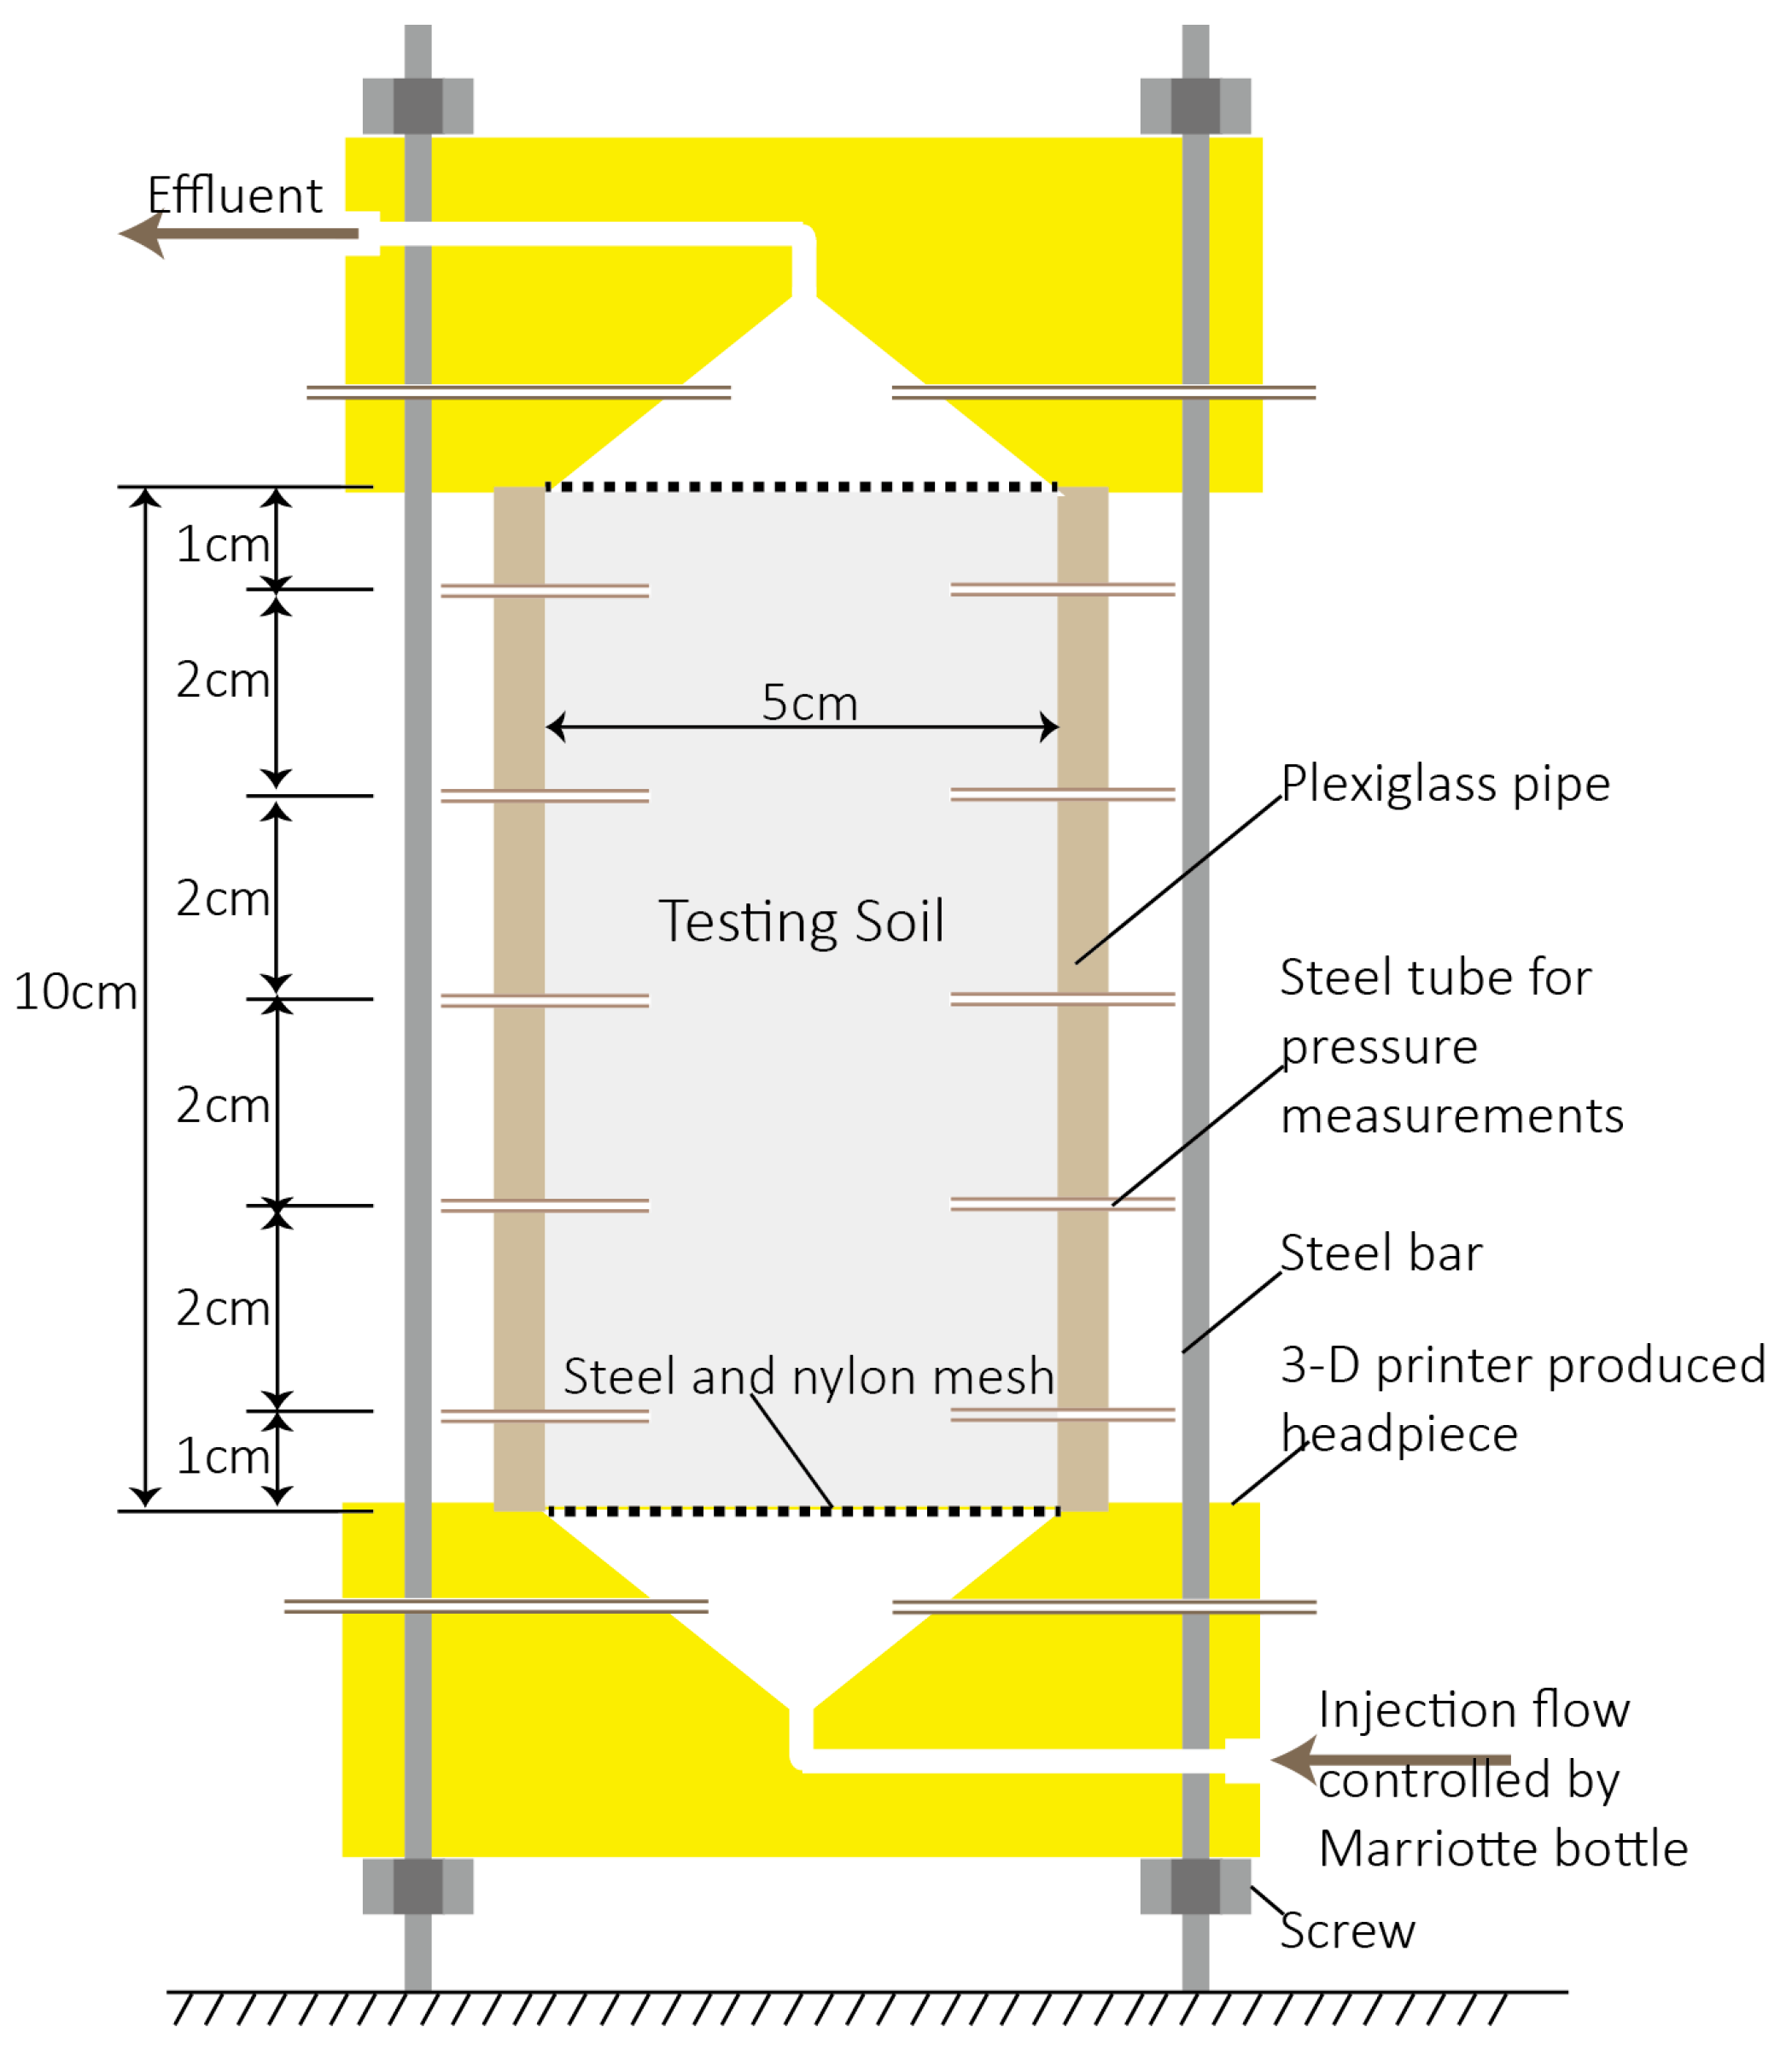
The apparatus used for this column test is shown in Figure 1. A five cm inner diameter plexiglass pipe was cut into pieces of 10 cm in length, and small holes were drilled through the pipe wall at various distances from the bottom end, i.e., 1 cm, 3 cm, 5 cm, 7 cm, and 9 cm. Three holes, two of which are shown in Figure 1 were drilled at each distance, and uniformly distributed at every 120° around the pipe wall. Slim steel tubes with the same external diameter (1/16 inches) to that of the holes were inserted into the pipe. It should be noted that the in-column ends of steel tubes were all covered with nylon mesh to prevent particle clogging. Headpieces of the apparatus were produced by 3-D printing (uPrint SEPlus, Stratasys Inc., Eden Prairie, MN, USA), using the designation proposed by Rangel et al. (2012) [36]. The funnel-shaped grooves were expected to generate a unidirectional flow in the column, and aqueous solutions were either injected or collected from the reserved pipe. Additionally, two small holes were reserved in the headpieces, and steel tubes were inserted into the grooves. The headpieces were painted for impermeability and then tightly connected with the prepared plexiglass pipe. Rubber rings were placed at the interfaces to prevent leakage and the entire connection was reinforced by steel bars and screws. Finally, all slim steel tubes were connected to hoses for pressure head measurement, and the pressure heads measured at the same distance from the bottom were averaged.
The testing soils were layer-compacted into the plexiglass pipe, with steel and nylon mesh placed at the bottom and top, to support the soils and to prevent particle loss. These compactions were carried out in triplicate for each soil type. Bulk densities of the compacted soils were 1.48 g·cm−3, 1.50 g·cm−3, 1.38 g·cm−3 and 1.36 g·cm−3 for Sparta, Gilford, Lewiston and Greenson, respectively, and differences among the triplicates were controlled less than 0.005 g·cm−3. Aqueous solutions were injected from the bottom of the column, with the pressure head controlled by a Marriotte bottle. The soils column was pre-saturated with a 1 mM KCl solution, by elevating the Marriotte bottle controlled pressure head at a rate of approximately 1 cm·h−1. The pressure head of the injection flow was then controlled to be constant, and the 1 mM KCl solution was continuously injected to achieve an approximate 1.2–2.5 pore volume (Vp, one Vp was about 82 cm3, 80 cm3, 89 cm3 and 91 cm3 in Sparta, Gilford, Lewiston and Greenson columns, respectively). A 1 mM KCl + 2CMC Aerosol solution was then injected. The flow rates of the effluent were continuously monitored during the test, as were the pressure heads throughout the columns. The pressure head at the inlet was approximately 30 cm higher than at the outlet, and the accuracy of the pressure head measurements was ±0.5 mm, and that of the effluent volume was ±0.5 mL. After a period of test, water leakage was observed at the junction between the plexiglass pipe and the lower headpiece, and the corresponding triplicate tests were all stopped when this occurred. Eventually, durations of Sparts, Gilford, Lewiston and Greeson columns tests were 34 h, 72 h, 74 h, and 342 h, respectively.
3. Results
3.1. Saturated Hydraulic Conductivities of the Columns
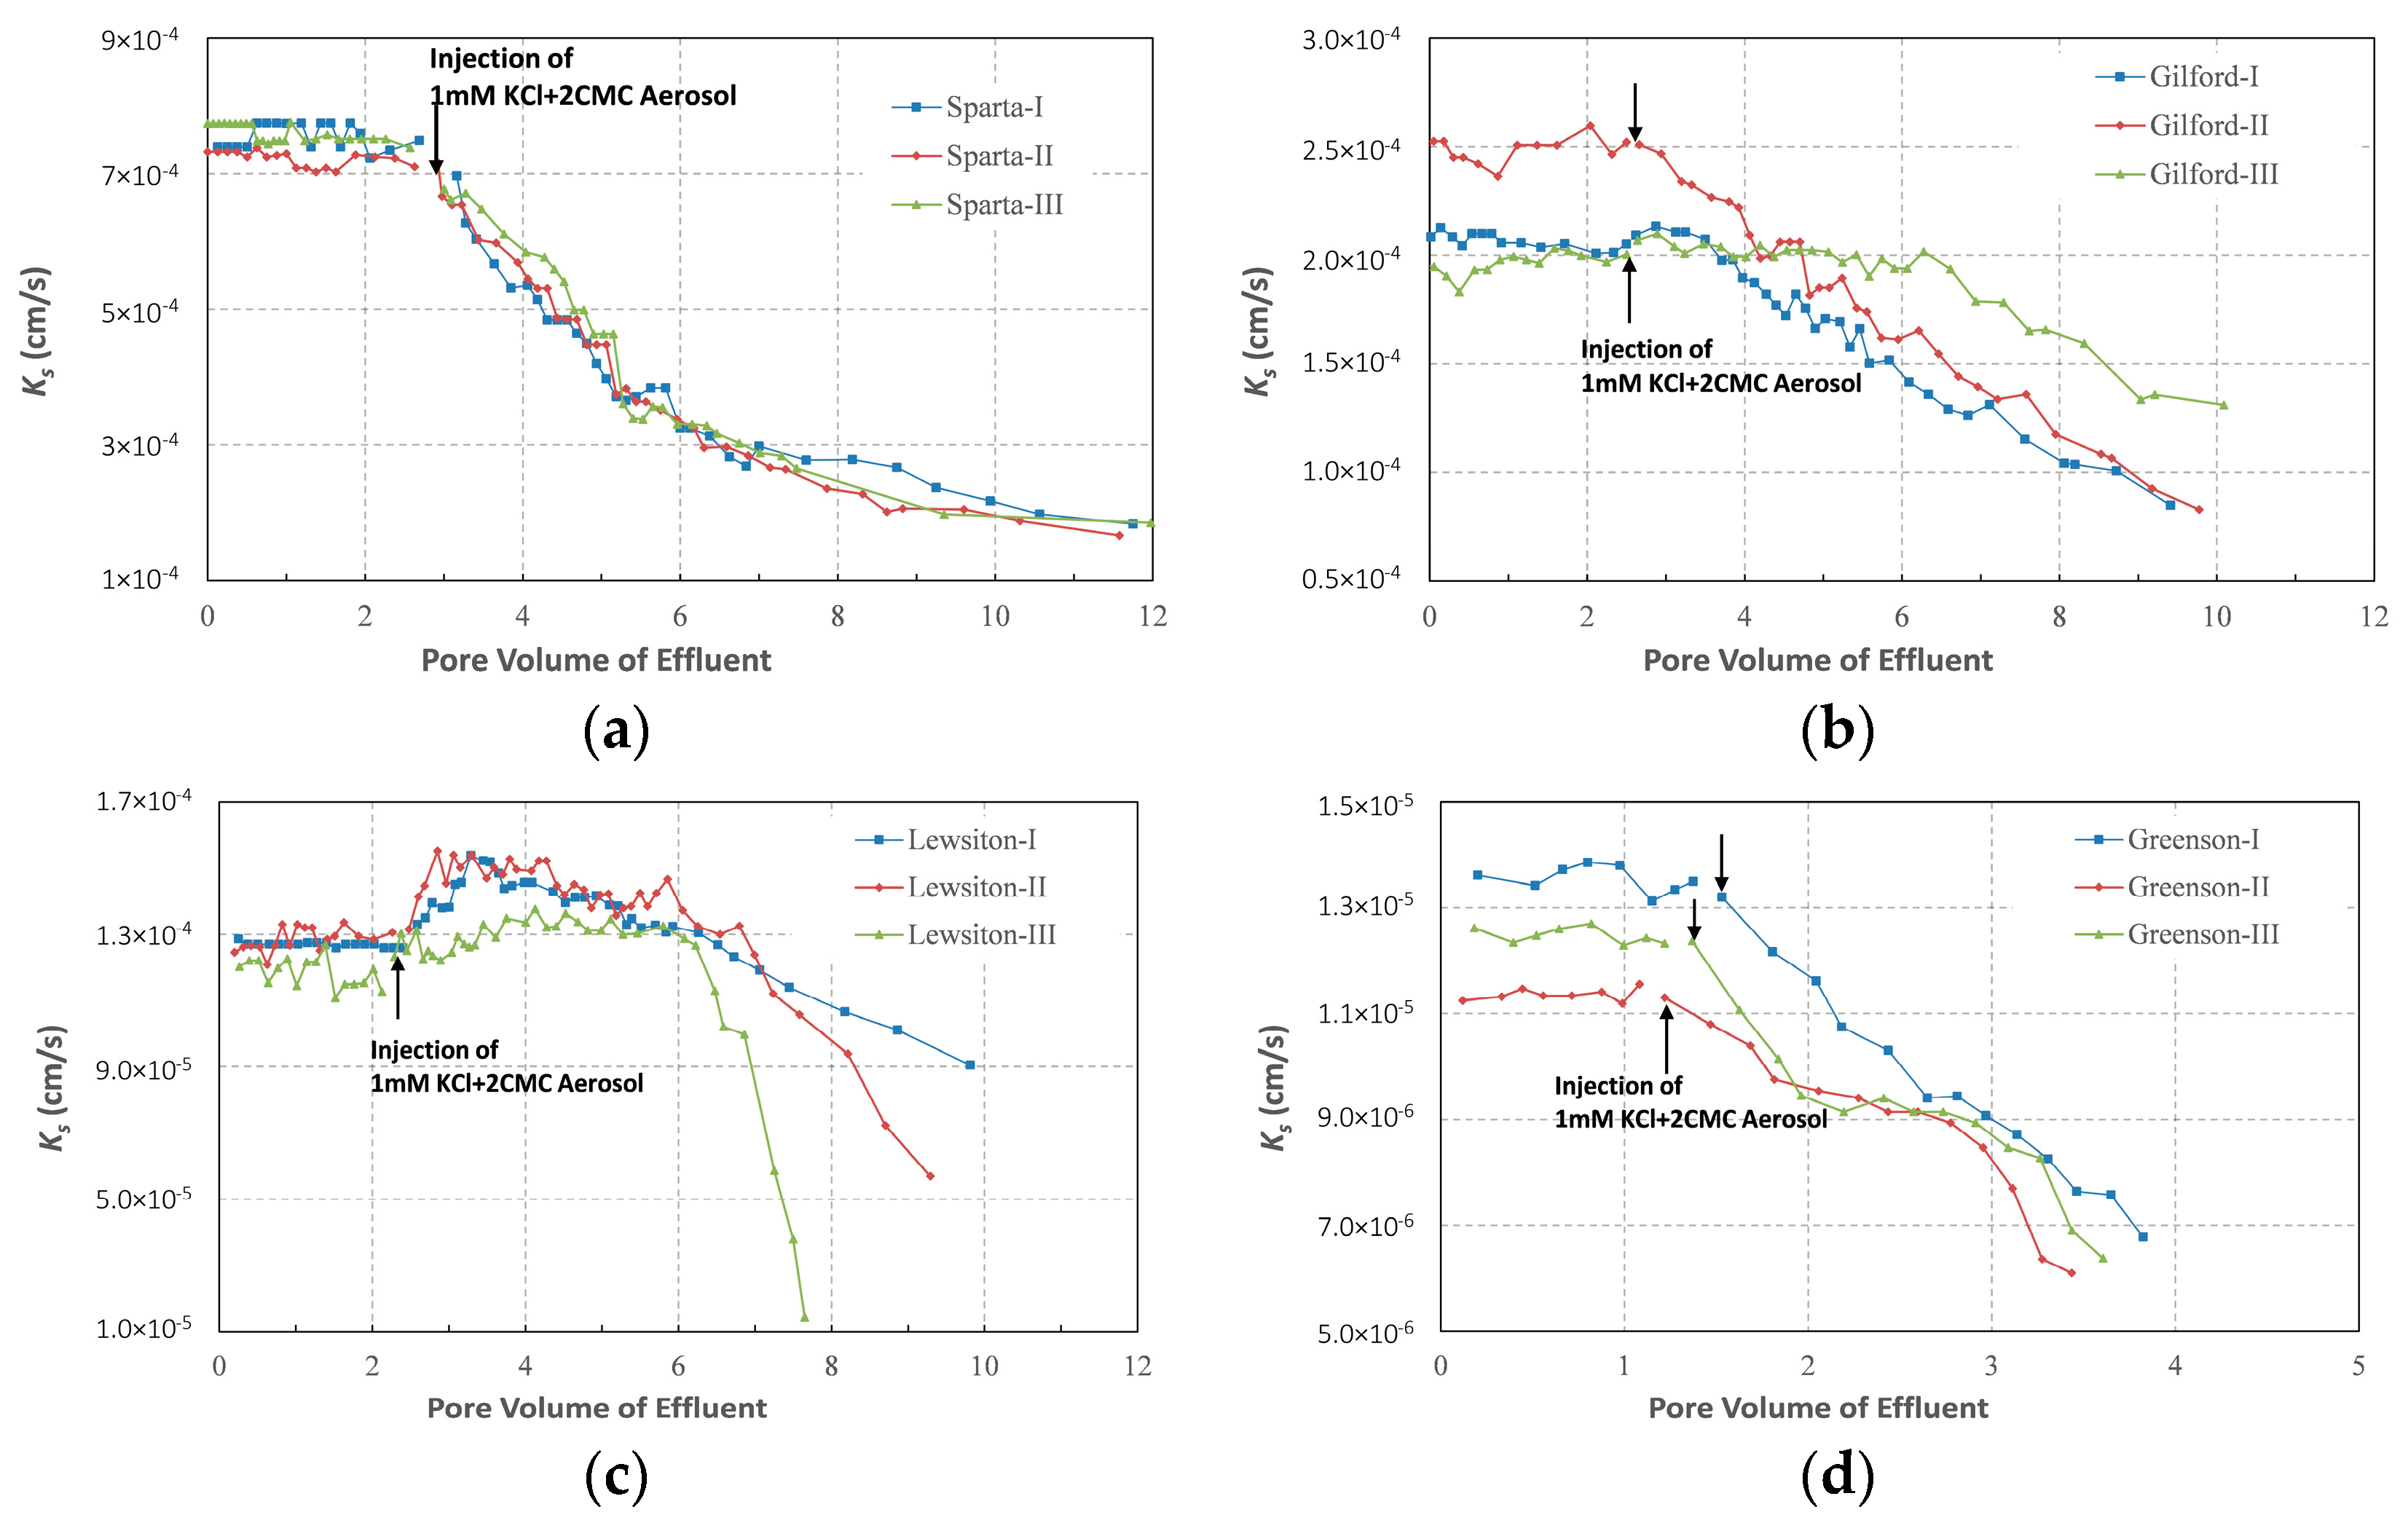
The observations prior to the injection of the surfactant solution noted a cumulative volume of effluent from each column that increased linearly with time (R2 > 0.99) under stable hydraulic gradients, indicating a temporally constant hydraulic conductivities and a stable matric structures of the columns. Figure 2 also shows that overall Ks of each column were highly constant when solutions did not contain surfactant, and the coefficients of variations of each column’s Ks were generally lower than 4%. However, differences of Ks among the replicates could be much more significant, especially among the columns of Gilford and Greenson. Such a difference could be attributed to the non-uniform soil compaction, although the packing procedures were aimed to keep the same bulk density among the replicates. On average, the Ks of the Sparta, Gilford and Lewiston columns were 7.46 ± 0.17 × 10⁻⁴ cm/s, 2.18 ± 0.23 × 10⁻⁴ cm/s and 1.25 ± 0.04 × 10⁻⁴ cm/s, respectively, which generally decreased with an increase in the clay content. The Ks of Greenson, the soil with the highest clay content, however was only 1.25 × 10⁻⁵ ± 0.09 × 10⁻⁵ cm/s, which was at least one order of magnitude lower than those of the other three soils.
Figure 2 shows that the continuous surfactant solution injections changed the Ks of all of the testing columns. Although the processes of Ks variation were different among the columns, even among replicates, in the later stage of each test, the Ks of all columns were unexceptionally lower than those before surfactant solution injections. For example, after 4-Vp (2-Vp for Greenson) injections of surfactant solution, the Ks of Sparta, Gilford, and Lewiston were reduced on average by 61.8%, 26.9%, and 4.3%, respectively, while after a 2-Vp injection of the surfactant solution, the Ks of Greenson reduced on average by 45.7%.
Also the Ks of the three replicate Sparta columns decreased almost synchronously throughout the tests, which occurred from the moment of the surfactant solution injection. Further, the Ks of the columns decreased rapidly during the early stage of the surfactant solution injection, with a cumulative reduction of 64% after a 5-Vp (about 400 cm3) injection of surfactant solution. The Ks reductions then tended to be slower with the Ks of the columns almost constant at the end of the tests. Specifically, during the last 4-Vp injections of the surfactant solution, the Ks of the three columns were only reduced to 12%. The Ks of the Greenson columns also began to decrease from the moment of surfactant solution injection, and the Ks decreased almost linearly with the cumulative volume of the effluent. However, the extremely low level of Ks of Greenson and dysfunction of the apparatus after a long-term run prevented a large scale retrieval of the effluent from the columns. Thus it remains unclear if the Ks of the columns would tend to be constant, as were the Sparta columns, with the injection of addition surfactant.
The Ks variations of Gilford columns at the initial stages of the surfactant solution injections exhibited a great deal of variation. However, once the Ks started to decrease, they all decreased almost linearly with cumulative effluent volumes and, more importantly, the Ks reduction rates of the three replicates were closely adjacent. It is noteworthy that the Ks of the Lewiston columns did not decline immediately once the surfactant solution was injected. On the contrary, the Ks of all the replicates increased by 12.5–20.8% when the surfactant solution was initially injected; the Ks of the two replicates increased rapidly and peaked at about 1-Vp injection of the surfactant solution, while the Ks of the third replicate increased much slowly and peaked at around 2-Vp injection of the surfactant solution. The Ks of all the replicates then declined, but at different rates, with no indication of a constancy of the Ks of the columns throughout the tests.
3.2. Saturated Hydraulic Conductivities of Layers
Since the pressure heads were monitored at several distances from the bottom of the soil column (Figure 1), the column was divided into 6 layers, i.e., 0–1 cm, 1–3 cm, 3–5 cm, 5–7 cm, 7–9 cm, and 9–10 cm, and Ks of each layer can also be calculated. The Ks of the layers was observed to be generally constant before surfactant solution injections with the variation coefficients mostly less than 6%. However, the differences among layers could be more significant. The average and standard deviation based on the Ks of the six layers in each column presented in Figure 3 shows a range in the variation coefficients between 3.2% and 41.2%. Nevertheless, the Ks of the six layers were kept in the same order of magnitude in each column. Figure 3 also shows that the arithmetic mean Ks of the six layers were all higher than the column’s overall Ks, with the difference between each generally growing with the standard deviation of the layers’ Ks. This growth is due to the overall vertical is Ks in layered soils, which largely controlled by and always lower than the lowest Ks among the layers.
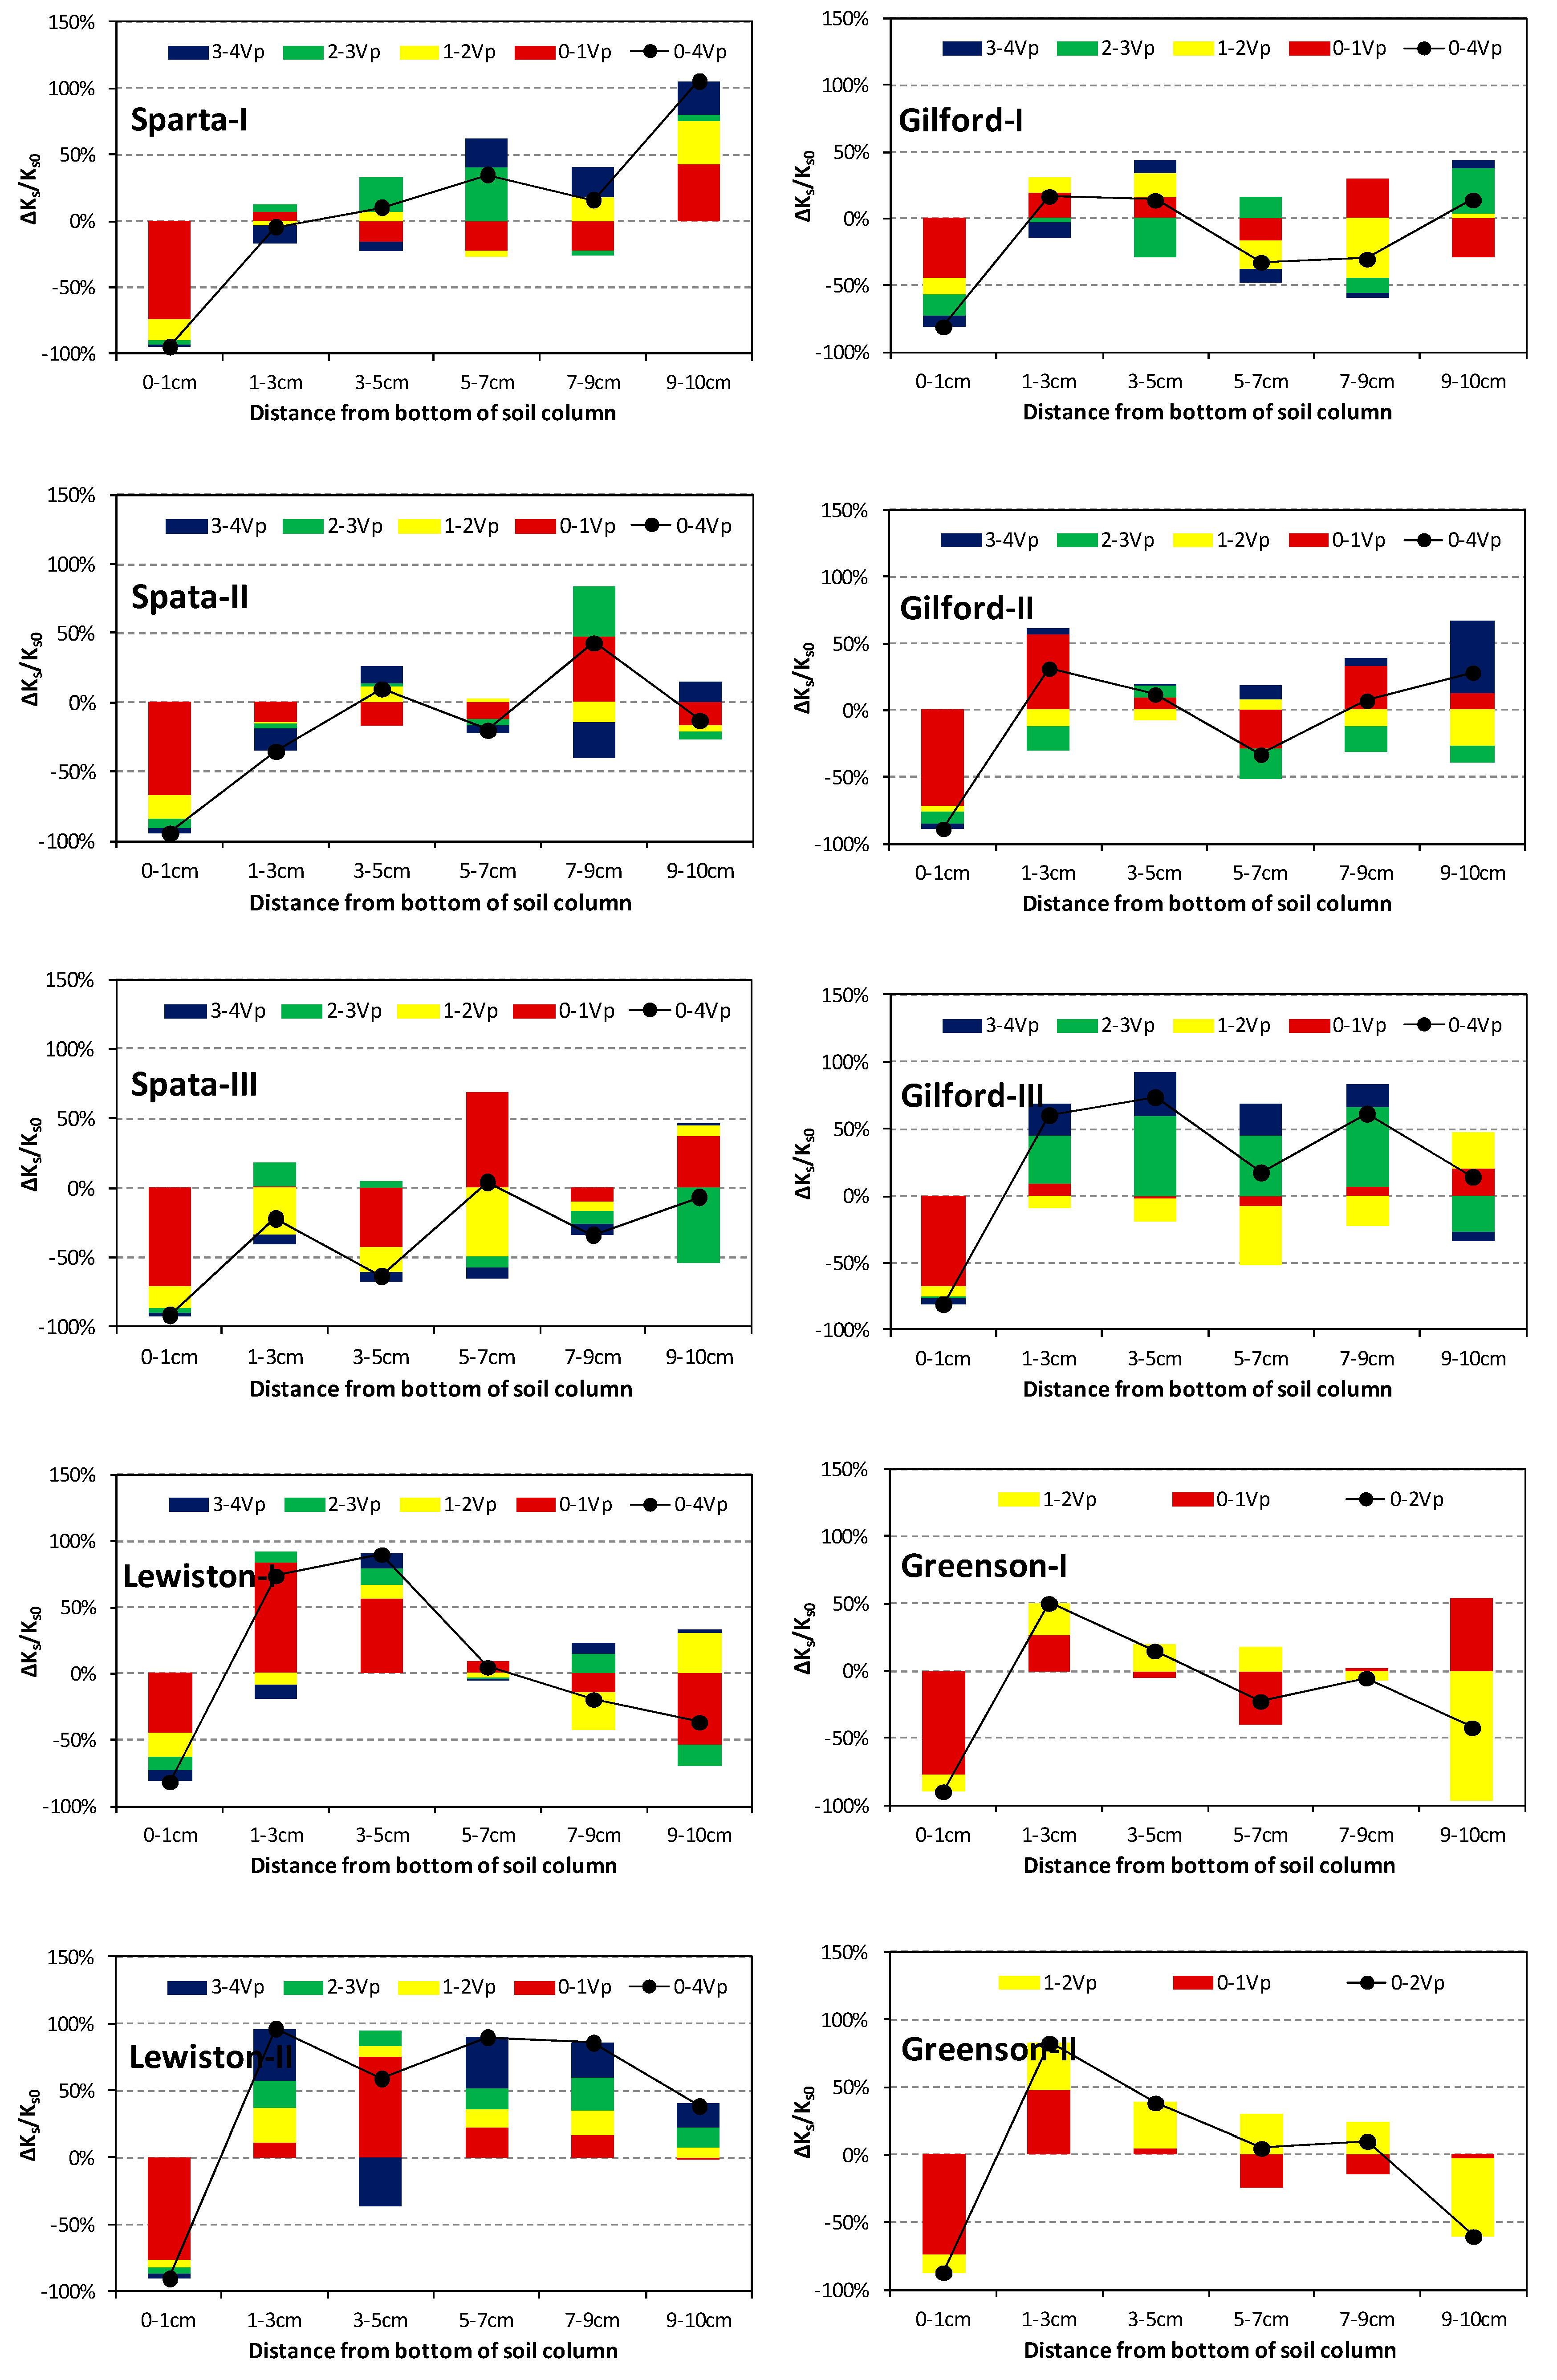
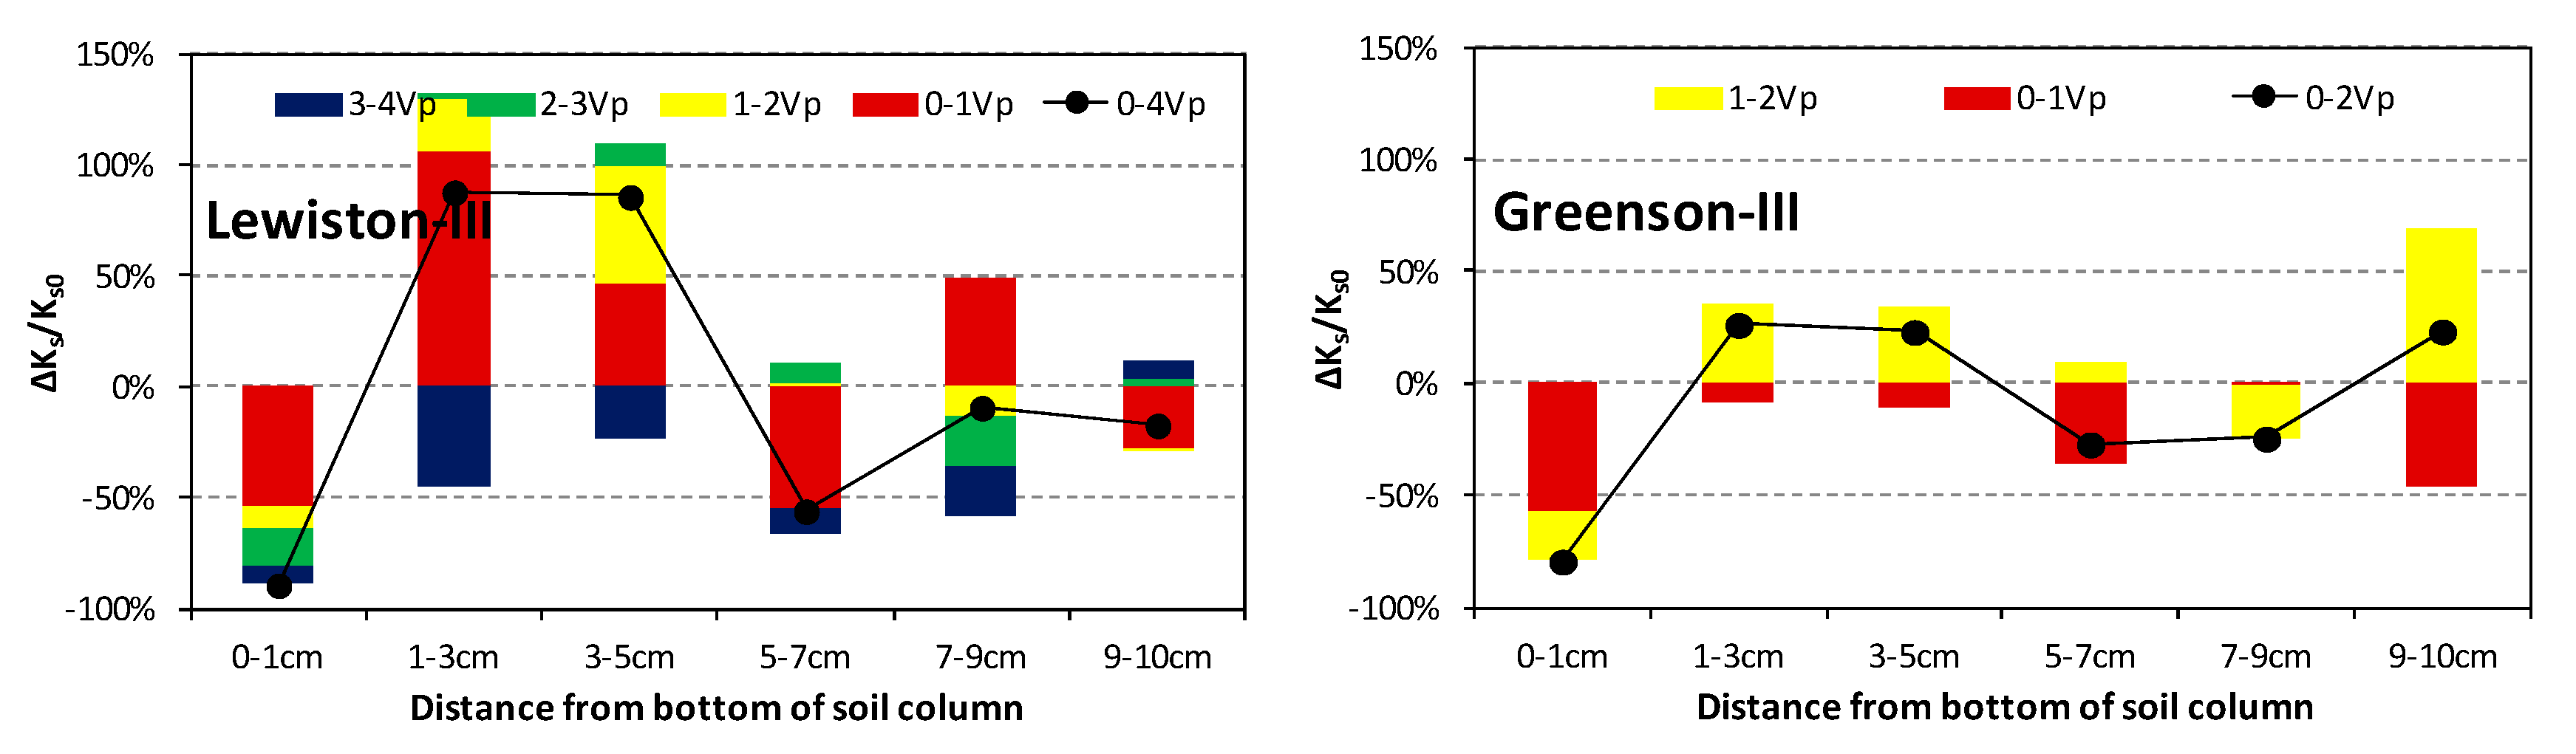
The Ks variations of the soil layers during each Vp surfactant solution injection are presented in Figure 4. It is clear that the 0–1 cm layers of all 12 columns decreased continuously during surfactant solution injections, and ended up with an average of 87% reduction after 4-Vp (2-Vp for Greenson) surfactant solution injection. Moreover, more than half of the reduction occurred during the first Vp surfactant solution injections, indicating an instant influence of the surfactant on the soil properties. However, the Ks variations of the other five layers were more diverse with the Ks of these layers either increasing or decreasing during a specific Vp of surfactant solution injection. Although the temporal sequences of the increase/decrease were highly random, an increase dominated the Ks variations of the 1–3 cm and 3–5 cm layers. Further, after 4-Vp (2-Vp for Greenson) surfactant solution injections, both layers ended up with higher Ks than before the surfactant solution injection, except several occasions in the Sparta columns. Here, the Ks variations of the remaining three layers, i.e., 5–7 cm, 7–9 cm, and 9–10 cm, were more likely to vary. Both the increase and decrease had opportunities to dominate the variations, and even the same layer among replicate columns may have ended up with increased, decreased, or basically unchanged Ks.
Further, given the relationship between the overall Ks of a column and those of the layers (Equation (1)), the Ks variation of a column can also be composed by Ks variation in each layer, as shown in Equation (2). Therefore, the contribution of a soil layer to overall Ks variation of a column can be estimated, by Equation (3).
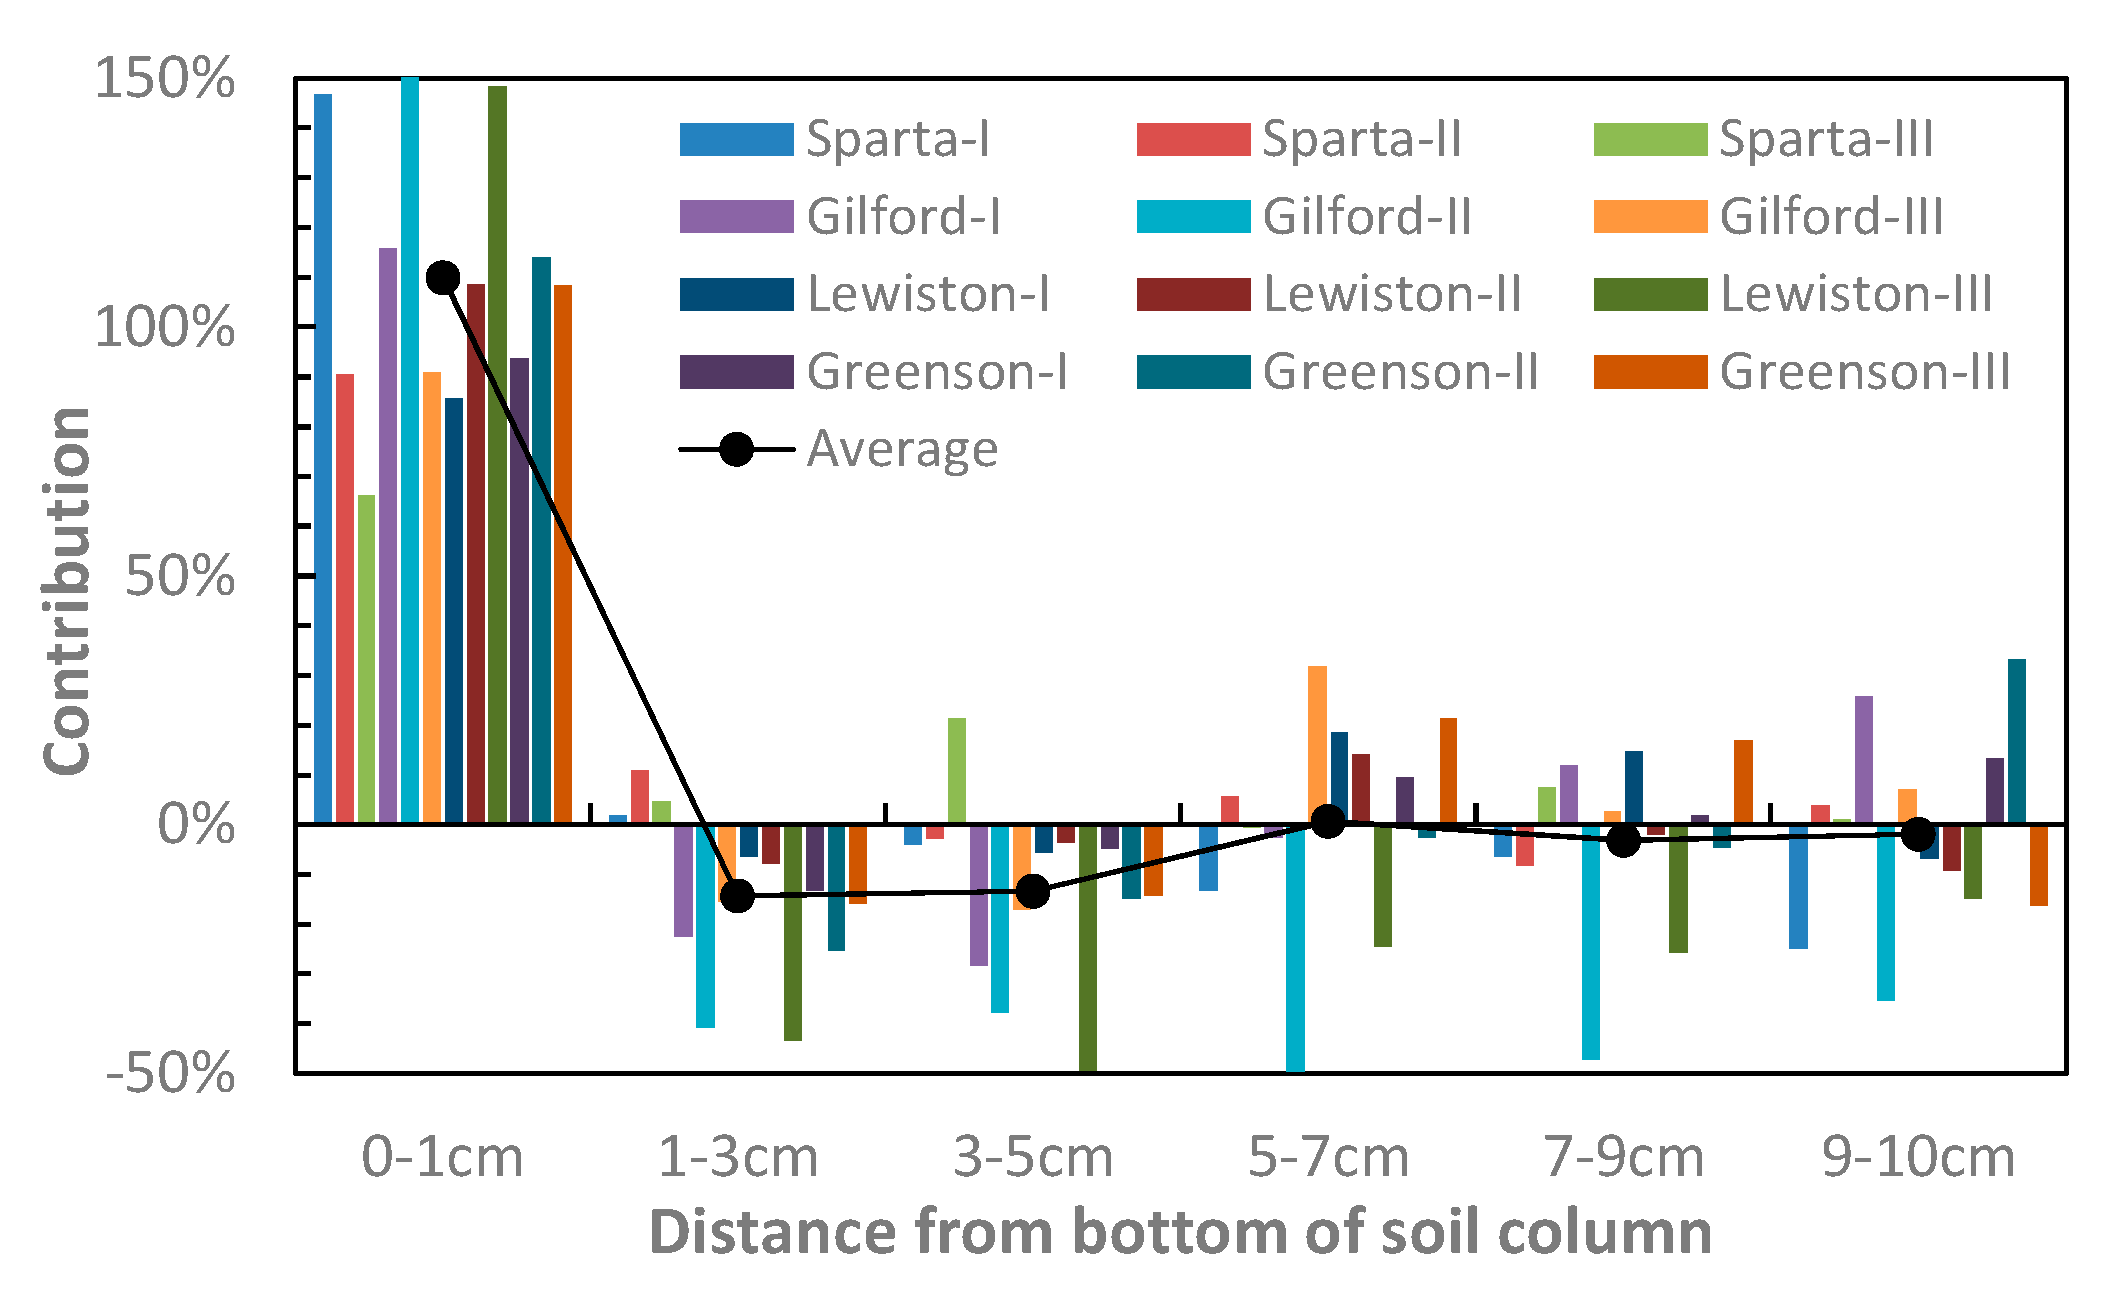
Figure 5 indicates that Ks variations of the columns were dominantly controlled by the 0–1 cm layer, the contribution of which to the Ks reduction was 115% on average, and was no less than 82% among the 12 columns. Since the Ks of the 1–3 cm and 3–5 cm layers increased in most columns during surfactant solution injections, their contributions were mostly negative, with the approximate average values of −14% and −15%, respectively. The contributions of the remaining three layers, i.e., 5–7 cm, 7–9 cm, and 9–10 cm, swung in both negative and positive directions, indicating an uncertain influence of the surfactant on their hydraulic properties. Nevertheless, the average contributions of these three layers were 0.7%, −3.3%, and −2.0%, respectively, and relevant standard deviations were all less than 20%. From these data we may conclude with some confidence that surfactant is not likely to significantly influence Ks of these layers.
4. Discussion
With regard to overall Ks of soil columns, the reductions from the application of an anionic surfactants have been widely reported elsewhere [4,20,25]. In most cases, these reductions were attributed to (1) the collapse of soil aggregates due to the adsorption of the surfactant on minerals and/or high SAR, which caused pore clogging by the displaced particles [4,15,25,26,27]; and (2) pore clogging by surfactant precipitation when the divalent cations such as Ca2+ and Mg2+ were contained in soils [30,31,32]. However, our experiments revealed that the variations in Ks variations could differ among the layers. Our findings suggest that the reasons for the reductions noted above may not fully explain the observed phenomena or, at least, they may not be the dominant causes in many cases.
Specifically, the surfactant precipitation may not have been significant in our soil columns. Although the contents of divalent cations (Ca2+ and Mg2+) in Lewiston and Greenson were times higher than those in Sparta and Gilford (Table 1), they were at least two orders of magnitude lower than those in the soils used by Liu and Roy (1995), who observed significant pore clogging induced by surfactant precipitation [20]. Moreover, since the soil columns were injected with 1.2–2.5 Vp of 1 mM KCl solution at the beginning of tests, divalent cations were readily released from soil particles due to cation exchange between soil and K+, and were then flushed out, resulting in even lower contents of divalent cations upon surfactant solution injections. In fact, although Ks reduction processes were different among soil types (Figure 2), the extent of Ks reduction did not increase with the content of divalent cations; e.g., relative Ks reduction of Lewiston was much less than that of Sparta after 4-Vp surfactant solution injection (4.3% V.S. 61.8% by replicates averages, Figure 2), indicating an unimportant role of surfactant precipitation in Ks variations in our experiment.
The collapse of soil aggregates and particle dispersion are inevitable in the presence of anionic surfactant. Regarding individual soil particles, the presumably laminar flow in the soil pores was not able to flush them upwards into effluents; instead, small clayey particles were likely to percolate downward by gravity, while leaving behind the coarse particles. Consequently, a densely structured layer would then form at the bottom while the porosity of the above layers would in turn increase. Such an increase could, at least partially, explain the dramatic Ks reduction of the 0–1 cm layer, and the general Ks increase of the 1–3 cm and 3–5 cm layers (Figure 4). Specifically, after 4-Vp (2-Vp for Greenson) surfactant injection, the relative Ks increases of the 1–5 cm layer were −12.4%, 29.8%, 82.3%, and 39.5% for Sparta, Gilford, Lewiston, and Greenson, respectively, by replicate averages. These values show an increasing trend with higher clay contents, which is in accordance with the results of the experiments conducted by Gardner and Arias (2000) [37].
Further, Gardner and Arias (2000) confirmed swelling of the clay in presence of surfactant, which would cause a net reduction in the available pore space, and consequently decrease of Ks [37]. Therefore, the surfactant-clay interaction may result in Ks reduction by both transport and swelling of clayey particles, and the later was regarded as the primary mechanism in Gardner and Arias’ (2000) study. However, in this study, clayey particles were more likely to percolate downward and precipitate in the bottom layer of the columns, rather than being flushed out as occurred in Gardner and Arias’ (2000) experiments, hence the transport of clayey particles and consequently pore clogging should have played a more prominent role in Ks reduction than in Gardner and Arias’ (2000) experiments, and further investigation is needed to distinguish the roles of transport and swelling of clayey particles in Ks reduction showed in this study.
Meanwhile, lots of studies have revealed Ks reduction caused by bioclogging [38,39]. Bacteria colonizing in soils cover pore walls with biofilms in which the cells are intimately associated with a meshwork of exopolymer of glycocalyx, resulting in less pore space for water flow, and the exopolymer is also likely to cause changes in the swelling properties of soils and the dispersion of colloidal particles [40]. At the same time, bacterial respiration will release air bubbles entrapped in soils [40], which may leading to Ks reduction [41]. In spite that, biocologging was rarely mentioned in previous studies related to the influence of surfactant on hydraulic properties of soils. This is basically because nutrients for bacteria activities is strictly required. For example, bacteria is more likely to colonize close to the inlet of nutrients so as to get more energy and chemicals, and inappropriate nitrogen/carbon ration will inhibit bacteria activities [39,40]. However, in this study the soil columns could hardly be regarded as pleasant for bacterial activities. Nitrogen was basically deprived in the injected solutions, moreover, the bacteria that can cause clogging may not be the winner in the competition among colonies. From this point of view, although bioclogging cannot be absolutely excluded from the reasons for Ks reduction, it ought not to be prominent in this study.
To some extent, the 0–1 cm layers in our soil columns are similar to the colmation layer caused by sewer exfiltration. This colmation layer usually has a thickness ranging from millimeters to centimeters [42,43,44], with a perpetual and extremely low permeability [33]. This low permeability has been traditionally attributed to pore clogging caused by organic particles contained in sewage [45]. However, Nikpay et al. (2015) recently reported that the adsorption of surfactant, which is also contained in sewage, may also contribute to soil pore clogging [46]. They suggested that regardless of the surfactant concentration in the solution, and no matter whether the surfactant is in monomer or in micelle forms, the surfactant will aggregate at the surface of soil particles by layers, resulting in a narrower pathway for water flow, and thus reduced Ks. A stable thickness of the surfactant aggregation layer will be reached when adhesive forces and hydrodynamic drag on surfactant molecules are equal, and a crystalline layer will start to form afterwards. This creation of the layer may also have occurred in our soil columns when the surfactant was adsorbed primarily on particles close to the inlet of flow. The stable aggregation layer may have been reached and crystallization may have occurred [47], given the decreasing flow rate and the continuous surfactant solution supply with constant concentration.
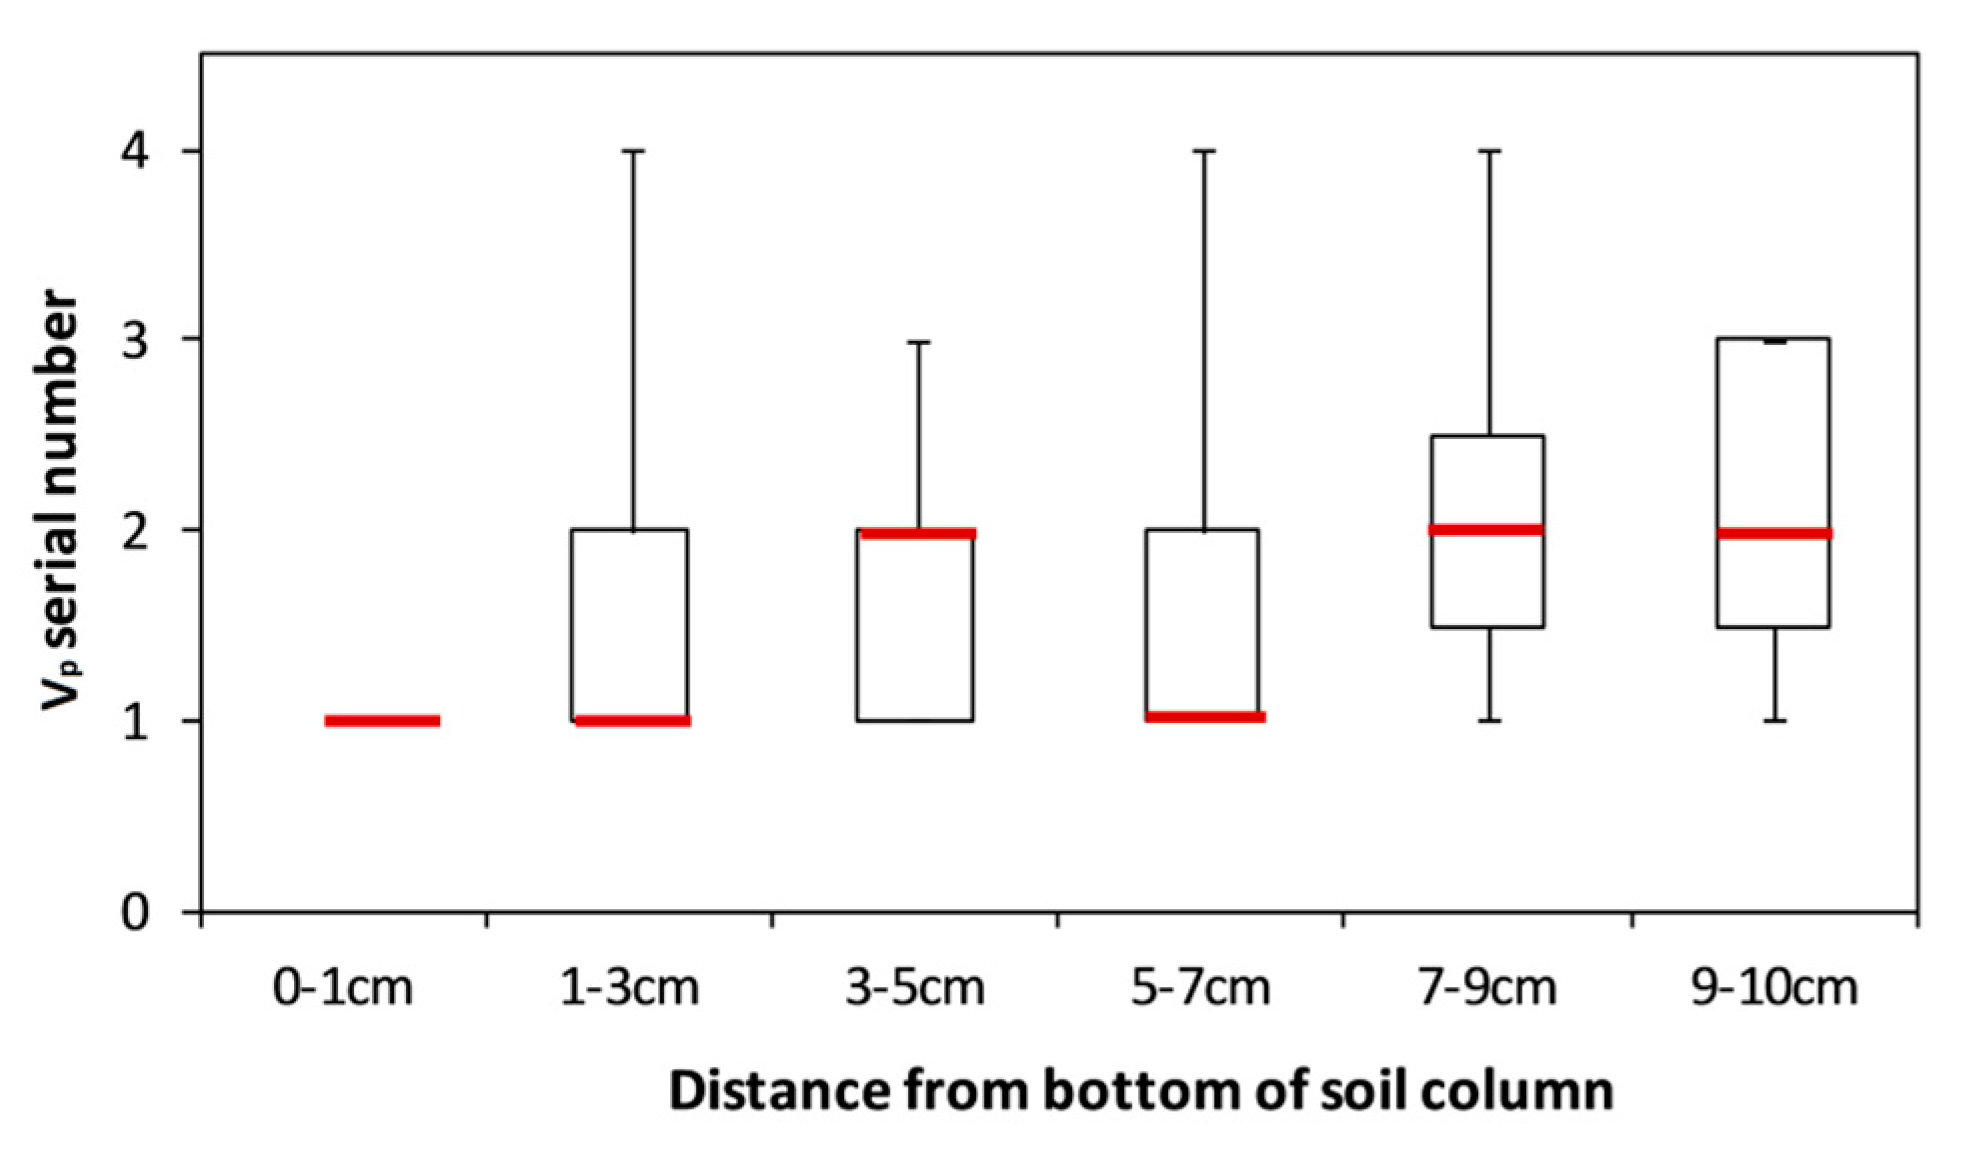
The pore volume serial number of surfactant solution, shown in Figure 6, indicates the greatest change in the Ks of each layer. The largest change in the 0–1 cm layer always occurred during the first Vp of surfactant solution, with the time generally postponed with an increasing distance from the bottom so that the greatest Ks change would occur in these layers. Since the influences of the surfactant on the hydraulic properties is stronger at higher concentrations [3], we can further confirm that the surfactant was unevenly distributed in the column, and also decreased with a distance from the inlet of flow, a process also suggested by Nikpay et al. (2015) [46]. Therefore, the surfactant may not have been able to exert an influence on the soil at a relatively distant location from the inlet of flow within a limited time. Presumably, influence best explains why variance of the Ks of the 5–10 cm layers was so uncertain, but which exhibited a constancy after averaging all of the testing columns.
The discussion above may also give some implications on the variations of the column overall Ks. Without exception, Ks of the 0–1 cm layer in all columns showed decreasing reduction rates versus effluent volume (Figure 4). Ks variation rates of other layers also tended to decrease after reaching their peaks (Figure 6). Therefore, we could expect that after a period of time, Ks variation of all layers would tend to be slower, and overall Ks of the columns would tend to be constant. However, Figure 2 shows that by the end of tests, only the overall Ks of Sparta columns tended to be constant, while overall Ks reduction rates of the other columns generally kept constant or even increased. This inconstancy may be ascribed to the different volumes of surfactant solution injection. Since the volumes of surfactant solution injection of Sparta columns were the highest, Ks of these columns were more likely to reach constant.
Despite the shared features of the columns on Ks variations discussed above, uncertainties of the results cannot be ignored. For example, although Ks of all columns resulted in reduction at the end of the experiment, stabilization and even increase of Ks at the beginning of the surfactant injection was also observed (Figure 2). For Ks of the layers, only the 0–1 cm of all columns showed continuous decrease during tests, while for other layers, Ks may periodically increase or decrease, without synchronization even among triplicates (Figure 4). This may due to non-uniform compaction of the soil column despite considerably close bulk densities among triplicates, and the difference among triplicates may have been enlarged by soil structure deformation during tests. In this circumstance, study with more replicate columns is needed in future, so as to decrease the uncertainty of the results and increase repeatability of the measurements.
5. Conclusions
The effects of the anionic surfactant Aerosol 22 on Ks of two types of soils, i.e., loamy sand and sandy loam, were analyzed by column tests in this study. Results showed that the Ks of all columns decreased with a continuous injection of surfactant solution. Nevertheless, the Ks of the columns were found to stabilize and even increase at the initial stage of the surfactant solution injections, due to different Ks variations in the layers at different distances from the inlet of flow which was at the bottom of the soil column.
Specifically, the Ks of the 0–1 cm layers in all columns decreased continuously, terminating with two orders of magnitude Ks reductions after 2–4 pore volumes of surfactant solution injection. In contrast, the Ks of the 1–3 cm and 3–5 cm layers fluctuated during surfactant solution injection but ended up with an overall increase, while the Ks variations of the layers with distances between 5 and 10 cm from the inlet were highly uncertain and were minimal by the columns’ average. Contributions of the 0–1 cm, 1–3 cm, 3–5 cm, 5–7 cm, 7–9 cm, and 9–10 cm layers to the Ks reductions of the columns were 115%, −15%, −14%, 0.7%, −3.3%, and −2.0%, respectively by the columns’ average, indicating a dominant control of the 0–1 cm layer on Ks variations of columns.
Hypothetically, we attributed the Ks variations to the swelling of the clay, the collapse of soil aggregates and consequent particle displacements due to surfactant adsorption, which resulted in pore clogging in the bottom 0–1 cm layer and higher porosities in the layers above. Meanwhile, adsorption of surfactant aggregates and crystallization may also have contributed to pore clogging in the bottom layer. In this case the soil column acted as a filter, and surfactant concentration may have decreased with distance from the inlet, resulting in fewer effects on the layers at a larger distance from the inlet.
It should also be noted that uncertainties of the results cannot be ignored, Ks of most layers periodically increased or decreased, without synchronization even among triplicates. Hence study with more replicate columns is needed in future, so as to decrease the uncertainty of the results and increase repeatability of the measurements.
Acknowledgments
This work was supported by the Key Laboratory of Water Cycle and Related Land Surface Processes, the Institute of Geographic Sciences and Natural Resources Research, Chinese Academy of Sciences under Grant number WL2015004, and by the U.S. Department of Agriculture, National Institute of Food and Agriculture (NIFA), National Research Initiative (NRI) Competitive Grant Program under Grant numbers 2008-35102-19159 and 2008-35102-20653. We would also wish to acknowledge the support of the National Science Foundation of China, and the foundation of State Key Laboratory of Hydroscience and Engineering of Tsinghua University (2016-KY-03).
Author Contributions
Z.P., C.D. and P.B. conceived and designed the experiments; Z.P. performed the experiments; Z.P. and C.D. analyzed the data; Z.P. wrote the paper, C.D., F.T. and H.H. revised the paper.
Conflicts of Interest
The authors declare no conflict of interest. The founding sponsors had no role in the design of the study; in the collection, analyses, or interpretation of data; in the writing of the manuscript, and in the decision to publish the results.
References
- Al-Jayyousi, O.R. Greywater reuse: Towards sustainable water management. Desalination 2003, 156, 181–192. [Google Scholar] [CrossRef]
- Hamilton, A.J.; Stagnitti, F.; Xiong, X.; Kreidl, S.L.; Benke, K.K.; Maher, P. Wastewater irrigation: The state of play. Vadose Zone J. 2007, 6, 823–840. [Google Scholar] [CrossRef]
- Abu-Zreig, M.; Rudra, R.P.; Dickinson, W.T. Effect of application of surfactants on hydraulic properties of soils. Biosyst. Eng. 2003, 84, 363–372. [Google Scholar] [CrossRef]
- Misra, R.K.; Sivongxay, A. Reuse of laundry greywater as affected by its interaction with saturated soil. J. Hydrol. 2009, 366, 55–61. [Google Scholar] [CrossRef]
- Eriksson, E.; Auffarth, K.; Eilersen, A.M.; Henze, M.; Ledin, A. Household chemicals and personal care products as sources for xenobiotic organic compounds in grey wastewater. Water SA 2003, 29, 135–146. [Google Scholar] [CrossRef]
- Brunner, P.H.; Capri, S.; Marcomini, A.; Giger, W. Occurrence and behavior of linear alkylbenzenesulfonates, nonylphenol, nonylphenol monophenol and nonylphenol diethoxylates in sewage and sewage-sludge treatment. Water Res. 1988, 22, 1465–1472. [Google Scholar] [CrossRef]
- Berna, J.L.; Moreno, A.; Ferrer, J. The behavior of las in the environment. J. Chem. Technol. Biotechnol. 1991, 50, 387–398. [Google Scholar] [CrossRef]
- Bruno, F.; Curini, R.; Di, C.A.; Fochi, I.; Nazzari, M. Determination of surfactants and some of their metabolites in untreated and anaerobically digested sewage sludge by subcritical water extraction followed by liquid chromatography-mass spectrometry. Environ. Sci. Technol. 2002, 36, 4156–4161. [Google Scholar] [CrossRef] [PubMed]
- Cirelli, A.F.; Ojeda, C.; Castro, M.J.L.; Salgot, M. Surfactants in sludge-amended agricultural soils: A review. Environ. Chem. Lett. 2008, 6, 135–148. [Google Scholar] [CrossRef]
- Fernandez, P.; Fernandez, P.; Suter, M.J.F.; Giger, W. Determination of the quaternary ammonium surfactant ditallowdimethylammonium in digested sludges and marine sediments by supercritical fluid extraction and liquid chromatography with postcolumn ion-pair formation. Anal. Chem. 1996, 68, 921–929. [Google Scholar] [CrossRef] [PubMed]
- Chatterjee, R. Fresh produce from wastewater. Environ. Sci. Technol. 2008, 42, 7732. [Google Scholar] [CrossRef] [PubMed]
- Liwarska-Bizukojc, E.; Miksch, K.; Malachowskajutsz, A.; Kalka, J. Acute toxicity and genotoxicity of five selected anionic and nonionic surfactants. Chemosphere 2005, 58, 1249–1253. [Google Scholar] [CrossRef] [PubMed]
- Greek, B.F. Sales of detergents growing despite recession. Chem. Eng. News 1991, 69, 25. [Google Scholar] [CrossRef]
- Ying, G.G. Fate, behavior and effects of surfactants and their degradation products in the environment. Environ. Int. 2006, 32, 417–431. [Google Scholar] [CrossRef] [PubMed]
- Kuhnt, G. Behavior and fate of surfactants in soil. Environ. Toxicol. Chem. 1993, 12, 1813–1820. [Google Scholar] [CrossRef]
- Wiel-Shafran, A.; Ronen, Z.; Weisbrod, N.; Adar, E.; Gross, A. Potential changes in soil properties following irrigation with surfactant-rich greywater. Ecol. Eng. 2006, 26, 348–354. [Google Scholar] [CrossRef]
- Pinto, U.; Maheshwari, B.L.; Grewal, H.S. Effects of greywater irrigation on plant growth, water use and soil properties. Res. Conserv. Recycl. 2010, 54, 429–435. [Google Scholar] [CrossRef]
- Travis, M.J.; Wielshafran, A.; Weisbrod, N.; Adar, E.; Gross, A. Greywater reuse for irrigation: Effect on soil properties. Sci. Total Environ. 2010, 408, 2501–2508. [Google Scholar] [CrossRef] [PubMed]
- Laha, S.; Tansel, B.; Ussawarujikulchai, A. Surfactant-soil interactions during surfactant-amended remediation of contaminated soils by hydrophobic organic compounds: A review. J. Environ. Manag. 2008, 90, 95–100. [Google Scholar] [CrossRef] [PubMed]
- Liu, M.W.; Roy, D. Surfactant-induced interactions and hydraulic conductivity changes in soil. Waste Manag. 1995, 15, 463–470. [Google Scholar] [CrossRef]
- Mulligan, C.N.; Yong, R.N.; Gibbs, B.F. Surfactant-enhanced remediation of contaminated soil: A review. Eng. Geol. 2001, 60, 371–380. [Google Scholar] [CrossRef]
- Travis, M.J.; Weisbrod, N.; Gross, A. Accumulation of oil and grease in soils irrigated with greywater and their potential role in soil water repellency. Sci. Total Environ. 2008, 394, 68–74. [Google Scholar] [CrossRef] [PubMed]
- Law, J.P., Jr.; Kunze, G.W. Reaction of surfactants with montmorillonite: Adsorption mechanisms. Soil Sci. Soc. Am. Proc. 1965, 30, 321–332. [Google Scholar] [CrossRef]
- Lehrsch, G.A.; Sojka, R.E.; Reed, J.L.; Henderson, R.A.; Kostka, S.J. Surfactant and irrigation effects on wettable soils: Runoff, erosion, and water retention responses. Hydrol. Process. 2011, 25, 766–777. [Google Scholar] [CrossRef]
- Mingorance, M.D.; Gálvez, J.F.; Peña, A.; Barahona, E. Laboratory methodology to approach soil water transport in the presence of surfactants. Colloids Surf. A-Physicochem. Eng. Asp. 2007, 306, 75–82. [Google Scholar] [CrossRef]
- Eltaif, N.I.; Gharaibeh, M.A. Effects of single and mixed ion solutions on hydraulic and physical properties of a clay soil. Water Air Soil Pollut. 2007, 181, 297–302. [Google Scholar] [CrossRef]
- Abusharar, T.M.; Salameh, A.S. Reductions in hydraulic conductivity and infiltration rate in relation to aggregate stability and irrigation water turbidity. Agric. Water Manag. 1995, 29, 53–62. [Google Scholar] [CrossRef]
- Chu, W.; So, W.S. Modeling the two stages of surfactant-aided soil washing. Water Res. 2001, 35, 761–767. [Google Scholar] [CrossRef]
- Grasso, D.; Subramaniam, K.; Pignatello, J.J.; Yang, Y.; Ratté, D. Micellar desorption of polynuclear aromatic hydrocarbons from contaminated soil. Colloids Surf. A-Physicochem. Eng. Asp. 2001, 194, 65–74. [Google Scholar] [CrossRef]
- Celik, M.; Goyal, A.; Maney, E.; Somasundaran, P. Role of surfactant precipitation and redissolution in the adsorption of sulfonate on minerals. Soc. Pet. Eng. J. 1978, 24, 233–239. [Google Scholar]
- Stellner, K.L.; Scamehorn, J.F. Surfactant precipitation in aqueous-solutions containing mixtures of anionic and nonionic surfactants. J. Am. Oil Chem. Soc. 1986, 63, 566–574. [Google Scholar] [CrossRef]
- Stellner, K.L.; Scamehorn, J.F. Hardness tolerance of anionic surfactant solutions. 1. anionic surfactant with added mono-valent electrolyte. Langmuir 1989, 5, 70–77. [Google Scholar] [CrossRef]
- Nikpay, M.; Lazik, D.; Krebs, P. Water displacement by surfactant solution: An experimental study to represent wastewater loss from sewers to saturated soil. Int. J. Environ. Sci. Technol. 2015, 12, 2447–2454. [Google Scholar] [CrossRef]
- Gee, G.W.; Bauder, J.W. Particle size analysis. In Methods of Soil Analysis, Part 1. Physical and Mineralogical Methods; Klute, A., Ed.; American Society of Agronomy and Soil Science Societry of America: Madison, WI, USA, 1986; pp. 383–411. [Google Scholar]
- Rhoades, J.D. Salinity: Electrical conductivity and total dissolved solids. In Methods of Soil Analysis. Part 3 Chemical Methods; Sparks, D.L., Ed.; Anmerican Society of Agronomy and Soil Science Society of America: Madison, WI, USA, 1996; pp. 417–435. [Google Scholar]
- Rangel, D.P.; Superak, C.; Bielschowsky, M.; Farris, K.; Falconer, R.E.; Baveye, P.C. Rapid Prototyping and 3-D Printing of Experimental Equipment in Soil Science Research. Soil Sci. Soc. Am. J. 2013, 77, 54–59. [Google Scholar] [CrossRef]
- Gardner, K.H.; Arias, M.S. Clay Swelling and Formation Permeability Reductions Induced by a Nonionic Surfactant. Environ. Sci. Technol. 2000, 34, 160–166. [Google Scholar] [CrossRef]
- Baveye, P.; Vandevivere, P.; Hoyle, B.L.; Deleo, P.C.; de Lozasa, D.S. Environmental impact and mechanisms of the biological clogging of saturated soils and aquifer materials. Crit. Rev. Environ. Sci. Technol. 1998, 28, 123–191. [Google Scholar] [CrossRef]
- Hallett, P.D.; Young, I.M. Changes to water repellence of soil aggregates caused by substrate-induced microbial activity. Eur. J. Soil Sci. 1999, 50, 35–40. [Google Scholar] [CrossRef]
- Vandevivere, P.; Baveye, P. Saturated hydraulic conductivity reduction caused by aerobic bacteria in sand columns. Soil Sci. Soc. Am. J. 1992, 56, 1–13. [Google Scholar] [CrossRef]
- Faybishenko, B.A. Hydraulic Behavior of Quasi-Saturated Soils in the Presence of Entrapped Air: Laboratory Investigations. Water Resour. Res. 1995, 31, 2421–2435. [Google Scholar] [CrossRef]
- Rauch, W.; Stegner, T. The colmation of leaks in sewer systems during dry weather flow. Water Sci. Technol. 1994, 30, 205–210. [Google Scholar]
- Vollertsen, J.; Hvitved-Jacobsen, T. Exfiltration from gravity sewers: A pilot scale study. Water Sci. Technol. 2003, 47, 69–76. [Google Scholar] [PubMed]
- Blackwood, D.J.; Gilmour, D.J.; Ellis, J.B.; Revitt, D.M.; Stainer, A. Exfiltration from sewers; is it a serious problem? In Proceedings of the 10th International Conference on Urban Drainage, Copenhagen, Denmark, 21–26 August 2005. [Google Scholar]
- Rutscha, M.; Rieckermannb, J.; Cullmannc, J.; Ellisd, J.B.; Vollertsene, J.; Krebsa, P. Towards a better understanding of sewer exfiltration. Water Res. 2008, 42, 2385–2394. [Google Scholar] [CrossRef] [PubMed]
- Nikpay, M.; Lazik, D.; Krebs, P. Permeability changes by surfactant solution: An experimental study to represent wastewater loss from sewers to saturated soil. Environ. Earth Sci. 2015, 73, 8443–8450. [Google Scholar] [CrossRef]
- Giles, C.H.; Macewan, T.; Nakhwa, S.; Smith, D. Studies in adsorption. Part XI. A system of classification of solution adsorption isotherms, and its use in diagnosis of adsorption mechanisms and in measurement of specific surface areas of solids. J. Chem. Soc. 1960, 786, 3973–3993. [Google Scholar] [CrossRef]
Figure 1.
Apparatus for measuring saturated hydraulic conductivity of testing soils.

Figure 2.
Variations of saturated hydraulic conductivity (Ks) of each testing column. (a) Sparta; (b) Gilford; (c) Lewiston; (d) Greenson.
Figure 2.
Variations of saturated hydraulic conductivity (Ks) of each testing column. (a) Sparta; (b) Gilford; (c) Lewiston; (d) Greenson.

Figure 3.
Ks of soil layers and the columns before surfactant solution injections. The blue bars represent arithmetic mean of all 6 layers of each column, and the error bars represent relevant standard deviations.
Figure 3.
Ks of soil layers and the columns before surfactant solution injections. The blue bars represent arithmetic mean of all 6 layers of each column, and the error bars represent relevant standard deviations.
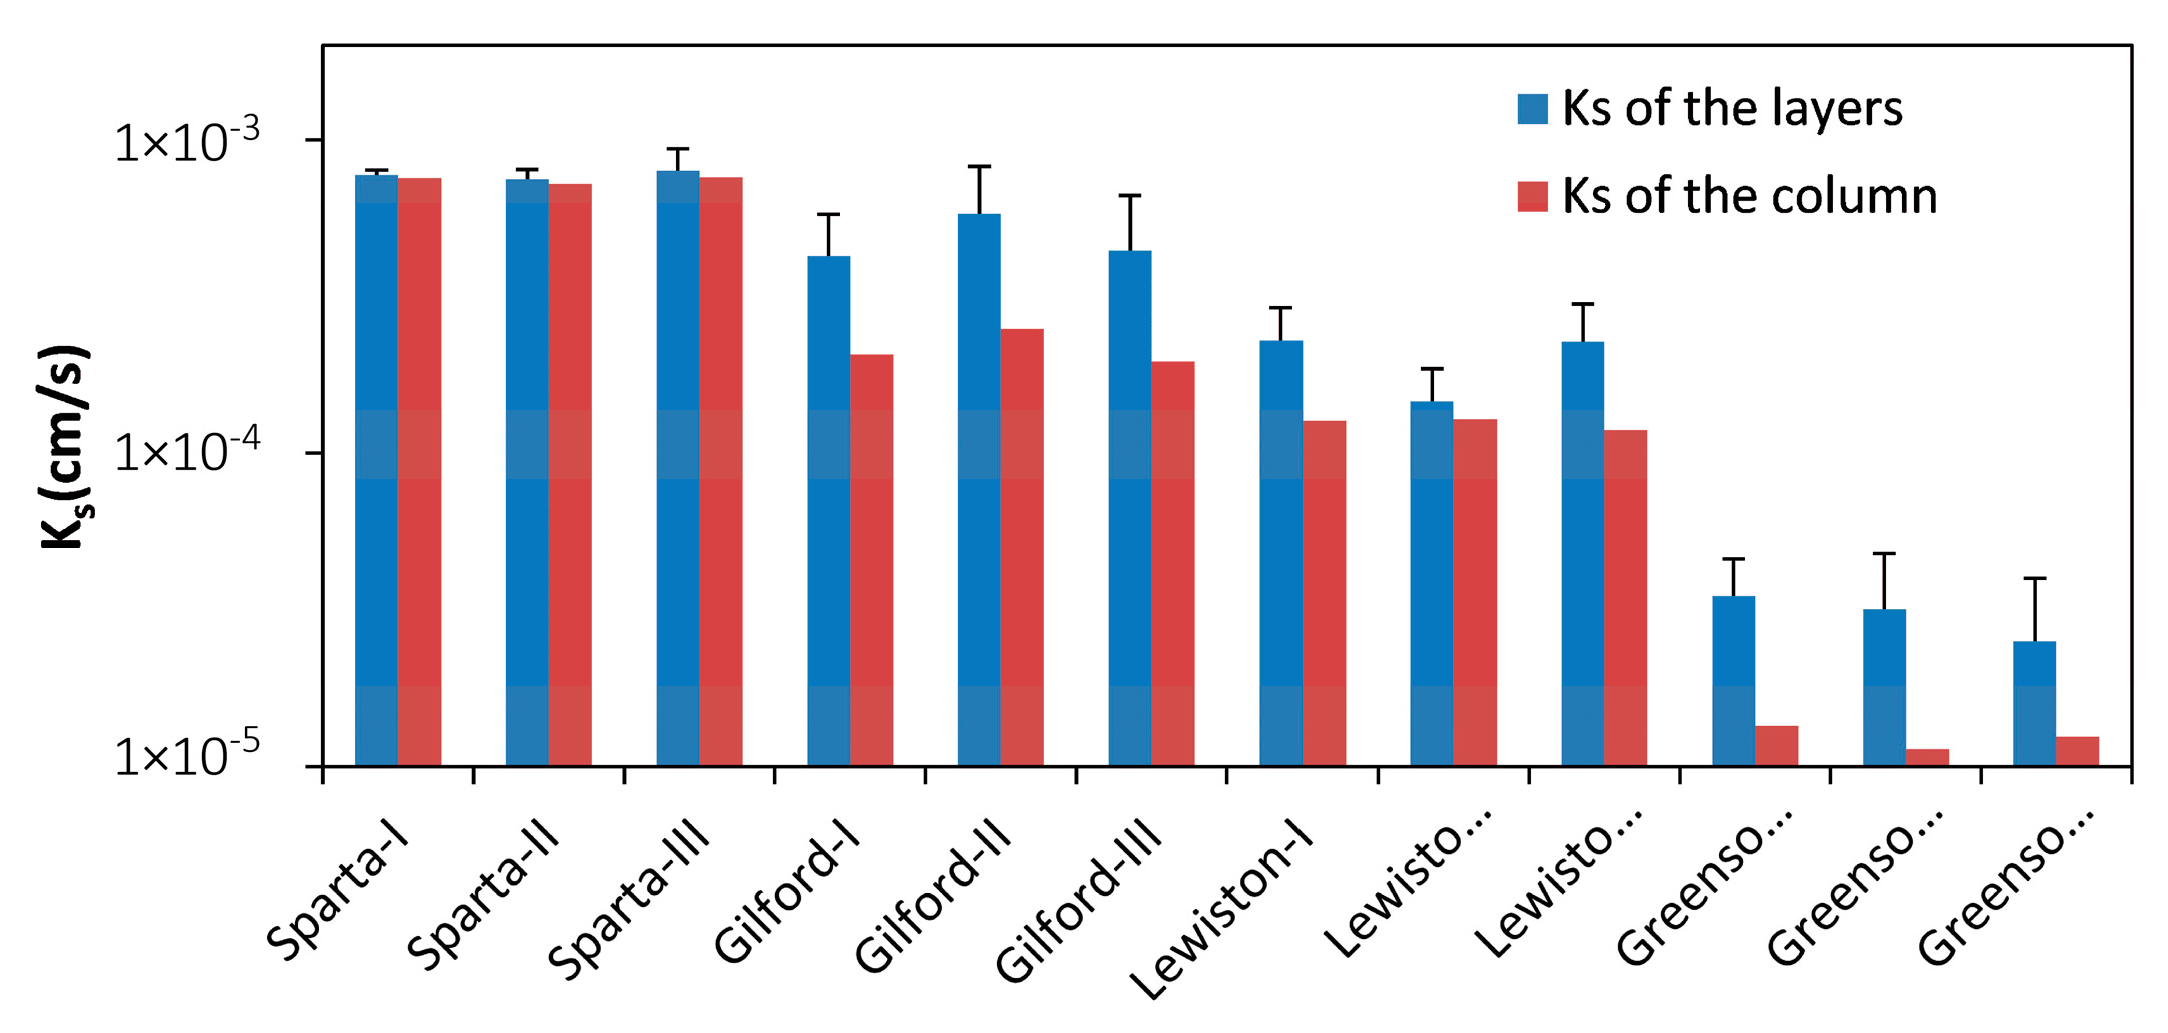
Figure 4.
Ks variations of each soil layer during surfactant solution injections. The colored bars represent the variations during each pore volume (Vp) surfactant solution injection, while the black dots represent variations after 4-Vp surfactant solution injection for Sparta, Gilford, and Lewiston, and 2-Vp for Greenson. Ks0 is the temporal average Ks of a soil layer before surfactant solution was injected.


Figure 5.
The contribution of each soil layer in the variations of the overall Ks of columns after an injection of a 4-Vp surfactant solution for Sparta, Gilford, and Lewiston, and a 2-Vp injection solution for Greenson. Since the Ks of all columns declined during surfactant solution injections (Figure 2), positive contribution means Ks decline of a soil layer, while the negative contribution means an increase in Ks.

Figure 6.
Pore volume serial number of surfactant solution during which Ks exhibited the most changes. Red bars represent the median values. The data of the Greeson columns was not included, since only a 2-Vp surfactant solution was injected. In the Greenson columns, the Ks of the 0–1 cm and 1–3 cm were more likely to change most in the first Vp of the surfactant solution, while the Ks in the 3–5 cm, 5–7 cm, 7–9 cm, and 9–10 cm were more likely to occur in the second Vp of surfactant solution (see Figure 4).

Table 1.
Physical and chemical properties of soils.
| Properties | Soil Series * | ||||
|---|---|---|---|---|---|
| Sparta | Gilford | Lewiston | Greenson | ||
| Composition and texture | Sand (%) | 82 | 84.4 | 79.7 | 66.9 |
| Silt (%) | 8.4 | 7.7 | 7.7 | 13.6 | |
| Clay (%) | 9.5 | 7.9 | 12.5 | 19.5 | |
| Organic matter (%) | 3.4 | 4.2 | - ** | 3.8 | |
| USDA texture | Loamy sand | Loamy sand | Sandy loam | Sandy loam | |
| Chemical properties | pH | 6.9 | 5.2 | 7.5 | 7.4 |
| EC(dS/m) | 0.36 | 0.68 | 1.01 | 0.75 | |
| CEC (meq/100g) | 8.6 | 8.4 | 11.5 | 17.5 | |
| Sodium (mg/kg) | 3.27 | 1.87 | 11.29 | 13.55 | |
| Magnesium (mg/kg) | 4.84 | 5.71 | 14.91 | 12 | |
| Calcium (mg/kg) | 9.36 | 14.64 | 37.1 | 42.9 | |
| SAR | 0.22 | 0.10 | 0.39 | 0.47 | |
Notes: * The Sparta and Lewiston series of soils were collected from Kankakee County, Illinois and the Gilford and Greenson series of soils were collected from Cache County, Utah.; ** Organic matter content of Lewiston is not available.
Table 2.
Specifications of Aerosol 22.
| Test | Specification | Molecule Formula |
|---|---|---|
| Appearance | Liquid |  |
| Molar weight (g) | 742 | |
| CMC (%/wt) | 0.04 | |
| Ca tolerance (ppm, CaCO3 at 0.5%) | 200 | |
| pH (As is) | 7.0–8.0 | |
| Surface tension (min·mN/m) | 36 |
© 2017 by the authors. Licensee MDPI, Basel, Switzerland. This article is an open access article distributed under the terms and conditions of the Creative Commons Attribution (CC BY) license (http://creativecommons.org/licenses/by/4.0/).
Share and Cite
MDPI and ACS Style
Peng, Z.; Darnault, C.J.G.; Tian, F.; Baveye, P.C.; Hu, H. Influence of Anionic Surfactant on Saturated Hydraulic Conductivity of Loamy Sand and Sandy Loam Soils. Water 2017, 9, 433. https://doi.org/10.3390/w9060433
AMA Style
Peng Z, Darnault CJG, Tian F, Baveye PC, Hu H. Influence of Anionic Surfactant on Saturated Hydraulic Conductivity of Loamy Sand and Sandy Loam Soils. Water. 2017; 9(6):433. https://doi.org/10.3390/w9060433
Chicago/Turabian StylePeng, Zhenyang, Christophe J. G. Darnault, Fuqiang Tian, Philippe C. Baveye, and Hongchang Hu. 2017. "Influence of Anionic Surfactant on Saturated Hydraulic Conductivity of Loamy Sand and Sandy Loam Soils" Water 9, no. 6: 433. https://doi.org/10.3390/w9060433
Note that from the first issue of 2016, this journal uses article numbers instead of page numbers. See further details here.