1. Introduction
Cities in developing countries that are experiencing rapid urbanisation encounter a number of problems due to rapid, unplanned growth. Urban flooding, pollution of water bodies, depletion of ground water, lack of drinking water and improper sewage disposal are some of the water related problems encountered due to unplanned urbanisation. Increased imperviousness due to rapid urban densification, lack of capacity in storm drainage systems, upstream flooding and tidal effects (in delta cities) are regular causes of urban flooding [
1]. Urban flooding increases the risk to life, property damage, and failure of critical infrastructure such as transport, communication and electricity networks as well as other intangible losses. Contaminants in flood can originate from black-water and grey-water or river water [
2]. Solids, organic compounds, specific harmful microorganisms and nutrients are some of the common pollutants found in significant levels in urban runoff [
3]. Some heavy-metal pollutants such as lead, copper, zinc and cadmium are also found in high concentrations in urban runoff [
4]. During the time of flooding high concentrations of BOD
5, COD, SS, TN, TP, Pb and Fe have been found in flood waters not only from densely populated residential watersheds and industrial watersheds but also from undeveloped urban watershed [
5].
Environmental and human impacts due to floods can be mitigated through flood risk management, which includes the three steps: analysis, assessment and mitigation. Risk analysis focuses on previous, current and future flood risks, whereas risk assessment evaluates flood risks due to environmental, social and economic perspectives; and risk reduction provides measures to reduce flood risks [
6]. Resilience and urban flood risk management are seen as the key components that need to be built into urban environments so as to systematically manage urban flood risk in the future [
7,
8]. In addition, the United Nations (UN) recognises city planning and the role of local governments as key factors in dealing with risk reduction so as to build resilient communities and nations [
9]. As a first step in urban flood risk management, policy makers need to understand the flood hazard that can affect the urban environment [
10]. From a public health point of view, ascertaining the impact of urban flooding on health risk is essential in order to ensure a high quality hygienic urban environment [
11].
Capturing the dynamics of water quality in urban water bodies, which is variable with respect to time and space, is difficult [
12,
13]. Previous flood water quality studies in rapidly developing cities such as Can Tho in Vietnam are often limited to dry-weather situations and are done at coarse time scales, such as monthly [
14,
15]. The studies of water quality dynamics during flood events are not often reported in literature. This may be due to the practical difficulties in collecting data during the flood events. Sampling during a flood event may be hazardous to health, life, as well as equipment due to risk of infection due to pathogens, risk of electrocution, risk of drowning, risk of damaging or losing sampling equipment. The other reason might be due to the lack of resource or delegation of resources in terms of human resources. Furthermore, waiting for a flood event to happen in order to conduct an extensive water quality campaign is an expensive task. In the event of flooding, resources are committed to take measures to alleviate the flood damage and monitoring of water quality (for justifiable reasons) becomes secondary. In order to do an extensive water quality sampling during a flood event, elaborate planning arrangements that comprise (i) anticipation of flooding in terms of time of occurrence and place of occurrence; and (ii) logistics, which includes estimating the manpower and equipment required for the sampling exercise, safe deployment and extraction of sampling team, samples and equipment from flooding locations.
This paper provides some insights into the water quality dynamics (both spatial and temporal) during the flood events in the city of Can Tho in Vietnam. The water quality dynamics are determined based on a methodology involving the active measurement of water quality parameters in open waters, sewers and flood water in the streets during the flood event. The understanding of water quality dynamics will help in assessing the health risks during and after the flood event; and in the planning of measures aimed at improving the water quality.
2. Methods
In order to understand the dynamics of urban flood water quality, (i) water quality parameters; (ii) hydraulic parameters such as water level, discharge in open water bodies such as lakes and canals; (iii) depth of flood water in streets; and (iv) duration of flooding are essential. Measuring the hydraulic and water quality parameters during the flooding requires extensive planning and preparation in terms of forecasting the flood event, ascertaining the critical location of flooding and logistics in terms of mobilizing personal and equipment so as to collect water samples and record hydraulic parameters. The methodology for ascertaining the water quality dynamics during an urban flood comprises the three following main steps:
Step 1—When, where and how will the flooding occur? (Flood anticipation): It is important to ascertain when and where the flooding is going to occur based on accurate forecasts. This information is usually obtained from the national, regional and local meteorological departments that regularly issue warnings about onset of rains, storms and floods. This information is essential for planning the sampling campaign effectively. However, this information often has a considerable degree of uncertainty. Information on severity of flooding (e.g., the starting and ending time of a flood event, its peak occurrence, depth of flooding) based on past observations are essential for determining the critical locations where the sampling has to be carried out and also for taking preventive or precautionary measures during sampling campaigns so that the people executing the campaign remain out of danger.
Step 2—Who will ascertain the characteristics of flood water and how will they do it? (Logistics): It is also imperative to ascertain beforehand the number of personnel and agencies from which they would be sought from to carry out the campaign. A roster of campaign personnel comprising researchers, employees from water utility agencies and from other government departments should be prepared.
Step 3—What are the pollutants in the flood waters? (Water Quality parameters): Water quality parameters should be linked to water quality standards for different purposes like bathing and transportation. BOD, COD, nitrogen, phosphorus, suspended solids, coliform, and
Salmonella are basic parameters to be determined from the water quality samples collected at representative locations (including open water samples flooded and sewer samples) during the campaigns. The sampling, transportation, storage and analysis of water samples should follow a standard (e.g., APHA [
16]) and is provided in
Table S2 of the supplement.
This methodology was applied to collect the water samples in Can Tho, Vietnam during a tidal flood event.
2.1. Study Area
Can Tho is the biggest city in the Mekong delta located on the southwest bank of the Hau River with a total administrative area of 1389 km
2. This includes agricultural areas. Can Tho is Vietnam’s fourth largest city with approximately 1.25 million inhabitants. Can Tho is an important center for commerce, culture, education, and health services in the Mekong Delta [
17]. There has been rapid urbanization in Can Tho during the last two decades. The city has been facing typical urban issues (e.g., flooding and water pollution) during the past, which are likely to continue and increase in the future [
18,
19]. About 10%–15% of the actual built up areas encroaches upon streams and canals, and, as consequence, 70%–75% of the households in Can Tho suffer from the impacts of flooding [
18,
20,
21]. In addition, adverse impacts of flooding in the future is anticipated in Can Tho due to climate change induced sea-level rise, increase of flow in the Mekong and local rainfall increase. A number of flood adaptive measures are being planned to minimise the flood risk in Can Tho [
22].
Water quality is a serious problem in Can Tho, especially during floods. During the flood event on October 2013, the Coliform concentration in river water was found to be between five to 50 times higher than the national standard for surface water quality (QCVN08: 2008/BTNMT) [
23]. Coliform concentrations in the river was also observed to be similar in the sewer during the flooding event [
24]. The surface waters during the event of flooding contained high concentration of pollutants, such as: TN, TP, COD, BOD5, and total Coliforms [
25]. The standard approach of applying dilution factors is no longer valid here due to the similarities observed in pollutant concentrations of surface water and sewage at the time of flooding. Hence, it becomes imperative in the case of Can Tho to understand the dynamics of water quality of flooding. Ninh Kieu district—the urban center of Can Tho—has been chosen as the study area to apply the methodology.
2.2. Where, When and How will the Flooding Occur?
Flooding is a recurrent phenomenon in the Mekong Delta, where the people in rural agricultural areas have been living with the floods [
7]. The floods adversely affect the core urban areas such as Ninh Kieu and Binh Thuy district, when local intense rainfalls or high flow in the Mekong or high tides occur. Sometimes, these drivers coincide to create severe flood events. Can Tho floods at least two to three times a year during the rainy season, inundating the streets with water depths of a few centimetres up to 20 to 30 cm (even up to 50 cm in some places) with a duration ranging from a few minutes to a few hours [
22].
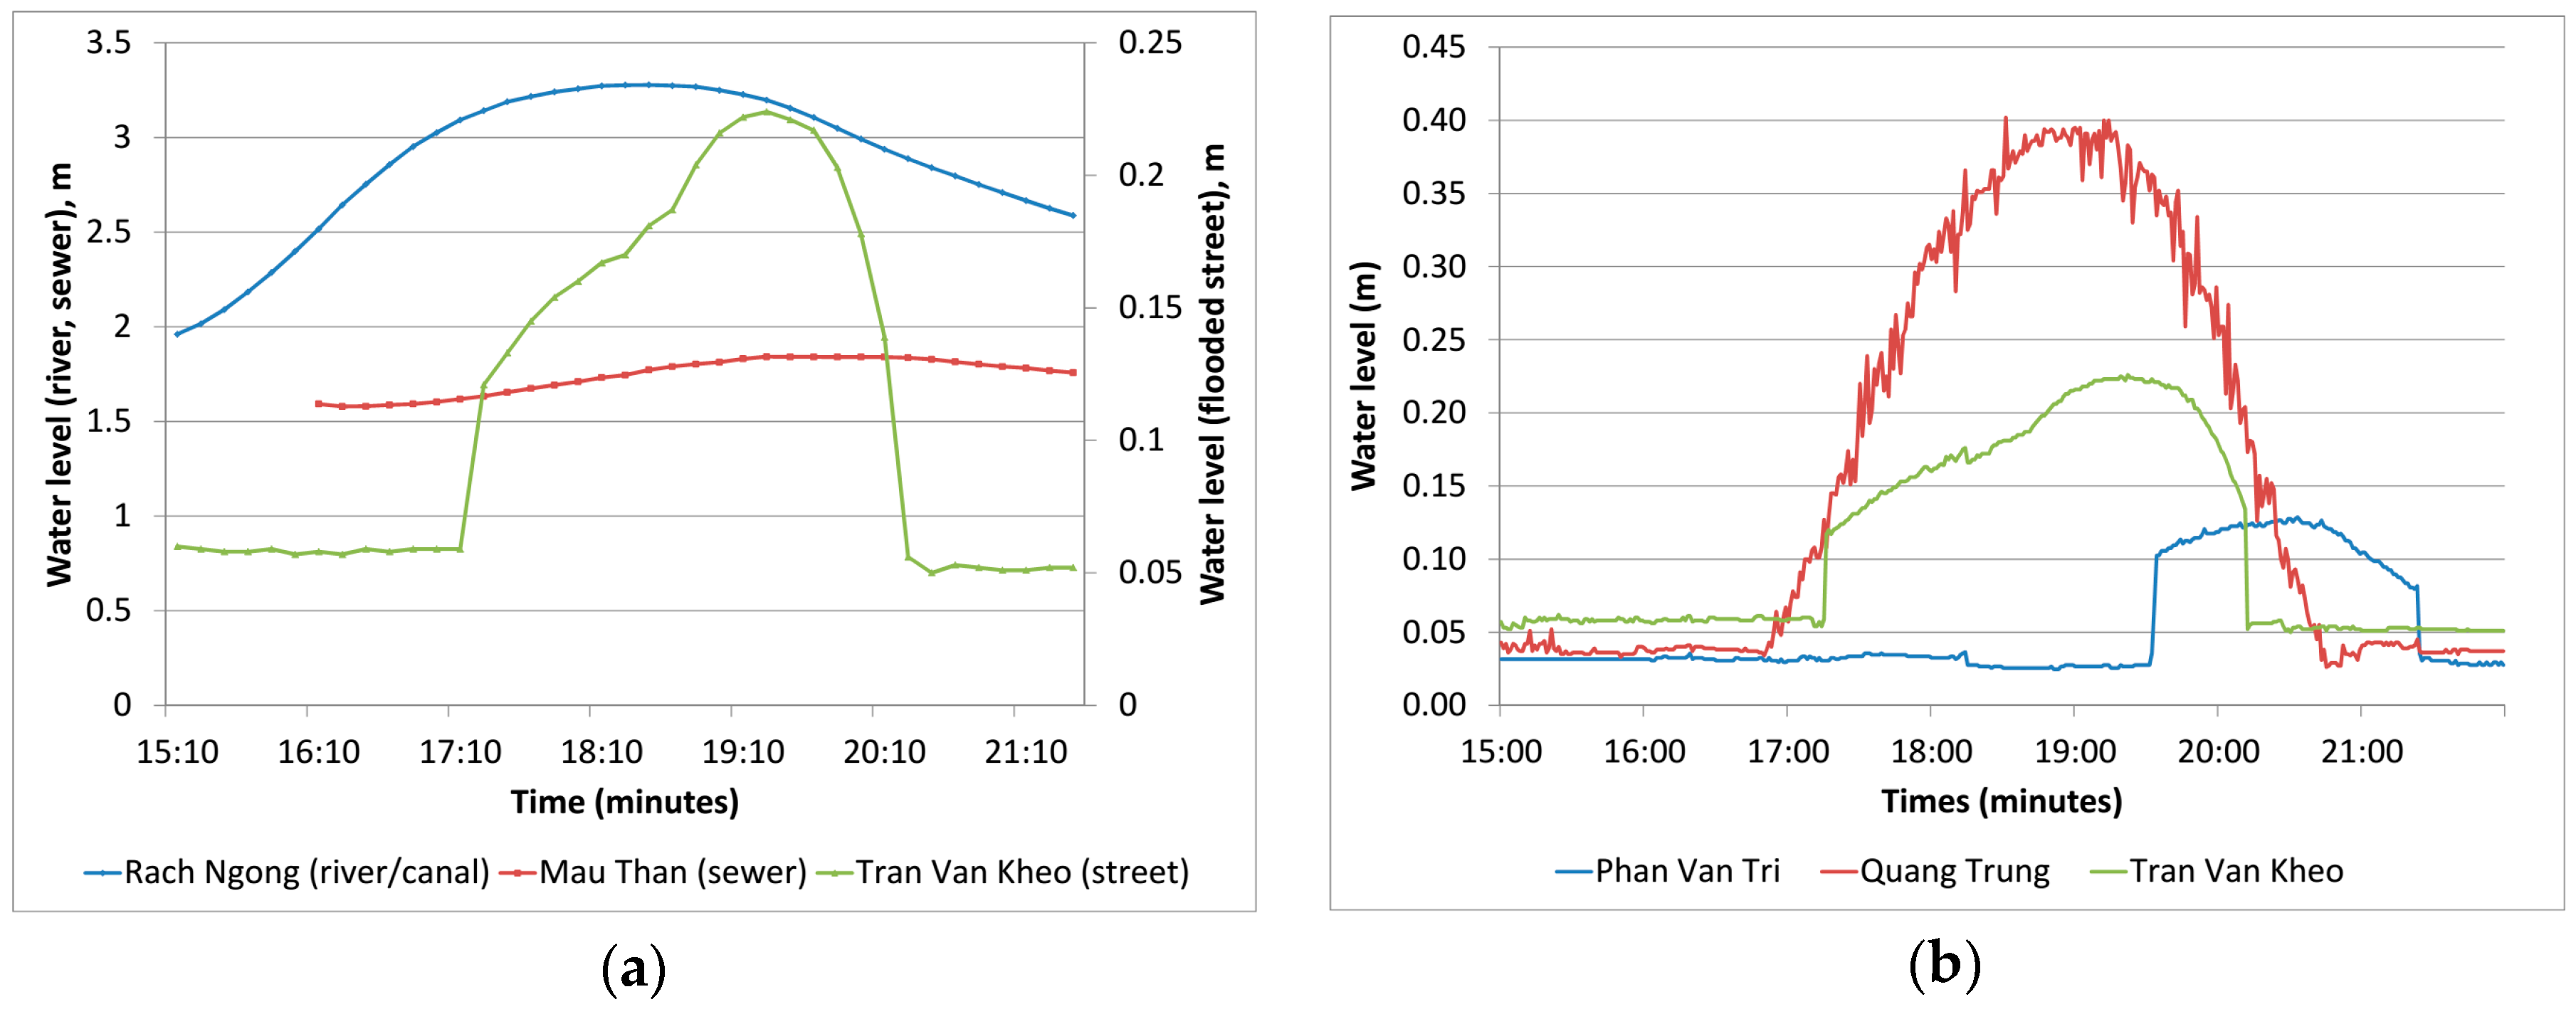
The sampling campaign was conducted during the high tide period, which was between September and November. High water level was forecasted for 7 October 2013 based on the recorded hourly water levels in the Can Tho gauging station by the local weather forecasting authorities. As the reliability of tidal flood forecasts in Can Tho was relatively high compared to pluvial events, this date was chosen to conduct the sampling campaign. With the maximum water level reaching 203 cm at the Can Tho gauging station, flood water from Hau River and Can Tho River inundated many locations in Can Tho. Flooding in the city’s streets occurred either due to overtopping of river/canal banks or due to overflow from surcharged sewerage manholes.
The locations for the campaign (water quality sampling and hydraulic parameter observations) were determined based on the prior flooding history documented by the sewerage and drainage company of Can Tho. The urban drainage network in Ninh Kieu district is a combined sewer system consisting of open drains and pipes. The network is under-designed and deteriorated (largely due to blockage by solid waste and illegal constructions), and has limited capacity and is being considered for upgrading to deal with recurring pluvial flooding issues. In addition to pluvial floods, the areas also suffer from fluvial floods, especially during high tide. The high tides also cause inundation in low-lying areas due to back-flow along sewer pipes with outlets to the rivers (due to non-existent or non-functioning flap-gates). Moreover, factors like local land subsidence (due to groundwater over-extraction) accentuate flooding impact in these areas [
26].
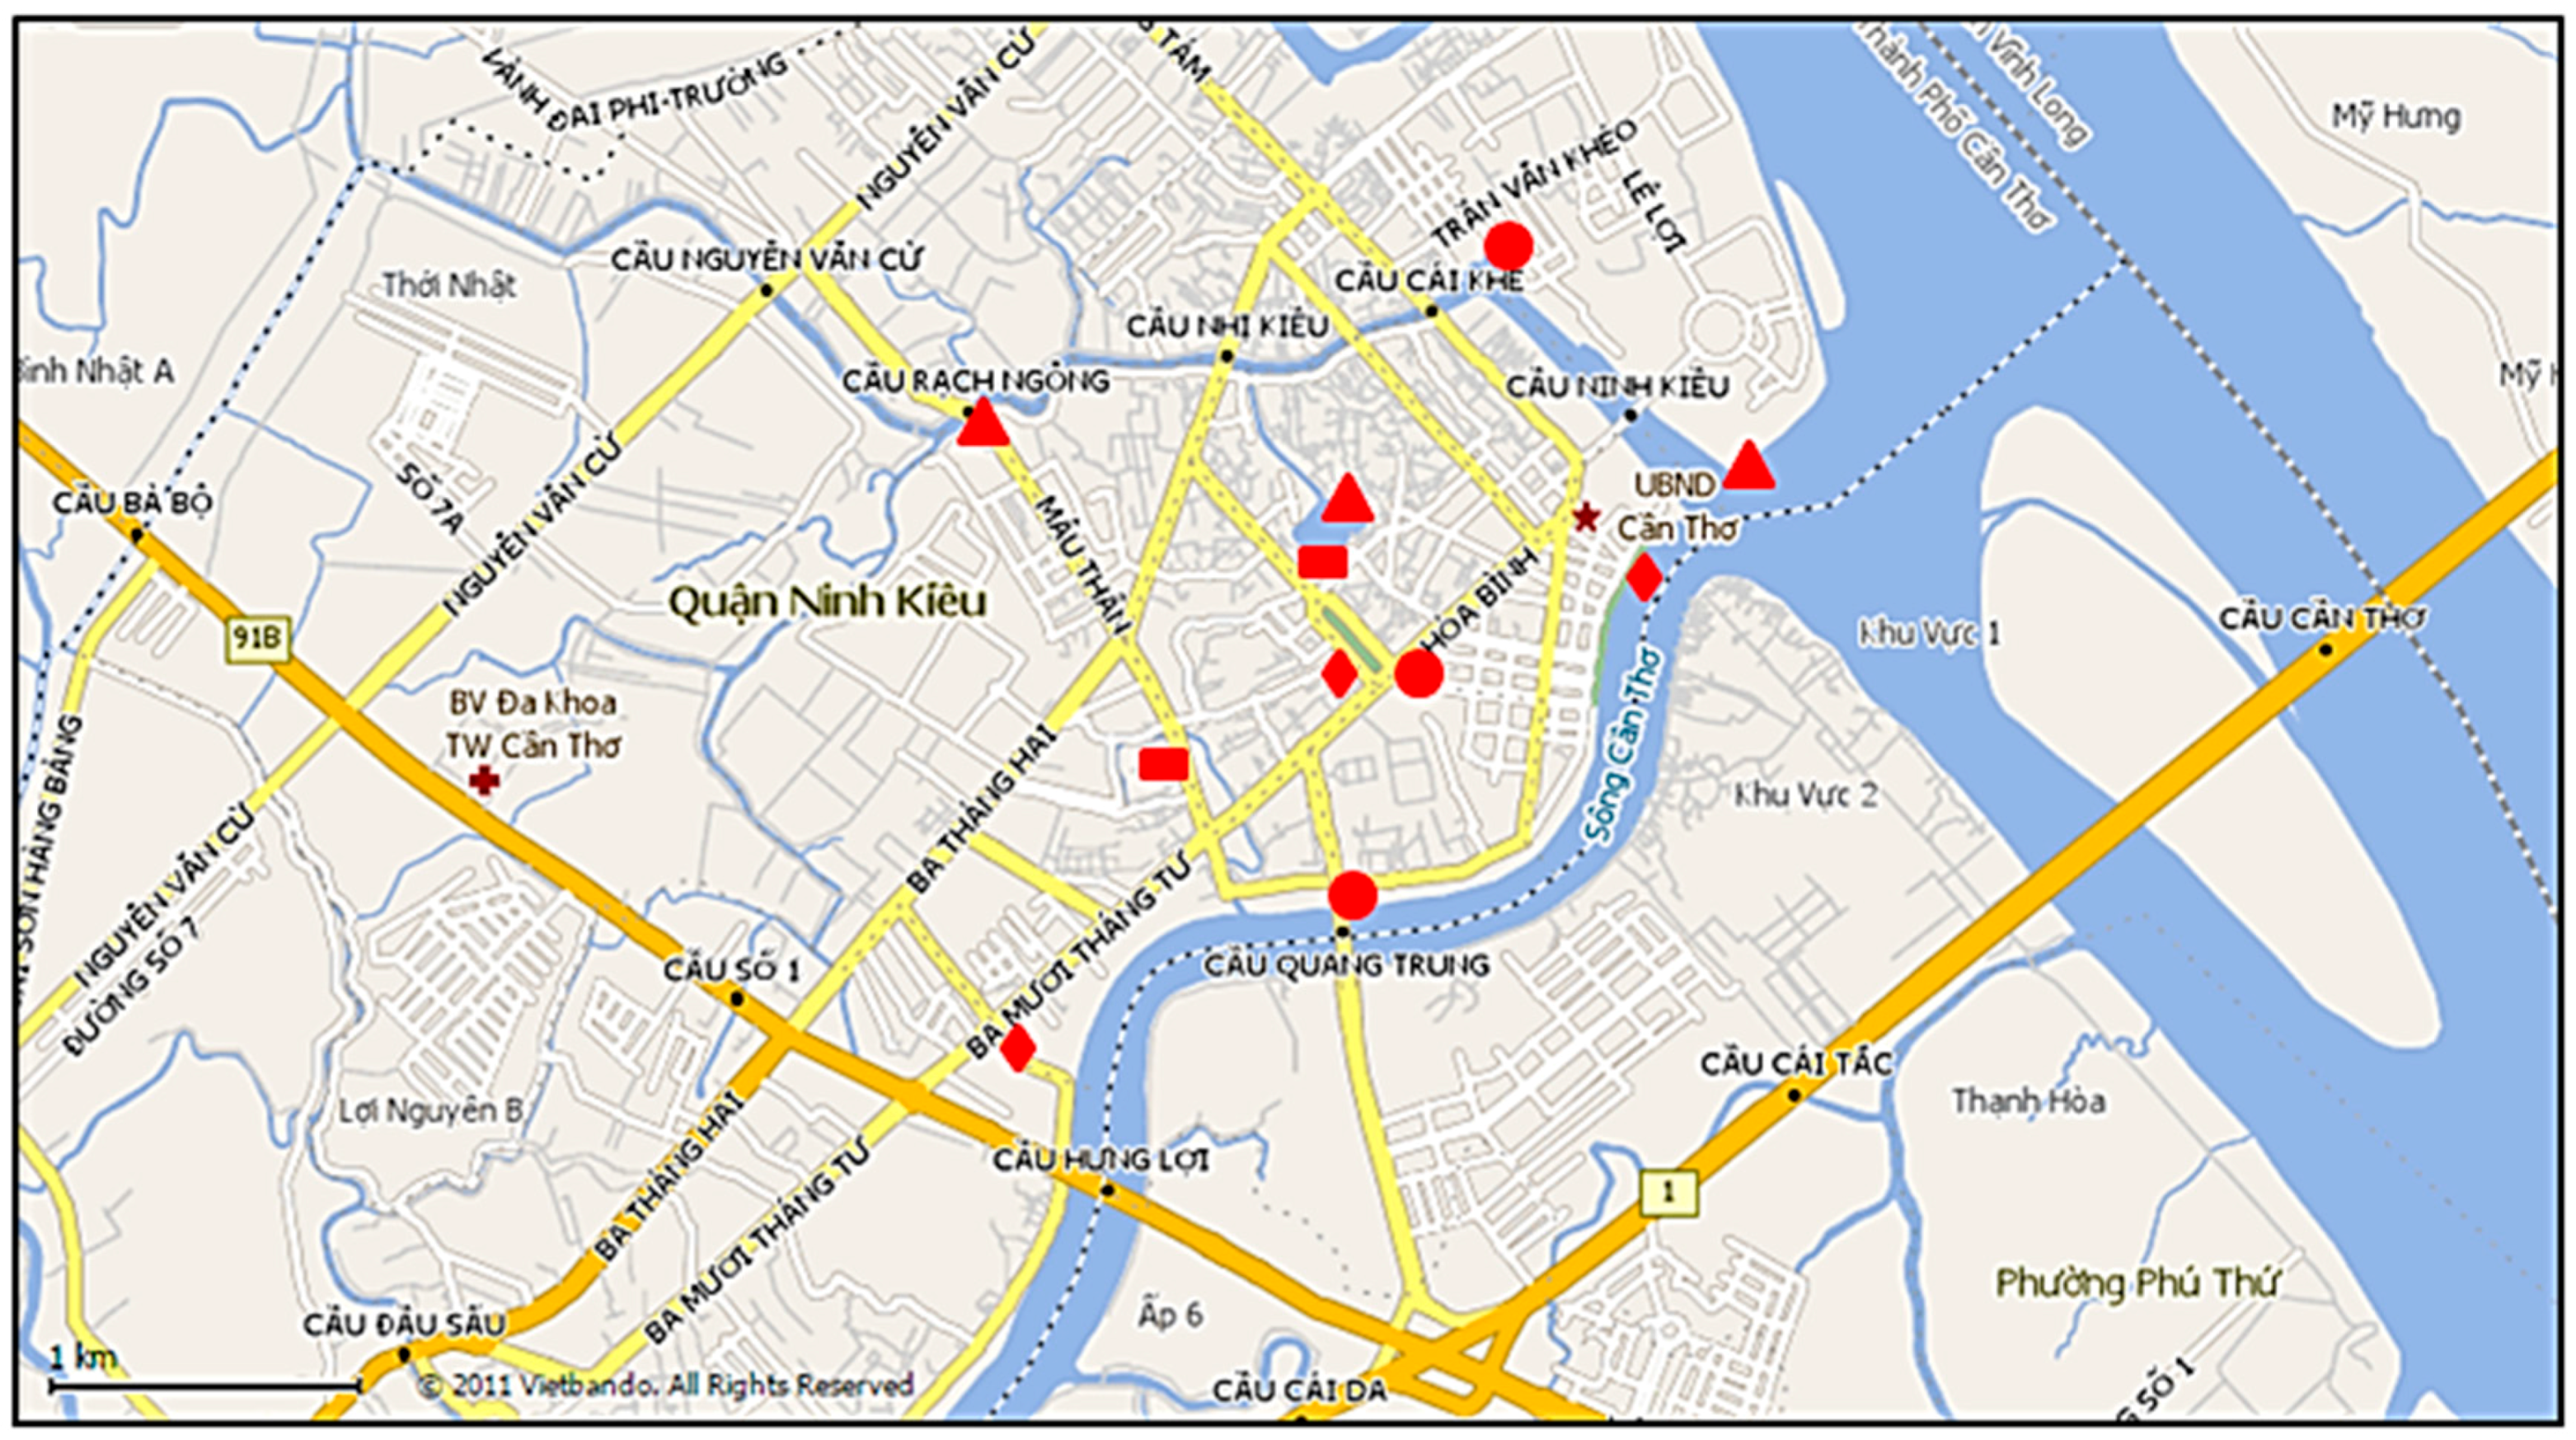
Considering the aforementioned factors, time and resource availability, the campaign was limited to critical locations that comprised three locations along open waters, five locations on flooded streets and three manholes of the sewerage system in Ninh Kieu (
Figure 1).
Open water (surface water): three sites of open water were selected for measurement. The first one is Can Tho River (width: 200 m, 5–10 m depth), which is connected to Hau (Mekong) River. The second one is Rach Ngong canal (width: 30 m, 3–5 m depth), which is connected to Hau River in the northern part of Ninh Kieu District. The last one is Xang Thoi Lake, which is connected to Rach Ngong River with small canals and sluices. The open water bodies have been receiving wastewater from sewage and drainage systems. At these sites, the water quality and water levels were measured.
The flooded sites: five sites in total were selected for sampling. In these flooded sites, the flood levels were measured and samples taken during the rising, peak and receding time of flood water. The first flooded site was at Hai Ba Trung Street, which was due to overtopping of embankment. The second, third and fourth sites were at Phan Van Tri Street, Tran Van Kheo Street (near a fruit/vegetable market), and Hoa Binh Avenue. Since the flap gates did not function well, during high water levels from the river, the water came into the sewage and drainage system, leading to surcharge and flooding. The last site was at Tran Ngoc Que Street, close to the river, where flooding was due to overtopping of embankments. In addition, this site was very near to an open sewage/drainage canal, which was heavily polluted during dry weather conditions. At three sites of the five (Hai Ba Trung Street, Tran Ngoc Que Street and Phan Van Tri Street), only the flood water was sampled and analysed. For the other two sites, sewer water samples prior to flooding were also collected.
Sewer sites: in addition to the two sites mentioned above, sewage samples were collected at two other locations before and during the floods. The first location was at Mau Than Street where the water levels in the sewers were rising during the time of flooding. This site normally does not get flooded (either due to the presence of the flap gate or due to its non-proximity to the river). Another site was near Xang Thoi Lake. This second side gets flooded normally as the water level in the sewer rises during flooding times leading to surcharge and local flooding.
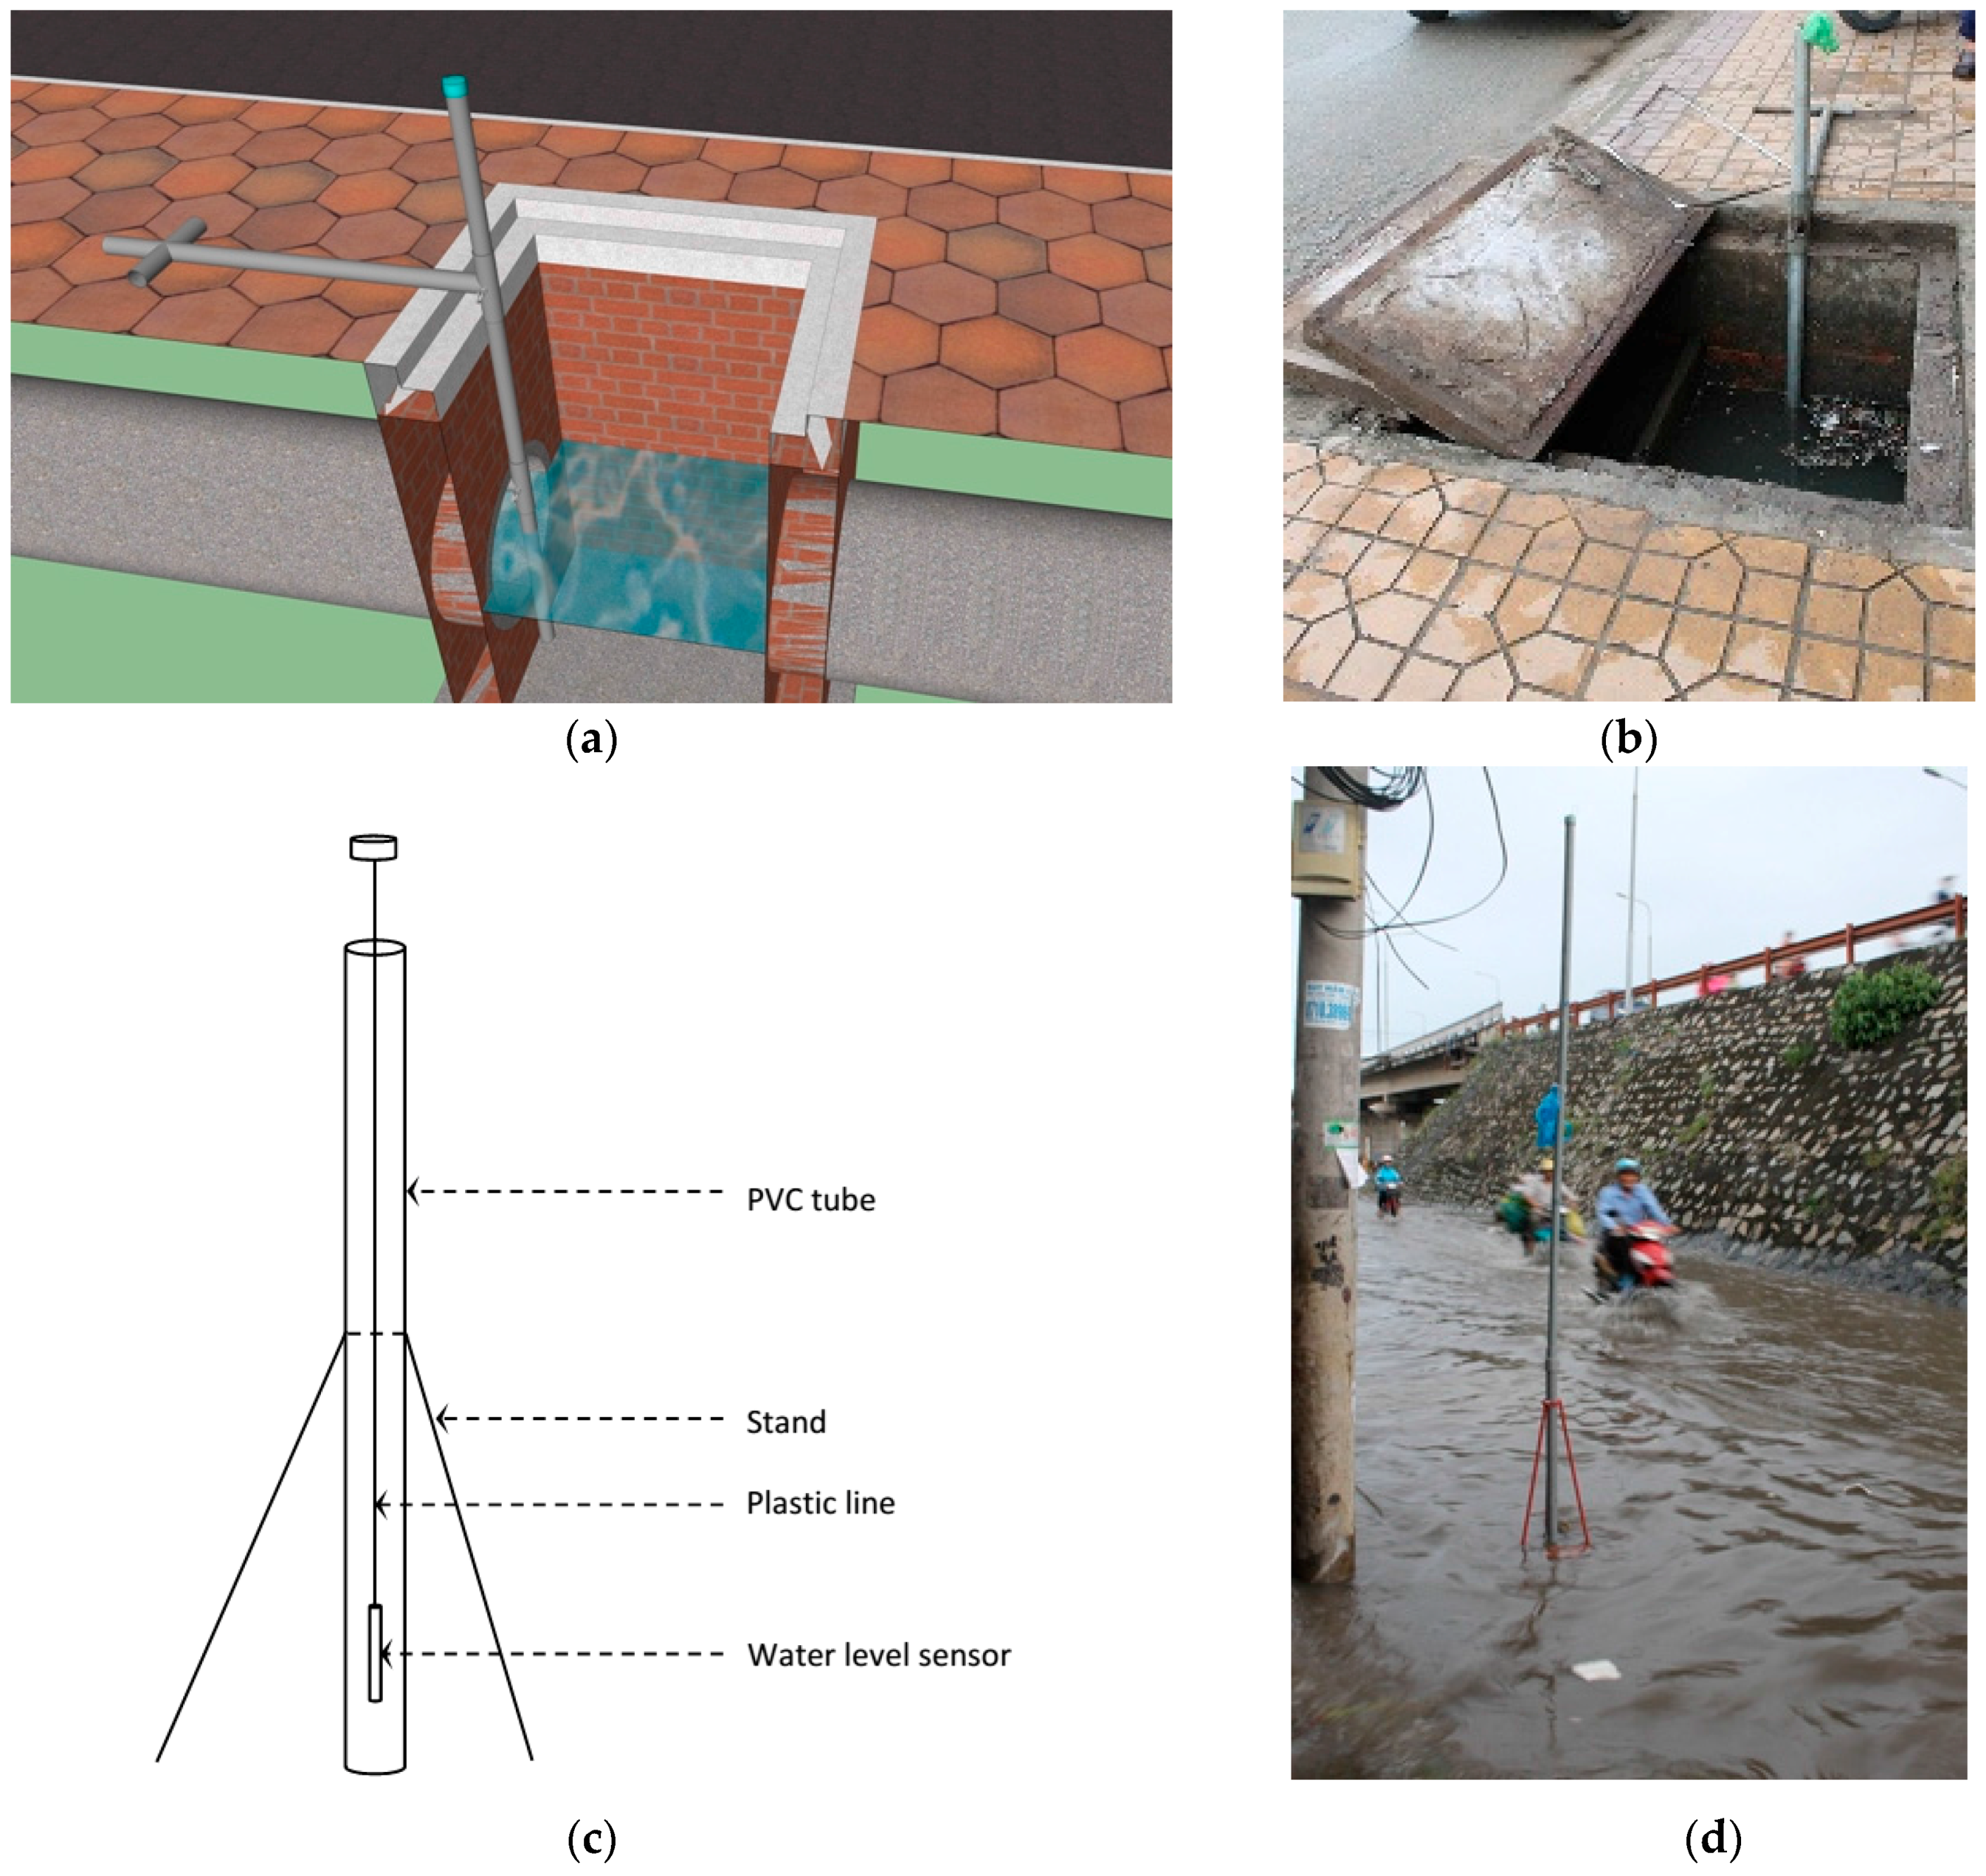
The magnitude of combined upstream and tidal floods was measured by recording the hydrological parameters, such as water levels using automatic sensors, in the river and canals. In addition, water levels on the street and in the drainage canals/sewerage pipes (using the same sensors) were recorded at the same time. The flow and water level were recorded so as to explore the dynamics of water quality due to flow characteristics. The simple water level measurement setups, which was designed for measuring water levels on the street and in the sewers, are shown in
Figure 2.
2.3. How was the Water Sampling Campaign Organized?
In order to implement this field campaign, a workforce of 30 people has been engaged. The campaigners had been mobilized from the research group led by the first author, Can Tho Environmental Monitoring Center and Can Tho Drainage and Sewage Company. The latter took part because of their familiarity with the city, and knowledge of water sampling, and are used to wade through flood waters. On average, there were three people working together at each location. The preparations for the campaign started at least three days ahead of the flooding event based on the flood forecast from the local authorities. A short training was provided to the entire group campaigners on water sampling, flood characteristic measurement and protocols to be followed. An extra team was on standby for contingencies. The total response time of the team—i.e., from the time of assembly to deployment at location-varied between 0.5 and 1 h with all the teams starting the sampling campaign at 3:00 p.m. on 7 October 2013. The coordination team also took up the responsibility of transporting the collected samples from the flooded sites, processing and storing them for analysis according to water quality monitoring standards [i.e., 16].
2.4. What are the Pollutants in the Flood Waters?
An average of three to five water samples were taken from the same locations and at the same time (averagely every 45 to 60 min) as the hydrological measurements in the rivers, canal, lakes and on the street (shown in
Figure 1 and
Table S1 in supplement). The sampling included BOD
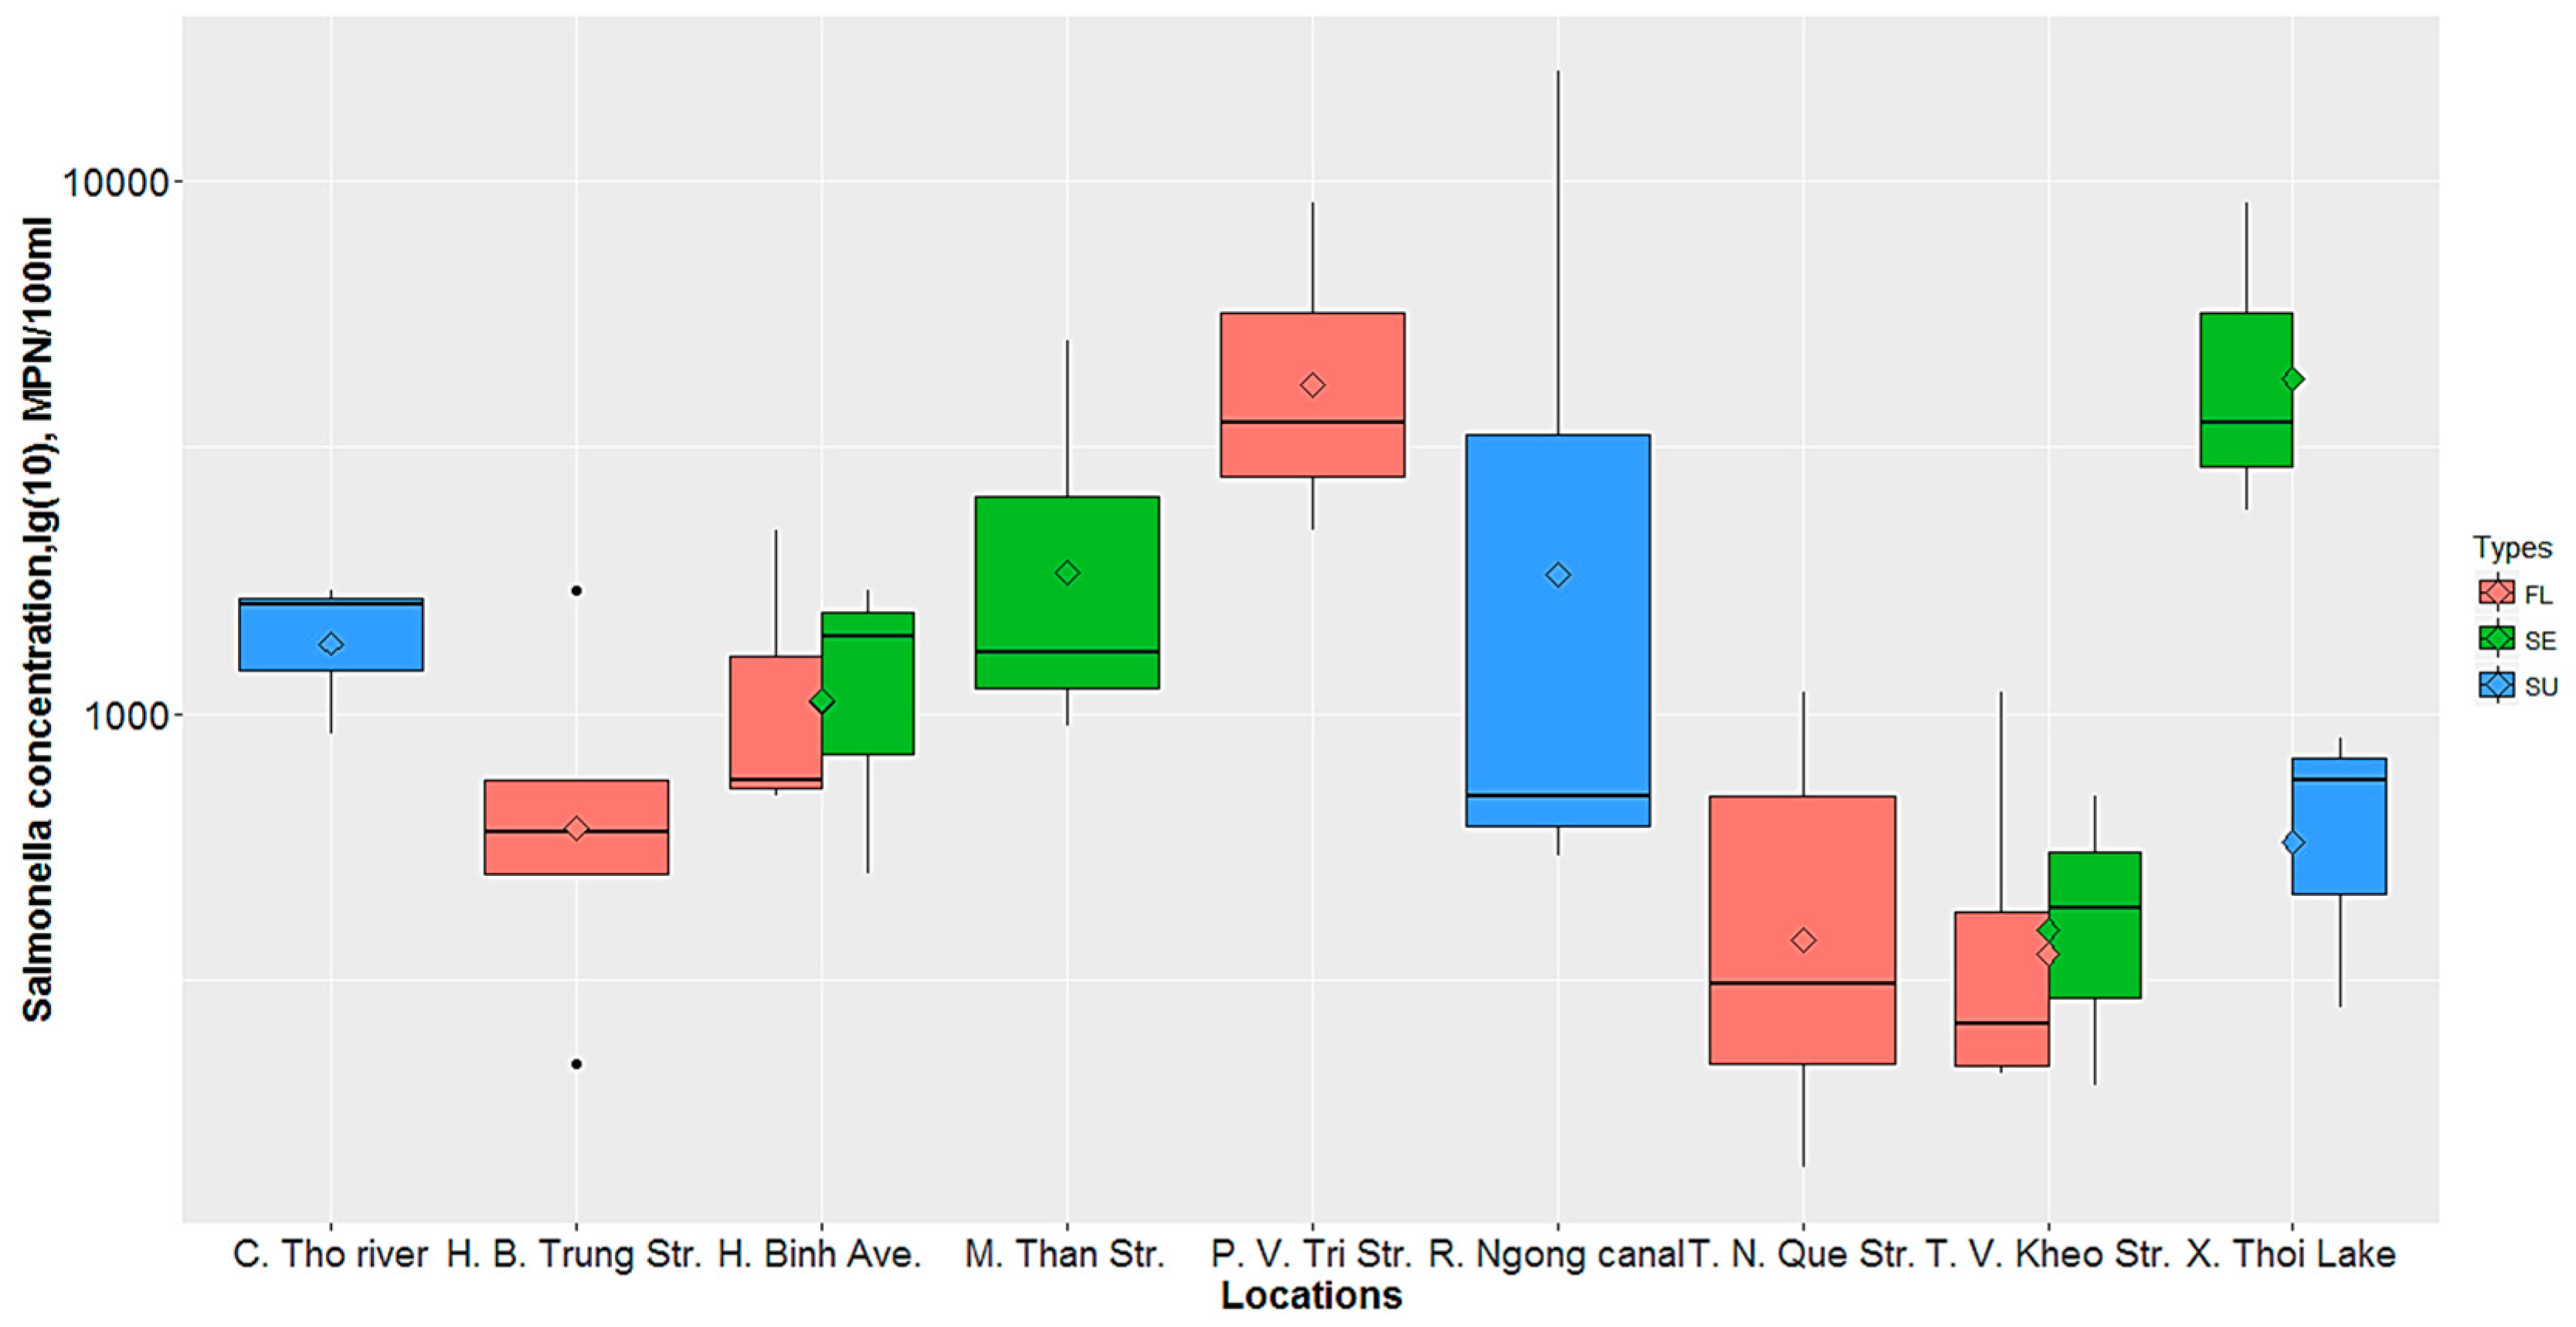
5, Total P, Total N, Total coliforms, and
Salmonella (see
Table S4 in the supplement). The samples were collected in 2 litre plastic bottles for physical and chemical analysis, and 0.5 litre sterile glass bottles for microbiological analysis. It was assumed that once the hydraulic parameters are measured and water samples collected from the critical locations, they have to be analysed in order to ascertain the dynamics of water quality with respect to location and time based on the observation and interpretation of results.
4. Discussion
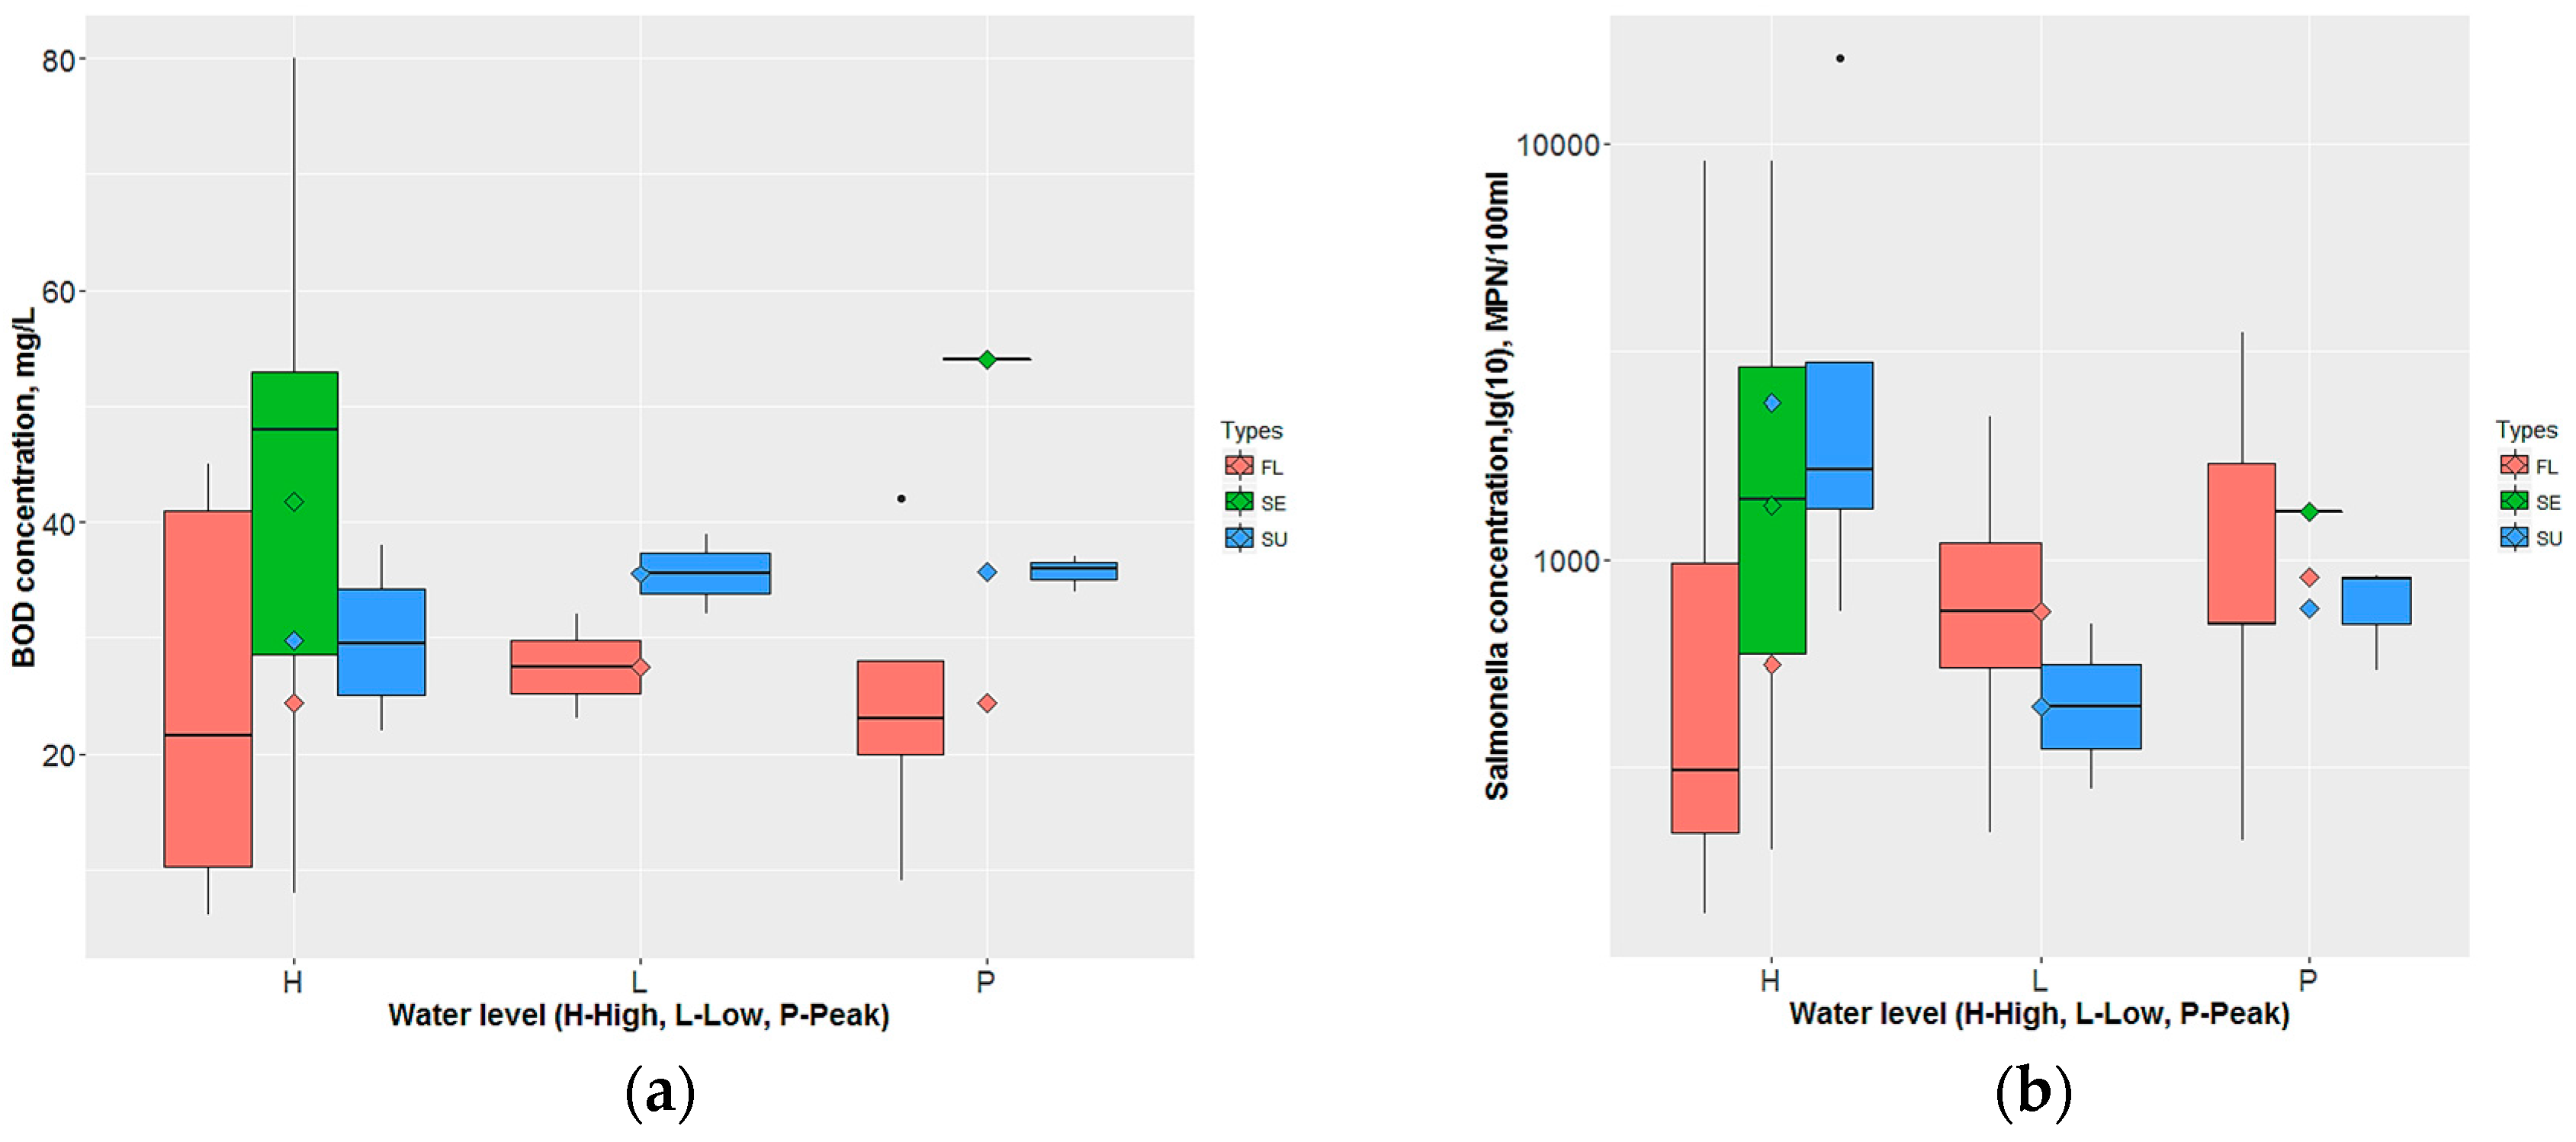
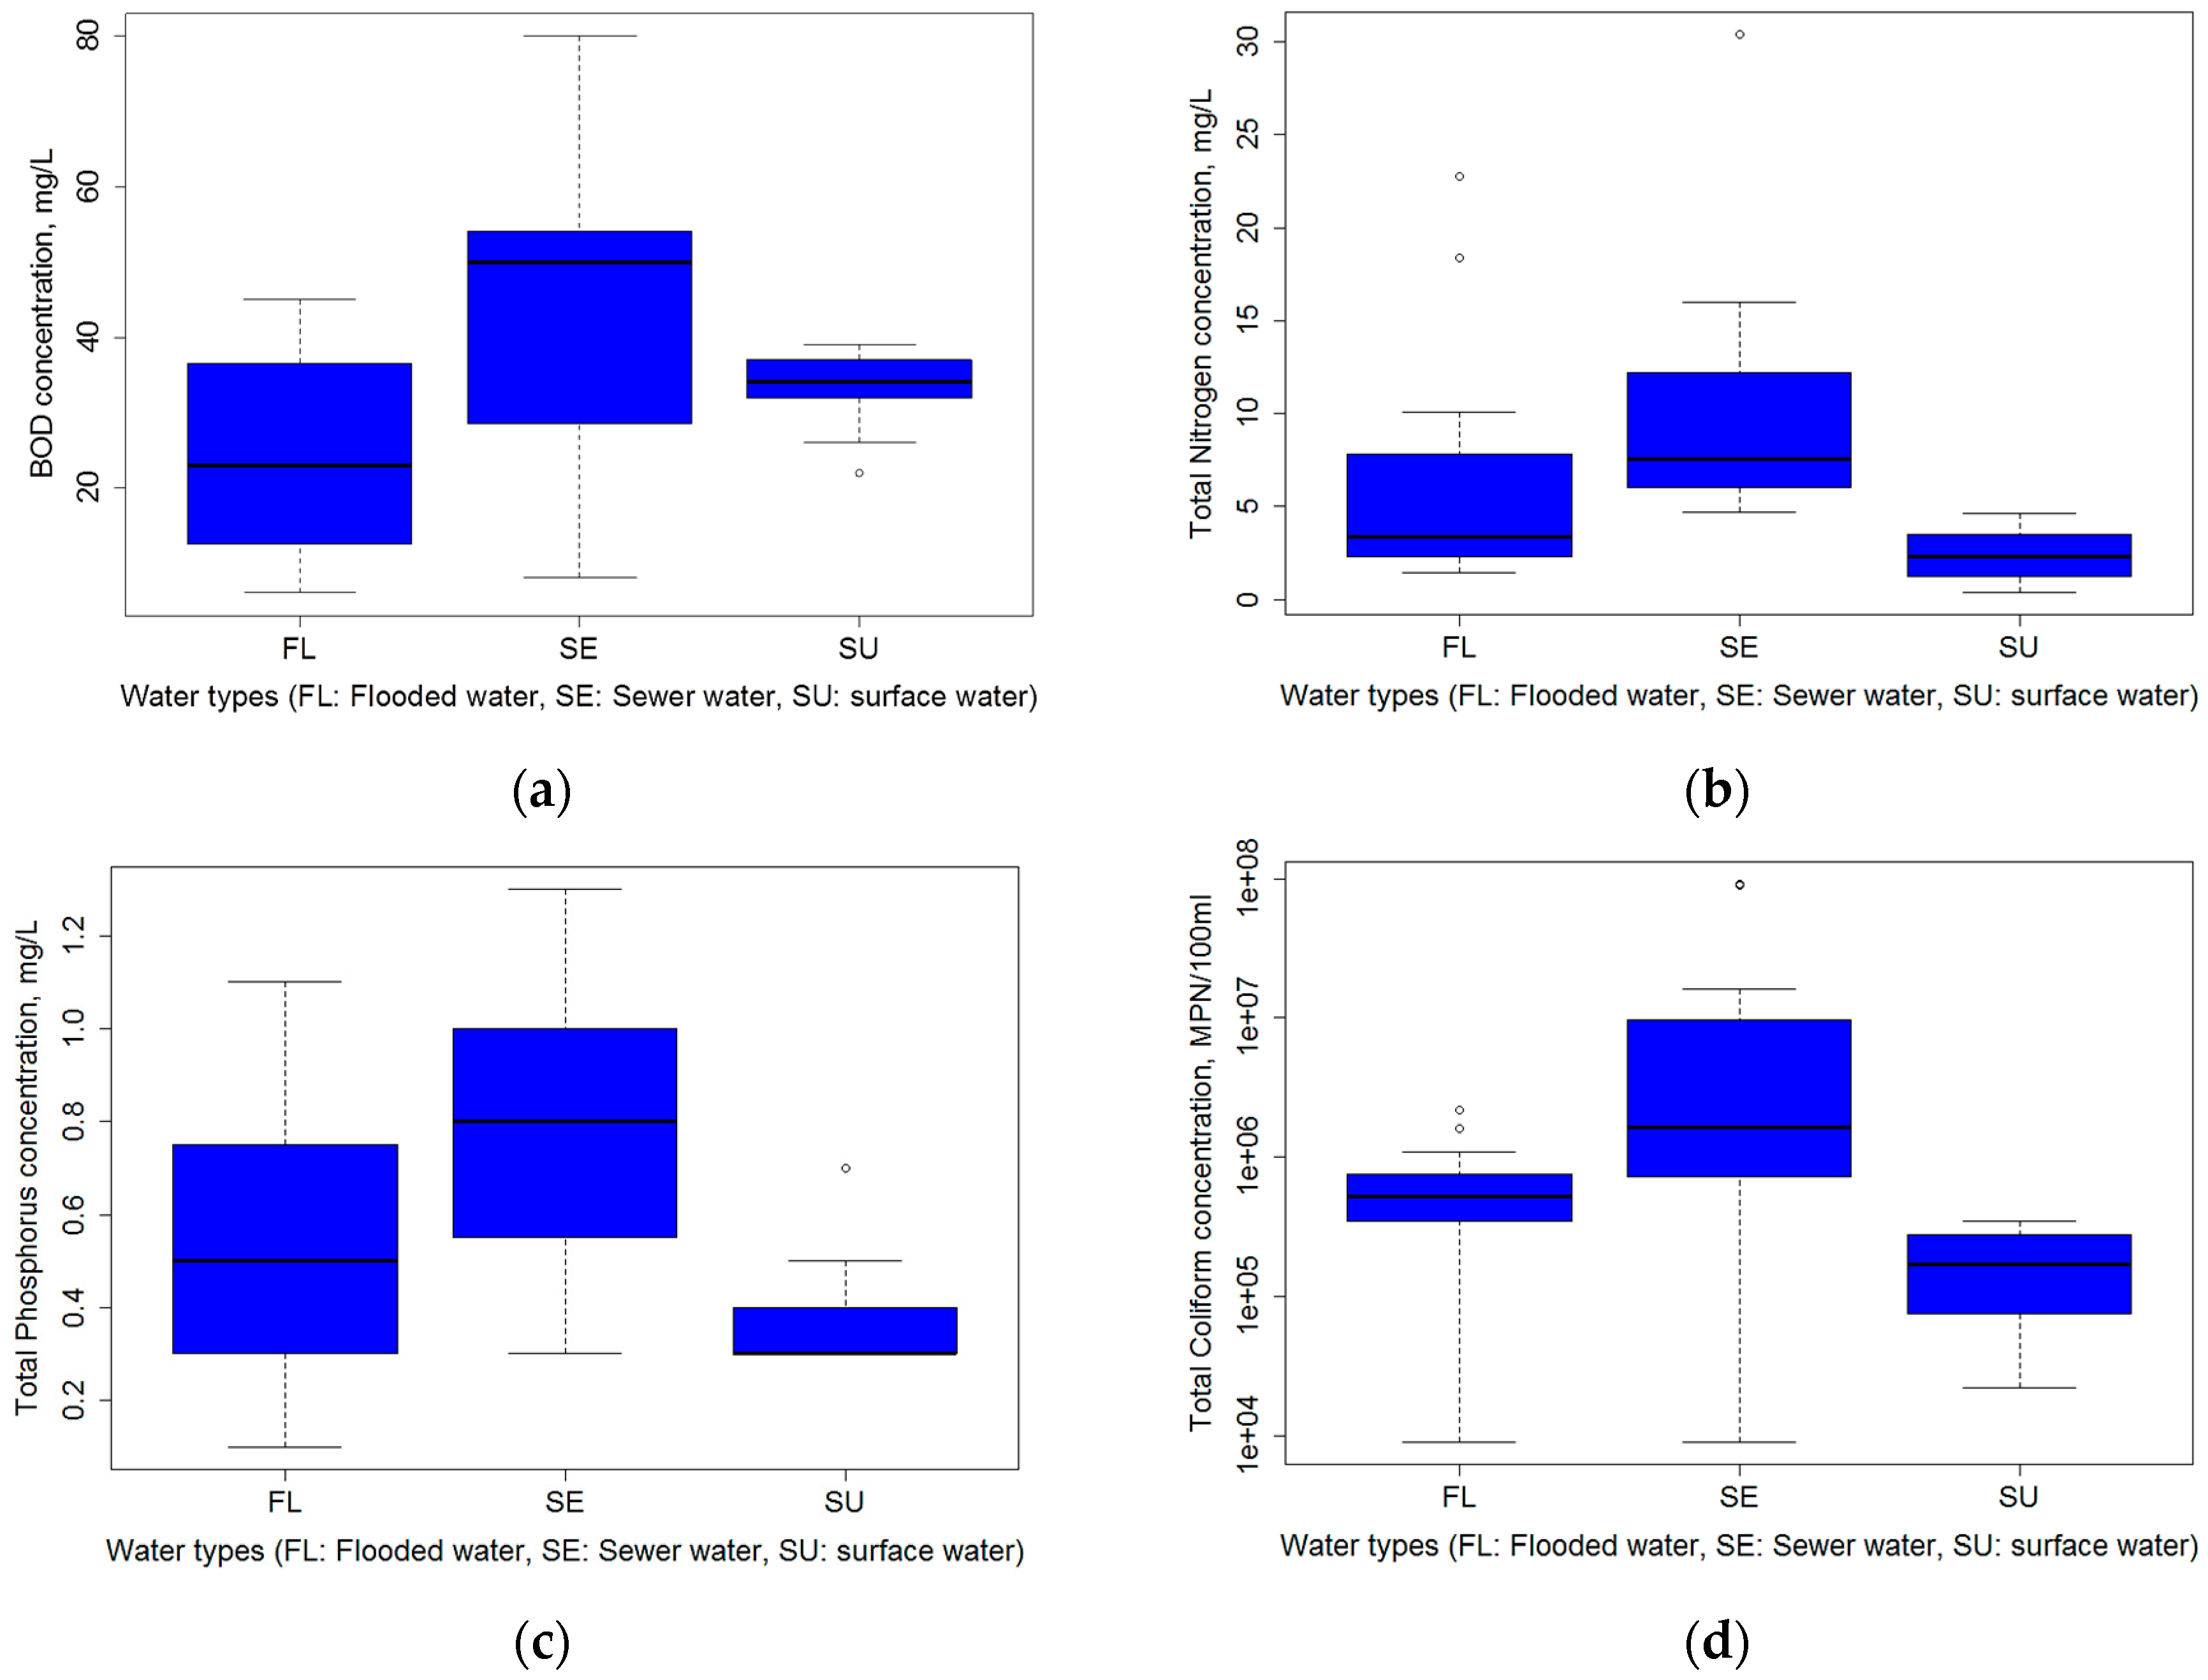
In this paper, we have presented some initial results of an extensive flood water quality monitoring campaign comprising observation water quality, flood depth and duration in Can Tho during a flooding event. The monitoring focused on different water systems in Ninh Kieu District, Can Tho, namely: (1): open water (canals, rivers, lakes); (2): flooded areas in the streets and (3): in sewers. The data reveals that the flood water in all of the urban drainage water systems are highly polluted based on assessment of the pathogen concentration. The pathogen concentrations in the flood waters are well above the allowable limits set by the prevailing water quality standards—for example, QCVN 08/2008/BTNMT, 08/2015/BTNMT: Inland surface water quality for domestic use [
23,
27] or QCVN 10/2008/BTNMT: Coastal water quality for bathing [
28]. These pollution levels were also observed in other nutrient parameters of open/surface water samples, e.g., BOD (2–3 times), Ammonium (5–20 times), and Phosphate (5–20 times) during and especially after the flood events.
The analysis showed that water quality levels in the flood water exceeded water quality standards (e.g., the coliform excess from 10 to 10,000 times), and thus this may be a health risk for local people during flood events. Even the health risk due to contact with flood water in Can Tho is as high as the risk due to direct contact with sewage. This implies that wading through flood water is equivalent to wading through sewage due to the high pathological concentration. The high risk is not exclusively due to surcharge but also occurs due to overloading due to rapid urbanisation, inefficient operation and maintenance of the drainage system. As the people are used to their “living with floods” way of life, they wade through inundated streets unaware of the pathological risks due to the change in nature of flood water. This creates the need for sensitizing the urban dwellers and local government about the health risk due to flood water and that they are “living with health risk”. The social resilience that has been developed over the years due to recurrent exposure to floods is currently under threat. Preserving and enhancing the resilience is an essential quality to adapt to the changing climate in Can Tho, as some of the flood resilience enhancement approaches are based on the social resilience [
29]. This necessitates the need to take urgent measures to eliminate or reduce health risk due to flooding in Can Tho.
Although there is an overall increase in health risk due to flooding, spatial variations in water quality in different flood waters have also been observed. Pollutant concentrations of flood water in the streets caused due to overtopping of embankments (streets close to the river e.g., at Tran Ngoc Que Street) is less polluted compared to the polluted water in the streets that is caused due to surcharging of the sewerage system (e.g., at Hai Ba Trung Street, Hoa Binh Avenue). Furthermore, it can be noticed that most of the flooding in the study area is due to the surcharge of sewers, which is a major contributor of pollutants during flooding. An effective drainage system would help in terms of reducing water pollution and/or health risk problems. The outfalls of sewers into the river and canals have to be secured properly by means of flap gates to prevent inflows from the river. Hence, it can be inferred that living close to the sewer during the flooding has a greater health risk than living close to the river in Can Tho. In addition, the health risk becomes even more seriously if the polluted flooding water may enter the water supply system through leaking pipes.
In this study, an attempt has been made to record the water quality (focusing on pathogen contaminants) variations in both temporal and spatial scales. Although the event data from this study can be a good reference, there are still sources of uncertainty and limited sample size with regard to data collection. In addition, the underlying processes and causations of water pollution (from both point and non-point sources) should be investigated. The approach has to be expanded and to a greater extent of flooding and repeated to capture and fully understand the dynamics of water quality during flood events.


 ,
, 