
Energy Recovery in Existing Water Networks: Towards Greater Sustainability

 ,
,  ,
,  and
and 
Abstract
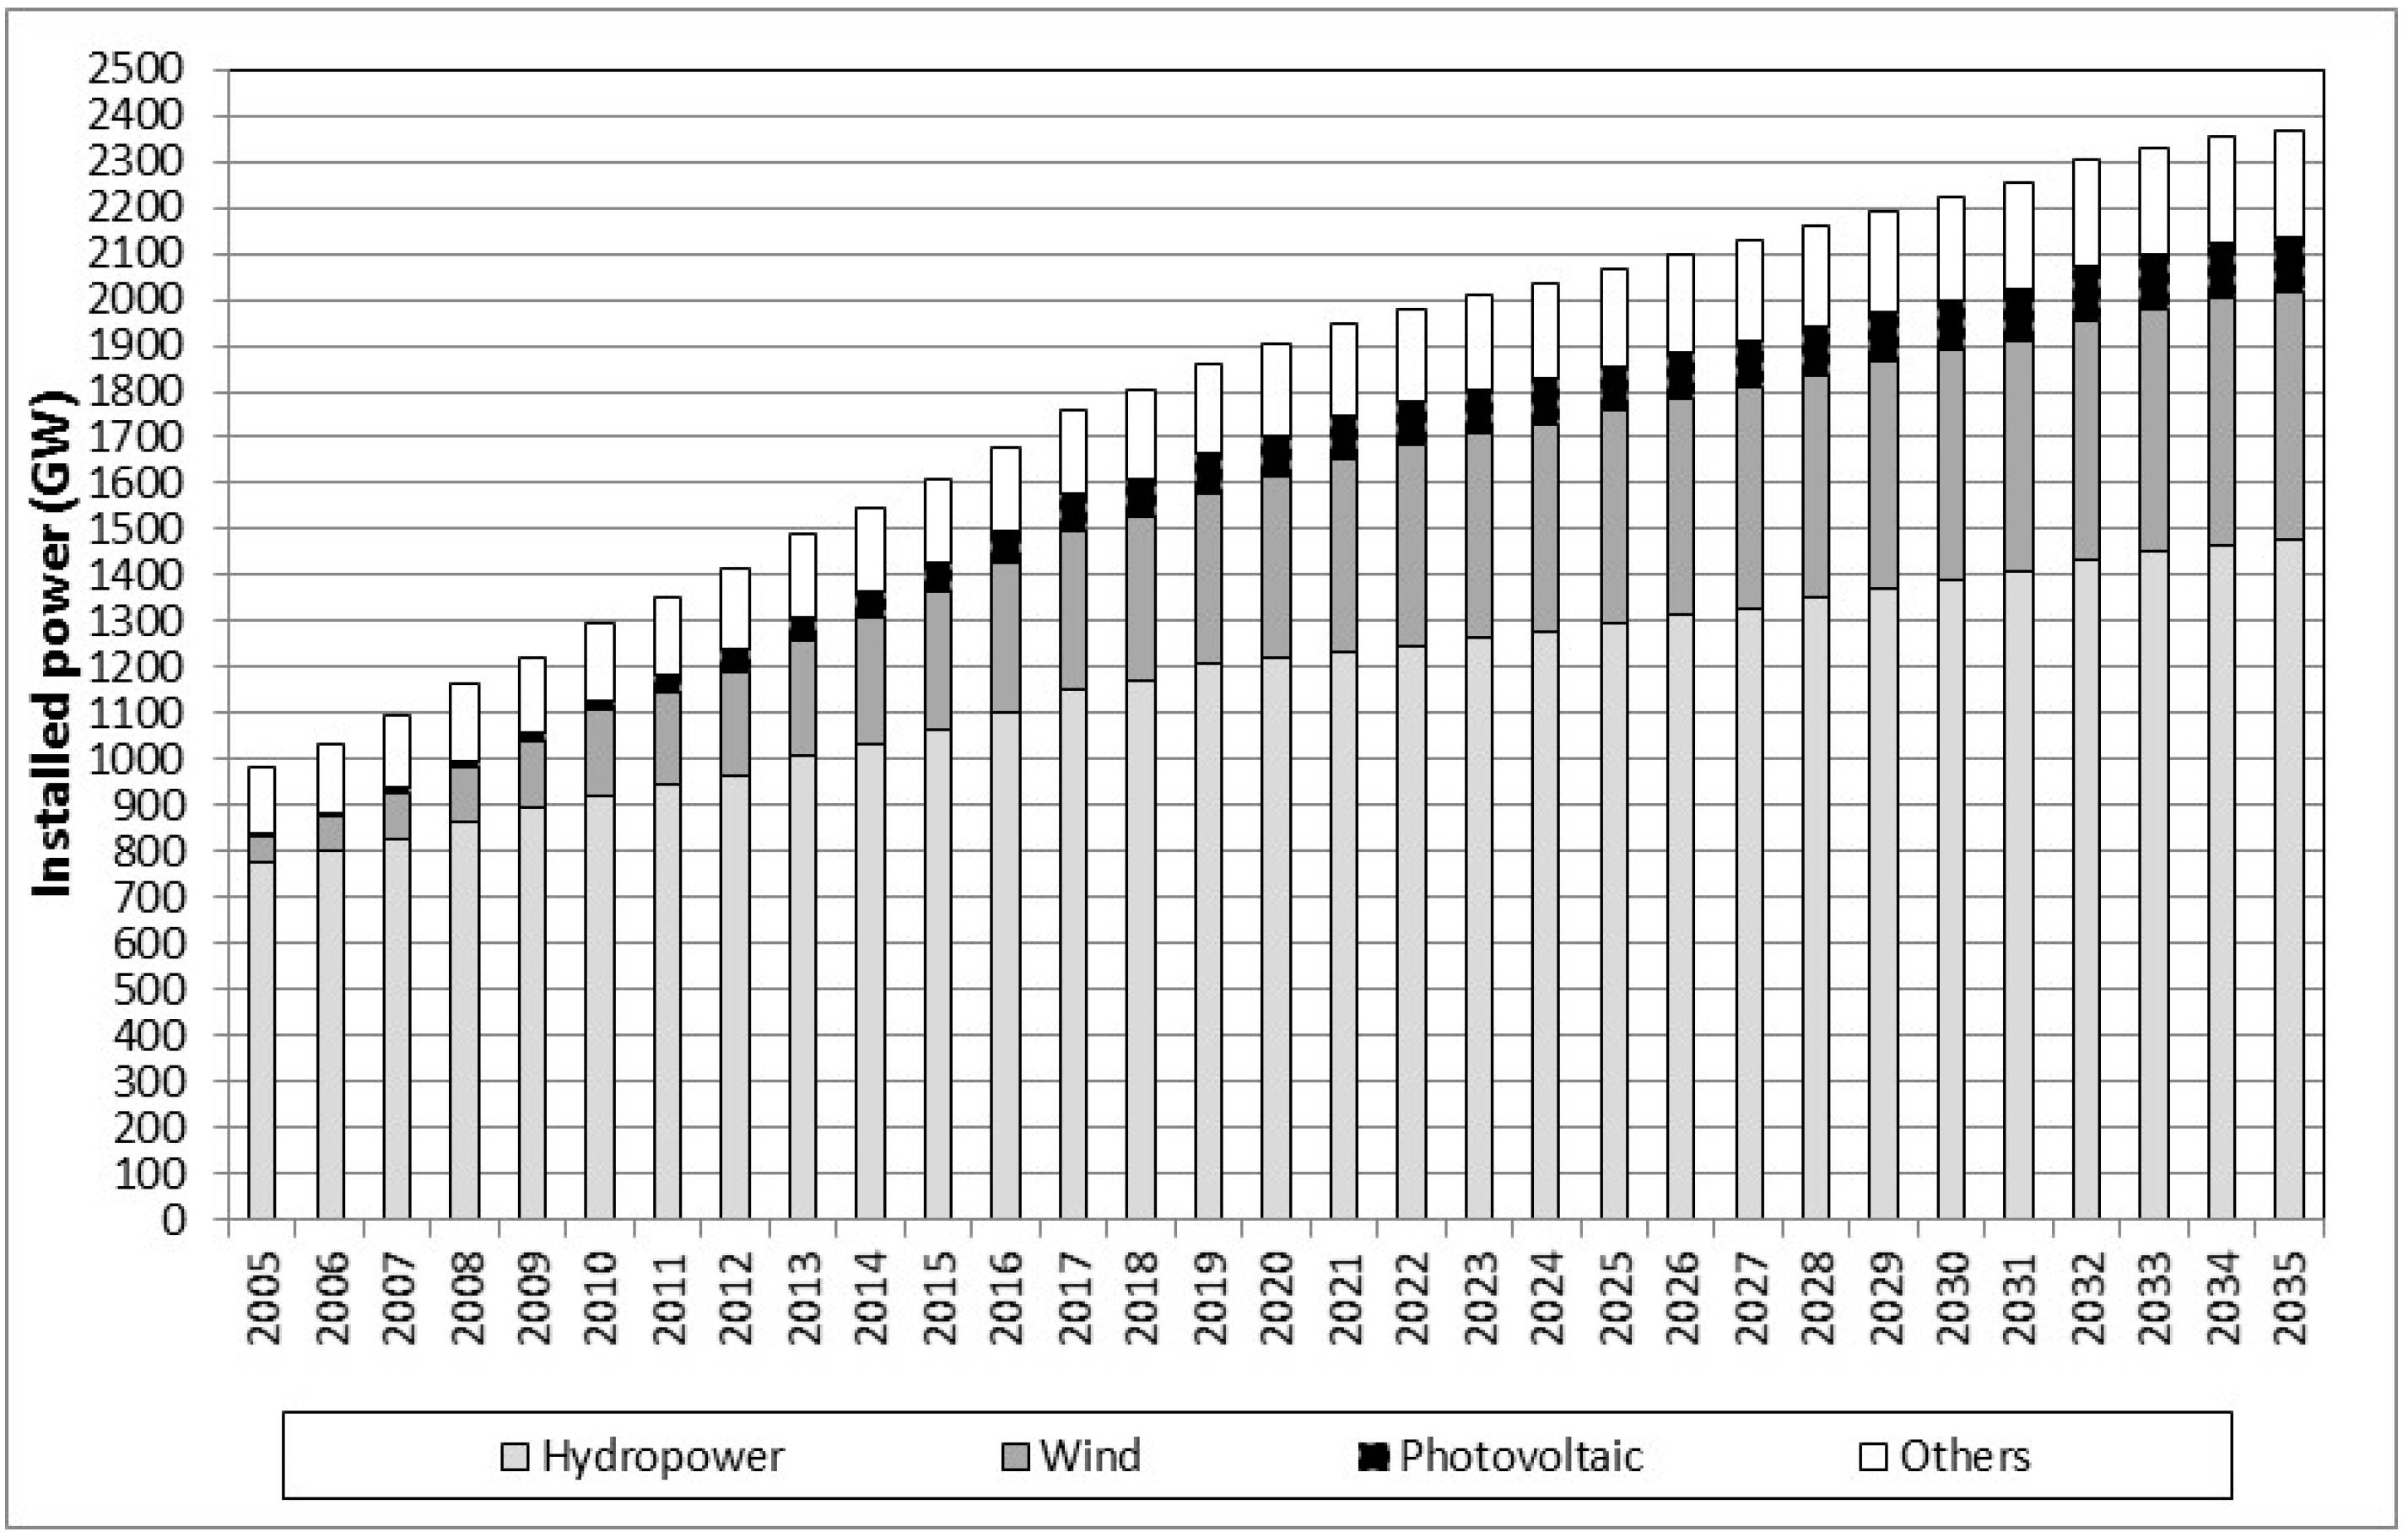
:1. Hydropower Generation
2. Energy Recovery in Water Networks
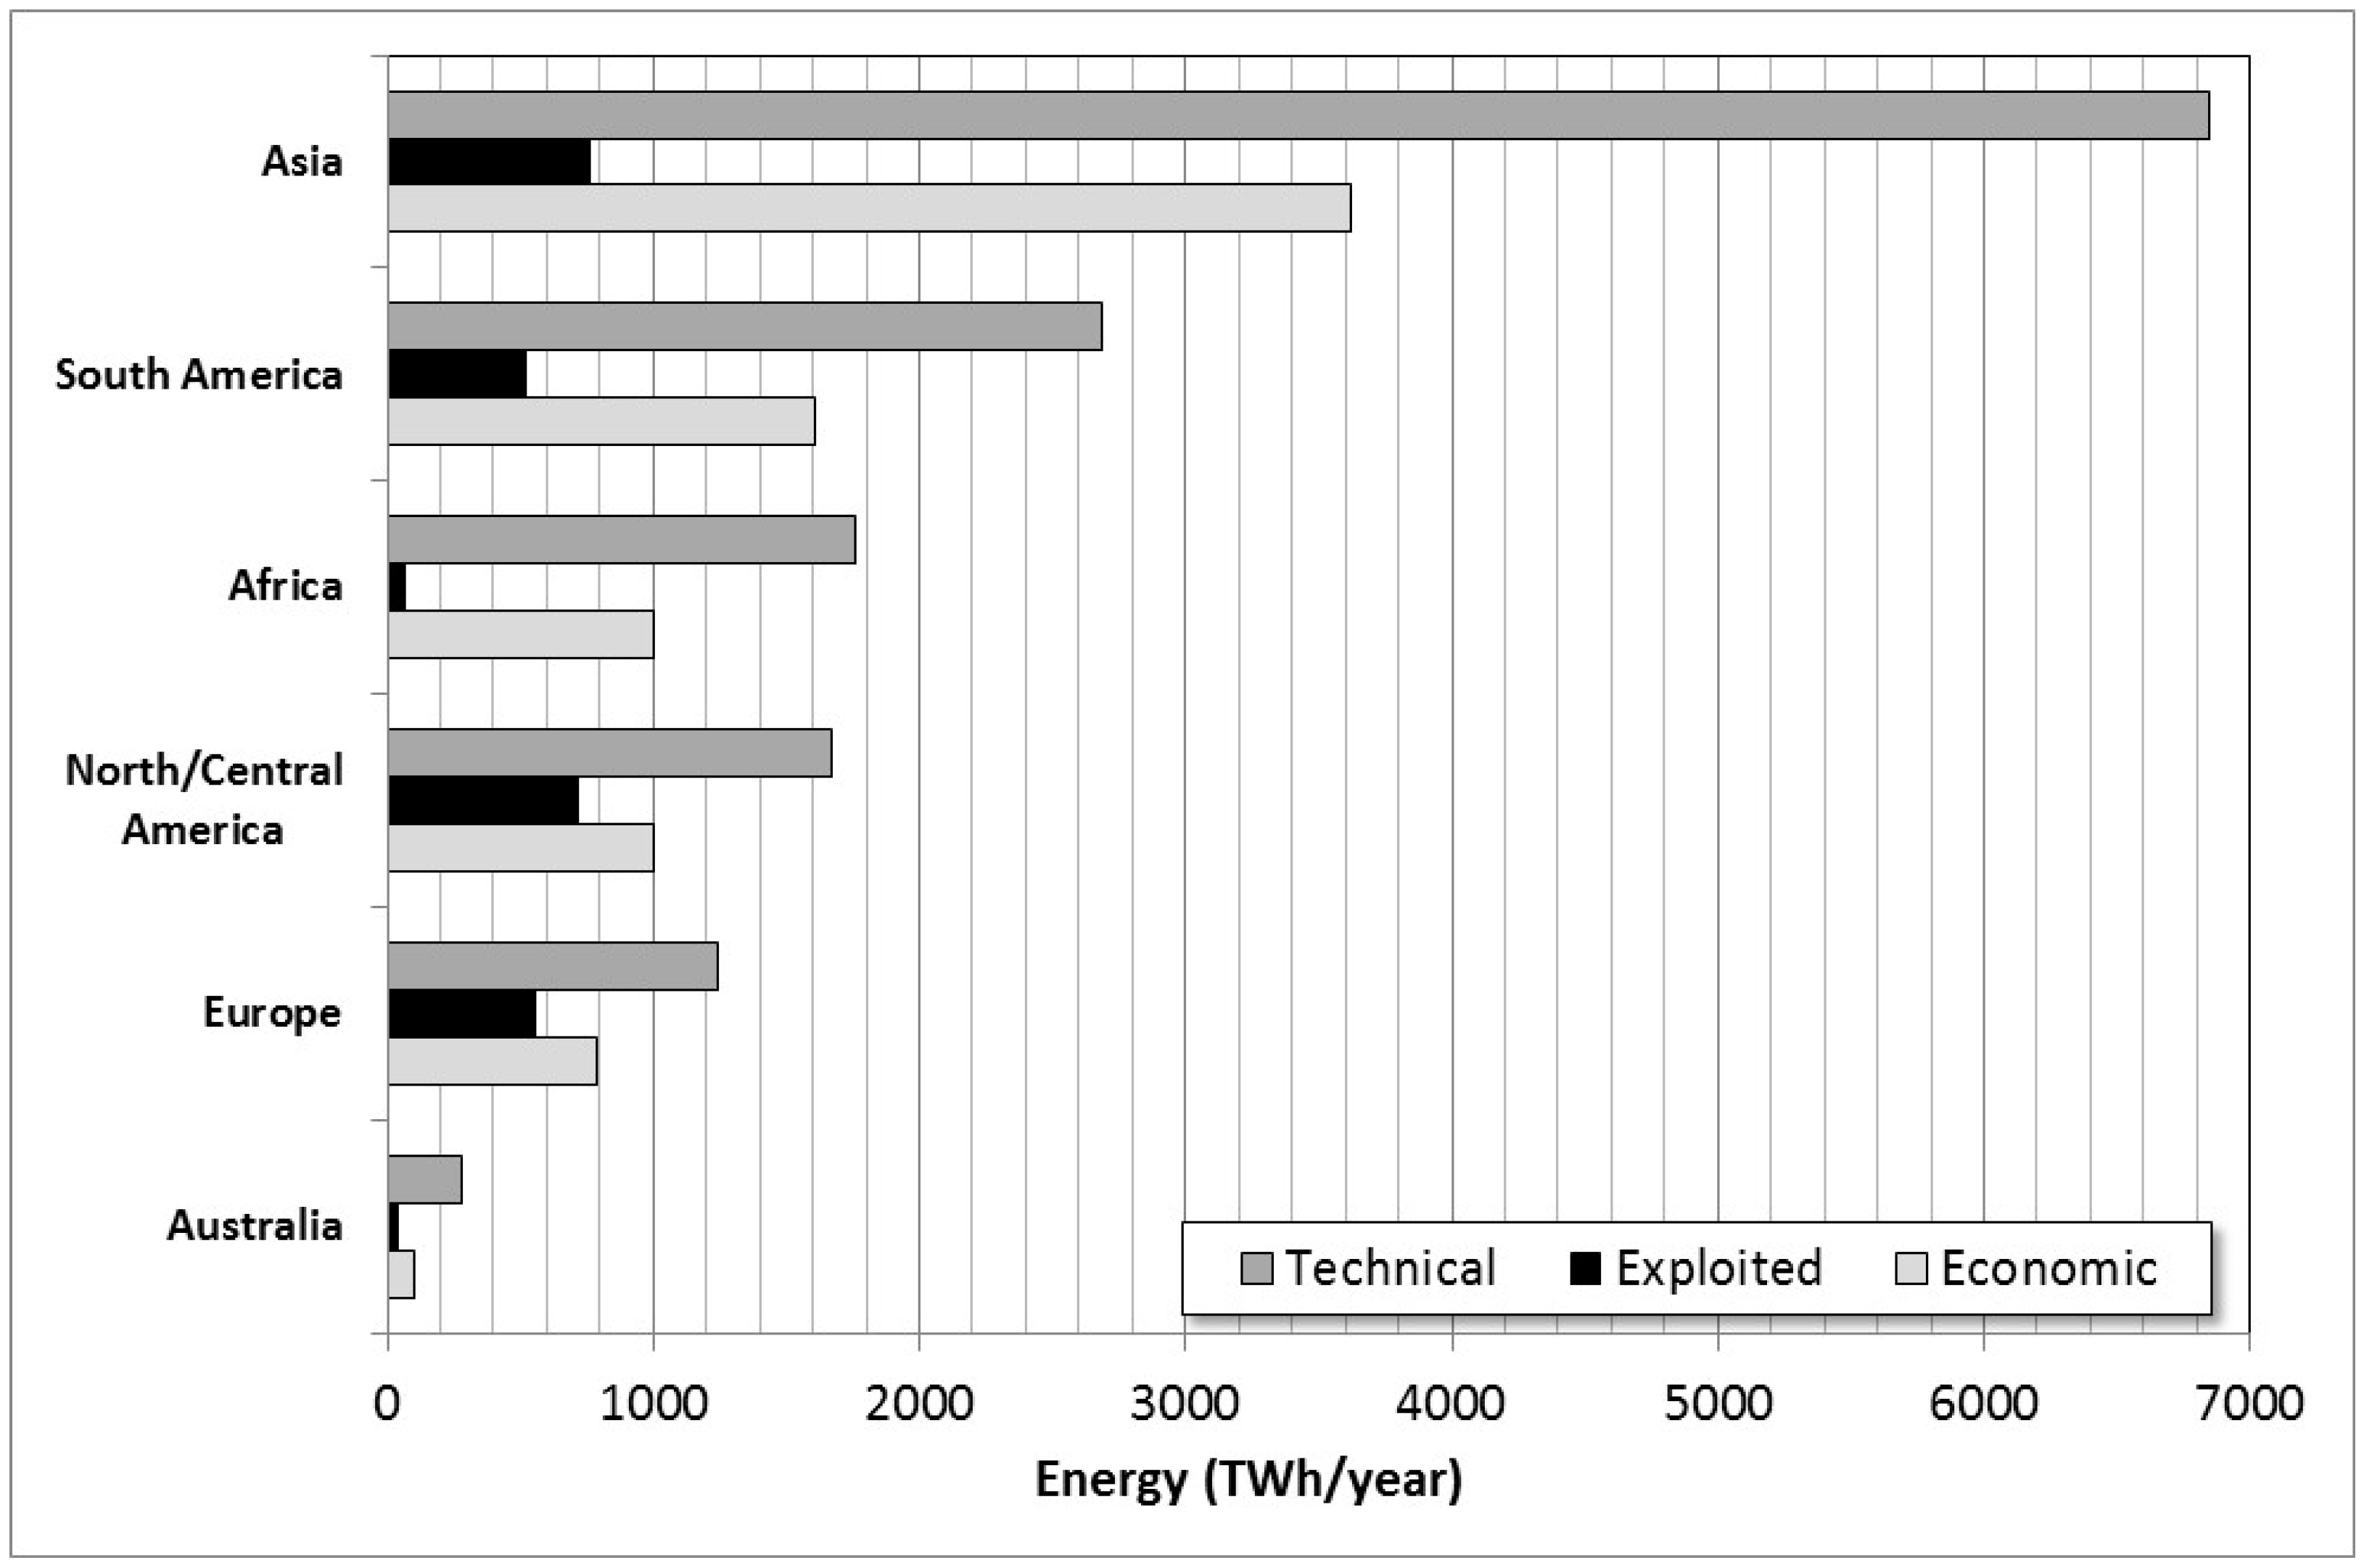
2.1. Large Hydropower
2.2. Small Hydropower
- (1)
- Power plant in flow or run-of-river: This system has no regulation reservoir and only takes advantage of the hydraulic head when the flow circulates. In mountain areas, with medium heads, the flow is diverted through a weir and a penstock carries the flow to the power house. If the topography does not allow it, the hydraulic head must be created by building a higher dam.
- (2)
- Power plant at the foot of a dam: The flow is regulated by a reservoir. In the case of small hydropower, reservoirs or dams are used to ensure project viability.
- (3)
- Power plant in water distribution network: The distribution network is used to take advantage of available pressure or kinetic energy, depending on the system characteristics.
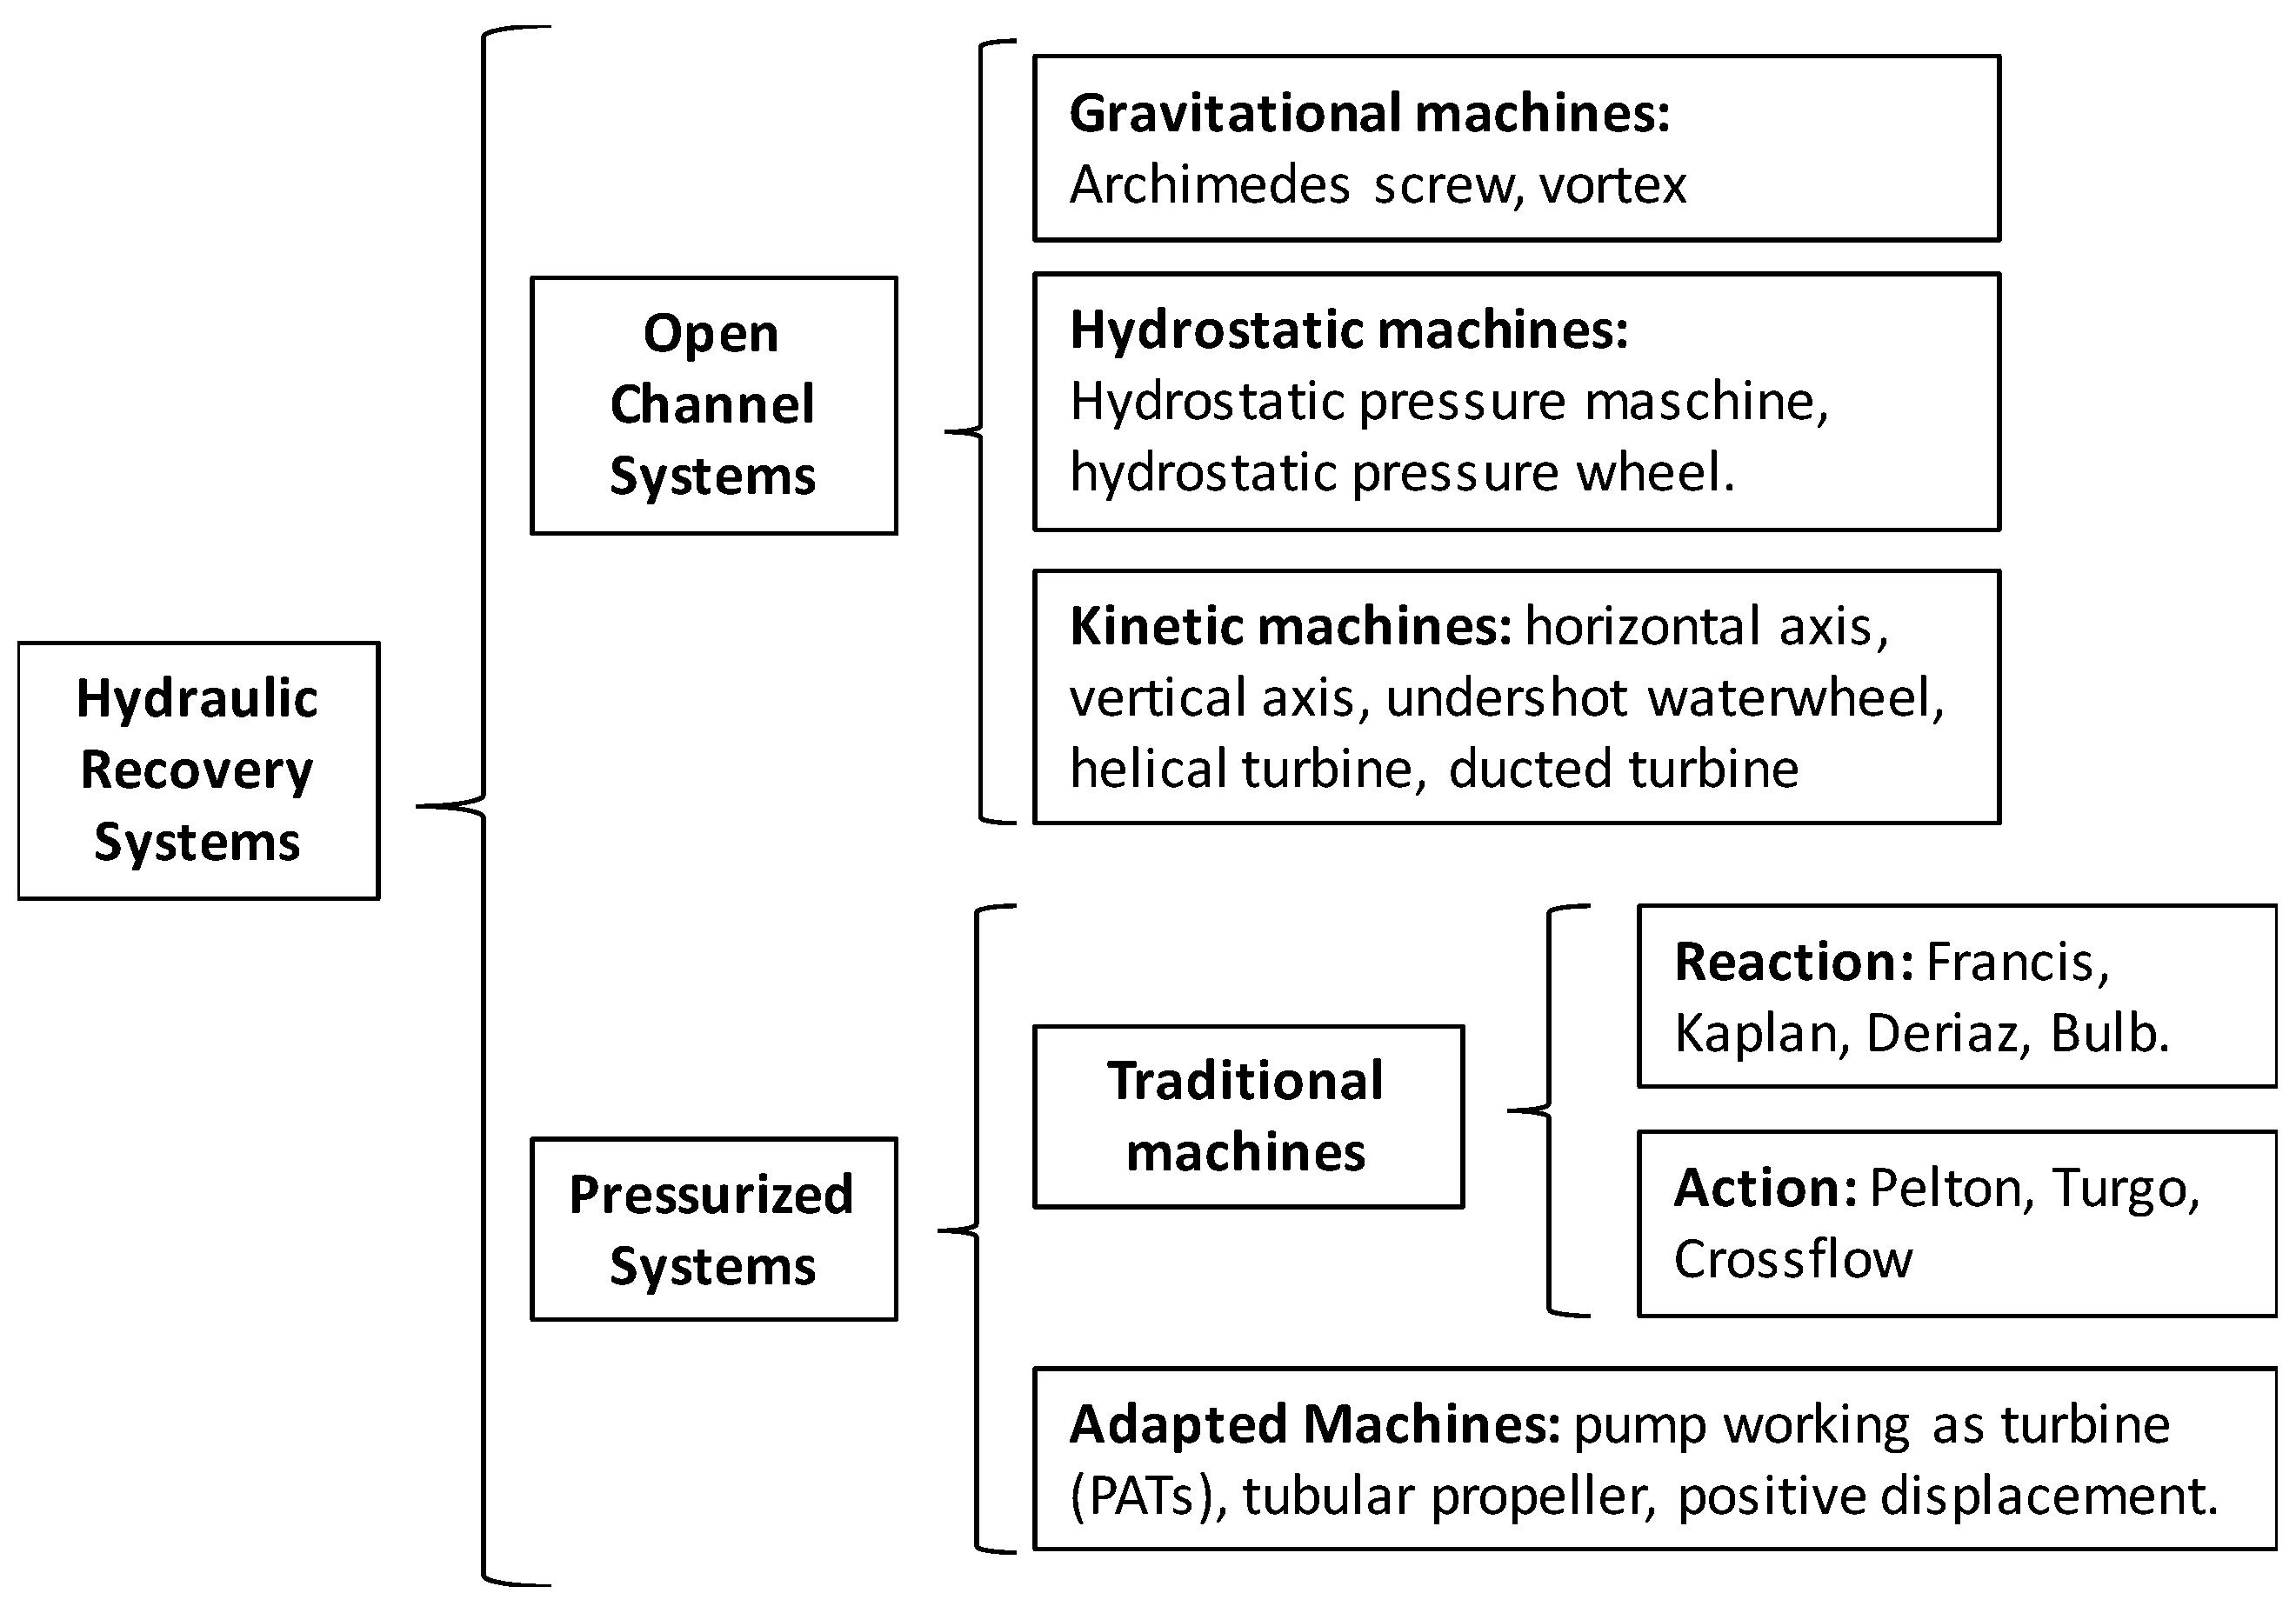
2.3. Type of Hydraulic Machines
3. Micro and Pico Hydropower Solutions
3.1. Energy Recovery in Open Channel Networks
3.2. Energy Recovery Water Pipe and Irrigation Systems
3.3. Strategies for Sustainability and Energy Efficiency in Pressurized Water Networks
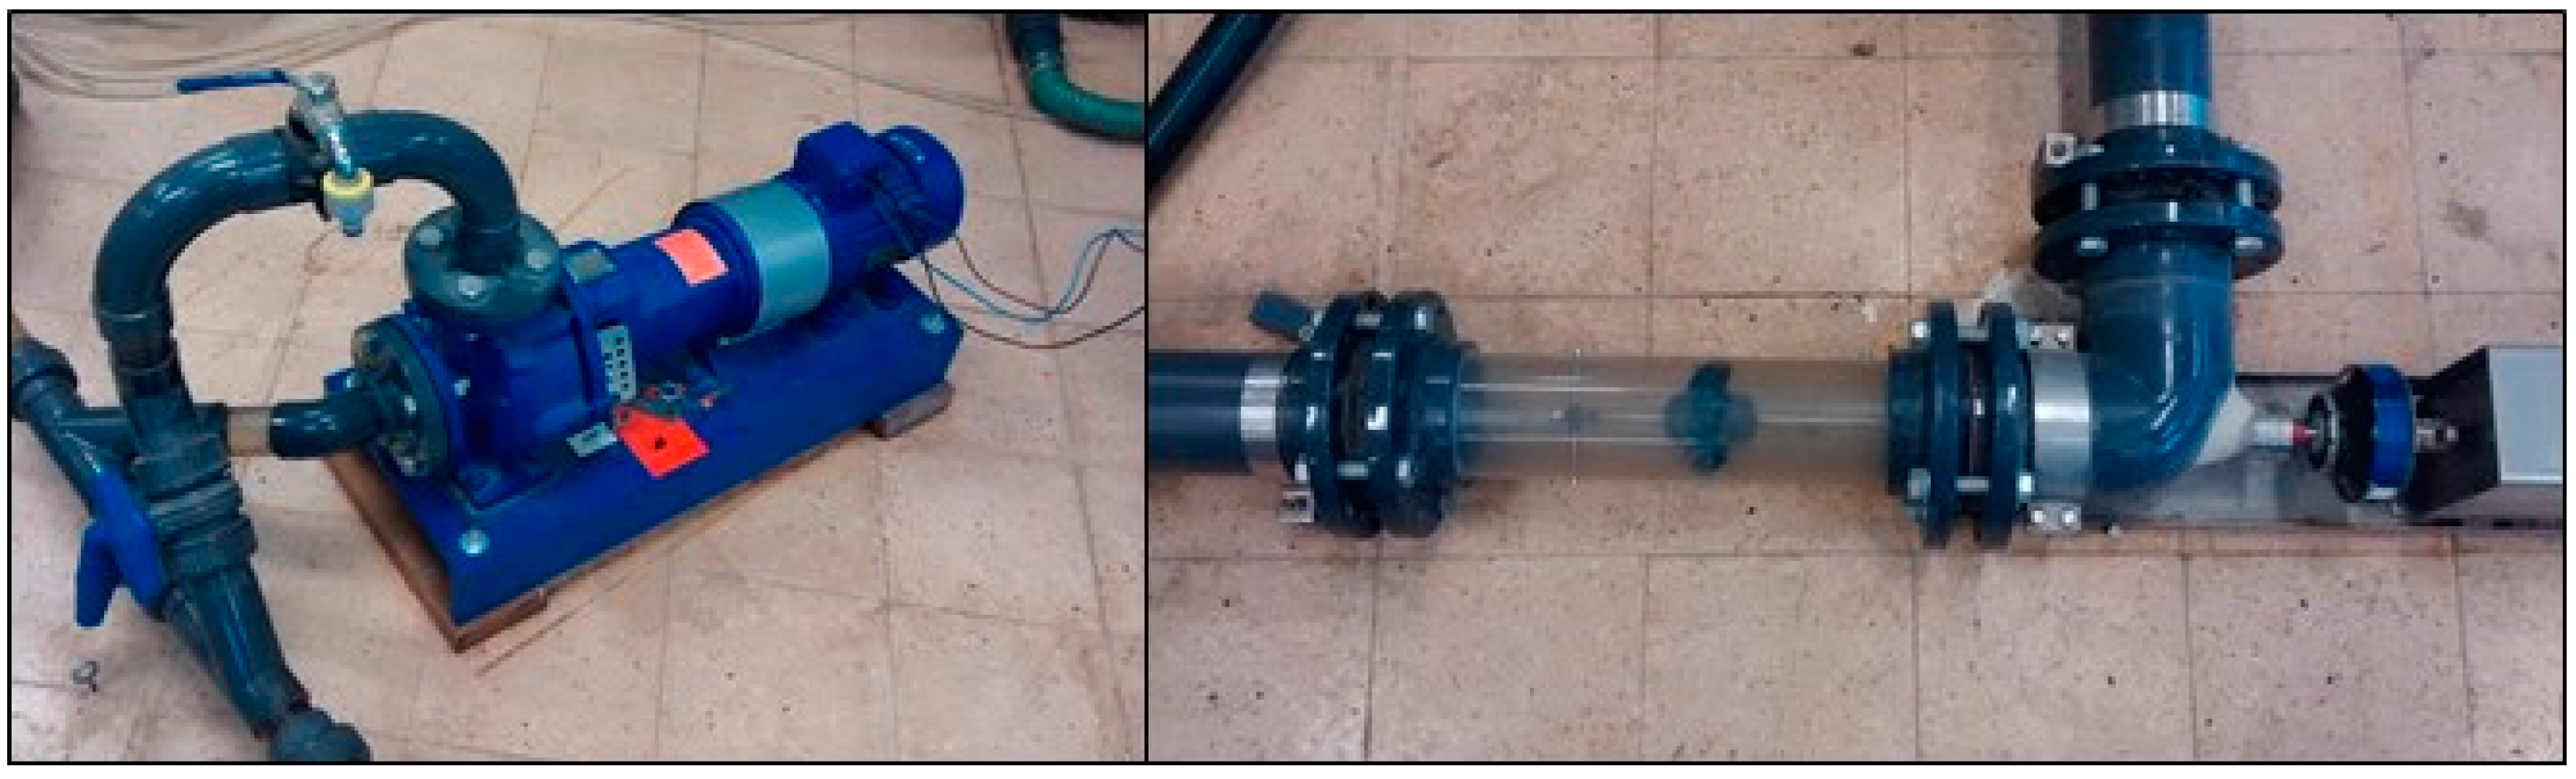
3.3.1. Pumped Water Systems
3.3.2. Gravity Water Systems
4. Conclusions
- (1)
- Recovery systems with less installed power, called mini and pico hydropower plants. These energy recovery systems appeared due to the need to replace waste or non-renewable energy devices with renewable energy solutions. The building of large hydropower plants has been maximized in different developed countries and the development of new large hydropower plants is currently limited due to environmental and social factors. However, the experience in these facilities (i.e., large and small hydropower) has contributed to the development of new recovery systems in pressurized water networks. The most important transfer has been advances in possible recovery machines and improvement in the efficiency of impellers and in water pipe systems as a whole.
- (2)
- The description of machines used in different hydropower plants (i.e., pressurized and open channel flows) has shown that on the one hand, classical machines cannot directly be used or scaled to pico hydropower plants because the adaptation of flow and head presents some difficulties in terms of viability. In contrast, similar or adapted machines can be developed based on classical machines (e.g., Francis turbine vs. radial and mixed PATs; axial turbine vs. tubular propeller or axial PATs). The development of new adapted machines and improvement in the efficiency of the current ones are fundamental challenges for increasing the installation of recovery energy systems in water pipe networks in the near future.
- (3)
- For energy recovery in pico hydropower plants, the PAT is currently the most successful machine to be adapted to these systems, according to previous studies and installed pilot plants. The main positive aspects of these machines are that: (i) the installation of a PAT allows the replacement of a PRV to dissipate excess flow energy; (ii) the PATs’ efficiency values vary between 0.40 and 0.70, operating in reverse mode; (iii) theoretical studies can be developed with the current technology (e.g., computational fluid dynamics (CFD)) based on the classical theory of hydraulic machines (i.e., Euler’s Theorem), for comparison with existing experimental tests; and (iv) they have low investment costs and a high number of available machines. These advantages allow the installation of these machines in water pipe systems to be promoted. The main aspects negative of PATs are related to their low efficiency when operating outside their best efficiency point. Operation with different flows can be solved by the development of new regulation techniques (e.g., variable operation strategies (VOS)) with electronic regulation. The positive resolution of this aspect is a crucial point for expanding use of PATs in water distribution networks. Issues related to the use of the generated energy for self-consumption may include storage in batteries and integrating this renewable energy in a similar manner as other supplementary sources (e.g., solar and wind).
- (4)
- Different case studies have been developed using specific software (e.g., EPANET and WaterGEMS), which have been combined with optimization methodologies to maximize the recovered energy. Future simulations should take into account the integration of VOS as well as the variation of the machine efficiency with the rotational speed. These simulations should consider discretized demand over time to improve the analyzed energy values because the majority of studies only consider the mean demand value or modulation curves. The development of a specific methodology to determine this variation of flow over time in water supply networks is crucial to improve the fit between theoretical and real values of recovered energy. Regarding the software used, it is necessary to implement operation rules for these machines in specific algorithms. This implementation is the key point in the development of optimized techniques, making possible studies similar to those with water pump systems. The primary need is for correct machine selection and establishment of the rotational speed as a function of the flow, maintaining the maximum efficiency at each operation point of the machine.
Acknowledgments
Author Contributions
Conflicts of Interest
References
- Pasten, C.; Santamarina, J.C. Energy and quality of life. Energy Policy 2012, 49, 468–476. [Google Scholar] [CrossRef]
- Huesemann, M.H. The limits of technological solutions to sustainable development. Clean Technol. Environ. Policy 2003, 5, 21–34. [Google Scholar]
- Gilron, J. Water-energy nexus: Matching sources and uses. Clean Technol. Environ. Policy 2014, 16, 1471–1479. [Google Scholar] [CrossRef]
- Emec, S.; Bilge, P.; Seliger, G. Design of production systems with hybrid energy and water generation for sustainable value creation. Clean Technol. Environ. Policy 2015, 17, 1807–1829. [Google Scholar] [CrossRef]
- Fontanazza, C.; Freni, G.; Loggia, G.; Notaro, V.; Puleo, V. Evaluation of the Water Scarcity Energy Cost for Users. Energies 2013, 6, 220–234. [Google Scholar] [CrossRef]
- Herath, I.; Deurer, M.; Horne, D.; Singh, R.; Clothier, B. The water footprint of hydroelectricity: A methodological comparison from a case study in New Zealand. J. Clean. Prod. 2011, 19, 1582–1589. [Google Scholar] [CrossRef]
- Mushtaq, S.; Maraseni, T.N.; Reardon-Smith, K.; Bundschuh, J.; Jackson, T. Integrated assessment of water–energy–GHG emissions tradeoffs in an irrigated lucerne production system in eastern Australia. J. Clean. Prod. 2015, 103, 491–498. [Google Scholar] [CrossRef] [Green Version]
- Hennig, T.; Wang, W.; Feng, Y.; Ou, X.; He, D. Review of Yunnan’s hydropower development. Comparing small and large hydropower projects regarding their environmental implications and socio-economic consequences. Renew. Sustain. Energy Rev. 2013, 27, 585–595. [Google Scholar] [CrossRef]
- Zhang, S.; Pang, B.; Zhang, Z. Carbon footprint analysis of two different types of hydropower schemes: Comparing earth-rockfill dams and concrete gravity dams using hybrid life cycle assessment. J. Clean. Prod. 2014, 103, 854–862. [Google Scholar] [CrossRef]
- Rehman, S.; Al-Hadhrami, L.M.; Alam, M.M. Pumped hydro energy storage system: A technological review. Renew. Sustain. Energy Rev. 2015, 44, 586–598. [Google Scholar] [CrossRef]
- Paish, O. Micro-hydropower: Status and prospects. Proc. Inst. Mech. Eng. A J. Power Energy 2005, 216, 31–40. [Google Scholar] [CrossRef]
- Spänhoff, B. Current status and future prospects of hydropower in Saxony (Germany) compared to trends in Germany, the European Union and the World. Renew. Sustain. Energy Rev. 2014, 30, 518–525. [Google Scholar] [CrossRef]
- Hans-Wilhelm, S. World Energy Scenarios—The Role of Hydropower in Composing Energy Futures to 2050; World Hydropower Congress: Beijing, China, 2015; pp. 40–46. [Google Scholar]
- Eurostat. 2015. Available online: http://ec.europa.eu/eurostat/tgm/refreshTableAction.do?tab=table&plugin=1&pcode=ten00081&language=en (accessed on 31 May 2015).
- López-González, L.M.; Sala-Lizarraga, J.M.; Míguez-Tabarés, J.L.; López-Ochoa, L.M. Contribution of renewable energy sources to electricity production in the autonomous community of Navarre (Spain): A review. Renew. Sustain. Energy Rev. 2007, 11, 1776–1793. [Google Scholar] [CrossRef]
- Castro, A. Minicentrales Hidroeléctricas; Instituto para la Diversificación y Ahorro de la Energía: Madrid, Spain, 2006; Available online: http://www.energiasrenovables.ciemat.es/adjuntos_documentos/Minicentrales_hidroelectricas.pdf (accessed on 10 September 2016).
- Gaudard, L.; Romerio, F. Reprint of “The future of hydropower in Europe: Interconnecting climate, markets and policies”. Environ. Sci. Policy 2014, 43, 5–14. [Google Scholar] [CrossRef]
- Choulot, A. Energy Recovery in Existing Infrastructures with Small Hydropower Plants; FP6 Project Shapes (Work Package 5—WP5); European Directorate for Transport and Energy: Brussels, Belgium, 2010. [Google Scholar]
- Huisingh, D.; Zhang, Z.; Moore, J.C.; Qiao, Q.; Li, Q. Recent advances in carbon emissions reduction: Policies, technologies, monitoring, assessment and modeling. J. Clean. Prod. 2015, 103, 1–12. [Google Scholar] [CrossRef]
- Ihle, C.F. The need to extend the study of greenhouse impacts of mining and mineral processing to hydraulic streams: Long distance pipelines count. J. Clean. Prod. 2014, 84, 597. [Google Scholar] [CrossRef]
- Ramos, H.M.; Almeida, A. Small Hydro as One of the Oldest Renewable Energy Sources; Water Power and Dam Construction; Small Hydro: Lisbon, Portugal, 2000. [Google Scholar]
- Ansar, A.; Flyvbjerg, B.; Budzier, A.; Lunn, D. Should we build more large dams? The actual costs of hydropower megaproject development. Energy Policy 2014, 69, 43–56. [Google Scholar] [CrossRef] [Green Version]
- Hamududu, B.; Killingtveit, A. Assessing Climate Change Impacts on Global Hydropower. Energies 2012, 5, 305–322. [Google Scholar] [CrossRef] [Green Version]
- Chakraborty, D.; Roy, J. Energy and carbon footprint: Numbers matter in low energy and low carbon choices. Curr. Opin. Environ. Sustain. 2013, 5, 237–243. [Google Scholar] [CrossRef]
- Zhang, J.; Xu, L. Embodied carbon budget accounting system for calculating carbon footprint of large hydropower project. J. Clean. Prod. 2015, 96, 444–451. [Google Scholar] [CrossRef]
- Tarragó, E.F.; Ramos, H. Micro-Hydro Solutions in Alqueva Multipurpose Project (AMP) towards Water-Energy-Environmental Efficiency Improvements. Bachelor’s Thesis, Universidade de Lisboa, Lisboa, Portugal, 2015. [Google Scholar]
- Pacca, S. Impacts from decommissioning of hydroelectric dams: A life cycle perspective. Clim. Chang. 2007, 84, 281–294. [Google Scholar] [CrossRef]
- Ramos, H.M.; Teyssier, C.; López-Jiménez, P.A. Optimization of Retention Ponds to Improve the Drainage System Elasticity for Water-Energy Nexus. Water Resour. Manag. 2013, 27, 2889–2901. [Google Scholar] [CrossRef]
- Steffen, B. Prospects for pumped-hydro storage in Germany. Energy Policy 2012, 45, 420–429. [Google Scholar] [CrossRef]
- Deane, J.P.; Gallachóir, B.P.; McKeogh, E.J. Techno-economic review of existing and new pumped hydro energy storage plant. Renew. Sustain. Energy Rev. 2010, 14, 1293–1302. [Google Scholar] [CrossRef]
- Mataix, C. Turbomáquinas Hidráulicas; Universidad Pontificia Comillas: Madrid, Spain, 2009. [Google Scholar]
- Cheng, C.; Liu, B.; Chau, K.W.; Li, G.; Liao, S. China’s small hydropower and its dispatching management. Renew. Sustain. Energy Rev. 2015, 42, 43–55. [Google Scholar] [CrossRef]
- Pereira, A.O.; Cunha, R.; Costa, V.; Marreco, J.; Rovere, E.L. Perspectives for the expansion of new renewable energy sources in Brazil. Renew. Sustain. Energy Rev. 2013, 23, 49–59. [Google Scholar] [CrossRef]
- Kosnik, L. The potential for small scale hydropower development in the US. Energy Policy 2010, 38, 5512–5519. [Google Scholar] [CrossRef]
- Bahadori, A.; Zahedi, G.; Zendehboudi, S. An overview of Australia’s hydropower energy: Status and future prospects. Renew. Sustain. Energy Rev. 2013, 20, 565–569. [Google Scholar] [CrossRef]
- Nautiyal, H.; Singal, S.K.; Sharma, A. Small hydropower for sustainable energy development in India. Renew. Sustain. Energy Rev. 2011, 15, 2021–2027. [Google Scholar] [CrossRef]
- Ushiyama, I. Renewable energy strategy in Japan. Renew. Energy 1999, 16, 1174–1179. [Google Scholar] [CrossRef]
- Liu, H.; Masera, D.; Esser, L. World Small Hydropower Development Report 2013. Available online: www.smallhydroworld.org (accessed on 13 September 2016).
- Miller, C.A.; Altamirano-Allende, C.; Johnson, N.; Agyemang, M. The social value of mid-scale energy in Africa: Redefining value and redesigning energy to reduce poverty. Energy Res. Soc. Sci. 2015, 5, 67–69. [Google Scholar] [CrossRef]
- ESHA. Statistical Releases. 2012. Available online: http://streammap.esha.be/ (accessed on 13 September 2016).
- Alonso-Tristán, C.; González-Peña, D.; Díez-Mediavilla, M.; Rodríguez-Amigo, M.; García-Calderón, T. Small hydropower plants in Spain: A case study. Renew. Sustain. Energy Rev. 2011, 15, 2729–2735. [Google Scholar] [CrossRef]
- Instituto para la Diversificación y Ahorro de la Energía. National Action Plan for Renewable Energy in Spain (PANER) 2011–2020; Ministerio Industria, Turismo y Comercio: Madrid, Spain, 2010; Available online: http://www.idae.es/uploads/documentos/documentos_11227_per_2011-2020_def_93c624ab.pdf (accessed on 8 February 2017).
- European Small Hydropower Association. Current Status of Small Hydropower Development in the EU-27. Available online: http://www.streammap.esha.be/fileadmin/documents/Raising_awareness_doc___press_release/FINAL_SHP_Awareness_2011.pdf (accessed on 15 September 2016).
- Amponsah, N.Y.; Troldborg, M.; Kington, B.; Aalders, I.; Hough, R.L. Greenhouse gas emissions from renewable energy sources: A review of lifecycle considerations. Renew. Sustain. Energy Rev. 2014, 39, 461–475. [Google Scholar] [CrossRef]
- Gallagher, J.; Styles, D.; McNabola, A.; Williams, A.P. Life cycle environmental balance and greenhouse gas mitigation potential of micro-hydropower energy recovery in the water industry. J. Clean. Prod. 2015, 99, 152–159. [Google Scholar] [CrossRef]
- Ogayar, B.; Vidal, P.G. Cost determination of the electro-mechanical equipment of a small hydro-power plant. Renew. Energy 2009, 34, 6–13. [Google Scholar] [CrossRef]
- Paish, O. Small hydro power: Technology and current status. Renew. Sustain. Energy Rev. 2002, 6, 537–556. [Google Scholar] [CrossRef]
- Mishra, S.; Singal, S.K.; Khatod, D.K. Optimal installation of small hydropower plant—A review. Renew. Sustain. Energy Rev. 2011, 15, 3862–3869. [Google Scholar] [CrossRef]
- European Small Hydropower Association. Guía Para El Desarrollo de Una Pequeña Central Hidroeléctrica. European Small Hydropower Association. 2006. Available online: www.esha.be/fileadmin/esha_files/.../GUIDE_SHP_ES_01.pdf (accessed on 15 September 2016). (In Spanish)
- Ramos, H. Guidelines for Design of Small Hydropower Plants; WREAN (Western Regional Energy Agency &Network) and DED (Department of Economic Development): Belfast, North-Ireland, UK, 2000. [Google Scholar]
- Yuce, M.I.; Muratoglu, A. Hydrokinetic energy conversion systems: A technology status review. Renew. Sustain. Energy Rev. 2015, 43, 72–82. [Google Scholar] [CrossRef]
- Ramos, H.M.; Almeida, A. Caracterização Dinâmica Global do Funcionamento de Aproveitamentos Hidroeléctricos; IV SILUSBA–Simpósio de Hidráulica e Recursos Hídricos dos Países de Língua Oficial Portuguesa: Lisboa, Portugal, 1999. (In Portuguese) [Google Scholar]
- Gordon, J.L. Hydraulic turbine efficiency. Can. J. Civ. Eng. 2001, 28, 238–253. [Google Scholar] [CrossRef]
- Chapallaz, J.M. Manual on Pumps Used as Turbines; Vieweg: Braunschweig, Germany, 1992. [Google Scholar]
- Caxaria, G.; Mesquita, D.; Ramos, H.M. Small Scale Hydropower: Generator Analysis and Optimization for Water Supply Systems; World Renewable Energy Congress: Linköping, Sweden, 2011; pp. 1386–1393. [Google Scholar]
- Simão, M.; Ramos, H.M. Hydrodynamic and performance of low power turbines: Conception, modelling and experimental tests. Int. J. Energy Environ. 2010, 1, 431–444. [Google Scholar]
- Ramos, H.; Borga, A. Pumps as turbines: An unconventional solution to energy production. Urban Water 1999, 1, 261–263. [Google Scholar] [CrossRef]
- Arriaga, M. Pump as turbine—A pico-hydro alternative in Lao People’s Democratic Republic. Renew. Energy 2010, 35, 1109–1115. [Google Scholar] [CrossRef]
- Carravetta, A.; Fecarotta, O.; Del Giudice, G.; Ramos, H. Energy Recovery in Water Systems by PATs: A Comparisons among the Different Installation Schemes. Procedia Eng. 2014, 70, 275–284. [Google Scholar] [CrossRef]
- Fecarotta, O.; Aricò, C.; Carravetta, A.; Martino, R.; Ramos, H.M. Hydropower Potential in Water Distribution Networks: Pressure Control by PATs. Water Resour. Manag. 2014, 29, 699–714. [Google Scholar] [CrossRef] [Green Version]
- Derakhshan, S.; Nourbakhsh, A. Experimental study of characteristic curves of centrifugal pumps working as turbines in different specific speeds. Exp. Therm. Fluid Sci. 2008, 32, 800–807. [Google Scholar] [CrossRef]
- Carravetta, A.; Del Giudice, G.; Fecarotta, O.; Ramos, H. Pump as Turbine (PAT) Design in Water Distribution Network by System Effectiveness. Water 2013, 5, 1211–1225. [Google Scholar] [CrossRef]
- Carravetta, A.; Del Giudice, G.; Fecarotta, O.; Ramos, H.M. Energy Production in Water Distribution Networks: A PAT Design Strategy. Water Resour. Manag. 2012, 26, 3947–3959. [Google Scholar] [CrossRef]
- Elbatran, A.H.; Yaakob, O.B.; Ahmed, Y.M.; Shabara, H.M. Operation, performance and economic analysis of low head micro-hydropower turbines for rural and remote areas: A review. Renew. Sustain. Energy Rev. 2015, 43, 40–50. [Google Scholar] [CrossRef]
- Nourbakhsh, A.; Jahangiri, G. Inexpensive small hydropower stations for small areas of developing countries. In Proceedings of the Conference on Advanced in Planning-Design and Management of Irrigation Systems as Related to Sustainable Land Use, Louvain, Belgium, 14–17 September 1992; pp. 313–319.
- Kumar, D.; Katoch, S.S. Small hydropower development in western Himalayas: Strategy for faster implementation. Renew. Energy 2015, 77, 571–578. [Google Scholar] [CrossRef]
- Razan, J.I.; Islam, R.S.; Hasan, R.; Hasan, S.; Islam, F. A Comprehensive Study of Micro-Hydropower Plant and Its Potential in Bangladesh. Renew. Energy 2012, 2012, 635396. [Google Scholar] [CrossRef]
- Ohunakin, O.S.; Ojolo, S.J.; Ajayi, O.O. Small hydropower (SHP) development in Nigeria: An assessment. Renew. Sustain. Energy Rev. 2011, 15, 2006–2013. [Google Scholar] [CrossRef]
- Vicente, S.; Bludszuweit, H. Flexible design of a pico-hydropower system for Laos communities. Renew. Energy 2012, 44, 406–413. [Google Scholar] [CrossRef]
- Punys, P.; Dumbrauskas, A.; Kasiulis, E.; Vyčienė, G.; Šilinis, L. Flow Regime Changes: From Impounding a Temperate Lowland River to Small Hydropower Operations. Energies 2015, 8, 7478–7501. [Google Scholar] [CrossRef]
- Abbasi, T.; Abbasi, S.A. Small hydro and the environmental implications of its extensive utilization. Renew. Sustain. Energy Rev. 2011, 15, 2134–2143. [Google Scholar] [CrossRef]
- Punys, P.; Dumbrauskas, A.; Kvaraciejus, A.; Vyciene, G. Tools for Small Hydropower Plant Resource Planning and Development: A Review of Technology and Applications. Energies 2011, 4, 1258–1277. [Google Scholar] [CrossRef]
- Vilanova, M.R.; Balestieri, J.A. Hydropower recovery in water supply systems: Models and case study. Energy Convers. Manag. 2014, 84, 414–426. [Google Scholar] [CrossRef]
- Novara, D.; Stanek, W.; Ramos, H. Energy Harvesting from Municipal Water Management Systems: From Storage and Distribution to Wastewater Treatment. Master’s Thesis, Universidade de Lisboa, Lisboa, Portugal, 2016. [Google Scholar]
- Senior, J.A.; Muller, G.; Wiemann, P. The development of the rotary hydraulic pressure machine. In Proceedings of the Congress IAHR, Venice, Italy, 1–6 July 2007.
- Senior, J.A.; Saenger, N.; Müller, G. New hydropower converters for very low-head differences. J. Hydraul. Res. 2010, 48, 703–714. [Google Scholar] [CrossRef]
- Adhau, S.P.; Moharil, R.M.; Adhau, P.G. Mini-hydro power generation on existing irrigation projects: Case study of Indian sites. Renew. Sustain. Energy Rev. 2012, 16, 4785–4795. [Google Scholar] [CrossRef]
- Tilmant, A.; Goor, Q.; Pinte, D. Agricultural-to-hydropower water transfers: Sharing water and benefits in hydropower-irrigation systems. Hydrol. Earth Syst. Sci. 2009, 13, 1091–1101. [Google Scholar] [CrossRef]
- Butera, I.; Balestra, R. Estimation of the hydropower potential of irrigation networks. Renew. Sustain. Energy Rev. 2015, 48, 140–151. [Google Scholar] [CrossRef]
- Coelho, B.; Andrade-Campos, A. Efficiency achievement in water supply systems—A review. Renew. Sustain. Energy Rev. 2014, 30, 59–84. [Google Scholar] [CrossRef]
- Klein, G.; Krebs, M.; Hall, V.; O’Brien, T.; Blevins, B.B. California’s Water—Energy Relationship; California Energy Commission: Sacramento, CA, USA, 2005. [Google Scholar]
- Almandoz, J.; Cabrera, E.; Arregui, F.; Cobacho, R. Leakage Assessment through Water Distribution Network Simulation. J. Water Resour. Plan. Manag. 2005, 131, 458–466. [Google Scholar] [CrossRef]
- Carravetta, A.; Del Giudice, G.; Oreste, F.; Ramos, H. PAT design strategy for energy recovery in water distribution networks by electrical regulation. Energies 2013, 6, 411–424. [Google Scholar] [CrossRef]
- Colombo, A.F.; Karney, B.W. Energy and Costs of Leaky Pipes: Toward Comprehensive Picture. J. Water Resour. Plan. Manag. 2002, 128, 441–450. [Google Scholar] [CrossRef]
- Fecarotta, O.; Carravetta, A.; Ramos, H.M.; Martino, R. An improved affinity model to enhance variable operating strategy for pumps used as turbines. J. Hydraul. Res. 2016, 54, 332–341. [Google Scholar] [CrossRef]
- Sitzenfrei, R.; von Leon, J. Long-time simulation of water distribution systems for the design of small hydropower systems. Renew Energy 2014, 72, 182–187. [Google Scholar] [CrossRef]
- Fontana, N.; Giugni, M.; Portolano, D. Losses Reduction and Energy Production in Water-Distribution Networks. J. Water Resour. Plan. Manag. 2012, 138, 237–244. [Google Scholar] [CrossRef]
- Ramos, H.; Mello, M.; De, P.K. Clean power in water supply systems as a sustainable solution: From planning to practical implementation. Water Sci. Technol. Water Supply 2010, 10, 39–49. [Google Scholar] [CrossRef]
- Hong Kong Polytechnic University, Novel Inline Hydropower System for Power Generation from Water Pipelines. Available online: http://phys.org/news/2012-12-inline-hydropower-power-pipelines.html (accessed on 16 August 2016).
- Imbernón, J.A.; Usquin, B. Sistemas de generación hidráulica. Una nueva forma de entender la energía. In Proceedings of the II Congreso Smart Grid, Madrid, Spain, 27–28 October 2014. (In Spanish)
- Lisk, B.; Greenberg, E.; Bloetscher, F. Implementing Renewable Energy at Water Utilities; Case Studies; Water Research Foundation: Denver, CO, USA, 2012. [Google Scholar]
- McNabola, A.; Coughlan, P.; Williams, A.P. Energy recovery in the water industry: An assessment of the potential of micro hydropower. Water Environ. J. 2014, 28, 294–304. [Google Scholar] [CrossRef]
- Food and Agriculture Organization (FAO). Aquastat. 2015. Available online: http://www.fao.org/nr/water/aquastat/data/query/results.html?regionQuery=true&yearGrouping=SURVEY&showCodes=false&yearRange.fromYear=1958&yearRange.toYear=2017&varGrpIds=4250%2C4251%2C4252%2C4253%2C4257&cntIds=®Ids=9805%2C9806%2C9807%2C9808%2C9809&edit (accessed on 9 June 2015).
- Seoane, P.; Allué, R.; Postigo, M.J.; Cordón, M.A. Boletín Mensual de Estadística; Instituto Nacional de Estadística: Madrid, Spain, 2013. (In Spanish) [Google Scholar]
- Food and Agriculture Organization (FAO). Agua Y Cultivos, 2002. Available online: http://www.fao.org/docrep/005/y3918s/y3918s10.htm (accessed on 19 September 2016). (In Spanish)
- Maestu, J.; Villar, A. Precios Y Costes de Los Servicios Del Agua En España, Madrid, Spain, 2007. Available online: http://hispagua.cedex.es/sites/default/files/especiales/Tarifas_agua/precios_costes_servicios_agua.pdf (accessed on 19 September 2016). (In Spanish)
- MAGRAMA. El Riego Localizado Alcanza el 48.23% de la Superficie Regada en España. Minist Agric Aliment y Medio Ambient. 2014. Available online: http://www.magrama.gob.es/gl/prensa/noticias/el-riego-localizado-alcanza-el-4823--de-la-superficie-regada-en-espa%C3%B1a-/tcm7-312671-16 (accessed on 9 June 2015). (In Spanish)
- Instituto para la Diversificación y Ahorro de la Energía. Ahorro Y Eficiencia Energética en Agricultura de Regadío; Ministerio Industria, Turismo y Comercio: Madrid, Spain, 2005. (In Spanish) [Google Scholar]
- Rodríguez-Díaz, J.A.; Montesinos, P.; Poyato, E.C. Detecting Critical Points in On-Demand Irrigation Pressurized Networks—A New Methodology. Water Resour. Manag. 2012, 26, 1693–1713. [Google Scholar] [CrossRef]
- Moreno, M.A.; Planells, P.; Córcoles, J.I.; Tarjuelo, J.M.; Carrión, P.A. Development of a new methodology to obtain the characteristic pump curves that minimize the total cost at pumping stations. Biosyst. Eng. 2009, 102, 95–105. [Google Scholar] [CrossRef]
- Jiménez-Bello, M.A.; Royuela, A.; Manzano, J.; Prats, A.G.; Martínez-Alzamora, F. Methodology to improve water and energy use by proper irrigation scheduling in pressurised networks. Agric. Water Manag. 2015, 149, 91–101. [Google Scholar] [CrossRef]
- Prats, A.G.; Picó, S.G.; Alzamora, F.M.; Bello, M.A. Random Scenarios Generation with Minimum Energy Consumption Model for Sectoring Optimization in Pressurized Irrigation Networks Using a Simulated Annealing Approach. J. Irrig. Drain. Eng. 2012, 138, 613–624. [Google Scholar] [CrossRef]
- Costa, L.; de Athayde-Prata, B.; Ramos, H.; de Castro, M. A Branch-and-Bound Algorithm for Optimal Pump Scheduling in Water Distribution Networks. Water Resour. Manag. 2015, 30, 1037–1052. [Google Scholar] [CrossRef]
- Rossman, L.A. EPANET 2 User’s Manual; U.S. Environmental Protection Agency (EPA): Cincinnati, OH, USA, 2000.
- Cabrera, E.; Cobacho, R.; Soriano, J. Towards an Energy Labelling of Pressurized Water Networks. Procedia Eng. 2014, 70, 209–217. [Google Scholar] [CrossRef]
- Samora, I.; Franca, M.; Schleiss, A.; Ramos, H.M. Simulated Annealing in Optimization of Energy Production in a Water Supply Network. Water Resour. Manag. 2016, 30, 1533–1547. [Google Scholar] [CrossRef]
- Pérez-Sánchez, M.; Sánchez-Romero, F.; Ramos, H.; López-Jiménez, P. Modeling Irrigation Networks for the Quantification of Potential Energy Recovering: A Case Study. Water 2016, 8, 234. [Google Scholar] [CrossRef]
- Samora, I.; Manso, P.; Franca, M.J.; Schleiss, A.J.; Ramos, H.M. Opportunity and Economic Feasibility of Inline Microhydropower Units in Water Supply Networks. J. Water Resour. Plan. Manag. 2016, 142, 04016052. [Google Scholar] [CrossRef]
- Kirkpatrick, S.; Gelatt, C.; Vecchi, M. Optimization by simulated annealing. Science 1983, 220, 671–680. [Google Scholar] [CrossRef] [PubMed]
- Forouzbakhsh, F.; Hosseini, S.M.H.; Vakilian, M. An approach to the investment analysis of small and medium hydro-power plants. Energy Policy 2007, 35, 1013–1024. [Google Scholar] [CrossRef]
- Zema, D.A.; Nicotra, A.; Tamburino, V.; Zimbone, S.M. A simple method to evaluate the technical and economic feasibility of micro hydro power plants in existing irrigation systems. Renew. Energy 2016, 85, 498–506. [Google Scholar] [CrossRef]
- Rawal, S.; Kshirsagar, J. Simulation on a pump operating in a turbine mode. In Proceedings of the 23rd International Pump Users Symposium, Houston, TX, 5–8 March 2007; Texas A&M University: College Station, TX, USA, 2007; pp. 21–27. [Google Scholar]
- Singh, P. Optimization of the Internal Hydraulic and of System Design in Pumps as Turbines with Field Implementation and Evaluation. 2005. Available online: http://docplayer.net/18607634-Optimization-of-internal-hydraulics-and-of-system-design-for-pumps-as-turbines-with-field-implementation-and-evaluation.html (accessed on 19 September 2016).
- Samora, I.; Manso, P.; Franca, M.; Schleiss, A.; Ramos, H. Energy Recovery Using Micro-Hydropower Technology in Water Supply Systems: The Case Study of the City of Fribourg. Water 2016, 8, 344. [Google Scholar] [CrossRef]


| Analyzed Topic | References |
|---|---|
| First PAT | [54] |
| Reduction of leaks, decreasing the pressure in water supply systems and increasing the efficiency | [57,60,80,82,84,87] |
| Proposal to use adapted machines (PATs and tubular propeller) in water supply systems to reduce the pressure | [55,57] |
| Description and operation of a PAT with a review of available technologies | [56,64,67,75,76] |
| Performance and modeling PAT | [56,58,61,65,85] |
| Installation of recovery systems in water supply networks | [59,79] |
| Implementation of simulations to determine the theoretical recovered energy in water supply and irrigation systems | [26,74,77,86,106,107,108] |
| Design of variable operating strategies to maximize the recovered energy | [59,60,62,84] |
| Economic cost of implementing recovery systems in water supply and irrigation networks | [8,16,64,84] |
| Environmental advantages | [66,78,88] |
| Policies and analyses to help the development of rural areas | [41,58,68,69,70,71,72] |
| Pilot plants built in water supply networks | [89,90,91,92] |
| Optimization to maximize recovered energy in water supply systems | [106] |
© 2017 by the authors. Licensee MDPI, Basel, Switzerland. This article is an open access article distributed under the terms and conditions of the Creative Commons Attribution (CC BY) license ( http://creativecommons.org/licenses/by/4.0/).
Share and Cite
Pérez-Sánchez, M.; Sánchez-Romero, F.J.; Ramos, H.M.; López-Jiménez, P.A. Energy Recovery in Existing Water Networks: Towards Greater Sustainability. Water 2017, 9, 97. https://doi.org/10.3390/w9020097
Pérez-Sánchez M, Sánchez-Romero FJ, Ramos HM, López-Jiménez PA. Energy Recovery in Existing Water Networks: Towards Greater Sustainability. Water. 2017; 9(2):97. https://doi.org/10.3390/w9020097
Chicago/Turabian StylePérez-Sánchez, Modesto, Francisco Javier Sánchez-Romero, Helena M. Ramos, and P. Amparo López-Jiménez. 2017. "Energy Recovery in Existing Water Networks: Towards Greater Sustainability" Water 9, no. 2: 97. https://doi.org/10.3390/w9020097
APA StylePérez-Sánchez, M., Sánchez-Romero, F. J., Ramos, H. M., & López-Jiménez, P. A. (2017). Energy Recovery in Existing Water Networks: Towards Greater Sustainability. Water, 9(2), 97. https://doi.org/10.3390/w9020097