A Natural Analogue Approach for Discriminating Leaks of CO2 Stored Underground Using Groundwater Geochemistry Statistical Methods, South Korea


Abstract
:1. Introduction
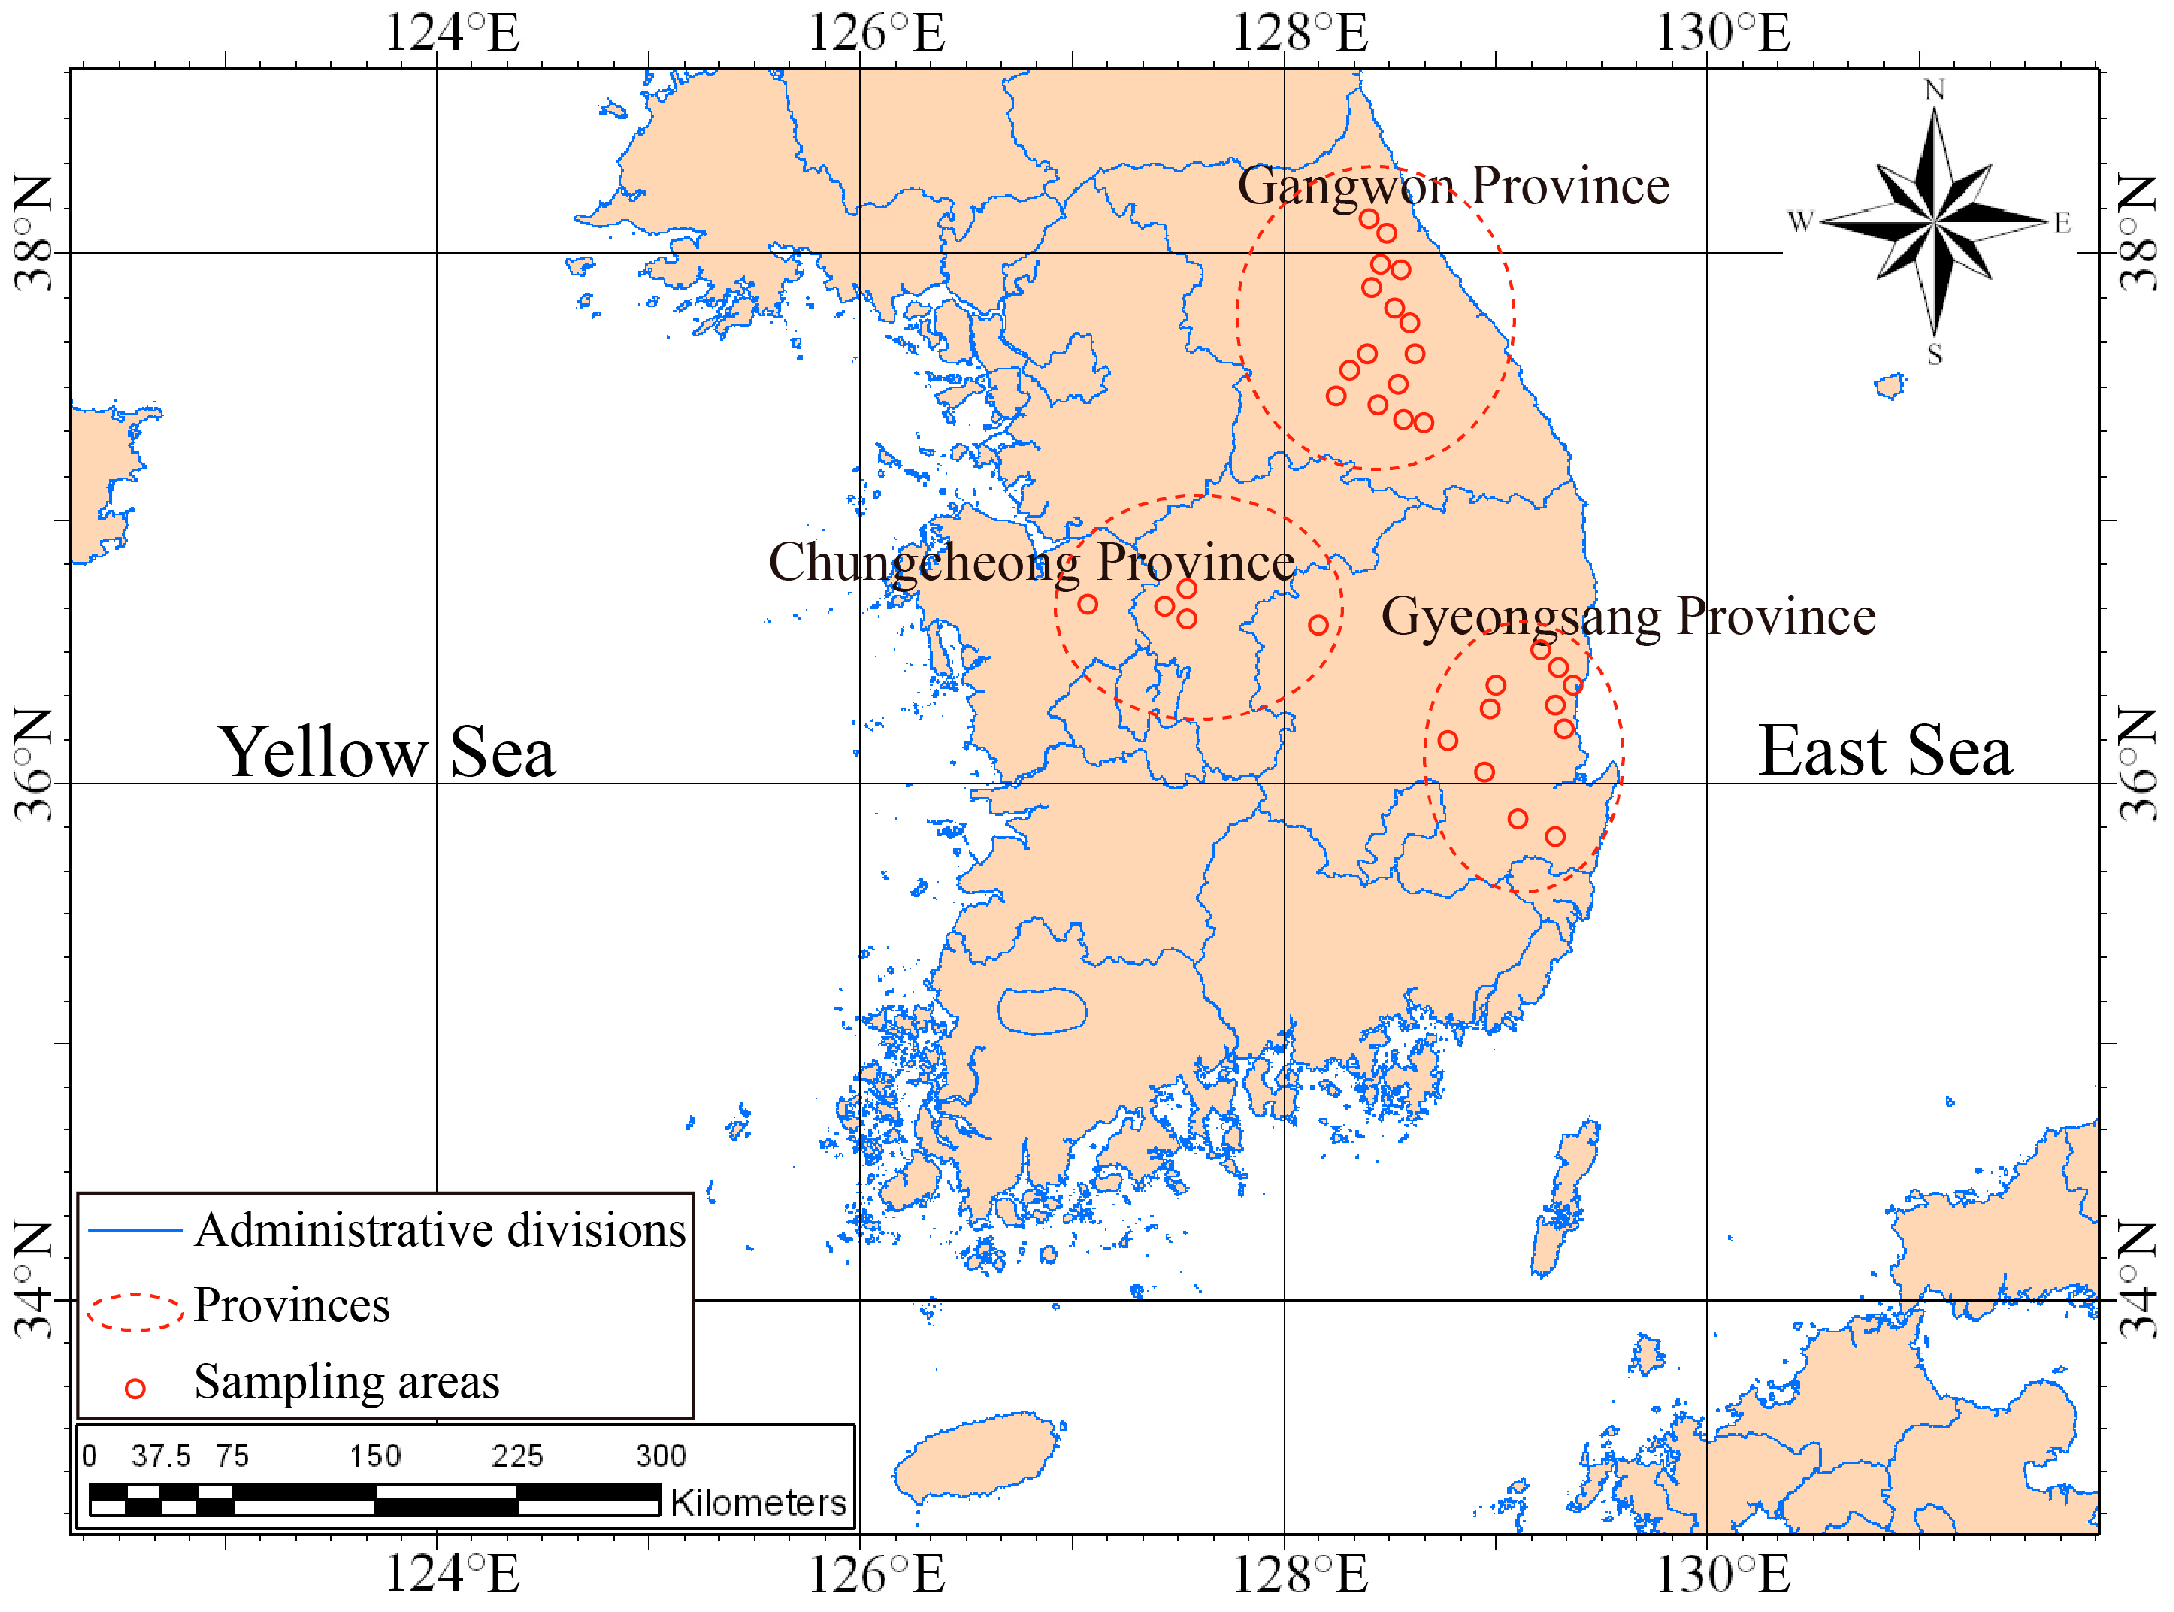
2. Geological Setting
3. Methods
3.1. Statistical Procedure
3.2. Goodness of Fit Test for Distribution
3.2.1. Kolmogorov–Smirnov Test
3.2.2. Anderson–Darling Test
3.2.3. Chi-Squared Test
3.3. Probability Density Function
3.4. Monte Carlo Simulations
3.5. Comparing the PDFs of the CO2-Rich and Ordinary Groundwaters
4. Results and Discussion
4.1. Gangwon Province
4.2. Gyeongsang Province
4.3. Chungcheong Province
4.4. Discussion
5. Conclusions
Acknowledgments
Author Contributions
Conflicts of Interest
References
- Yun, S.-T. K-COSEM, Environmental Management Technology of CO2 Storage. ; R & D Planning Report; Ministry of Environment: Sejong City, Korea, 2014.
- Kharka, Y.K.; Cole, D.R.; Thordsen, J.J.; Kakouros, E.; Nance, H.S. Gas–water–rock interactions in sedimentary basins: CO2 sequestration in the Frio Formation, Texas, USA. J. Geochem. Explor. 2006, 8, 183–186. [Google Scholar] [CrossRef]
- Raistrick, M.; Mayer, B.; Shevalier, M.; Perez, R.J.; Hutcheon, I.; Perkins, E.; Gunter, B. Using chemical and isotopic data to quantify ionic trapping of injected carbon dioxide in oil field brines. Environ. Sci. Technol. 2006, 40, 6744–6749. [Google Scholar] [CrossRef] [PubMed]
- Mayer, B.; Shevalier, M.; Nightingale, M.; Kwon, J.; Johnson, G.; Raistrick, M.; Hutcheon, I.; Perkins, E. Tracing the movement and the fate of injected CO2 at the IEA GHG Weyburn–Midale CO2 monitoring and storage project (Saskatchewan, Canada) using carbon isotope ratios. Int. J. Greenh. Gas Control 2013, 16, 177–184. [Google Scholar] [CrossRef]
- Johnson, G.; Mayer, B.; Shevalier, M.; Nightingale, M.; Hutcheon, I. Quantifying CO2 pore-space saturation at the Pembina Cardium CO2 monitoring pilot (Alberta, Canada) using oxygen isotopes of reservoir fluids and gases. Energy Procedia 2011, 4, 3942–3948. [Google Scholar] [CrossRef]
- Walton, F.B.; Tait, J.C.; LeNeveu, D.; Sheppard, M.I. Geological storage of CO2: A statistical approach to assessing performance and risk. In Proceedings of the 7th International Conference Greenhouse Gas Control Technologies, Vancouver, BC, Canada, 5–9 September 2004. [Google Scholar]
- Apps, J.A.; Birkholzer, J.T.; Spycher, N.; Zheng, L.; Ambats, G.; Herkelrath, W.N.; Kharaka, Y.K.; Thordsen, J.J.; Kakouros, E.; Beers, S.; et al. Groundwater Chemistry Changes as a Result of CO2 Injection at the ZERT Field Site in Bozeman, Montana; Project Report; Lawrence Berkeley National Laboratory: Berkeley, CA, USA, 2010; pp. 25–68.
- Yang, Y.-M.; Small, M.J.; Ogretim, E.O.; Gray, D.D.; Bromhal, G.S.; Strazisar, B.R.; Wells, A.W. Probabilistic design of a near-surface CO2 leak detection system. Environ. Sci. Technol. 2011, 45, 6380–6387. [Google Scholar] [CrossRef] [PubMed]
- Damen, K.; Faaij, A.; Turkenburg, W. Health, safety and environmental risks of underground CO2 storage—Overview of mechanisms and current knowledge. Clim. Chang. 2006, 74, 289–318. [Google Scholar] [CrossRef]
- National Energy Technology Laboratory (NETL). Site Screening, Selection, and Initial Characterization for Storage of CO₂ in Deep Geologic Formations; DOE/NETL-401/090808; NETL: Pittsburgh, PA, USA, 2010; pp. 33–53.
- Korean Government. Briefing Papers on Korea’s Goal of Greenhouse Gas Reduction at 2030; Korean Government: Seoul, Korea, 2015.
- Yun, S.-T.; Park, E.-G.; Lee, M.-H.; Wang, S.-G.; Choi, H.-Y.; Lee, Y.-J.; Kim, H.-M.; Lee, S.-Y. Study on Environmental Affection Evaluation Technique for Find Geological and Geochemical Factors Related to CO2 Movement and Leakage from Underground Site Stored CO2; Project Report; Ministry of Environment: Sejong City, Korea, 2011; pp. 39–277.
- Kim, C.-S.; Park, M.-U.; Koh, Y.-K. Isotopic, Geochemical and Hydrogeological Studies on the Mineral. Water in Korea; Basic R & D Report of Korea Science and Engineering Foundation; Korea Science and Engineering Foundation: Daejeon, Korea, 2002.
- Kim, G.-Y.; Koh, Y.-K.; Bae, D.-S.; Won, J.-H.; Jung, D.-W.; Choi, B.-Y. Geochemical and Environmental Isotope Study on the Groundwater from the Youngcheon Area, Gyeongbuk Province. J. Soil Groundw. Environ. 2007, 12, 35–53. [Google Scholar]
- Jung, C.-H.; Won, J.-G.; Cha, M.-S.; Gang, G.-W.; Lee, Y.-J. Korea Geology Map, Ohdaesan (Mt.) (1:50,000) and Description; Geological and Mineral Institute of Korea (Current KIGAM): Daejeon, Korea, 1975. [Google Scholar]
- Kim, O.-J.; Kim, S.-W.; Yoo, B.-H.; Park, B.-G.; Kim, G.-H. Korea Geology Map and Description (Bookbon-ri Area, 1:50,000); Geological and Mineral Institute of Korea (Current KIGAM): Daejeon, Korea, 1975. [Google Scholar]
- Lee, D.-S.; Yun, S.-G.; Kim, J.-J. Korea Geology Map and Description (Changchon, 1:50,000); Geological and Mineral Institute of Korea (Current KIGAM): Daejeon, Korea, 1975. [Google Scholar]
- Kim, O.-J. Geology and Mineral Source in Korea; ChoonGwang Publishing Company: Seoul, Korea, 1982; pp. 113–131. [Google Scholar]
- Reed, M.H. Calculation of multicomponent chemical equilibria and reaction processed in systems involving minerals, gases and aqueous phase. Geochim. Cosmochim. Acta 1982, 46, 513–528. [Google Scholar] [CrossRef]
- Choi, H.-S.; Koh, Y.-K.; Bae, D.-S.; Park, S.-S.; Hutcheon, I.; Yun, S.-T. Estimation of deep-reservoir temperature of CO2-rich springs in Gangwon district, South Korea. J. Volcanol. Geotherm. Res. 2005, 141, 77–89. [Google Scholar] [CrossRef]
- Choi, H.-S.; Yun, S.-T.; Koh, Y.-K.; Mayer, B.; Park, S.-S.; Hutcheon, I. Geochemical behavior of rare earth elements during the evolution of CO2-rich groundwater: A study from the Gangwon district, South Korea. Chem. Geol. 2009, 262, 318–327. [Google Scholar] [CrossRef]


| Site | Date | CO2 Injection Depth (m) | Monitoring Parameters | Change Trend | Key Parameters for CO2 Monitoring |
|---|---|---|---|---|---|
| Svelvik, Norway | September 2011 | 20 | pH, temp., EC, alkalinity Ca, Na, SO4, Cl, Mg, Al, Ba, Mn, Ni, Co, B, Li Isotope | pH: decrease EC: increase Alkalinity: increase Ca, Li, Si, Sr: increase (Based on 10 m) Isotopes: decrease | pH EC Alkalinity Ca, Li, Si, Sr |
| Bozeman, Montana, USA | June–July 2008 | 2.5 | pH, temp., EC, alkalinity, DO Al, As, Co, B, Li, Cd, Cr, Cu, Mo, Pb, Se, U, Zn HCO3, Na, K, Mg, Ca, Sr, Ba, Mn, Fe, F, Cl, Br, NO3, PO4, SO4, SiO4, SiO2, TDS Benzene, toluene, ethyl-benzene, xylene | pH: decrease EC: increase Alkalinity: increase Ca, Mg, Mn, BTEX: increase | pH EC Alkalinity Ca, Mg, Mn, BTEX |
| Wittstock, Brandenburg, Germany | March–April 2011 | 18 | TIC/TOC Cl−, NO3−, SO42−, K, Na, Mg, Ca, Fe, Mn, Si BTEX, ammonium, chlorinated carbons, ethane, ethene, methane Isotope Basic groundwater, parameters (pressure, pH, EC, O2, alkalinity, temp.) | pH: decrease EC: increase Alkalinity: increase TIC: increase Anions: decrease Ca, Mg, Sr, Ba, U: stable after increase Mn: increase | pH EC Alkalinity Ca, Mg, Mn, Sr, Ba, U |
| Colorado River, Austin, Texas | February 2012 | 3.7 | Dissolved O2, pH Ca, Mg, Sr, Ba, Mn, U, Si, K, As, Mo, V, Zn, Se, Cd, Co, Ni | pH: decrease (field test) Ca, Mg, Sr, Ba, Mn, U: stable after increase Si, K: increase | pH EC Alkalinity Ca, Mg, Mn, Sr, Ba, U, Si, K |
| Daniel Electric Generating Plant, Escatawpa, Mississippi | October 2011–March 2012 | 47.9 | pH Resistivity Phase responses | pH: decrease Resistivity: decrease Phase responses: decrease | pH Resistivity Phase responses |
| Daniel Electric Generating Plant, Escatawpa, Mississippi | October 2011–March 2012 | 30.5 | pH, EC, alkalinity Ba, Ca, Fe, Mg, Mn, Sr, Cl, Cr, Mo | pH: decrease EC: increase Alkalinity: increase Ba, Ca, Fe, Mg, Mn, Sr, Cl, Cr: decrease after increase Mo: decrease and increase | pH EC Alkalinity Ba, Ca, Fe, Mg, Mn, Sr, Cl, Cr |
| Province | Area | Geology |
|---|---|---|
| Gangwon | Yangyang | Granite |
| Injae | Granite | |
| Gangneung | Granite | |
| Pyeongchang | Granite | |
| Hongchon | Granite | |
| Jeongsun | Granite | |
| Gyeongsang | Youngcheon | Sedimentary |
| Youngdeok | Sedimentary | |
| Cheongsong | Granite & Sedimentary | |
| Gunwe | Sedimentary | |
| Gyeongju | Sedimentary | |
| Chungcheong | Chojeong | Granite |
| Jungwon | Granite | |
| Cheonan | Granite | |
| Munkyeong | Granite | |
| Daepyeong | Granite | |
| Bugang | Granite | |
| Cheongju | Granite |
| Water Type | Temp. | pH | Eh | EC | DO | Alkalinity | * | TDS | Na | K | Mg | Ca | SiO2 | Cl | SO4 | NO3 | F |
|---|---|---|---|---|---|---|---|---|---|---|---|---|---|---|---|---|---|
| °C | mV | uS/cm | mg/L | * 103 | atm | mg/L | |||||||||||
| CO2 rich water (Na-type) | 19.4 | 6 | 113 | 1345 | 2.6 | 18.3 | 0 | 1628 | 345 | 23 | 1.6 | 31.5 | 79.6 | 7 | 12.9 | 0.1 | 7.5 |
| 18.5 | 6.2 | 121 | 1348 | 3.1 | 19 | −0.2 | 1773 | 419 | 25 | 2.1 | 44.6 | 87.7 | 8.3 | 13.8 | 0.1 | 7.7 | |
| 18.7 | 5.9 | 125.2 | 1268 | 3.8 | 21.3 | 0.15 | 2013 | 496 | 27.3 | 2.2 | 53.1 | 89 | 9.5 | 21.8 | 0.1 | 7.1 | |
| 18.2 | 6.2 | 131 | 2220 | 3.3 | 30.5 | 0 | 2624 | 544 | 32.1 | 2.6 | 57.1 | 93.1 | 2.5 | 22.4 | 0.1 | 7.1 | |
| 15.8 | 5.9 | 109.3 | 864 | 3.1 | 10.5 | −0.15 | 1020 | 267 | 7.2 | 0.5 | 10.7 | 71.9 | 5 | 5 | 0.1 | 9.3 | |
| 15.4 | 6.1 | 132 | 1058 | 2.8 | 11.5 | −0.32 | 1089 | 271 | 6.1 | 0.5 | 11 | 74 | 5.6 | 5.1 | 0.1 | 9.5 | |
| 13.4 | 5.9 | 124.5 | 1956 | 1.2 | 20.2 | 0.1 | 1845 | 455 | 13 | 5.2 | 54 | 61 | 8.3 | 8 | 0.1 | 4.9 | |
| 19.8 | 6.4 | 138 | 1871 | 1.5 | 21.5 | −0.34 | 1921 | 457 | 10.5 | 5.1 | 53.2 | 60.1 | 8.6 | 7.3 | 0.1 | 4.8 | |
| CO2 rich water (Ca-Na-type) | 14.5 | 5.5 | 44.5 | 725 | 2.4 | 8 | 0.12 | 713 | 71.4 | 4.5 | 7.3 | 76.1 | 32.5 | 6.7 | 16.1 | 0.3 | 2.4 |
| 16.2 | 5.7 | 150 | 778 | 2.1 | 8.5 | −0.05 | 775 | 91.8 | 4 | 8.6 | 88.4 | 37.9 | 2.1 | 12.7 | 0.1 | 2.6 | |
| 17.6 | 5.9 | 154.1 | 1205 | 1.8 | 11 | −0.14 | 1104 | 113 | 3.8 | 21.3 | 152 | 38.1 | 20.9 | 13.2 | 65.1 | 1.6 | |
| CO2 rich water (Ca-type) | 14.4 | 6 | 115.2 | 1528 | 3.5 | 16.2 | −0.11 | 1463 | 32.3 | 4.2 | 25.7 | 293.8 | 76.1 | 2.9 | 21.1 | 0.1 | 0.9 |
| 13.3 | 5.5 | 165 | 454 | 3.8 | 4.1 | −0.17 | 419 | 6.6 | 0.5 | 9.7 | 72.5 | 54 | 3.3 | 13.6 | 0.1 | 1.7 | |
| 10.7 | 5.9 | 195 | 677 | 5.1 | 6.7 | −0.37 | 642 | 15 | 2.7 | 11.9 | 109.7 | 60.8 | 2.6 | 10.5 | 0.3 | 1.5 | |
| 11.4 | 5.9 | 118 | 1034 | 1.6 | 12.5 | −0.12 | 1055 | 37 | 2.3 | 35.4 | 162 | 36 | 2.3 | 4.3 | 0.1 | 0.6 | |
| 16.2 | 5.8 | 135.1 | 873 | 0.8 | 9.8 | −0.1 | 855 | 14.8 | 1.6 | 36.1 | 140 | 35.1 | 2.1 | 9.2 | 0.1 | 0.2 | |
| 10.4 | 5.8 | 181 | 915 | 0.6 | 11.5 | −0.06 | 964 | 15.5 | 4.6 | 37.2 | 140 | 39.2 | 2.3 | 7.8 | 0.1 | 0.3 | |
| 14.1 | 5.8 | 108 | 921 | 2.1 | 10 | −0.1 | 834 | 15.2 | 2.9 | 46.1 | 93 | 30.2 | 2.1 | 7.6 | 0.1 | 0.4 | |
| 12.4 | 5.5 | 164 | 1098 | 3.6 | 13.2 | 0.31 | 1140 | 35.9 | 3.3 | 20.9 | 198.1 | 48.4 | 2.9 | 8.2 | 0.1 | 0.8 | |
| Shallow GW | 20.2 | 6.6 | 173.5 | 125 | 5.8 | 0.5 | −2.17 | 86 | 15.1 | 1.1 | 1.5 | 5.3 | 12.3 | 11.2 | 8 | 1.4 | 2.3 |
| 13.7 | 6.5 | 242.5 | 69 | 7 | 0.4 | −2.15 | 63 | 6 | 0.7 | 1.6 | 3.7 | 19.4 | 4.8 | 1.4 | 0.4 | 0.4 | |
| 19.5 | 6.3 | 144 | 271 | 6.5 | 0.3 | −2.06 | 47 | 3.4 | 0.5 | 0.6 | 3.1 | 13.9 | 1.5 | 2.8 | 2.7 | 0.3 | |
| 17.1 | 6.3 | 171 | 35 | 6.3 | 0.3 | −2.14 | 39 | 3.1 | 0.5 | 0.6 | 3.5 | 10.1 | 0.9 | 2.5 | 2.3 | 0.2 | |
| Surface W | 20.5 | 6.7 | 177.2 | 34 | 8.7 | 0.2 | −2.61 | 34 | 2.3 | 0.5 | 0.5 | 2.5 | 9.2 | 1 | 3.3 | 1.7 | 0.3 |
| 15.3 | 6.8 | 118.4 | 57 | 7.5 | 0.3 | −1.51 | 46 | 2 | 0.6 | 0.5 | 2.8 | 10.3 | 0.9 | 2.8 | 0.9 | 0.4 | |
| 13.4 | 7.8 | 144 | 53 | 9.4 | 0.4 | −3.44 | 52 | 2.1 | 0.5 | 0.9 | 6.8 | 9.9 | 1 | 4.1 | 1.4 | 0 | |
| 13 | 7.5 | 174 | 47 | 9.1 | 0.3 | −2.27 | 46 | 3.3 | 0.6 | 0.7 | 5.1 | 10.1 | 1.2 | 4.3 | 1.4 | 0.1 | |
| 10.2 | 6.9 | 177 | 60 | 9.6 | 0.4 | −2.63 | 47 | 1.9 | 0.5 | 0.1 | 8.1 | 8.4 | 0.9 | 4.5 | 1 | 0.1 | |
| 14.5 | 6.8 | 157.1 | 94 | 9.4 | 0.4 | −2.45 | 56 | 6.9 | 1.7 | 1.4 | 3.7 | 7.5 | 3.7 | 3.4 | 2.4 | 0.5 | |
| 15.2 | 6.9 | 157.2 | 29 | 6.4 | 0.2 | −2.96 | 29 | 1.8 | 0.4 | 0.6 | 3.3 | 6.4 | 0.7 | 2.2 | 4.2 | 0.1 | |
| 17.2 | 6.9 | 151 | 46 | 8.7 | 0.4 | −2.5 | 54 | 3.6 | 0.9 | 1.7 | 3.6 | 11.8 | 1.7 | 2.8 | 1.5 | 0.1 | |
| Statistical Value | Temp. | pH | Eh | EC | DO | Alkalinity | TDS | Na | K | Mg | Ca | SiO2 | Cl | SO4 | NO3 | F | |
|---|---|---|---|---|---|---|---|---|---|---|---|---|---|---|---|---|---|
| MDb | 15.6 | 6.8 | 165.4 | 59.7 | 7.7 | 0.3 | −2.4 | 48.4 | 3.4 | 0.6 | 0.8 | 3.8 | 10.1 | 1.8 | 3.2 | 1.7 | 0.3 |
| MDc | 15.1 | 5.9 | 134.1 | 1348.5 | 2.5 | 12.8 | −0.1 | 1505.0 | 82.9 | 5.8 | 6.8 | 80.2 | 58.5 | 4.3 | 58.3 | 0.1 | 2.5 |
| MNc | 15.2 | 5.9 | 132.9 | 1321.2 | 2.6 | 14.2 | −0.1 | 1448.4 | 273.8 | 10.2 | 18.3 | 99.0 | 59.2 | 5.5 | 58.1 | 0.2 | 3.7 |
| 1SDb | 12.7 (below) | 6.4 (below) | 138.8 (below) | 155.4 (above) | 6.4 (below) | 0.4 (above) | −1.9 (above) | 62.9 (above) | 8.0 (above) | 1.1 (above) | 1.4 (above) | 6.7 (above) | 13.5 (above) | 4.6 (above) | 5.0 (above) | 0.9 (below) | 0.7 (above) |
| QIshift (Crit = 1) | 0.2 | 2.3 | 1.2 | 13.5 | 4.0 | 125.0 | 4.6 | 100.5 | 17.3 | 10.4 | 10.0 | 26.3 | 14.2 | 0.9 | 30.6 | 2.0 | 5.5 |
| QItail (Crit = 1) | 0.1 | 2. | 1.2 | 13.2 | 3.9 | 139.0 | 4.6 | 96.6 | 58.8 | 19.2 | 29.2 | 32.8 | 14.4 | 1.3 | 30.5 | 1.9 | 8.5 |
| Test | Temp. | pH | Eh | EC | DO | Alkalinity | TDS | Na | K | Mg | Ca | SiO2 | Cl | SO4 | NO3 | F | |
|---|---|---|---|---|---|---|---|---|---|---|---|---|---|---|---|---|---|
| t-test (two tails) | 0 | 1 | 0 | 1 | 1 | 1 | 1 | 1 | 1 | 1 | 1 | 1 | 1 | 1 | 1 | 0 | 1 |
| Wilcoxon test (rank sum) | 0 | 1 | 0 | 1 | 1 | 1 | 1 | 1 | 1 | 1 | 1 | 1 | 1 | 1 | 1 | 0 | 1 |
| PDF test | 0 | 1 | 1 | 1 | 1 | 1 | 1 | 1 | 1 | 1 | 1 | 1 | 1 | 1 | 1 | 1 | 1 |
| Water Type | Temp. | pH | Eh | EC | DO | TDS | Na | K | Mg | Ca | SiO2 | Cl | SO4 | HCO3 | F | NO3 | Sr | Fe | Mn | Al | Li | |
|---|---|---|---|---|---|---|---|---|---|---|---|---|---|---|---|---|---|---|---|---|---|---|
| °C | mV | μS/cm | mg/L | atm | mg/L | |||||||||||||||||
| CO2 rich water | 17.2 | 6.17 | 127.0 | 1554 | 2.7 | −0.27 | 1409 | 60.6 | 3 | 43 | 231 | 56.5 | 41.4 | 49.4 | 919 | 1 | 0.2 | 1.49 | 1.23 | 0.89 | 0.22 | 0.23 |
| 8.6 | 6.17 | 185.0 | 2340 | 4.2 | 0.09 | 3544 | 114.3 | 13.9 | 89.3 | 673.5 | 116.5 | 13.1 | 46.8 | 2469 | 0.6 | 0.3 | 3.04 | 0.12 | 3.22 | 0 | 0.37 | |
| 14.4 | 6.26 | 151.0 | 1961 | 2.5 | −0.26 | 1713 | 80.9 | 4.3 | 65.2 | 252 | 73.6 | 9.7 | 13.5 | 1204 | 0.6 | 0 | 4.69 | 3.69 | 1.32 | 0.01 | 0.21 | |
| 17.1 | 6.25 | 65.0 | 1663 | 3 | −0.25 | 1651 | 71 | 2.2 | 51.7 | 258 | 50.9 | 8.4 | 19.2 | 1169 | 0.9 | 0 | 14 | 4.73 | 1.07 | 0.02 | 0.38 | |
| 14.6 | 6.36 | 171.0 | 2620 | 3 | −0.25 | 2273 | 76.8 | 4.8 | 70.8 | 378 | 95.2 | 12.5 | 17.3 | 1601 | 1.3 | 0 | 3.72 | 10.7 | 1.18 | 0.06 | 0.92 | |
| 16 | 6.33 | 93.0 | 2860 | 2.3 | −0.11 | 2945 | 154 | 7.5 | 108 | 450 | 96.9 | 27 | 33.8 | 2045 | 2.3 | 0 | 4.67 | 14.6 | 1.43 | 0.01 | 0.37 | |
| 14.9 | 6.27 | 149.0 | 1722 | 4.5 | −0.31 | 1575 | 67.8 | 4.2 | 44.6 | 253 | 61.8 | 14.1 | 22.6 | 1101 | 1.8 | 0 | 2.57 | 0.02 | 1.27 | 0.01 | 1.01 | |
| 12.9 | 6.55 | 171.0 | 3016 | 4.5 | −0.4 | 2562 | 133 | 8.1 | 91.6 | 368 | 100.3 | 29.4 | 34.4 | 1789 | 2.4 | 0 | 4.6 | 0.02 | 1.47 | 0.02 | 0.75 | |
| 12.1 | 6.32 | 120.0 | 2770 | 2.9 | −0.21 | 2340 | 115 | 7.3 | 84.4 | 343 | 76.2 | 22.3 | 31.4 | 1645 | 1.9 | 4 | 3.33 | 4.97 | 1.66 | 0 | 0.12 | |
| 20.9 | 6.70 | 174.0 | 1406 | 7.3 | −1.44 | 1235 | 71.5 | 2.6 | 24.4 | 255 | 21.6 | 5.9 | 635.2 | 202 | 0.7 | 4.8 | 11 | 0.03 | 0.02 | 0 | 1.12 | |
| 19.1 | 6.03 | 108.0 | 1999 | 3.9 | −0.13 | 2025 | 168 | 10.3 | 67.2 | 288 | 52 | 30.1 | 479.1 | 923 | 0.6 | 0.2 | 1.64 | 2.14 | 3.14 | 0.24 | 0.25 | |
| 16.9 | 6.31 | 183.0 | 1697 | 4 | −0.36 | 1519 | 184 | 6.8 | 45.3 | 153 | 35.9 | 19.8 | 34.1 | 1033 | 1.1 | 0.9 | 2.61 | 1.82 | 0.48 | 0.06 | 0.64 | |
| 15.4 | 5.94 | 98.0 | 2280 | 2.4 | 0.15 | 2218 | 210 | 8.8 | 61.3 | 273 | 77.2 | 37.5 | 34.2 | 1498 | 1.6 | 0 | 3.24 | 12.4 | 1.47 | 0.06 | 1.18 | |
| 15.2 | 6.04 | 34.0 | 1864 | 2.3 | −0.04 | 1761 | 154 | 7.4 | 46.5 | 205 | 66.1 | 51.6 | 31.3 | 1182 | 1.4 | 0 | 2.36 | 11.8 | 1.79 | 0.05 | 0.84 | |
| 16.2 | 5.96 | 65.0 | 1459 | 2.3 | −0.11 | 1325 | 101 | 6.1 | 34.8 | 140 | 50.5 | 33.3 | 36.4 | 910 | 1.1 | 0 | 1.65 | 9.17 | 2.11 | 0.04 | 0.57 | |
| 12.8 | 6.33 | 167.0 | 3030 | 3.1 | −0.1 | 3144 | 318 | 9.7 | 79.1 | 391 | 82.6 | 24.6 | 43.4 | 2167 | 2.1 | 0 | 4.42 | 19.8 | 2.1 | 0.22 | 1.86 | |
| 16.6 | 6.16 | 63.0 | 1911 | 2.8 | −0.13 | 1852 | 172 | 5.5 | 56.5 | 230 | 59.9 | 20.9 | 30.2 | 1263 | 1.4 | 0 | 2.29 | 8.7 | 1.49 | 0.1 | 1.05 | |
| Acidic water | 22.5 | 2.74 | 495.0 | 1342 | 3.8 | 566 | 16.6 | 0.5 | 15.1 | 19.3 | 111.3 | 7.1 | 327.5 | 0.3 | 1.5 | 0.08 | 62.8 | 4.08 | 33.3 | 0.02 | ||
| 18.5 | 2.40 | 641.0 | 5520 | 2.7 | 5684 | 5.4 | 1.3 | 48.3 | 85 | 154.2 | 14.5 | 3680 | 39 | 0 | 0.27 | 1650 | 6.42 | 0.0005 | 0.21 | |||
| GW | 16.6 | 6.66 | 145.0 | 77 | 4.1 | −2.09 | 64 | 4.4 | 0.9 | 1.6 | 6.3 | 12.1 | 0.1 | 0.1 | 39 | 0 | 0 | 0.04 | 0.02 | 0.02 | 0.389 | 0.0001 |
| 22.4 | 6.50 | 158.0 | 41 | 6.5 | −2.52 | 42 | 3.8 | 0.7 | 0.7 | 2.2 | 13.6 | 4.8 | 5.9 | 9 | 0.3 | 0.5 | 0.02 | 0.02 | 0.02 | 0.01 | 0.0006 | |
| 20.4 | 6.69 | 118.0 | 126 | 5.4 | −2.14 | 107 | 6.5 | 4.4 | 2.9 | 12.5 | 13.6 | 9.2 | 9.6 | 36 | 0.3 | 11.9 | 0.1 | 0.02 | 0.02 | 0.002 | 0.0061 | |
| Surface W | 20.2 | 6.58 | 275.0 | 148 | 5.9 | −1.88 | 118 | 8.8 | 1.3 | 2.2 | 13.7 | 17.3 | 5.8 | 15.9 | 52 | 0.2 | 1.4 | 0.06 | 0.03 | 0.02 | 0.012 | 0.0003 |
| 22.3 | 7.64 | 198.0 | 388 | 7.1 | −2.75 | 191 | 13.5 | 3.6 | 8.5 | 23.4 | 19.7 | 9.9 | 25.6 | 79 | 0.3 | 7.6 | 0.17 | 0.02 | 0.02 | 0.003 | 0.0013 | |
| 5.6 | 6.70 | 170.0 | 279 | 7.8 | −1.54 | 294 | 16.1 | 2.5 | 11.5 | 45.6 | 16.7 | 9.5 | 11.7 | 176 | 0.1 | 4 | 0.3 | 0.02 | 0.02 | 0.001 | 0.0006 | |
| Statistical Value | Temp. | pH | Eh | EC | DO | TDS | Na | K | Mg | Ca | SiO2 | Cl | SO4 | HCO3 | NO3 | F | Al | Fe | Mn | Sr | Li |
|---|---|---|---|---|---|---|---|---|---|---|---|---|---|---|---|---|---|---|---|---|---|
| MDb | 17.0 | 7.2 | 429.0 | 573.5 | 3.6 | 455.5 | 33.0 | 1.9 | 15.4 | 67.4 | 19.7 | 24.6 | 32.8 | 265.2 | 18.4 | 0.2 | 5.0 | 34.6 | 8.5 | 13,630 | 26.4 |
| MDc | 15.5 | 6.3 | 121.0 | 2212 | 3.4 | 2454 | 120.9 | 6.5 | 60.0 | 279.2 | 68.5 | 20.9 | 31.7 | 1360 | 0.0 | 1.2 | 44.0 | 9783 | 1623 | 7493 | 474.0 |
| MNc | 15.5 | 6.2 | 126.8 | 2202 | 3.3 | 2406 | 130.5 | 6.4 | 62.2 | 299.1 | 68.7 | 23.5 | 97.2 | 1338 | 0.9 | 1.3 | 64.7 | 9710 | 1581 | 7615 | 676.8 |
| 1SDb | 15.7 | 6.8 | 325.0 | 1658 | 0.9 | 1303 | 162.7 | 3.9 | 51.2 | 112.7 | 24.1 | 5.9 | 149.8 | 539.2 | 0.0 | 0.8 | 29.2 | 94.5 | 109 | 5483 | 912.4 |
| QIshift (Crit = 1) | 1.2 | 2.1 | 3.0 | 1.5 | 0.1 | 2.4 | 0.7 | 2.3 | 1.2 | 4.7 | 11.2 | 0.2 | 0.0 | 4.0 | 1.0 | 1.7 | 1.6 | 163.0 | 15.9 | 0.8 | 0.5 |
| QItail (Crit = 1) | 1.2 | 2.1 | 2.9 | 1.5 | 0.1 | 2.3 | 0.8 | 2.3 | 1.3 | 5.1 | 11.2 | 0.1 | 0.6 | 3.9 | 1.0 | 1.9 | 2.5 | 161.7 | 15.5 | 0.7 | 0.7 |
| Test | Temp. | pH | Eh | EC | DO | TDS | Na | K | Mg | Ca | SiO2 | Cl | SO4 | HCO3 | NO3 | F | Al | Fe | Mn | Sr | Li |
|---|---|---|---|---|---|---|---|---|---|---|---|---|---|---|---|---|---|---|---|---|---|
| t-test (two tails) | 0 | 1 | 1 | 1 | 0 | 1 | 1 | 1 | 1 | 1 | 1 | 0 | 0 | 1 | 1 | 1 | 1 | 1 | 1 | 0 | 1 |
| Wilcoxon test (rank sum) | 1 | 1 | 1 | 1 | 0 | 1 | 1 | 1 | 1 | 1 | 1 | 0 | 0 | 1 | 1 | 1 | 0 | 1 | 1 | 0 | 1 |
| PDF test | 1 | 1 | 1 | 1 | 0 | 1 | 0 | 1 | 1 | 1 | 1 | 0 | 0 | 1 | 1 | 1 | 1 | 1 | 1 | 0 | 0 |
| Location | Temp. (°C) | pH | Eh (mV) | EC (μs/cm) | DO (mg/L) | (atm) | Alkalinity (meq/L) | TDS | Na | K | Mg | Ca | SiO2 | Cl | SO4 | HCO3 | F | NO3 |
|---|---|---|---|---|---|---|---|---|---|---|---|---|---|---|---|---|---|---|
| mg/L | ||||||||||||||||||
| Chojeong | 19.7 | 6.54 | 280 | 7 | −1.62 | 1.44 | 18.4 | 27.3 | 39.6 | 26.3 | 12.8 | 14.9 | ||||||
| 15.9 | 6.48 | 151 | 7.1 | −1.67 | 1.13 | 5.5 | 13.4 | 20.1 | 2.1 | 1.9 | 2.4 | |||||||
| 14.6 | 5.68 | 184 | 7.9 | −0.96 | 0.95 | 12.2 | 17.1 | 24.7 | 11.2 | 24 | 0 | |||||||
| 15.7 | 7.26 | 109 | 6.3 | −2.61 | 0.79 | 9 | 10.2 | 32.2 | 2.9 | 1.6 | 4 | |||||||
| 14.8 | 6.32 | 467 | 6.5 | −0.9 | 5.27 | 13.4 | 73.6 | 47.1 | 6.3 | 1.9 | 5.3 | |||||||
| 14.9 | 6 | 261 | 6.2 | −0.84 | 2.75 | 11.7 | 34.9 | 43.8 | 6.2 | 1.6 | 5.2 | |||||||
| 16.4 | 6.47 | 649 | 2.3 | −0.9 | 7.38 | 27.2 | 108 | 71.5 | 1.9 | 4 | 0 | |||||||
| 14.2 | 7.16 | 260 | 5.3 | −2.06 | 2.46 | 20.4 | 30.4 | 29.6 | 7.5 | 12.4 | 0 | |||||||
| 14 | 6.86 | 206 | 5.7 | −1.9 | 1.67 | 4.8 | 29 | 14.3 | 6.2 | 3.3 | 14.2 | |||||||
| 13.9 | 6.32 | 152 | 3.3 | −1.43 | 1.4 | 6.7 | 21.8 | 15.4 | 5.7 | 5.6 | 10.2 | |||||||
| 18.7 | 6.79 | 188 | 6 | −2.06 | 0.95 | 7.1 | 15.9 | 22.5 | 4.2 | 3.5 | 7.3 | |||||||
| Jungwon | 24.9 | 9.5 | −128 | 296 | 2.8 | −4.56 | 254 | 68.4 | 0.3 | 0.1 | 1.9 | 17.2 | 6 | 6.4 | 95 | 12.4 | 0 | |
| 24.7 | 9.1 | −136 | 167 | 6.3 | −4.23 | 168 | 31 | 0.5 | 0.2 | 7.4 | 19.4 | 1.9 | 7.2 | 72 | 6.6 | 0.3 | ||
| 23.5 | 7.5 | −20.8 | 288 | 0 | −2.33 | 287 | 40.3 | 1.9 | 4.2 | 22.5 | 25.4 | 24.5 | 15.9 | 150 | 1.9 | 0 | ||
| 20.5 | 7 | −29.5 | 489 | 0 | −1.94 | 221 | 11.5 | 3.1 | 2.9 | 30.5 | 25.4 | 7.2 | 17.2 | 120 | 0.2 | 3.1 | ||
| 17.5 | 6.7 | 36.4 | 198 | 0 | −1.74 | 185 | 11.8 | 1.8 | 3.3 | 24.1 | 16 | 9.4 | 14.4 | 98 | 0.8 | 5.6 | ||
| 15 | 7.2 | −21.2 | 205 | 2.7 | −2.61 | 138 | 8.9 | 0.9 | 2.4 | 18.7 | 20.1 | 5.2 | 16.3 | 56 | 0.3 | 8.9 | ||
| 16.6 | 7.5 | −13.6 | 179 | −2.65 | 160 | 13.8 | 1.4 | 2.3 | 17.9 | 17.1 | 6 | 13.3 | 76 | 0.9 | 11.3 | |||
| 19 | 7.7 | −15.6 | 182 | 3.3 | −2.95 | 152 | 9.1 | 0.9 | 3.5 | 18.2 | 28.5 | 4 | 16.9 | 59 | 0.5 | 10.3 | ||
| 23.7 | 6.9 | 34.9 | 68 | 7.1 | −2.44 | 78 | 5.4 | 0.5 | 1 | 7.9 | 22.3 | 1.3 | 3.5 | 28 | 0.7 | 7.5 | ||
| Munkyeong | 30.4 | 9.1 | −125 | 135 | 0 | −4.62 | 104 | 23.4 | 0.2 | 0 | 8.6 | 19.5 | 5.3 | 5.3 | 27.1 | 11.5 | 0.7 | |
| 24.1 | 9.4 | −128 | 158 | 2.4 | −4.84 | 116 | 31.7 | 0.2 | 0 | 4 | 18 | 5 | 5.5 | 35.6 | 9.4 | 0.8 | ||
| 26.6 | 10.39 | −84 | 151 | 9.4 | −6.41 | 72 | 23.6 | 0.3 | 0 | 5.7 | 0.8 | 3.3 | 6.4 | 11.8 | 8.6 | 0 | ||
| 30.2 | 9.46 | −122 | 132 | 2.3 | −4.97 | 107 | 23.2 | 0.3 | 0 | 6.5 | 22.3 | 4.1 | 7.2 | 27.9 | 10.8 | 0.1 | ||
| 13.9 | 7.48 | −118 | 571 | 1.6 | −2.13 | 471 | 63.8 | 2 | 5 | 49 | 34 | 27.2 | 6.2 | 255.1 | 15.8 | 0 | ||
| 11 | 7.58 | −133 | 522 | 2.7 | −2.28 | 447 | 66.9 | 1.1 | 4.3 | 44.5 | 31.7 | 27.6 | 7.6 | 236.8 | 16.2 | 0 | ||
| 15.4 | 6.87 | −90.5 | 487 | 2.7 | −1.48 | 437 | 25.9 | 3 | 16.5 | 53.5 | 33 | 19.5 | 3.2 | 272.4 | 1.8 | 6.6 | ||
| 15.4 | 6.79 | 12.8 | 477 | 3.9 | −1.4 | 434 | 28.9 | 1.9 | 15.8 | 52.8 | 29.5 | 19.1 | 2.7 | 274.1 | 1.8 | 6.8 | ||
| 12.8 | 8.03 | −80.2 | 184 | 5.6 | −3.24 | 174 | 9.3 | 1.6 | 4.9 | 18.5 | 30.2 | 12 | 1.9 | 68.7 | 0.3 | 25.3 | ||
| 14.4 | 7.31 | −20.4 | 365 | 6.4 | −2.93 | 311 | 10.9 | 3.2 | 14.9 | 44 | 31.9 | 4.9 | 163 | 27 | 0.1 | 10.8 | ||
| 14.1 | 6.93 | −10.4 | 367 | 7.4 | −2.46 | 296 | 13 | 2 | 9.9 | 44.6 | 28.7 | 4.5 | 149.5 | 33.6 | 0.1 | 9.2 | ||
| 13.4 | 7.13 | −58.4 | 81 | 6.6 | −2.79 | 80 | 7.8 | 1.8 | 0.5 | 6.7 | 25.3 | 3.1 | 3.2 | 23.9 | 1.8 | 6.2 | ||
| Deajung | 16.8 | 7.67 | 141 | 250 | 5.6 | −2.59 | 236 | 10.5 | 2.5 | 5.3 | 33.4 | 28.3 | 3.6 | 8.8 | 142 | 1.4 | 0 | |
| 17.8 | 7.55 | 185 | 255 | 5.8 | −2.52 | 172 | 11 | 2.6 | 5.7 | 29 | 0 | 3.5 | 2.2 | 116 | 0.5 | 0.6 | ||
| 13.9 | 6.23 | 208 | 180 | 6.1 | −1.3 | 174 | 11.2 | 2 | 5.4 | 16.1 | 34 | 5.3 | 3.6 | 88 | 0.4 | 7.8 | ||
| 16 | 6.52 | 161 | 222 | 5.6 | −1.54 | 189 | 11 | 2.4 | 6.3 | 22 | 34.2 | 4.9 | 1.7 | 104 | 0.5 | 2.3 | ||
| 16.8 | 6.56 | 264 | 244 | 6.6 | −1.53 | 256 | 59.1 | 0.7 | 0 | 0.1 | 33.4 | 4.8 | 4.8 | 152 | 0.8 | 0.7 | ||
| 14.8 | 6.43 | 228 | 200 | 7.2 | −1.44 | 185 | 11.5 | 1.7 | 5.3 | 21.1 | 31.9 | 5.2 | 4.7 | 98 | 0.3 | 5.4 | ||
| 21.6 | 6.63 | 146 | 262 | 5.5 | −1.6 | 87 | 11 | 2 | 6.6 | 26 | 30 | 5.1 | 3.7 | 110 | 0.4 | 4.3 | ||
| 17.5 | 6.72 | 272 | 205 | 5.8 | −1.73 | 187 | 11.4 | 1.8 | 5.4 | 21.5 | 31.7 | 5 | 5.2 | 99 | 0.3 | 5.1 | ||
| 16 | 6.36 | 266 | 126 | 3.9 | −1.69 | 113 | 7.6 | 0.9 | 3.7 | 11.3 | 21.6 | 4.7 | 3.4 | 55 | 0.1 | 4.3 | ||
| 18.4 | 5.88 | 156 | 184 | 4.7 | −1.16 | 128 | 9.8 | 1.5 | 4.2 | 12.3 | 30 | 6.3 | 1.6 | 55 | 0.3 | 6.9 | ||
| Bugang | 15.5 | 7.08 | 128 | 314 | 8.4 | −1.99 | 266 | 14.9 | 1.8 | 3.9 | 37.7 | 24 | 13.9 | 16.1 | 143 | 1.2 | 8.7 | |
| 17.6 | 6.52 | 90 | 313 | 5.8 | −1.44 | 247 | 16 | 1.8 | 4.3 | 43 | 25.7 | 14.5 | 5.5 | 131 | 1.1 | 3.5 | ||
| Myeongam | 11.2 | 7.1 | 128 | 234 | 9.9 | −2.08 | 204 | 8.9 | 1.4 | 4.8 | 29.6 | 20.1 | 6 | 5.3 | 122 | 0.7 | 4.9 | |
| 22.9 | 6.67 | 139 | 300 | 4.7 | −1.47 | 87 | 11 | 1.9 | 7.4 | 42 | 25.7 | 5.3 | 2 | 162 | 0.4 | 1.7 | ||
| Daepyeong | 16.4 | 6.65 | 313 | 77 | 4.9 | 115 | 8.7 | 0.7 | 2.2 | 11.7 | 24.5 | 4.2 | 3.6 | 46 | 1.1 | 18.2 | ||
| 20.2 | 6.46 | 153 | 207 | 4.5 | −1.48 | 166 | 10.8 | 1.6 | 5 | 18.3 | 17.1 | 9.5 | 6.1 | 96 | 1.5 | 0.1 | ||
| 20.4 | 6.78 | 121 | 195 | 6.5 | −1.88 | 151 | 11.8 | 2.6 | 4.7 | 17.1 | 19.4 | 8.6 | 2.6 | 82 | 0.1 | 0.9 | ||
| 27 | 8.23 | 67 | 118 | 5.7 | −3.5 | 93 | 7 | 2.7 | 3.2 | 11.2 | 8.9 | 5.3 | 1.5 | 52 | 0.6 | 0.4 | ||
| 12.4 | 6.94 | 66 | 261 | 11.2 | −1.92 | 212 | 14.5 | 3.7 | 4 | 25.8 | 13.6 | 11.6 | 17.6 | 110 | 0.8 | 10.2 | ||
| 16.2 | 7.01 | 19 | 341 | 4.9 | −1.91 | 260 | 21.2 | 4.8 | 5.7 | 38.5 | 20.8 | 20.1 | 5.8 | 140 | 0.4 | 1.6 | ||
| 12.7 | 7.3 | 58 | 130 | 8.65 | −2.78 | 97 | 6.3 | 1.2 | 2.2 | 13 | 13.3 | 10 | 6.4 | 37 | 0.6 | 7 | ||
| 17.8 | 7.75 | 95 | 139 | 5.47 | −3.21 | 87 | 7.6 | 1.5 | 2.5 | 14 | 17.6 | 6.3 | 2.3 | 52 | 0.4 | 1.3 | ||
| Location | Temp. (°C) | pH | Eh (mV) | EC (μS/cm) | DO (mg/L) | (atm) | Alkalinity (meq/L) | TDS | Na | K | Mg | Ca | SiO2 | Cl− | SO42− | HCO3− | F− | NO3− |
|---|---|---|---|---|---|---|---|---|---|---|---|---|---|---|---|---|---|---|
| mg/L | ||||||||||||||||||
| Chojeong | 18.9 | 5.35 | 710 | 8.1 | 0.26 | 7.54 | 30.7 | 115 | 41.5 | 33.3 | 16.3 | 4.8 | ||||||
| 20.8 | 5.08 | 350 | 3.6 | −0.09 | 1.67 | 29.3 | 40.8 | 45.6 | 36.7 | 18.4 | 55 | |||||||
| 17.8 | 5.13 | 258 | 4.6 | −0.24 | 1.36 | 24.4 | 28.1 | 35.1 | 26.4 | 20.5 | 22.7 | |||||||
| 16.6 | 5.82 | 429 | 4.5 | −0.53 | 3.58 | 17.2 | 57.8 | 39.8 | 31.2 | 15.2 | 15.9 | |||||||
| 17.6 | 5.28 | 467 | 3.6 | −0.04 | 3.17 | 28.5 | 65.5 | 49.4 | 29.3 | 10.7 | 50.7 | |||||||
| 19.4 | 5.75 | 600 | 2.6 | −0.22 | 6.48 | 13.2 | 102 | 63.3 | 19.5 | 12 | 0.2 | |||||||
| 15.2 | 5.55 | 1012 | 0.8 | 0.21 | 11.3 | 28 | 170 | 56 | 5.8 | 4.9 | 0.8 | |||||||
| Jungwon | 28.4 | 6.3 | 34.5 | 2830 | 2.1 | −0.03 | 2721 | 245 | 11.3 | 39.5 | 363 | 96.9 | 20.1 | 17.7 | 1895 | 4 | 0 | |
| 19.5 | 5.7 | 24.5 | 1823 | 0.2 | 0.38 | 2009 | 118 | 2.6 | 36.3 | 276 | 81.3 | 12.1 | 4.8 | 1464 | 4.8 | 0 | ||
| 26.2 | 6 | 84.9 | 1748 | 1.6 | 0.09 | 1859 | 111 | 2 | 49 | 246 | 69.1 | 8.4 | 6.4 | 1355 | 2.2 | 0 | ||
| 23.9 | 6.1 | 50.4 | 1250 | 2.3 | −0.23 | 1173 | 80 | 2.2 | 20 | 154.7 | 92.1 | 12.2 | 9.5 | 799 | 3.5 | 0 | ||
| Munkyeong | 30.2 | 6.4 | 47.8 | 2260 | 0 | −0.27 | 1976 | 86.6 | 3.2 | 41.8 | 364.4 | 24.8 | 10.9 | 73.3 | 1365 | 1.4 | 0.9 | |
| 26 | 6.3 | −9.7 | 2280 | 1.1 | −0.15 | 2516 | 77.8 | 3.8 | 37.6 | 491.6 | 148 | 9 | 190.8 | 1544 | 1 | 0.1 | ||
| 26.9 | 5.91 | −20.6 | 980 | 2.2 | −0.33 | 769 | 34.7 | 1.7 | 21 | 127 | 44.9 | 13.5 | 132.4 | 383 | 2.9 | 2 | ||
| 24.9 | 6.17 | −40.1 | 2035 | 3.4 | −0.1 | 1969 | 74.2 | 2.6 | 43.8 | 344 | 111.5 | 12.7 | 79.3 | 1280 | 1.2 | 8.3 | ||
| 18.6 | 6.44 | −90.5 | 466 | 5.7 | −1.06 | 400 | 20.7 | 1.3 | 10.2 | 53.2 | 37.2 | 9.2 | 6.4 | 256.6 | 0.9 | 0 | ||
| 29.2 | 5.91 | −49.7 | 1765 | 0.2 | 0.17 | 1831 | 80.5 | 2.6 | 35.3 | 316 | 127.8 | 33.9 | 3.1 | 1217 | 3.8 | 0 | ||
| 21.2 | 6.21 | −42.8 | 1825 | 2.9 | −0.17 | 1810 | 79.8 | 2.8 | 33.6 | 307 | 116.6 | 16.6 | 2.3 | 1233 | 1.5 | 0 | ||
| 25.9 | 6.39 | −96.9 | 2450 | 1.4 | −0.14 | 2682 | 81.1 | 3.4 | 47.3 | 398 | 131.6 | 11.9 | 5.1 | 1843 | 3.1 | 0 | ||
| 22.5 | 6.46 | −97.8 | 2426 | 2.5 | −0.24 | 2588 | 85.5 | 3.1 | 41.8 | 394 | 133.5 | 10.7 | 3.7 | 1779 | 2.2 | 0 | ||
| 32.7 | 5.85 | −70 | 2150 | 2.3 | 0.35 | 2286 | 88.5 | 3.1 | 42.9 | 404 | 145.7 | 10.7 | 2.8 | 1571 | 2.3 | 0 | ||
| 25 | 6.32 | −30.3 | 775 | 3.1 | −0.66 | 738 | 31.1 | 1.3 | 10.5 | 129 | 51.4 | 4.3 | 35.1 | 466.4 | 2.7 | 0 | ||
| 25.8 | 6.16 | −84 | 717 | 2 | −0.59 | 585 | 29.9 | 1 | 8.6 | 95.9 | 49.7 | 3.3 | 16.6 | 374.1 | 3.2 | 0 | ||
| 26 | 6.22 | −35 | 2110 | 5.8 | −0.06 | 2260 | 79.9 | 2.7 | 43.7 | 408 | 127.5 | 8.3 | 1.2 | 1570 | 2.5 | 0 | ||
| 28.9 | 5.83 | −82 | 1362 | 1.7 | 0.11 | 1359 | 61.6 | 2.9 | 18.5 | 230 | 114.9 | 21.4 | 5.9 | 882.4 | 5.7 | 0 | ||
| Deajung | 15.8 | 5.14 | 135 | 306 | 0.8 | 0.3 | 332 | 9.5 | 1.6 | 12.6 | 44.5 | 14.3 | 18.2 | 3.3 | 220 | 0.9 | 0 | |
| 15.6 | 5.16 | 358 | 337 | 2.5 | 0.22 | 374 | 10 | 2.6 | 15 | 47 | 15.1 | 16.8 | 1.7 | 253 | 0.4 | 2.2 | ||
| 13.9 | 4.69 | 307 | 130 | 1.6 | 0.01 | 119 | 5.7 | 3.4 | 2.3 | 15.4 | 27.2 | 5.7 | 2.1 | 56 | 0.3 | 0.4 | ||
| 16.3 | 4.04 | 148 | 67 | 4 | 0.01 | 57 | 5.3 | 1.8 | 1.5 | 8.7 | 32.1 | 4.8 | 1.9 | 55 | 0.4 | 0.3 | ||
| 15.7 | 4.33 | 242 | 120 | 0.5 | 0.09 | 89 | 9.2 | 1.4 | 1.7 | 4.5 | 28.9 | 10.2 | 4.1 | 26 | 0.4 | 1.5 | ||
| 15.6 | 4.35 | 252 | 105 | 2.9 | −0.16 | 78 | 9.8 | 1.6 | 1.7 | 4.3 | 15.4 | 9.7 | 3.3 | 30 | 0.4 | 1.3 | ||
| 14.6 | 4.43 | 350 | 82 | 4.5 | −0.11 | 87 | 7.6 | 0.9 | 1.1 | 5 | 37.5 | 5.6 | 1.4 | 21 | 0.6 | 5.4 | ||
| 16.5 | 4.73 | 209 | 91 | 4.5 | −0.28 | 89 | 7.9 | 0.9 | 1.2 | 5.3 | 38.5 | 5.4 | 0.9 | 24 | 0.6 | 3.9 | ||
| 16.8 | 4.46 | 267 | 95 | 2.7 | −0.13 | 84 | 8.3 | 1 | 1.6 | 4.1 | 32.1 | 6.8 | 4.6 | 24 | 0.4 | 0.5 | ||
| 17.5 | 4.33 | 252 | 98 | 3.7 | 0.01 | 93 | 8.5 | 1 | 1.9 | 7.3 | 34.2 | 5.9 | 4.4 | 29 | 0.5 | 0.2 | ||
| 14.9 | 4.36 | 261 | 97 | 1 | −0.2 | 74 | 7 | 1.9 | 1.3 | 2.4 | 31.5 | 7.3 | 0.7 | 17 | 0.4 | 3.5 | ||
| 15.3 | 4.35 | 151 | 83 | 3.5 | −0.05 | 84 | 7.7 | 2.3 | 1.5 | 2.8 | 34.2 | 4.6 | 0.2 | 28 | 0.4 | 1.5 | ||
| Daepyeong | 16.6 | 5.03 | 176 | 138 | 0 | 0.27 | 132 | 10 | 2.2 | 3.1 | 9.8 | 36.8 | 18.9 | 0.6 | 31 | 0.1 | 18.5 | |
| 14.2 | 4.95 | 164 | 146 | 0 | 0.5 | 144 | 11.2 | 2.6 | 2.9 | 11.1 | 47 | 10.3 | 1.5 | 50 | 0.2 | 6.8 | ||
| 15.2 | 4.85 | 185 | 128 | 0 | 0.61 | 125 | 10.3 | 2.3 | 2.6 | 10.3 | 40.4 | 3.8 | 0.7 | 49 | 0.2 | 4.8 | ||
| 14.5 | 4.8 | 175 | 101 | 0 | 0.39 | 89 | 9.6 | 1.4 | 1.6 | 5.1 | 27.2 | 6 | 1.8 | 27 | 0.1 | 8.5 | ||
| 16 | 4.95 | 353 | 71 | 2.1 | 123 | 9.1 | 1.4 | 2.1 | 8 | 35.9 | 4.4 | 0.9 | 55 | 0.4 | 3.6 | |||
| 15.7 | 5.07 | 368 | 88 | 1.9 | 147 | 10.5 | 1.7 | 2.6 | 9.4 | 44.5 | 7.6 | 1.1 | 67 | 0.3 | 4.5 | |||
| 14.9 | 4.99 | 299 | 62 | 3.6 | 96 | 8.7 | 1 | 1.6 | 5.4 | 25.3 | 5.4 | 2 | 39 | 0.3 | 6.4 | |||
| 17.2 | 5.29 | 261 | 78 | 3.8 | 163 | 10.8 | 1.3 | 5.9 | 8.4 | 36.5 | 7.4 | 3.6 | 71 | 0.4 | 3.1 | |||
| 19.3 | 5.04 | 312 | 92 | 4.3 | 130 | 10 | 1.6 | 2.9 | 9.1 | 38.1 | 11.9 | 0.4 | 48 | 0.6 | 15.1 | |||
| 14.5 | 6.03 | 60 | 1579 | 6.1 | −0.06 | 1547 | 71.8 | 2.4 | 17.5 | 261 | 73.8 | 6.2 | 7.5 | 1098 | 2.2 | 0 | ||
| 15.8 | 5.9 | 180 | 1613 | 2.6 | 0.04 | 1471 | 69 | 2.6 | 19 | 230 | 74.9 | 4.8 | 2.5 | 1059 | 2.7 | 0 | ||
| 12.8 | 6.04 | 107 | 586 | 6.1 | −0.6 | 468 | 54.6 | 3.2 | 11.5 | 48 | 22.3 | 11.9 | 15.4 | 295 | 0.8 | 0.1 | ||
| 15.8 | 5.47 | 105 | 612 | 4.9 | −0.03 | 535 | 60 | 3.5 | 14 | 57 | 25.7 | 11.4 | 5.1 | 353 | 1 | 0 | ||
| Statistical Value | Temp. | pH | Eh | EC | DO | TDS | Na | K | Mg | Ca | SiO2 | Cl | SO4 | HCO3 | F | NO3 | |
|---|---|---|---|---|---|---|---|---|---|---|---|---|---|---|---|---|---|
| MDb | 16.52 | 7.02 | 45.61 | 223.0 | 5.33 | −2.08 | 174.0 | 13.11 | 1.64 | 3.72 | 20.6 | 24.88 | 6.38 | 4.84 | 81.18 | 0.84 | 3.61 |
| MDc | 18.01 | 5.44 | 120.97 | 576.0 | 2.63 | −0.06 | 587.0 | 19.75 | 2.13 | 5.94 | 39.14 | 46.14 | 9.30 | 4.49 | 200.85 | 0.88 | 3.43 |
| MNc | 20.03 | 5.43 | 127.80 | 825.25 | 2.60 | −0.05 | 882.58 | 40.30 | 2.28 | 14.91 | 125.39 | 57.95 | 12.62 | 13.93 | 607.78 | 1.56 | 4.04 |
| 1SDb | 22.33 | 6.25 | 184.08 | 377.3 | 2.70 | −1.26 | 286.77 | 37.84 | 2.70 | 7.57 | 46.80 | 34.23 | 151.27 | 41.85 | 168.88 | 8.21 | 10.59 |
| QIshift (Crit = 1) | 0.3 | 2.1 | 0.5 | 2.3 | 1.0 | 2.5 | 3.7 | 0.3 | 0.5 | 0.6 | 0.7 | 2.3 | 0.0 | 0.0 | 1.4 | 0.0 | 0.0 |
| QItail (Crit = 1) | 0.6 | 2.1 | 0.6 | 3.9 | 1.0 | 2.5 | 6.3 | 1.1 | 0.6 | 2.9 | 4.0 | 3.5 | 0.0 | 0.2 | 6.0 | 0.1 | 0.1 |
| Test | Temp. | pH | Eh | EC | DO | Alkalinity | TDS | Na | K | Mg | Ca | SiO2 | Cl | SO4 | HCO3 | F | NO3 | |
|---|---|---|---|---|---|---|---|---|---|---|---|---|---|---|---|---|---|---|
| t-test (equal variance) | 0 | 1 | 1 | 1 | 1 | 1 | 0 | 1 | 1 | 1 | 1 | 1 | 1 | 1 | 0 | 1 | 0 | 0 |
| t-test (heteroscedasticity) | 0 | 1 | 1 | 1 | 1 | 1 | 0 | 1 | 1 | 0 | 1 | 1 | 1 | 1 | 0 | 1 | 0 | 0 |
| Wilcoxon test (upper) | 1 | 1 | 0 | 1 | 1 | 1 | 0 | 1 | 1 | 1 | 1 | 1 | 1 | 0 | 1 | 0 | 0 | |
| Wilcoxon test (lower) | 0 | 1 | 1 | 1 | 1 | 1 | - | 0 | 1 | 0 | 0 | 1 | 1 | 0 | 1 | 0 | 0 | 0 |
| PDF test (QIshift) | 0 | 1 | 0 | 1 | 0 | 1 | - | 1 | 0 | 0 | 0 | 0 | 1 | 0 | 0 | 1 | 0 | 0 |
| PDF test (QItail) | 0 | 1 | 0 | 1 | 0 | 1 | - | 1 | 1 | 0 | 1 | 1 | 1 | 0 | 0 | 1 | 0 | 0 |
| Province | Temp. | pH | Eh | EC | HCO3 | DO | TDS | Na | K | Mg | Ca | SiO2 | Cl | SO4 | NO3 | F |
|---|---|---|---|---|---|---|---|---|---|---|---|---|---|---|---|---|
| Gwangwon | × | ○ | ○ | ○ | ○ | ○ | ○ | ○ | ○ | ○ | ○ | ○ | ○ | ○ | ○ | ○ |
| Gyeongsang | ○ | ○ | ○ | ○ | ○ | × | ○ | × | ○ | ○ | ○ | ○ | × | × | ○ | ○ |
| Chungcheong | × | ○ | × | ○ | ○ | ○ | ○ | ○ | × | ○ | ○ | ○ | × | × | × | × |
| Province | Gangwon | Gyeongsang * | Chungcheong | ||
|---|---|---|---|---|---|
| Statistics of | CO2-Rich | Ordinary | CO2-Rich | CO2-Rich | Ordinary |
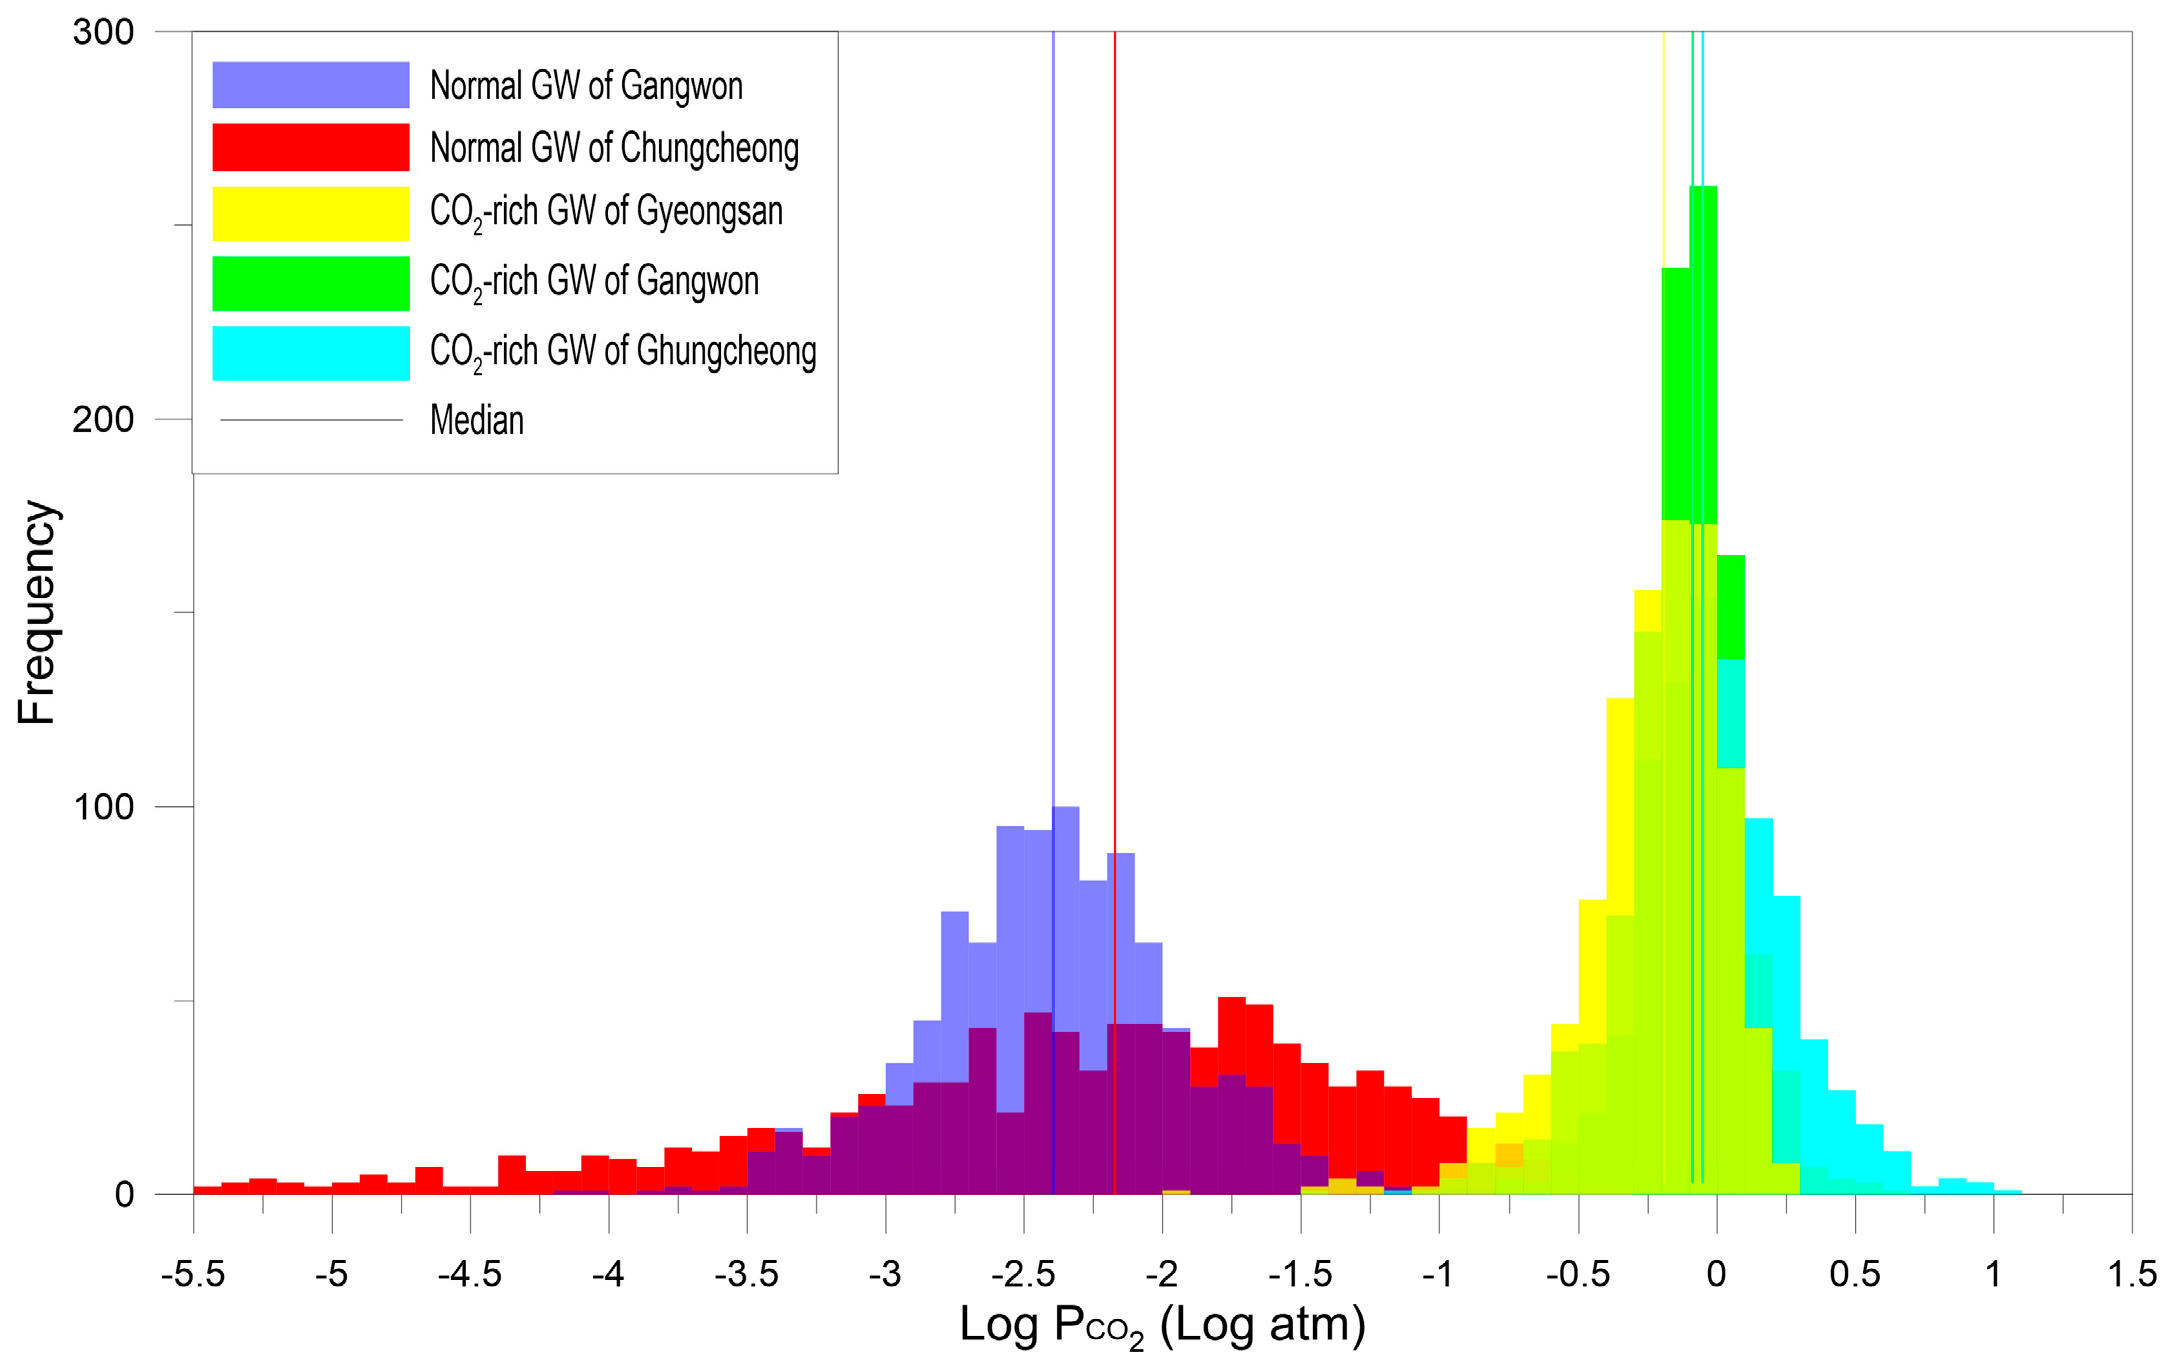
| Mean | −0.1 | −2.4 | −0.22 | −0.05 | −2.3 |
| Median | −0.1 | −2.4 | −0.18 | −0.05 | −2.08 |
| S.D | 0.2 | 0.4 | 0.24 | 0.31 | 1.06 |
| Minimum | −0.9 | −3.9 | −1.55 | −1.98 | −7.22 |
| Maximum | 0.6 | −0.3 | 0.28 | 0.91 | −0.36 |
© 2017 by the authors. Licensee MDPI, Basel, Switzerland. This article is an open access article distributed under the terms and conditions of the Creative Commons Attribution (CC BY) license (http://creativecommons.org/licenses/by/4.0/).
Share and Cite
Kim, K.-K.; Hamm, S.-Y.; Cheong, J.-Y.; Kim, S.-O.; Yun, S.-T. A Natural Analogue Approach for Discriminating Leaks of CO2 Stored Underground Using Groundwater Geochemistry Statistical Methods, South Korea. Water 2017, 9, 960. https://doi.org/10.3390/w9120960
Kim K-K, Hamm S-Y, Cheong J-Y, Kim S-O, Yun S-T. A Natural Analogue Approach for Discriminating Leaks of CO2 Stored Underground Using Groundwater Geochemistry Statistical Methods, South Korea. Water. 2017; 9(12):960. https://doi.org/10.3390/w9120960
Chicago/Turabian StyleKim, Kwang-Koo, Se-Yeong Hamm, Jae-Yeol Cheong, Soon-Oh Kim, and Seong-Taek Yun. 2017. "A Natural Analogue Approach for Discriminating Leaks of CO2 Stored Underground Using Groundwater Geochemistry Statistical Methods, South Korea" Water 9, no. 12: 960. https://doi.org/10.3390/w9120960