Article

Compound-Specific Isotope Analysis (CSIA) Application for Source Apportionment and Natural Attenuation Assessment of Chlorinated Benzenes

1
Dipartimento di Ingegneria Civile ed Ambientale, Politecnico di Milano, Piazza Leonardo da Vinci, 32-20133 Milano, Italy
2
Tethys S.r.l.-Indagini Geologiche-Ambientali, Viale Lombardia, 11-20131 Milano, Italy
3
Department of Earth and Environmental sciences, University of Waterloo, 200 University Ave. West, Waterloo, ON N2L 3G1, Canada
*
Author to whom correspondence should be addressed.
Water 2017, 9(11), 872; https://doi.org/10.3390/w9110872
Submission received: 22 September 2017 / Revised: 25 October 2017 / Accepted: 1 November 2017 / Published: 9 November 2017
(This article belongs to the Special Issue Isotopes in Hydrology and Hydrogeology)

Abstract

:
In light of the complex management of chlorobenzene (CB) contaminated sites, at which a hydraulic barrier (HB) for plumes containment is emplaced, compound-specific stable isotope analysis (CSIA) has been applied for source apportionment, for investigating the relation between the upgradient and downgradient of the HB, and to target potential CB biodegradation processes. The isotope signature of all the components potentially involved in the degradation processes has been expressed using the concentration-weighted average δ13C of CBs + benzene (δ13Csum). Upgradient of the HB, the average δ13Csum of −25.6‰ and −29.4‰ were measured for plumes within the eastern and western sectors, respectively. Similar values were observed for the potential sources, with δ13Csum values of −26.5‰ for contaminated soils and −29.8‰ for the processing water pipeline in the eastern and western sectors, respectively, allowing for apportioning of these potential sources to the respective contaminant plumes. For the downgradient of the HB, similar CB concentrations but enriched δ13Csum values between −24.5‰ and −25.9‰ were measured. Moreover, contaminated soils showed a similar δ13Csum signature of −24.5‰, thus suggesting that the plumes likely originate from past activities located in the downgradient of the HB. Within the industrial property, significant δ13C enrichments were measured for 1,2,4-trichlorobenzene (TCB), 1,2-dichlorobenzene (DCB), 1,3-DCB, and 1,4-DCBs, thus suggesting an important role for anaerobic biodegradation. Further degradation of monochlorobenzene (MCB) and benzene was also demonstrated. CSIA was confirmed to be an effective approach for site characterization, revealing the proper functioning of the HB and demonstrating the important role of natural attenuation processes in reducing the contamination upgradient of the HB.

1. Introduction

Chlorinated solvents pose significant risks to human health, and contaminated sites entail tremendous management costs [1,2]. As a consequence of their intense use as solvents, industrial intermediates, and pesticides (in the past, dichlorodiphenyltrichloroethane, DDT, was also produced from chlorinated aromatics), these compounds, and particularly chlorinated benzenes (CBs), are frequently encountered as soil and groundwater contaminants [3]. The characterization and remediation of contaminated sites involves high costs, estimated from 500 to 5 million euros on average per site (European Union (EU) data [1]); hence the application of the polluter pays principle (PPP) may become essential. The application of new approaches for the correct identification of the polluter is necessary particularly in the presence of potential multiple sources/polluters, and especially at mega-sites such as industrial areas or petrochemical plants [4]. Also known as “source identification”, “fingerprinting”, or “source apportionment” (SA hereafter), this approach is also important for site-restoration applications [5,6,7,8,9]. Frequently after remediation actions (e.g., plume or source containment by physical or hydraulic barriers (HBs)), a downgradient contamination can still be detected [10], and often it is crucial to understand the reasons for the ongoing contamination. Studies including SA may provide an understanding of whether the downgradient pollution is due to a failure of the remediation system, for example, failure of containment of the contaminants by the barrier [11,12], or rather is related to other external sources undiscovered during the characterization of the contaminated site belonging to some other industrial sites.
Compound-specific stable isotope analysis (CSIA) is one of the tools used for SA that has been accepted by the public authorities, including the United States Environmental Protection Agency (US EPA) [13]. Potentially, different polluters may be using (or storing) contaminants that may have a different initial isotopic composition for one or several elements characterizing the target molecule (carbon, chlorine or hydrogen in the case of chlorinated hydrocarbons). Different isotopic patterns generally aid in distinguishing between different contaminant plumes and eventually help to appoint plumes to their respective sources (SA) [5,6,7,8,9,13]. Furthermore, the use of CSIA enables the investigator to identify, and in some cases also quantify, natural attenuation processes such as biodegradation or abiotic reduction [14,15]. When contaminants are degraded in the environment, the ratio of stable isotopes may change (the “isotope fractionation”). Furthermore, molecules containing lighter isotopes tend to react more rapidly compared to those including heavy isotopes. Indeed, the extent of degradation can be estimated by evaluating changes in the stable isotope ratio of the remaining fraction [13]. In this context, CSIA has a pivotal application for contaminated sites where monitored natural attenuation (MNA) is applied [16]. MNA is most often used to reinforce other measures of active remediation, for example, source containment by physical or HBs or source treatment such as in situ chemical oxidation (ISCO) [17]. MNA is considered among the most valuable remediation actions for its wide applicability, the excellent cost/benefit relationship, and particularly for having the lowest environmental impact when compared to active systems practices [18].
In the specific case of the CBs, chemical transformations such as abiotic hydrolysis are generally considered to be limited [19,20]. Biodegradation processes on the other hand, both under aerobic and anaerobic conditions, can help to significantly reduce the concentrations of these contaminants in the subsurface. As a rule of thumb, highly chlorinated benzenes such as trichlorobenzenes (TCBs) have a tendency to undergo reductive dehalogenation [21]. Conversely, lower CBs such as monochlorobenzene (MCB) preferentially degrade via oxidative processes to complete mineralization [21]. Anaerobic degradation such as reductive dehalogenation appears to be up to 10 times faster than aerobic oxidation processes [3]; however, it may have the disadvantage of generating benzene as a final product of the biodegradation, which in turn is more toxic than the starting products [22]. In contrast to compounds such as chlorinated ethenes, for which there is a well-developed literature on CSIA applications, only few studies are available for CBs. Significant carbon enrichment factors were obtained in laboratory experiments under anaerobic conditions, ranging from −0.8‰ to −6.3‰ for several CBs [22,23,24,25,26], which allows for the use of CSIA for tracing in situ biodegradation of CBs in contaminated anoxic aquifers. Kaschl et al. [24,27] demonstrated MCB anaerobic biodegradation at two contaminated sites, while [28] investigated anaerobic biodegradation of dichlorobenzenes (DCBs) and MCB by interpreting CSIA results on the basis of an isotope mass balance approach. On the contrary, almost no isotope carbon fractionation for MCB and 1,2,4 TCB during aerobic biodegradation was demonstrated [23,24] —results that were confirmed by Liang et al. [25]. Thus, the lack of carbon isotope fractionation limits the use of carbon-CSIA for MNA applications in contaminated environments under oxic conditions.
The present study examines the potential of CSIA for CBs, particularly DCBs (1,2-, 1,3- and 1,4-DCB) and MCB, at a complex contaminated site where, in 2002, a HB was installed to contain contamination. CSIA in conjunction with hydrogeological data and contaminant concentrations has been applied for SA, to understand if the HB is effective in containing contaminants, and to evaluate the role of potential biodegradation processes on the contaminant distribution in the aquifer downgradient of the HB. Moreover, the origin and the fate of benzene has been investigated to discriminate between its presence as a primary contaminant or as a by-product of MCB biodegradation.

2. Materials and Methods

2.1. Site Description

The site, located in northern Italy, consists of two main areas: (i) the upgradient of the HB emplaced in 2002, and where a chemical manufacturing plant has been operating since the 1920s, producing pesticides and plastic products; and (ii) the downgradient of the HB, where a chemical waste management facility for hazardous waste has been in operation since the 1980s. (Figure 1). Located within a 2 km-wide valley, the site is surrounded by other industrial properties to the north and west and by a river to the south.
The pesticides and plastic production plant was initially located in the eastern portion of the industrial property (old facilities area) during the first 60 years of its activity (Figure 1). Only at a later stage was the production area relocated to the western sector (active facilities), and by then all of the production system had undergone renovation (yellow area in Figure 1). Starting in 1995, the site underwent several environmental characterization and remediation activities, including the design and installation of a HB along the southern border of the chemical manufacturing plant (Figure 1).
The stratigraphy of the Quaternary sediments consists of very coarse sand and gravels (down to about 25 m below ground level (b.g.l.)), and sands and fine sands (from 25 to 60 m b.g.l.) sitting on impermeable silts and clay (starting at 60 m b.g.l.). The alluvial deposits host an unconfined aquifer bounded at its sides by igneous rocks of low permeability. The water table is found at shallow depths, between 3 and 6 m b.g.l., and the direction of groundwater flow is north to south-west, mainly toward the HB and further beyond to the river (Figure 1). The aquifer properties were investigated with geotechnical laboratory probing, pumping (especially in the shallower 20 m of the aquifer), falling head, and single-point dilution tests. The shallow sand and gravel layer have a high hydraulic conductivity (from 1 × 10⁻³ to 3 × 10⁻³ m s−1), while in the underlying sandy layers, the hydraulic conductivity decreases progressively with depth from 2 × 10⁻⁴ to 1 × 10⁻⁵ m s−1.
A wide monitoring network consisting of 153 points within the shallow aquifer (down to 30 m b.g.l.) defines the study area. Previous chemical investigations performed regularly every 6 months for the last 15 years revealed several chlorinated solvents, including MCB, DCBs (1,2-, 1,3- and 1,4-DCB) and benzene with concentrations above the maximum concentration limit (MCL). Additional chlorinated compounds, referred to as chlorinated toluenes (2- and 4-chlorotoluene, and 2,3-, 2,4-, and 2,6-dichlorotoluene) and toluene were also detected (data not shown).
At the site, the contamination by chlorinated solvents is identified within three narrow plumes (Figure 1): one plume is located in the eastern portion and two are located in the western portion of the industrial property. All the plumes reach the HB at different locations (Figure 1).
The HB consists of 16 “well pairs”, a combination of short wells from 3 to 10 m b.g.l. and deeper wells from 10 to 20 m b.g.l., designed to capture contaminants flowing in the more conductive and contaminated part of the aquifer. Despite the adopted containment system, relevant concentrations, particularly of MCB, are still detected in the downgradient of the HB (Figure 1) and within the area for which the chemical waste management facility operated during the 1980s.
For an easier characterization of the study site, results are presented with regard to the two main sectors and identified by the site history and function together with the groundwater flow patterns (Figure 1): the eastern sector (i), where the old plant was located and operating until the 1980s; and the western sector (ii), where the facility is still operative. Moreover, throughout the manuscript, citing the upgradient and the downgradient is intended to refer to the HB (Figure 1), representative of the industrial property and the chemical waste management facility areas, respectively.

2.2. Sampling and Geochemical Parameters

In order to achieve the objectives of this study, groundwater was collected from 16 sampling locations. Wells were selected from the existing monitoring network (down to 30 m b.g.l.; Figure 2) and were known to show significant concentrations of chlorinated solvents. In addition, one sample representative of the processing water was collected (WP; Figure 2), as well as four soil samples (B-; Figure 2) required to investigate the potential sources’ distribution.
The groundwater flow and the distribution of contaminants refer to the shallow portion of the aquifer; the groundwater samples were processed for CB, chlorinated toluene (CT) and benzene concentrations, as well as CSIA and redox species characterization.
Field parameters, including dissolved oxygen (DO), were measured by a portable probe (WTW Multi 3430 IDS). The redox species, SO42−, S2−, NO3, and NO2 were measured by ion chromatography, whereas Mn (II), total iron (Fetot) and Fe (II) were determined by inductively coupled plasma-mass spectrometry.

2.3. Concentration and CSIA Analyses

Concentrations of the target contaminants in groundwater samples were determined by headspace analysis using a gas chromatograph and were coupled to a mass spectrometer (Agilent Technologies, Santa Clara, CA, USA). The same procedure was applied for soil samples, subsequent to contaminant extraction by means of a non-polar solvent (pentane with an internal standard). Carbon isotope ratios of the target contaminants were determined by headspace solid-phase micro-extraction coupled to a gas chromatograph and to an isotope ratio mass spectrometer via a combustion interface (Thermo Fisher Scientific, Waltham, United States). Isotope data are reported using the delta notation, δ13 (‰) = ((Rs/Rstd) − 1) × 1000, where Rs and Rstd are the 13C/12C ratios of the sample and the international standard, Vienna Pee Dee Belemnite (VPDB), respectively. It is intended that the terms “enriched” and “depleted” refer to the heavy isotope (13C) consistently. The samples were analyzed in triplicate with a precision of between 0.1‰ and 0.5‰. All the analysis were performed at Isotope Tracer Technologies Europe Srl, Milan, Italy.
The concentration-weighted average δ13C of CBs + benzene (δ13Csum) was calculated using Equation (1):
δ13Csum = Σ(Ci × δ13Ci)/Csum (Csum − CBs)
where Ci and δ13Ci are the molar concentrations and the carbon isotope composition of each compound. Csum represents the total molar concentration of all contributors.
The error associated with the concentration-weighted average δ13C calculation was computed using the standard deviation of the isotope measurements (when not available, 0.5‰ was used) and a precision of 10% for the concentration analysis. On the basis of the error propagation, the following equation was adopted:
Δ δ 13 C sum = [   Σ ( C i × Δ δ 13 C i ) 2 + Σ ( [ δ 13 C i δ 13 C sum ] × Δ C i ) 2 ] C sum
To estimate the extent of biodegradation, a modified version of the Rayleigh equation was adopted, as follows:
f = e^((δ13Ci − δ13Csource)/ε)
where δ13Ci and δ13Csource are the isotopic compositions along the plume (at the monitoring point i) and at the source (initial) respectively, ε represents the stable isotope enrichment factor, and f is the remaining compound fraction, C/Cinitial [13].

3. Results

The presentation of geochemical and isotopic data is preceded by an overall site characterization on the basis of redox parameters. Then, the spatial distribution of the contaminants, molar fractions and the CSIA results are presented separately in this section. As previously mentioned, data are shown for the eastern and western sectors and upgradient or downgradient of the HB (Figure 1 and Figure 2). All the available raw data are reported in Table 1.
Groundwater at the site was generally under anoxic conditions, with low DO concentrations ranging between 0.1 and 0.8 mg L−1 (S25 and S70T, respectively; Table 1 and Figure 2), the exception being a relatively high concentration (2.2 mg L−1) in well S67T (Table 1 and Figure 2). With regard to potential electron acceptors, other redox species were found at low concentrations; for example, all nitrate data were below 1 mg L−1 or down to the detection limit (data not shown). Sulphate concentrations ranged from 21 to 1960 mg L−1 (Table 1 and Figure 2). Sulphate data from the eastern sector is reported for samples collected in the downgradient only (29 mg L−1 in S25 and 560 mg L−1 in S61 and S62T); hotspots of high sulphate levels were detected in the western sector: 1960 mg L−1 in the upgradient (968T), and downgradient values of up to 450 and 720 mg L−1 (S72T and S67T, respectively). It is noteworthy that regardless of such differences in sulphate concentrations, which tend to suggest the occurrence of sulphate reduction, the sulphide concentration remained below the detection limit (<0.5 mg L−1) in all the monitoring wells. Similarly, nitrite (with a detection limit of <0.1 mg L−1) was present in very low concentrations (968T, upgradient, western sector), except for S73 (4 mg L−1, downgradient, western sector). Concentrations of Fe (II) in groundwater samples were as high as 12 mg L−1, as measured in well S62T (western sector, downgradient), whereas the highest values of 22 and 190 mg L−1 refer to wells S76 and 968T located in the downgradient eastern sector (Table 1 and Figure 2). The high Fe (II) concentration values generally correspond to consistent manganese (Mn) content (of up to 0.8 mg L−1; Table 1 and Figure 2). Overall, the redox data indicate that the groundwater system is at least under iron reducing conditions.

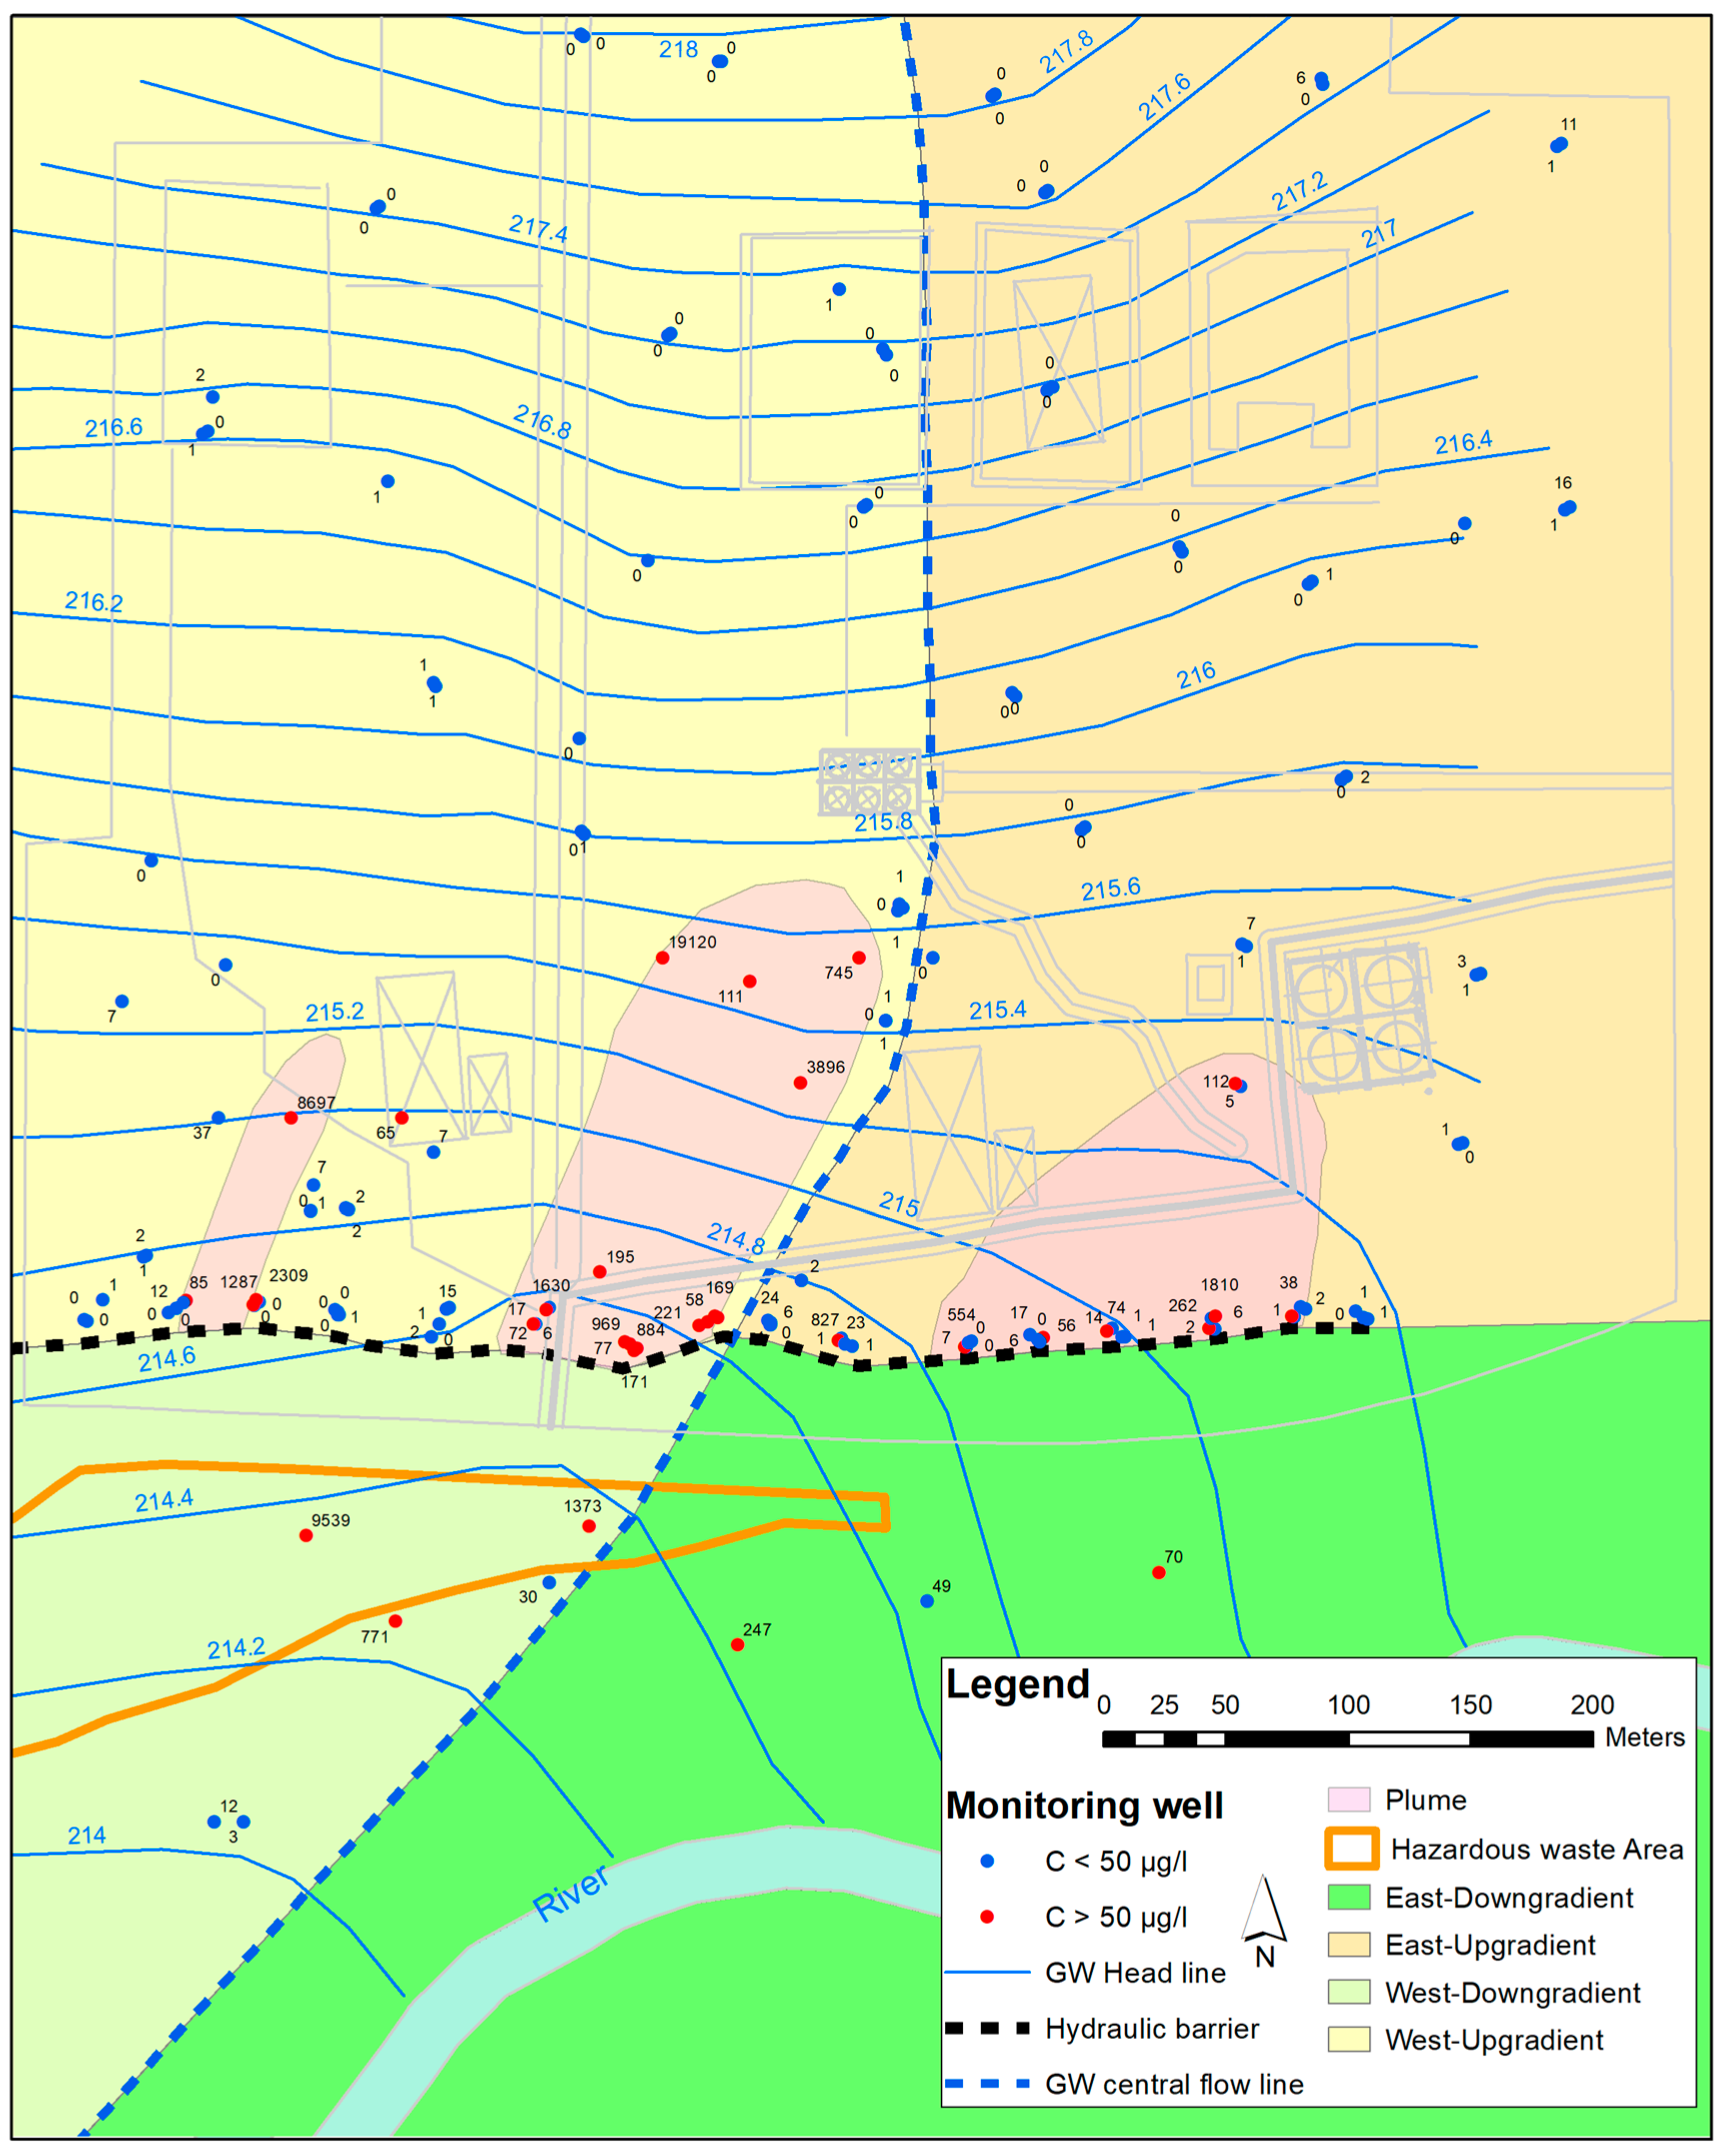
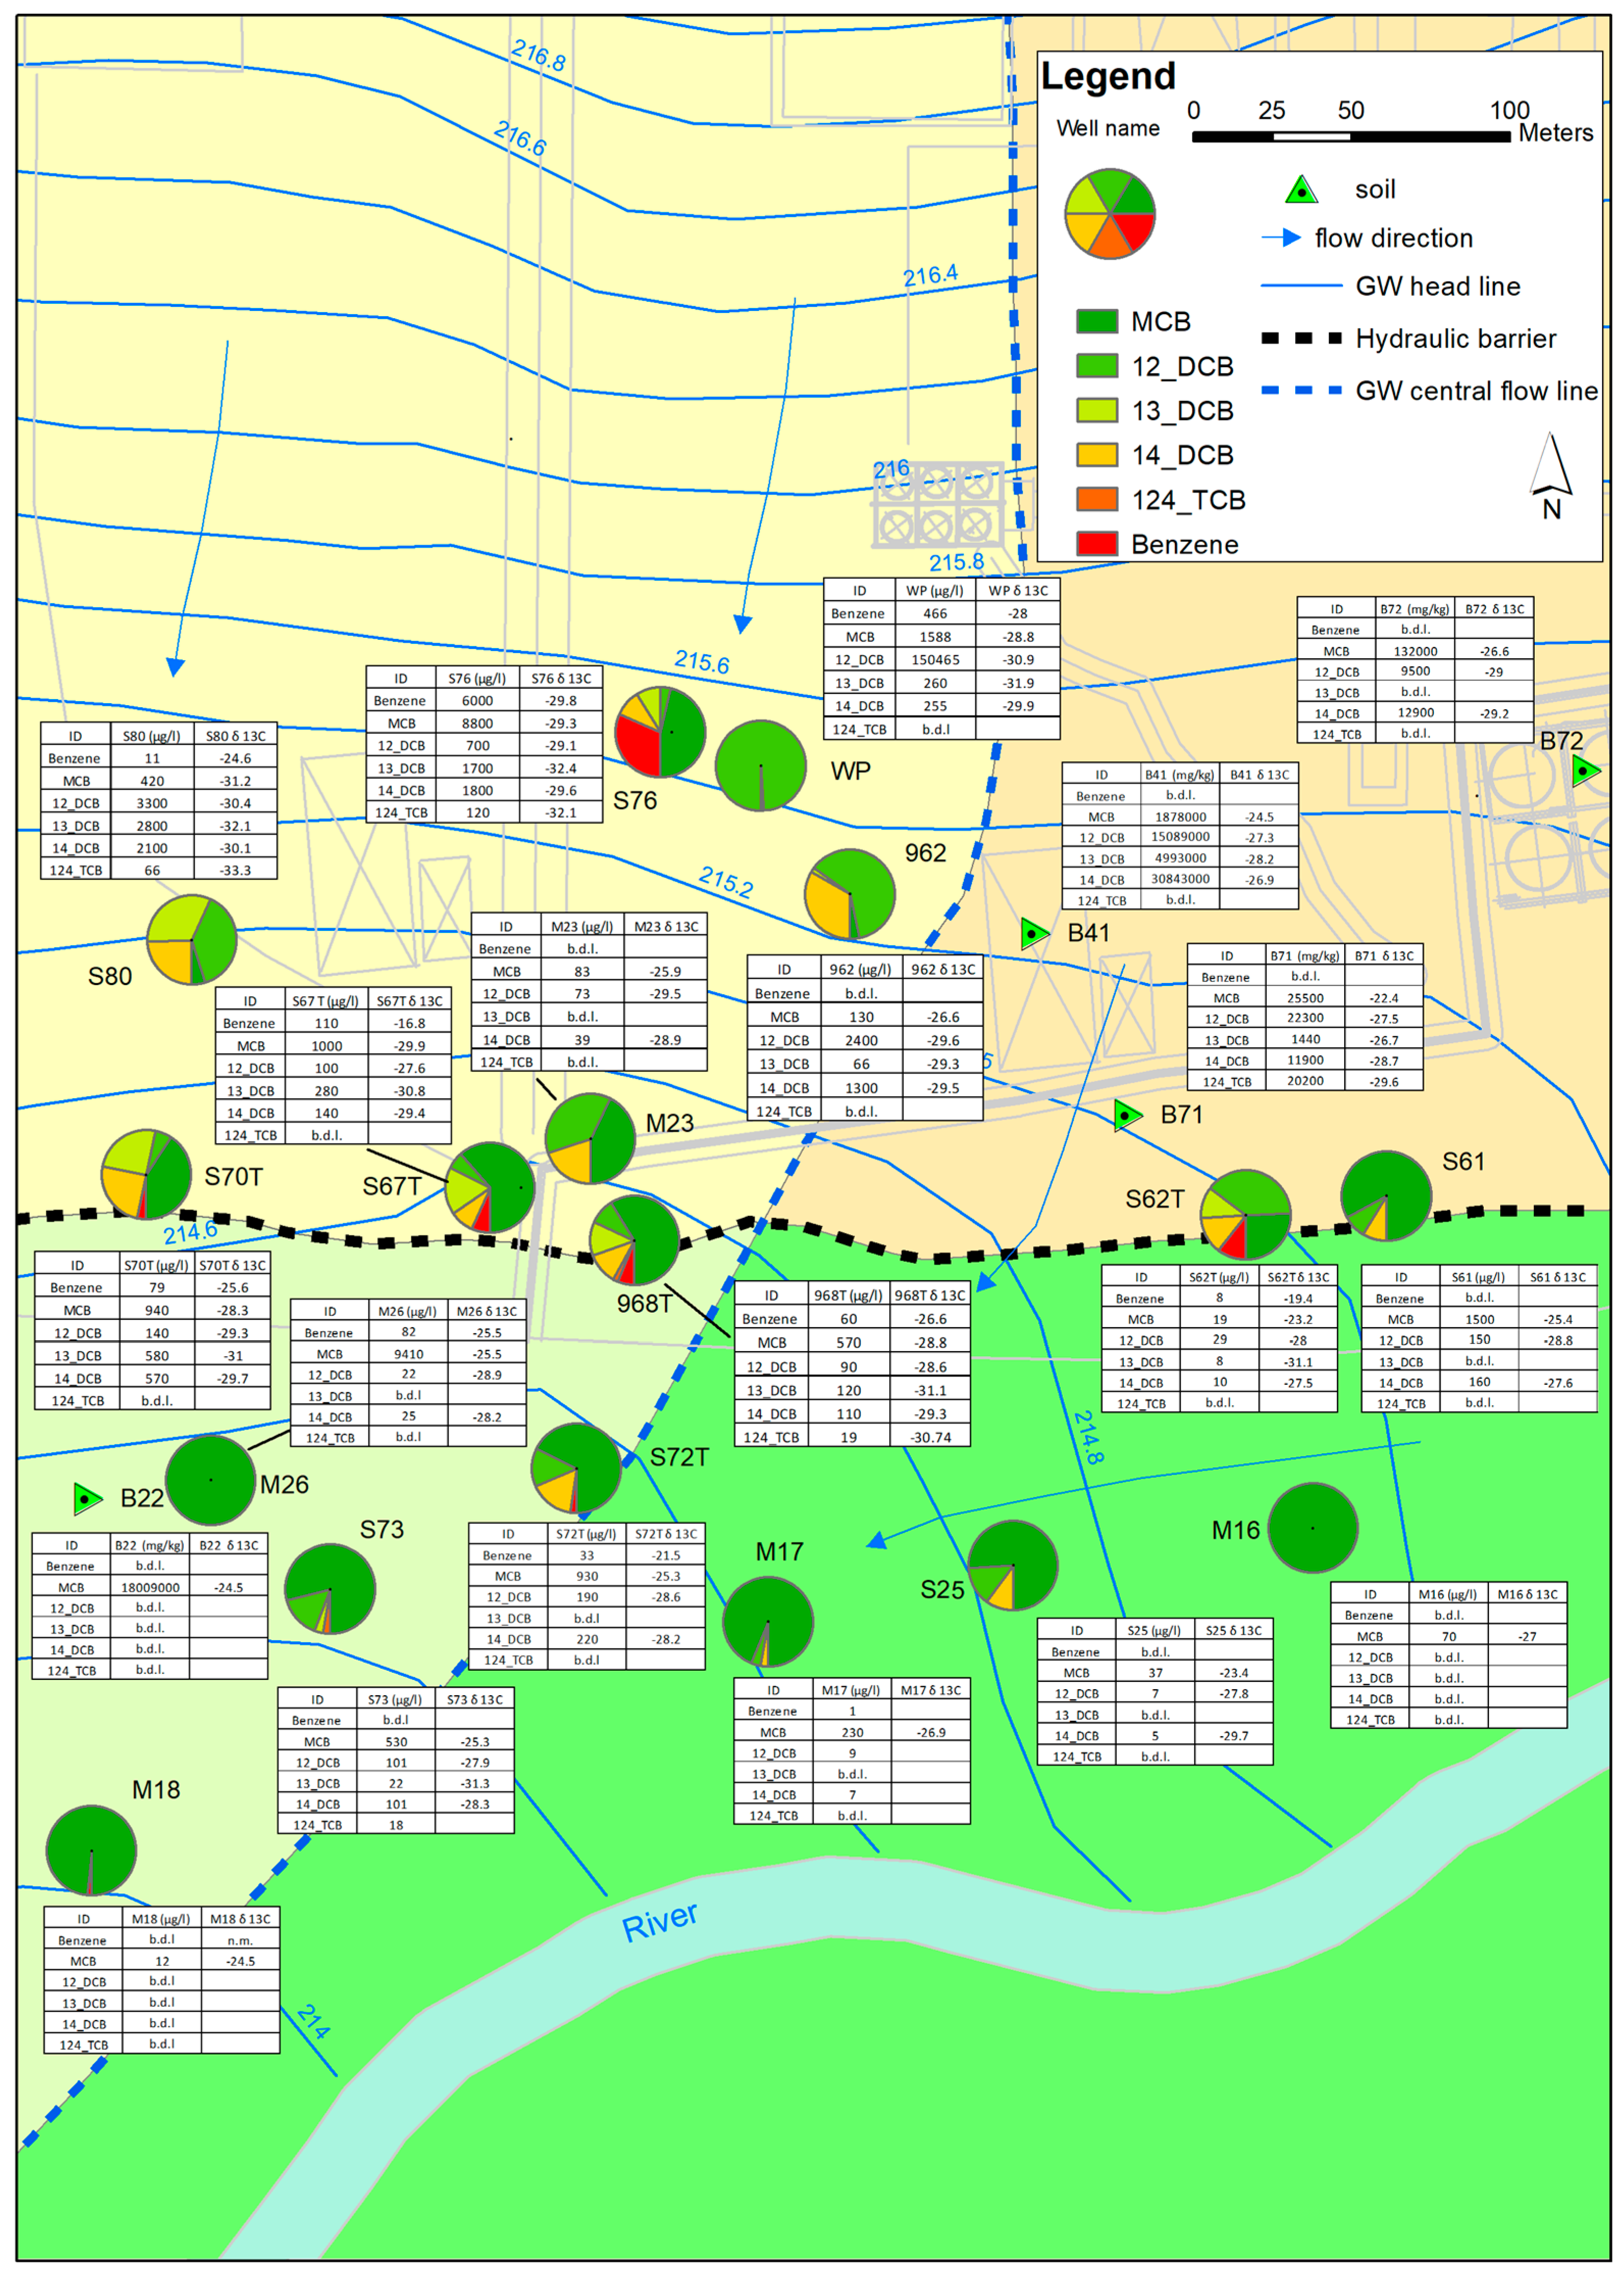
3.1. Contaminants’ Spatial Distribution

3.1.1. The Western Sector

High total CB concentrations were detected, especially in the upgradient of the HB; values ranged between 195 µg L−1 (M23) and 19120 µg L−1 (S76l Table 1 and Figure 2). In the downgradient, CBs showed lower concentrations, ranging between 12 µg L−1 (M18) and 9539 µg L−1 (M26; Table 1 and Figure 2).
With regard to specific compounds, the upgradient MCB concentrations ranged from 83 µg L−1 (M23) to 8800 µg L−1 (S76), while monitoring wells in the downgradient revealed concentrations of between 12 µg L−1 (M18) and 9410 µg L−1 (M26; Table 1 and Figure 2).
The upgradient 1,2- and 1,3-DCB concentrations were generally higher compared to those in the downgradient (Table 1). The upgradient 1,2-DCB values ranged between 73 and 3300 µg L−1 (M23 and S80, respectively) whereas the 1,3-DCB concentrations reached values of between 66 and 2800 µg L−1 (962 and S80, respectively). In the downgradient, 1,2-DCB varied from 22 to 190 µg L−1 (M26 and S72T), while concentrations of 1,3-DCB were generally below the detection limit, and only 22 µg L−1 was measured in S73. In the case of 1,4-DCB, concentrations were much higher in the upgradient than in the downgradient (Table 1 and Figure 2). The 1,4-DCB measured in the upgradient reached values of between 110 and 2100 µg L−1 (968T and S80, respectively) with only a minor amount in M23, for which a concentration of 39 µg L−1 was detected. A different magnitude characterized 1,4 DCB values in the downgradient; values of 25 and 220 µg L−1 were detected in M26 and S72T, respectively.
The available 1,2,4-TCB data characterizes only the upgradient western sector, as most of the other monitoring wells had concentrations below the detection limit. Significant 1,2,4-TCB concentrations were measured in S76 (120 µg L−1), S80 (66 µg L−1) and 968T (19 µg L−1; Table 1 and Figure 2).
Benzene was also present at the site, where the highest concentration, 6000 µg L−1, was detected in the upgradient at S76. The benzene content tended to decrease toward the HB, dropping to 11 µg L−1 at S80. Likewise, in the downgradient, benzene was present at lower concentrations ranging between 82 µg L−1 (M26) and 33 µg L−1 (S72T; Table 1 and Figure 2).
In addition to CBs, CTs were also detected and were restricted solely to the western sector (Table 1 and Figure 2). The available CT data (e.g., 2-, and 4-chlorotoluene, and 2,3- and 2,6-dichlorotoluene) characterize the upgradient area, where concentrations ranged from 11145 down to 189 µg L−1 in S76 and 962, respectively.
In the area in which the production line is still operating, the preprocessing residual waters (WP) revealed a total CB content of 153034 µg L−1, for which 1,2-DCB was the main contaminant with a concentration of 150465 µg L−1 (Table 1). WP samples revealed consistent concentrations of CT of about 21940 µg L−1 (Table 1).
The soil sample collected within the western sector at B22 was characterized by CBs as MCB with a concentration of 18009000 µg kg−1 (Table 1 and Figure 2).
In summary, the investigation of CB molar fractions in groundwater samples showed a predominance of DCBs, particularly in the upgradient in wells S80 and 962 (Figure 2). The MCB molar fraction showed a positive trend along the flow system, becoming consistent in the vicinity of the HB (Table 1). A very low molar fraction was registered for 1,2,4-TCB (Table 1).

3.1.2. The Eastern Sector
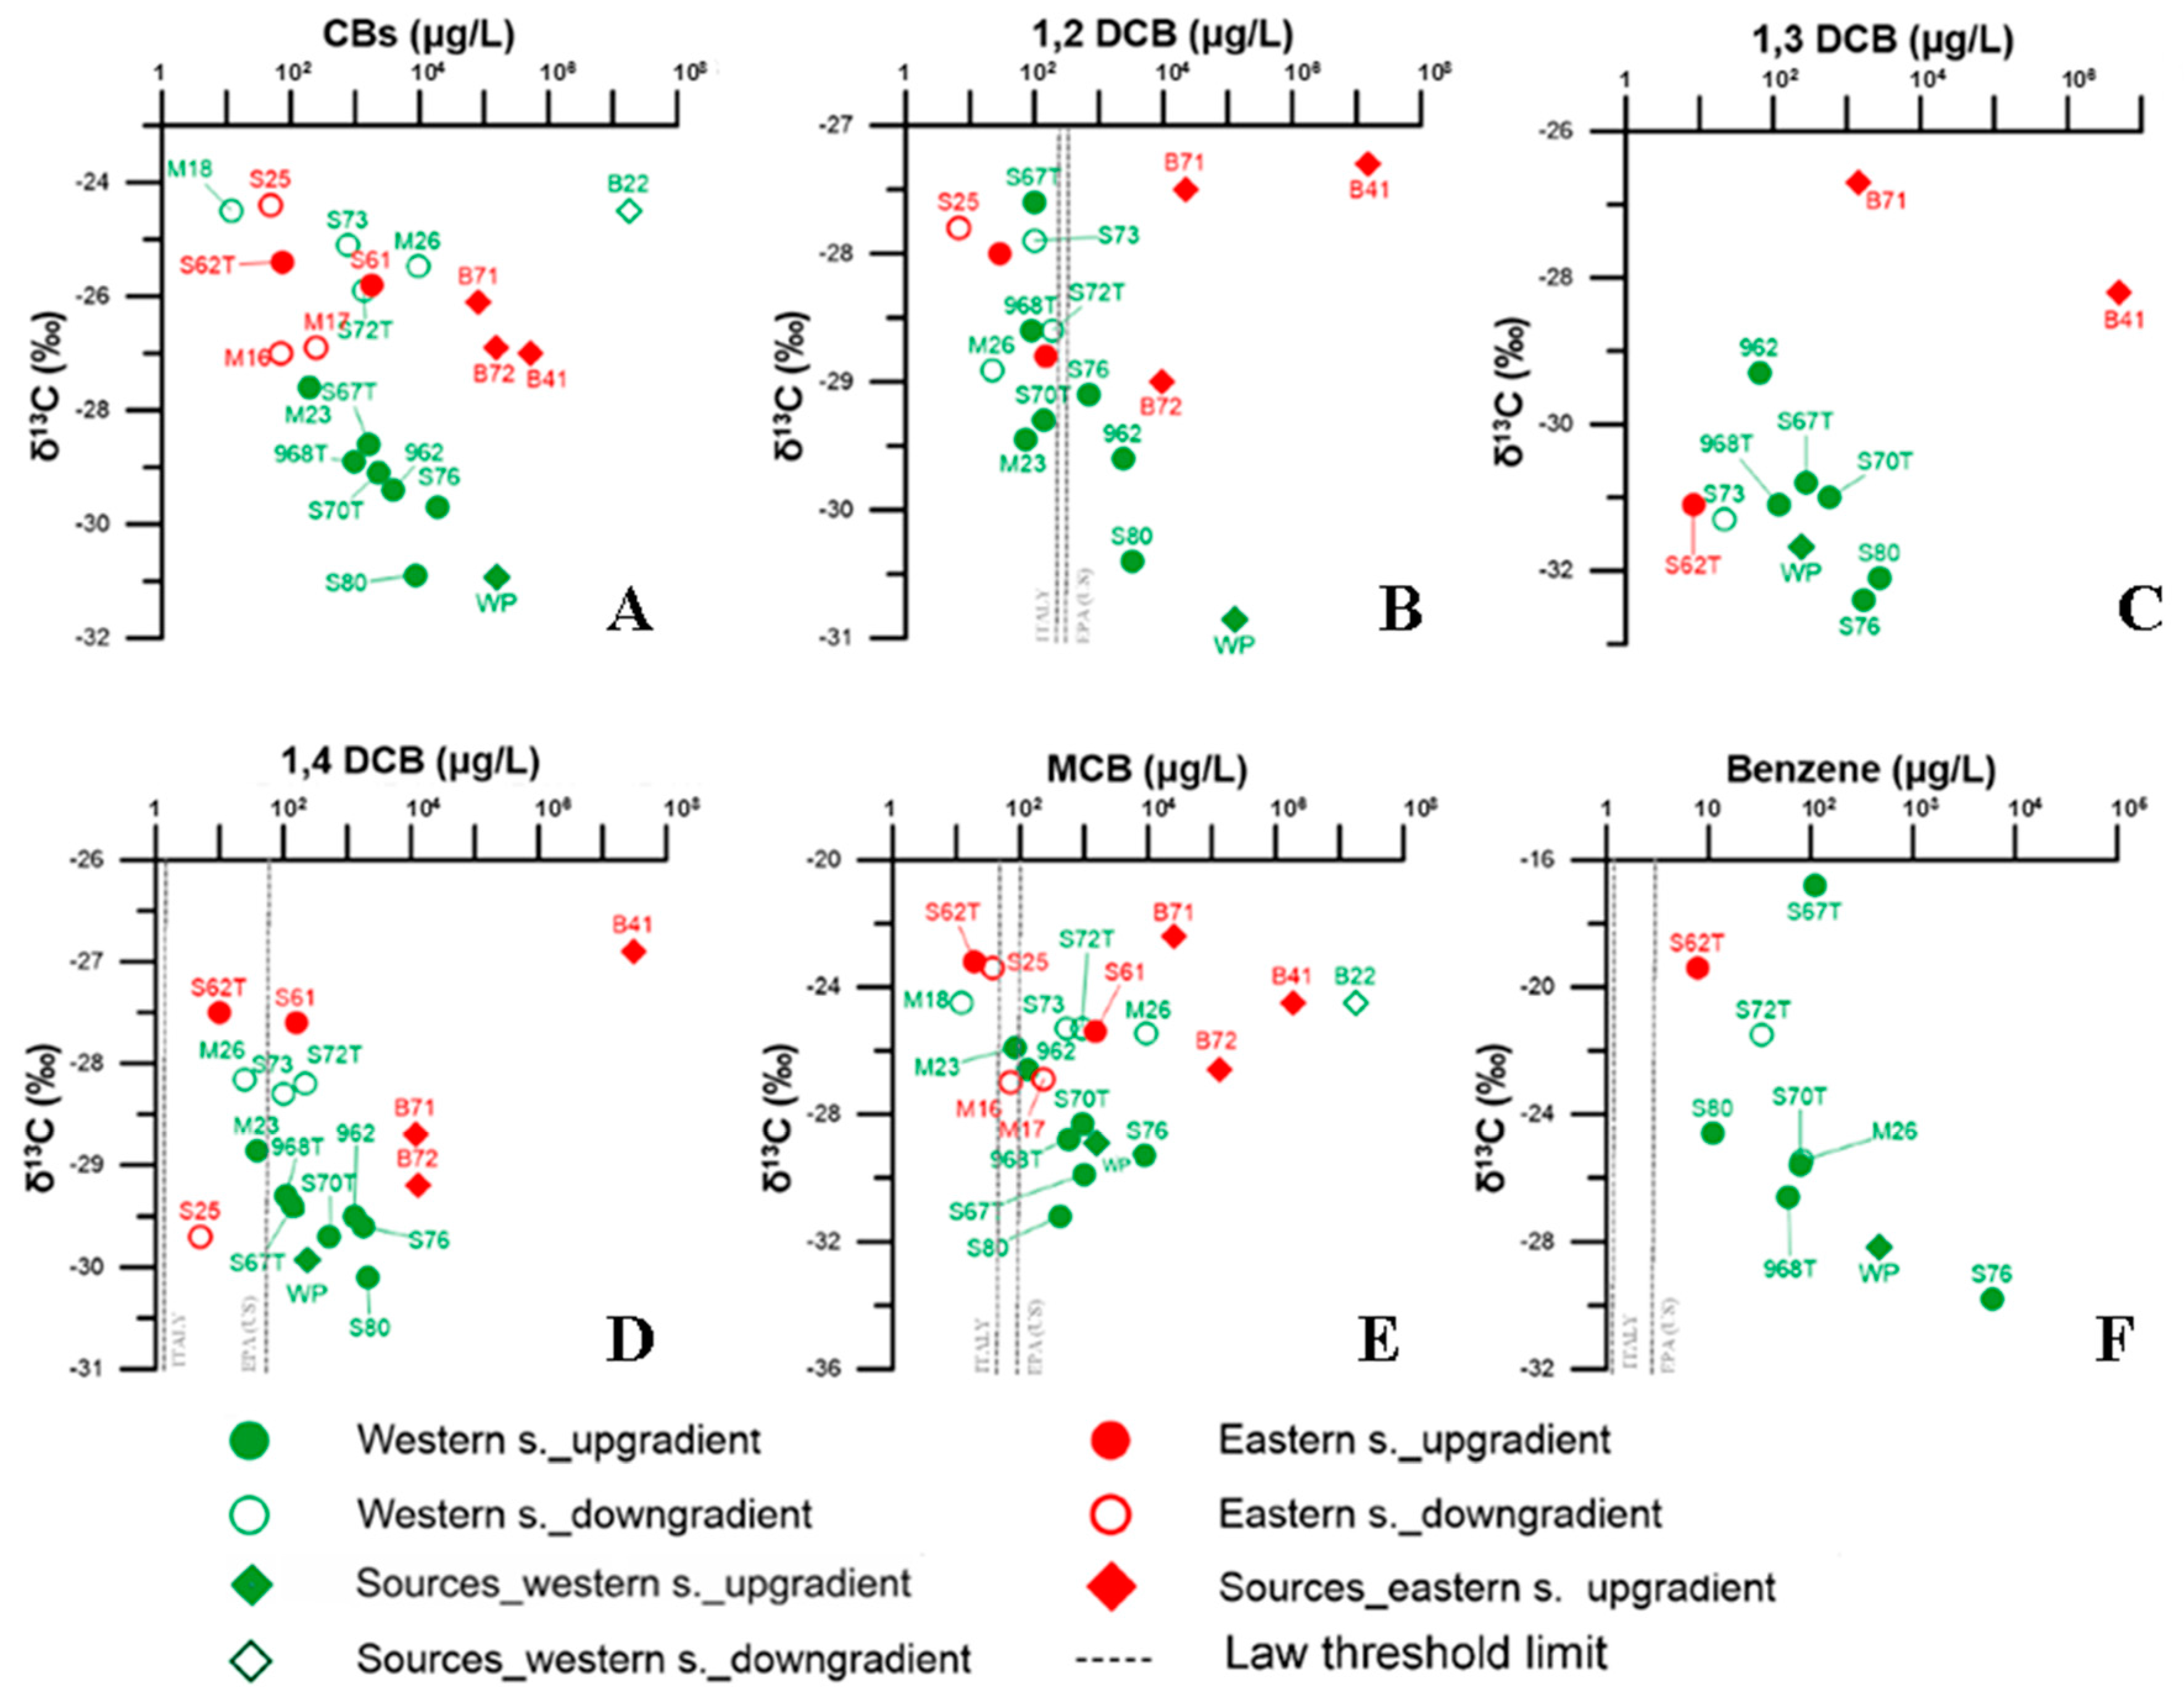
The concentration data for almost all compounds detected in the eastern sector were lower than the values observed in the western sector (Figure 2). Upgradient CB concentrations reached values of 74 and 1810 µg L−1 (S62T and S61, respectively), whereas in the downgradient, only minor levels ranged between 49 and 247 µg L−1, measured in S25 and M17, respectively.
Regarding specific compounds, upgradient MCB revealed a higher value of 1500 µg L−1 in S61 and a concentration of 19 µg L−1 in S62T, whereas S25, M16 and M17 showed values ranging between 37 and 230 µg L−1 (Table 1 and Figure 2).
In the upgradient, higher concentrations of 1,2- and 1,4-DCB were measured in S61 (150 and 160 µg L−1, respectively) in relation to the lower values detected in S62T (29 and 10 µg L−1, respectively), which also contained 8 µg L−1 of 1,3-DCB. Downgradient data for S25 and M17 wells showed 7 and 9 µg L−1 of 1,2-DCB and 5 and 7 µg L−1 of 1,4-DCB, respectively (Table 1 and Figure 2).
Benzene was present in the upgradient with a concentration of 8 µg L−1 for S62T, while only 1 µg L−1 was measured in the downgradient at M17. Lastly, CTs and toluene were absent in this sector (Table 1 and Figure 2).
Three soils samples were collected in the upgradient within the eastern sector (Figure 2). Concentrations of CBs ranged between 52803000 µg kg−1 (B41) and 81000 µg kg−1 (B71). The B41 data showed a dominance of 1,4-DCB (30843000 µg kg−1) over 1,2- and 1,3-DCB (15089 and 4993 µg kg−1, respectively) whereas lower concentrations characterized the soil at B71 and B72 (Table 1). A consistent concentration of 20200 µg kg−1 in 1,2,3-TCB was detected at the B71 location. No benzene or CTs were present in this sector (Table 1 and Figure 2).

3.2. CSIA Results

3.2.1. The Western Sector

Figure 2 and Figure 3A clearly show that in the upgradient, δ13Csum was characterized by depleted values ranging from −30.9‰ to −27.6‰ (for S80 and M23, respectively), while the downgradient wells presented more enriched values (e.g., −24.5‰ in M18). Accordingly, MCB upgradient δ13C values varied between −31.2‰ and −25.9‰ (S80 and M23, respectively), and enriched values characterized MCB in the downgradient groundwater (−25.5‰ for M26; −24.5‰ for M18). Additionally, in the case of 1,2-DCB, data from the upgradient area showed a depleted δ13C value of about −30.4‰ (S80), which became more enriched along the groundwater flowpath toward the HB (−27.6‰; S67T). Enriched 1,2-DCB isotopic signals ranging between −28.9‰ (M26) and −27.9‰ (S73) were detected in the downgradient of the HB. Most of the 1,3-DCB data characterized the upgradient sector; δ13C values ranged from −32.4‰ (S76) to −29.3‰ (962), and in the downgradient, the S73 well had a 1,3-DCB isotopic composition of −31.3‰. The same trend was observed for 1,4-DCB with upgradient δ13C values ranging from −30.1‰ to −28.9‰ (S80 and M23, respectively) and enriched δ13C values in the downgradient of approximately −28‰ (M26, S72T and S73).
A wide variation in the benzene isotopic composition was observed in the upgradient; δ13C values ranged between −29.8‰ in S76 and −16.8‰ in S67T. In the downgradient, benzene signatures varied from −25.5‰ in M26 to −21.5‰ in S72T (Table 1 and Figure 2 and Figure 3F). 1,2,4-TCB was detected only in the upgradient and the δ13C values ranged between −33.3‰ and −30.4‰ (S80 and 968T, respectively; Table 1 and Figure 2). The sample collected from the potential upgradient source, WP, had a δ13Csum value of −30.9‰ (Table 1 and Figure 2 and Figure 3). A similar isotopic composition was measured for δ13C1,2-DCB (−30.9‰), while a value of −31.9‰ characterized δ13C1,3-DCB. Relative enriched δ13C values were observed for 1,4-DCB (−29.9‰), MCB and benzene (−28.8‰ and −28.0‰, respectively). The soil sample collected within the western sector in the downgradient of the HB (B22) had a δ13Csum signature of −24.5‰, likely representing the isotopic composition for MCB (Table 1 and Figure 2 and Figure 3).

3.2.2. The Eastern Sector

The little data available for the eastern sector generally showed more enriched δ13Csum values compared to that of the western area: in the upgradient, δ13Csum values were −25.8‰ and −25.4‰ (S61 and S62T), and the downgradient data ranged between −27.0‰ and −24.4‰ (M16 and S25, respectively; Table 1 and Figure 2 and Figure 3A).
The S61 and S62T wells, located in the upgradient, showed consistent differences in the δ13CMCB isotopic composition (−25.4‰ and −23.2‰, respectively), whereas similar signatures were observed for δ13C1,2-DCB (−28.8‰ and −28.0‰) and δ13C1,4-DCB (−27.6‰ and −27.5‰). The δ13C1,3-DCB and δ13Cbenzene data collected at only one well (S62T) had values of −31.1‰ and −19.4‰, respectively (Table 1 and Figure 2). In the downgradient, the CBs detected were representative of only MCB; δ13CMCB values ranged between −27.0‰ and −23.4‰ (M16 and S25, respectively). In well S25, 1,2- and 1,4-DCB were also present with values of −27.8‰ and −29.7‰, respectively (Table 1 and Figure 2 and Figure 3).
The three soil samples collected showed only minor variations in δ13Csum, ranging from −27.0‰ (B41) to −26.1‰ (B71). Individual compounds covered a wide isotope range in δ13CMCB data (−26.6‰ to −22.4‰ at B72 and B71, respectively). B41 and B71 had δ13C1,2-DCB values of −27.3‰ and −27.5‰, whereas a depleted signal of −29.0‰ was measured in B72. A wider range was observed for δ13C1,4-DCB, for which an isotopic signal of −26.9‰ was measured in B41, while depleted values were measured for B71 and B72 (−28.7‰ and −29.2‰). δ13C1,3-DCB data showed a value of −28.2‰ for B41 and of −26.7‰ for B71, while δ13C1,2,4-TCB data was available only for B71, with a signature of −29.6‰ (Table 1 and Figure 2 and Figure 3).

4. Discussion

1,4- and 1,2-DCB, MCB and benzene concentrations were consistently above the MCLs in most upgradient wells in both the western and eastern sectors (Figure 3); only 1,2,4-TCB remained below the MCL. 1,3-DCB also showed very high concentrations, although no MCL was officially established. In the downgradient of the HB, concentrations were 1 to 2 orders of magnitude lower than those in the upgradient for all target compounds, with concentrations below the MCLs at most monitoring wells. Although the HB seemed to reduce and contain the spreading of the contaminants, concentrations in a few wells, such as S72T for 1,4-DCB, MCB and benzene, and M16 and M26 for MCB, were still above the MCLs. To understand if these high concentrations were related to the upgradient plumes (i.e., related to a HB malfunctioning) or from other sources located in the downgradient area, a SA approach is presented using the molar fraction and δ13Csum data. In addition, δ13C data for each specific compound detected have been used to assess potential biodegradation processes at the site.

4.1. Source Apportionment

Examination of the molar fraction data from both sectors indicated a trend along the groundwater flowpath, where an increase in MCB was coupled with a decrease in DCBs (Figure 2). Therefore, a similar retardation was presumed for MCB and DCBs (almost identical adsorption coefficients [29]) and no significant effect on the molar fraction distribution was expected. Because of transport processes, a similar trend could also be related to potential anaerobic biodegradation in the upgradient. To overcome the high degree of uncertainty when using the molar fraction for SA purposes, an analysis was conducted on the basis of δ13Csum. As several contaminants were detected at the site and potential biodegradation can be hypothesized from the molar fraction distribution (Figure 2), the approach presented made use of the isotope balance δ13Csum rather than considering the isotopic signature of specific compounds (Table 1) [13,30]. Yet, if contaminants undergo a preferential transport along the plumes and/or when biodegradation processes are taking place, the δ13Csum interpretation is not an easy task [31]. However, assuming that the carbon pool is conservative during anaerobic biodegradation (supposing DCBs → MCB → benzene) [32,33] and that aerobic processes are not inducing significant fractionations, particularly for CBs [23,24,25], δ13Csum values should retain their signature along the flowpath, regardless of the occurrence of degradation. Eventually, with further degradation and mineralization of benzene to CO2, δ13Csum could show an enrichment along the plume [32,33]. On the basis of this, if significant deviations from the δ13Csum initial composition are observed, this may indicate different sources and/or a mixture of contaminants derived from distinct plumes, particularly if depletion occurs along the plumes.
In the upgradient, δ13Csum values show a clear distinction between the western and eastern sectors, with average values of around −29.4‰ and −25.6‰, respectively (and average concentrations of 5259 and 942 µg L−1, respectively), confirming that contamination has different origins; this distinction is confirmed by the fact that CTs were detected only in the western sector.
When considering the western sector and following the groundwater flow, S73 and S72T located in the downgradient revealed isotopic values (δ13Csum) that were approximately 3‰ more enriched than in the upgradient at S67T and 968T, despite that all samples were characterized by similar total CB concentrations (on average 1185 µg L−1; Table 1 and Figure 3A). Accordingly, the downgradient M26 was enriched compared to the upgradient S80 and S70T, which contained similar or higher total CB concentrations than the respective upgradient wells (9539 µg L−1 for M26, 8697 µg L−1 for S80 and 2309 µg L−1 for S70T). The enriched signatures measured in the downgradient could not be explained by degradation or transport processes (for which a change in total concentrations is expected), while they were likely indicative of an independent plume contributing to these wells and that was not related to the upgradient wells (Table 1 and Figure 3A). Lastly, a large enrichment (−24.5‰) coupled with a significant reduction in the CB concentration (12 µg L−1) was observed at M18 when compared to the respective upgradient wells; in this case, it was not possible to infer a clear distinction between the effects of potential biodegradation processes and contaminants originating from a different plume (Table 1 and Figure 3A).
The distribution of contaminants in the eastern sector lacked a clear trend for δ13Csum along the flowpath, thereby indicating the existence of different residual sources in this area (Figure 2). In the downgradient, M16 and M17 showed much more depleted δ13Csum values in comparison to the upgradient S61 and S62T, thus eliminating any possible correlation between the plumes detected in the upgradient and downgradient of the HB (Table 1 and Figure 3A).
In order to address a potential source for the detected plumes, a comparison of the compounds’ isotopic signatures measured among the wells, in those of WP (processing water) and those measured within the soils, was conducted. For the western sector, δ13Csum compositions for the upgradient wells were consistent with the isotopic signals characterizing WP, suggesting a potential correlation among this source and dissolved contaminants (Table 1 and Figure 3A). This mainstay was then confirmed by the high CT concentration found in WP, which was consistent with that detected in the nearby groundwater (Table 1). The same assumption could be made for the downgradient, where the soil at B22 was characterized by an enriched value of −24.5‰, which was in the same range as the δ13Csum values measured in the groundwater (Table 1 and Figure 3A).
In the eastern sector, the upgradient wells S61 and S62T showed similar δ13Csum values with respect to the soil isotopic composition measured in B71, indicating that here, dissolved contaminants were related to the impacted soil, most likely by the industrial activity prior to the 1980s (Table 1 and Figure 3A).
Indeed, the current production system seems to make use of more isotopically depleted compounds compared to past production at the original facility. Additionally, the presence of other contaminants, such as CTs in the western sector, indicate changes in the production process over time.

4.2. Biodegradation

As previously mentioned, DCB reduction and MCB molar fractions increased along the flowpath, indicating possible biodegradation processes, particularly in the upgradient of the HB. Overall, the groundwater geochemistry data indicated potential Fe- and Mn-reducing conditions, particularly in the upgradient of the HB. Several authors suggest Fe-reducing conditions as suitable for CBs reduction [34]. Dermietzel and Vieth [34] documented complete degradation for 1,4-DCB but only partial degradation for 1,2- and 1,3-DCB with Fe (III) species serving as electron acceptors, whereas Stelzer at al. [28] demonstrated partial MCB degradation under ferric iron-reducing conditions. The occurrence of biodegradation processes was also supported by slight enrichments observed in δ13Csum along the flowpath.
Because of the complexity of the site, biodegradation was inferred only in the upgradient in the western sector, where most of the wells with significant CB concentrations are located.
A decrease in the 1,2,4-TCB concentration was related to an enrichment in δ13C1,2,4-TCB, suggesting that biodegradation is active in this area (Table 1). Because aerobic degradation does not induce 13C fractionation [23,26], 1,2,4-TCB is most likely degraded by anaerobic transformation. As a result of the relatively low 1,2,4-TCB concentration, its biodegradation with the potential generation of DCBs does not represent an urgent environmental issue at this time.
On the other hand, the high DCB molar fractions were consistent with those measured in several potential sources (e.g., WP; Figure 2), indicating DCBs as the main parent compounds present at the site. On the basis of this, δ13CDCBs can be interpreted by applying the Rayleigh equation (Equation (3)), avoiding complications associated with compounds that are in turn degraded and/or generated as a product from other degradative reactions. Only a few enrichment factors (ε) are available for anaerobic degradation of DCBs. Liang at al. [26] estimated, on the laboratory scale, ε values of −0.8‰, −5.4‰ and −6.3‰ for 1,2-, 1,3- and 1,4-DCB, respectively. The scarce information from literature allows for a more qualitative estimation of the extent of biodegradation, leading to broader quantitative estimates when additional enrichment factors are available. An additional limitation in the estimate is the lack of information about DCBs’ ε values for aerobic degradation. Several studies have shown no significant 13C fractionation for TCBs or MCB under aerobic conditions, and it is likely that DCBs would behave similarly, thus excluding 13C fractionation for aerobic degradation pathways (expected to occur via dioxygenase, which would not induce significant 13C fractionation).
In Figure 3B–D, good correlations between δ13CDCBs versus DCB concentrations are shown. Along two of the plumes, it is estimated that 25% of 1,3-DCB was removed by degradation (Figure 3C) in the proximity of the HB (e.g., in S67T and S70T). This was determined by using an ε value of −5.4‰ [26], and −32.4 and −32.1‰ as initial δ13C1,3-DCB values (S76 and S80, respectively). Additionally, a trend of δ13C1,2-DCB versus concentrations of 1,2-DCB yielded a significant Rayleigh correlation for 1,2-DCB (Figure 3B). A high removal of up to 95% was estimated in the HB vicinity (S70T) by using an ε value of −0.8‰ [26] and −30.9‰ as the initial δ13C1,2-DCB value (WP) along the western plume. In addition, a 75% removal was estimated for the other plume between S76, S67T and 968T. A lower degradation of 1,4-DCB occurs (e.g., M23), as indicated by the smaller enrichments [26].
The overall δ13C enrichment was most likely indicative of anaerobic degradation of DCBs (Figure 3B–D). As such, a significant generation of MCB as a degradation product was expected, further complicating the interpretation of δ13C data. As a consequence, δ13CMCB versus concentration data do not follow a definite Rayleigh trend, as for the DCBs (Figure 3E). MCB concentrations increased in S70T, S80 and 968T, whereas a depletion was observed in δ13CMCB values in 968T, S76 and S67T (Table 1 and Figure 3E). This behavior was a direct indication that along the groundwater flow, MCB represents a reaction by-product, particularly where DCB biodegradation processes take place, and thus confirming the anaerobic nature of DCBs degradation. Although a reactive transport model is needed for a conclusive δ13CMCB data interpretation, some further reasoning can be inferred. An enriched δ13CMCB value of −28.3‰ compared to δ13CDCBs values ranging from −29.3‰ to −31.0‰ leads to hypothesizing further anaerobic MCB degradation to benzene in the vicinity of S70T [25]. On the contrary, where δ13CMCB values remained depleted compared to δ13CDCBs values (S80 and S67T), local anaerobic biodegradation of MCB is not likely to be occurring. This evidence is reinforced by benzene concentration and δ13Cbenzene data (Table 1 and Figure 3F). Benzene was also detected within the potential source (WP), masking the possibility to discern benzene derived by MCB anaerobic degradation from the consideration of it as an initial contaminant. Moreover, it should be considered that benzene can be mineralized (to CO2), hence clouding the understanding of which degradation process is dominant at the site. Data from wells S80 to S70T showed a trend towards an increase in the benzene concentration coupled with a depletion in δ13Cbenzene, confirming that benzene is generated as a consequence of anaerobic MCB biodegradation. On the contrary, little evidence supports the occurrence of benzene degradation. Degradation was observed in S76 and S67T, where a decrease in the benzene concentration was coupled with an overall enrichment trend for δ13Cbenzene (Table 1 and Figure 3F). Unfortunately, no insights into potential MCB aerobic biodegradation processes can be made on the basis of δ13C, as no fractionation is expected to occur under these conditions. Furthermore, it is not possible to distinguish between aerobic or anaerobic biodegradation of benzene solely on the basis of on δ13C, as similar ε values of approximately −1.5‰ and 3.5‰ have been estimated under both aerobic and anaerobic biodegradation conditions [13].
In general, δ13Csum values showed a slight 13C enrichment along the flow path, suggesting that overall, the CBs are being degraded and partially removed. δ13CDCBs indicate biodegradation, most likely anaerobic, with 1,2-DCB preferentially degraded over 1,3- and 1,4-DCB. MCB was found in the aquifer mainly as product of DCB biodegradation, and there is evidence of further anaerobic degradation to benzene in some areas, for example in the vicinity of S70T, which in turn, seemed to be degraded in the shallow part of aquifer. Lastly, benzene degradation could potentially explain the overall δ13Csum enrichment along the flow path, particularly from S80 to S70T (Figure 3).
Fe- and Mn-reducing conditions at the field site are favorable to anaerobic biodegradation of DCBs; the 1,4-DCB preferential degradation was in line with findings from [34]. In addition, evidence of partial MCB degradation was observed where the reducing conditions were more pronounced (S70T). The results from this study confirm that Fe- and Mn-reducing conditions agree with the preferential occurrence of anaerobic CB degradation, particularly for TCB and DCB (particularly 1,4-DCB), without loss of the less amenable MCB.

5. Conclusions

The proposed approach using CSIA supported by hydrogeological, concentration and redox data proved to be an effective tool for detailed site characterization. The isotopic investigation revealed consistent differences in the signature of contaminants detected in the western and eastern sectors, suggesting variations in factory production processes over time.
In summary, CSIA was applied successfully for SA, and more specifically, the use of the concentration-weighted average δ13Csum was crucial in the understanding of how the plumes in the downgradient of the HB are not connected with the upgradient contamination. Thus, this indicates that the source of the downgradient plume is associated to contaminated soils, most likely as a result of past chemical-waste disposal activities. Furthermore, CSIA has highlighted the importance of biodegradation processes for contaminant containment in the upgradient of the HB.
With regard to specific compounds, the δ13C results for 1,2,4-TCB, and DCBs are indicative of biodegradation, most likely anaerobic, with 1,2-DCB preferentially degraded over 1,3- and 1,4-DCB. MCB was found in the aquifer mainly as a by-product of DCB biodegradation. In addition, isotope patterns provided evidence that MCB undergoes anaerobic degradation to benzene, and benzene degradation has also been shown to occur.
The present study demonstrates the utility of applying CSIA for the characterization of contaminated sites impacted by CBs. Furthermore, the study demonstrates the need for further scientific efforts to reach a comprehensive understanding of the degradation pathways of CB and its isotopic patterns, which is an area that is still sparsely documented.

Acknowledgments

We would like to thank the Politecnico di Milano for the Postdoctoral International Fellowship (PIF) to Massimo Marchesi. Thanks are also due to Umberto Traldi, Thermo Fisher Scientific, for his kind help and assistance with isotope analysis. We would like to thank Richard Elgood from the University of Waterloo for revising the English grammar.

Author Contributions

L.A. and P.T. conceived and designed the site investigation; M.M. performed the CSIA analysis; R.A. contributed by supervising during the study implementation and by assisting with data interpretation; L.A. and M.M. wrote the paper.

Conflicts of Interest

The authors declare no conflict of interest. The founding sponsors had no role in the design of the study; in the collection, analyses, or interpretation of data; in the writing of the manuscript; or in the decision to publish the results.

References

  1. Panagos, P.M.; Liedekerke, V.; Yigini, Y.; Montanarella, L. Contaminated sites in Europe: Review of the current situation based on data collected through a European network. J. Environ. Public Health 2013, 2013. [Google Scholar] [CrossRef] [PubMed]
  2. Lawrence, S.J. Description, Properties, and Degradation of Selected Volatile Organic Compounds Detected in Ground Water—A Review of Selected Literature; Open-File Report 2006-1338; U.S. Geological Survey: Atlanta, GA, USA, 2006.
  3. Field, J.A.; Sierra-Alvarez, R. Microbial degradation of chlorinated benzenes. Biodegradation 2008, 19, 463–480. [Google Scholar] [CrossRef] [PubMed]
  4. Alberti, L.; Lombi, S.; Zanini, A. Identifying sources of chlorinated aliphatic hydrocarbons in a residential area in Italy using the integral pumping test method. Hydrogeol. J. 2011, 19, 1253–1267. [Google Scholar] [CrossRef]
  5. Filippini, M.; Amorosi, A.; Campo, B.; Herrero-Martìn, S.; Nijenhuis, I.; Parker, B.; Gargini, A. Origin of VC-only plumes from naturally enhanced dechlorination in a peat-rich hydrogeologic setting. J. Contam. Hydrol. 2016, 192, 129–139. [Google Scholar] [CrossRef] [PubMed]
  6. Nijenhuis, I.; Schmidt, M.; Pellegatti, E.; Paramatti, E.; Richnow, H.H.; Gargini, A. A stable isotope approach for source apportionment of chlorinated ethene plumes at a complex multi-contamination events urban site. J. Contam. Hydrol. 2013, 153, 92–105. [Google Scholar] [CrossRef] [PubMed]
  7. Petitta, M.; Pacioni, E.; Sbarbati, C.; Corvatta, G.; Fanelli, M.; Aravena, R. Hydrodynamic and isotopic characterization of a site contaminated by chlorinated solvents: Chienti River Valley, Central Italy. Appl. Geochem. 2013, 32, 164–174. [Google Scholar] [CrossRef]
  8. Schmidt, T.C.; Jochmann, M.A. Origin and fate of organic compounds in water: Characterization by compound-specific stable isotope analysis. Annu. Rev. Anal. Chem. 2012, 5, 133–155. [Google Scholar] [CrossRef] [PubMed]
  9. Shaouakar-Stash, O.; Frape, S.K.; Aravena, R.; Gargini, A.; Pasini, M.; Drimmie, R.J. Analysis of compound-specific chlorine stable isotopes of vinyl chloride by continuous flow–isotope ratio mass spectrometry (FC–IRMS). Environ. Forensics 2009, 10, 299–306. [Google Scholar] [CrossRef]
  10. Stroo, H.F.; Ward, C.F. In Situ Remediation of Chlorinated Solvent Plumes; Springer: New York, NY, USA, 2010. [Google Scholar]
  11. Alberti, L.; Alimi, H.; Ertel, T.; Trefiletti, P.; Pietrini, I. Fingerprinting and groundwater model application to evaluate hydraulic barrier efficiency (Italy). Environ. Forensics 2015, 16, 217–230. [Google Scholar] [CrossRef]
  12. Colombo, L.; Cantone, M.; Alberti, L.; Francani, V. Analytical solutions for multiwell hydraulic barrier capture zone defining. Ital. J. Eng. Geol. Environ. 2012, 12, 17–33. [Google Scholar]
  13. Hunkeler, D.; Meckenstock, R.U.; Sherwood-Lollar, B.; Schmidt, T.C.; Wilson, J.T. A Guide for Assessing Biodegradation and Source Identification of Organic Groundwater Contaminants Using Compound Specific Isotope Analysis (CSIA); U.S. Environmental Protection Agency: Washington, DC, USA, 2009.
  14. Lojkasek-Lima, P.; Aravena, R.; Shouakar-Stash, O.; Frape, S.K.; Marchesi, M.; Fiorenza, S.; Vogan, J. Evaluating TCE Abiotic and Biotic Degradation Pathways in a Permeable Reactive Barrier Using Compound Specific Isotope Analysis. Ground Water Monit. R. 2012, 32, 53–62. [Google Scholar] [CrossRef]
  15. Van Breukelen, B.M. Extending the Rayleigh equation to allow competing isotope fractionating pathways to improve quantification of biodegradation. Environ. Sci. Technol. 2007, 41, 4004–4010. [Google Scholar] [CrossRef] [PubMed]
  16. Sherwood Lollar, B.; Slater, G.F.; Sleep, B.; Witt, M.; Klecka, G.M.; Harkness, M.; Spivack, J. Stable carbon isotope evidence for intrinsic bioremediation of tetrachloroethene and trichloroethene at area 6, Dover Air Force Base. Environ. Sci. Technol. 2001, 35, 261–269. [Google Scholar] [CrossRef] [PubMed]
  17. Rügner, H.; Finkel, M.; Kaschl, A.; Bittens, M. Application of monitored natural attenuation in contaminated land management—A review and recommended approach for Europe. Environ. Sci. Policy 2006, 9, 568–576. [Google Scholar] [CrossRef]
  18. Illman, W.A.; Alvarez, P.J. Performance assessment of bioremediation and natural attenuation. Crit. Rev. Environ. Sci. Technol. 2009, 39, 209–270. [Google Scholar] [CrossRef]
  19. Malcolm, H.; Howe, P.; Dobson, S. Chlorobenzenes Other than Hexachlorobenzene: Environmental Aspects; World Health Organization: Geneva, Switzerland, 2004; Available online: http://www.who.int/iris/handle/10665/42905 (accessed on 15 August 2017).
  20. Barber, J.L.; Sweetman, A.J.; Van Wijk, D.; Jones, K.C. Hexachlorobenzene in the global environment: Emissions, levels, distribution, trends and processes. Sci. Total Environ. 2005, 349, 1–44. [Google Scholar] [CrossRef] [PubMed]
  21. Sims, J.L.; Suflita, J.M.; Russell, H.H. Reductive Dehalogenation of Organic Contaminants in Soils and Ground Water; U.S. Environmental Protection Agency: Washington, DC, USA, 1991.
  22. Liang, X.; Devine, C.E.; Nelson, J.; Sherwood Lollar, B.; Zinder, S.; Edwards, E.A. Anaerobic conversion of chlorobenzene and benzene to CH4 and CO2 in bioaugmented microcosms. Environ. Sci. Technol. 2013, 47, 2378–2385. [Google Scholar] [CrossRef] [PubMed]
  23. Griebler, C.; Adrian, L.; Meckenstock, R.U.; Richnow, H.H. Stable carbon isotope fractionation during aerobic and anaerobic transformation of trichlorobenzene. FEMS Microbiol. Ecol. 2004, 48, 313–321. [Google Scholar] [CrossRef] [PubMed]
  24. Kaschl, A.; Vogt, C.; Uhlig, S.; Nijenhuis, I.; Weiss, H.; Kästner, M.; Richnow, H.H. Isotopic fractionation indicates anaerobic monochlorobenzene biodegradation. Environ. Toxicol. Chem. 2005, 24, 1315–1324. [Google Scholar] [CrossRef] [PubMed]
  25. Liang, X.; Howlett, M.R.; Nelson, J.L.; Grant, G.; Dworatzek, S.; Lacrampe-Couloume, G.; Zinder, S.H.; Edwards, E.A.; Sherwood Lollar, B. Pathway-dependent isotope fractionation during aerobic and anaerobic degradation of monochlorobenzene and 1,2,4-trichlorobenzene. Environ. Sci. Technol. 2011, 45, 8321–8327. [Google Scholar] [CrossRef] [PubMed]
  26. Liang, X.; Mundle, S.O.; Nelson, J.L.; Passeport, E.; Chan, C.C.; Lacrampe-Couloume, G.; Zinder, S.H.; Sherwood Lollar, B. Distinct carbon isotope fractionation during anaerobic degradation of dichlorobenzene isomers. Environ. Sci. Technol. 2014, 48, 4844–4851. [Google Scholar] [CrossRef] [PubMed]
  27. Braeckevelt, M.; Rokadia, H.; Imfeld, G.; Stelzer, N.; Paschke, H.; Kuschk, P.; Weber, S. Assessment of in situ biodegradation of monochlorobenzene in contaminated groundwater treated in a constructed wetland. Environ. Pollut. 2007, 148, 428–437. [Google Scholar] [CrossRef] [PubMed]
  28. Stelzer, N.; Imfeld, G.; Thullner, M.; Lehmann, J.; Poser, A.; Richnow, H.; Nijenhuis, I. Integrative approach to delineate natural attenuation of chlorinated benzenes in anoxic aquifers. Environ. Pollut. 2009, 157, 1800–1806. [Google Scholar] [CrossRef] [PubMed]
  29. Thullner, M.; Schäfer, W. Modeling of a field experiment on bioremediation of chlorobenzenes in groundwater. Bioremediat. J. 1999, 3, 247–267. [Google Scholar] [CrossRef]
  30. Palau, J.; Marchesi, M.; Chambon, J.C.; Aravena, R.; Canals, A.; Binning, P.J.; Soler, A. Multi-isotope (carbon and chlorine) analysis for fingerprinting and site characterization at a fractured bedrock aquifer contaminated by chlorinated ethenes. Sci. Total Environ. 2014, 475, 61–70. [Google Scholar] [CrossRef] [PubMed]
  31. Van Breukelen, B.M.; Hunkeler, D.; Volkering, F. Quantification of sequential chlorinated ethene degradation by use of a reactive transport model incorporating isotope fractionation. Environ. Sci. Technol. 2005, 39, 4189–4197. [Google Scholar] [CrossRef] [PubMed]
  32. Bloom, Y.; Aravena, R.; Hunkeler, D.; Edwards, E.; Frape, S.K. Carbon isotope fractionation during microbial dechlorination of trichloroethene, cis-1, 2-dichloroethene, and vinyl chloride: Implications for assessment of natural attenuation. Environ. Sci. Technol. 2000, 34, 2768–2772. [Google Scholar] [CrossRef]
  33. Hunkeler, D.; Chollet, N.; Pittet, X.; Aravena, R.; Cherry, J.A.; Parker, B.L. Effect of source variability and transport processes on carbon isotope ratios of TCE and PCE in two sandy aquifers. J. Contam. Hydrol. 2004, 74, 265–282. [Google Scholar] [CrossRef] [PubMed]
  34. Dermietzel, J.; Vieth, A. Chloroaromatics in groundwater: Chances of bioremediation. Environ. Geol. 2002, 41, 683–689. [Google Scholar]
Figure 1. Groundwater flow and monitoring network in the shallow part of the aquifer (<30 m); concentrations refer to the sum of chlorobenzenes. Pink contours show the three narrow plumes located in the upgradient of the hydraulic barrier.
Water 09 00872 g001
Figure 2. Map of locations used for sampling showing total chlorobenzene concentrations (µg L−1), δ13Csum (‰) and molar fraction distributions along the groundwater flow system.
Water 09 00872 g002
Figure 3. Scatterplots of concentration versus δ13C of total chlorobenzenes (CBs) (A), 1,2-dichlorobenzene (DCB) (B), 1,3-DCB (C), 1,4-DCB (D), MCB (E) and benzene (F). Green and red circles refer to wells located in the western and eastern sectors, respectively; green and red rhombuses refer to the sources, soil samples (B-) and processing waters (WP). Concentrations are expressed in µg L−1 and µg kg−1 for groundwater and soil samples, respectively. Empty and filled symbols refer to the downgradient and upgradient of the hydraulic barrier, respectively. Data are shown in Table 1. See Figure 2 for sample locations.
Water 09 00872 g003
Table 1. Data summary. Redox species (mg L−1) and chlorobenzenes (CBs) and chlorinated toluenes (CTs) concentrations (µg L−1 and µg kg−1 for groundwater and soil samples, respectively); isotope data (‰): δ13C and δ13Csum. See Figure 2 for sample locations.
DONO2SO42−FetotFe2+Mn2+MCB1,2-DCB1,3-DCB1,4-DCB1,2,4-TCBBenzeneCBsCTsMCB1,2-DCB1,3-DCB1,4-DCB1,2,4-TCBBenzeneδ13Csum
IDmg/Lμg/L for S- M- W- and μg/Kg for B-δ13C VPDB (‰)
WESTERN SECTORUPGRADIENTWP< 0.11.2138.33.2b.d.l.1588150465260255b.d.l.46615303421940−28.8−30.9−31.9−29.9n.m.−28.0−30.9
S76< 0.10.02623.022.0b.d.l.88007001700180012060001912011145−29.3−29.1−32.4−29.6−32.1−29.8−29.7
S80< 0.10.0210.30.1b.d.l.420330028002100661186977805−31.2−30.4−32.1−30.1−33.3−24.6−30.9
9620.30.1345.01.90.31302400661300b.d.l.b.d.l.3896189−26.6−29.6−29.3−29.5n.m.n.m.−29.4
S70T0.80.32910.04.90.4940140580570b.d.l.7923094969−28.3−29.3−31.0−29.7n.m.25.6−29.1
S67T2.20.37207.6b.d.l.0.81000100280140b.d.l.1101630261−29.9−27.6−30.8−29.4n.m.−16.8−28.6
968T0.30.11960200.0190.00.8570901201101960969310−28.8−28.6−31.1−29.3−30.4−26.6−28.9
M23n.m.n.m.n.m.n.m.n.m.n.m.8373b.d.l.39b.d.l.b.d.l.195b.d.l.−25.9−29.5n.m.−28.9n.m.n.m.−27.6
DOWNGRADIENTS72T< 0.10.04500.10.10.7930190b.d.l.220b.d.l.331373b.d.l.−25.3−28.6n.m.−28.2n.m.−21.5−25.9
S730.34.01030.10.10.75301012210118b.d.l.771b.d.l.−25.3−27.9−31.3−28.3n.m.n.m.−25.1
M18< 0.10.0420.00.0b.d.l.12b.d.l.b.d.l.b.d.l.b.d.l.b.d.l.12b.d.l.−24.5n.m.n.m.n.m.n.m.n.m.−24.5
M26n.m.n.m.n.m.n.m.n.m.n.m.941022b.d.l.25b.d.l.829539b.d.l.−25.5−28.9n.m.−28.2n.m.−25.5−25.5
B22______18009000b.d.l.b.d.l.b.d.l.b.d.l.b.d.l.18009000b.d.l.−24.5n.m.n.m.n.m.n.m.n.m.−24.5
EASTERN SECTORUPGRADIENTB41______187800015089000499300030843000b.d.l.b.d.l.52803000b.d.l.−24.5−27.3−28.2−26.9n.m.n.m.−27.0
B72______1320009500b.d.l.12900b.d.l.b.d.l.154400b.d.l.−26.6−29.0n.m.−29.2n.m.n.m.−26.9
B71______255002230014401190020200b.d.l.81340b.d.l.−22.4−27.5−26.7−28.7−29.6n.m.−26.1
S610.60.35609.07.80.51500150b.d.l.160b.d.l.b.d.l.1810b.d.l.−25.4−28.8n.m.−27.6n.m.n.m.−25.8
S62T0.40.356013.512.00.61929810b.d.l.874b.d.l.−23.2−28.0−31.1−27.5n.m.−19.4−25.4
DOWNGRADIENTM16n.m.n.m.n.m.n.m.n.m.n.m.70b.d.l.b.d.l.b.d.l.b.d.l.b.d.l.70b.d.l.−27.0n.m.n.m.n.m.n.m.n.m.−27.0
S250.1b.d.l.290.10.10.1377b.d.l.5b.d.l.b.d.l.49b.d.l.−23.4−27.8n.m.−29.7n.m.n.m.−24.4
M17n.m.n.m.n.m.n.m.n.m.n.m.2309b.d.l.7b.d.l.1247b.d.l.−26.9n.m.n.m.n.m.n.m.n.m.−26.9
Note: Notation is expressed in δ‰ relative to the international standard: Vienna Pee Dee Belemnite (VPDB) for δ13C (n.m.: not measured; b.d.l.: below detection limit—for CTs, b.d.l. refers to each single compound, Dissolved Oxygen (DO), NO2 (Nitrite), SO42− (Sulphate), Fetot (Total Iron), Fe2+ (Iron II), Mn2+ (Manganese II), Monochlorobenzene (MCB), 1,2-Dichlorobenzene (1,2-DCB), 1,3-Dichlorobenzene (1,3-DCB), 1,4-Dichlorobenzene (1,4-DCB), 1,2,4-Trichlorobenzene (1,2,4-TCB)).

