Abstract
In rapidly growing urban areas in India and the developing world, water demands typically exceed supply. While local governments may implement management programs to reduce demand for freshwater, water savings are dependent on the conservation behaviors of individuals. A household survey is presented here to examine residential water end uses and conservation behaviors in Jaipur, India. The survey explores end uses, engagement in conservation behaviors, and the influence of demographic factors, water sources, beliefs about water, and social pressures on these behaviors are tested. The survey was conducted at 248 households, including 29 households in the slums. Our study finds that while the majority of participants recognize the importance of water conservation, they do not necessarily conserve water themselves. Households report engaging most frequently in water-conservation behaviors that require little effort or financial investment. Multivariate analysis of variance (MANOVA) results and subsequent pairwise comparisons indicate higher incomes, longer water-supply durations, and the belief that droughts are preventable are positively correlated with overall amenability to adoption of water-conservation behaviors and technology. Binomial logistic regression analysis indicates that being in the age group 26–35, having higher income, and giving a neutral response about the responsibility of the government to provide relief during a drought were all predictors of the installation of dual-flush (DF) toilets. Education levels and water awareness were found to have no correlation with conservation behaviors or amenability to conservation technology adoption. Results are applied to examine their possible implications from a demand-management perspective and provide suggestions for further research and policy decisions.
1. Introduction
Over one-third of the world’s population, 2.6 billion people, lives in cities in the developing world. By 2110, this number is projected to rise to 7.8 billion, accounting for 70.9% of the projected global population of 11 billion people [1]. In many of these cities, water-infrastructure systems already cannot provide adequate water supply to meet current demands, which will continue to grow as the urban population increases. Governments in the developing world have historically responded to growing water demands by focusing on large, expensive infrastructure projects to increase supply, such as China’s North–South Water Diversion Project or India’s National River-Linking Project [2], while paying relatively little attention to demand-management strategies. Supply-side management alone is costly and ultimately unsustainable. Infrastructure construction is expensive and often environmentally destructive, and, moreover, exploitable water resources are finite. Thus, a key component of a sustainable water-resource management strategy is a demand-management program. A well-designed demand-management program should be based on information about end uses and consumer behaviors, beliefs, and responses in order to maximize its effectiveness.
Much of the world’s urban population growth in the next century will occur in India, whose urban growth rate is expected to be the fastest in the world, adding a projected 404 million urban residents by 2050 [3]. Fifty-four percent of India’s population is currently water stressed, and that number will increase as the urban population swells [4]. Recognizing this problem, The Government of India recently broadened its National Water Policy to emphasize the necessity of demand management in conjunction with supply management [5]. However, the focus of this policy is largely on efficiency improvements in agriculture. A comprehensive urban water-resource management plan that explores demand management and conservation has not yet been introduced, but will be critical for reducing the strain on India’s water resources as urban centers continue to grow. Price policies, such as block-pricing and increased tariffs, may have a limited impact on water consumption due to limited local governance capacity to enforce such pricing.
Non-price policies (NPPs), which include educational campaigns and rebate programs for water-efficient technology, may reduce residential water demands. The effectiveness of NPPs will be at least partially determined by existing technologies and the underlying drivers of water consumption behavior. Several studies on residential water use in India have been conducted in recent years [6,7,8]. These studies, however, do not explore the motivations behind water consumption and conservation behaviors. Traditionally water-related structures such as wells, ponds, rivers and trees were assigned very high religious and cultural importance, but with the introduction of modern piped-water supply systems, social and cultural behaviors have changed. Changes in social influences and cultural emphasis on environmental behaviors and attitudes in India have rarely been explored [9].
The research presented here was developed to gain insight into residential water use and conservation in India. The city of Jaipur was selected as a case study because it is both severely water stressed and growing rapidly, with an annual growth rate of 5.3%. Its population is expected to increase from 3.1 million in 2011 to 6.5 million by 2025 [10,11]. The manuscript is organized as follows: first, a background of previous end-use and conservation studies is presented; second, the study area and a description of the survey format are detailed; third, the results are explored; fourth, the results are analyzed for correlations with socio-demographic and opinion data; finally, the possible implications of the results for NPPs are explored, and areas for further research are suggested.
2. Background
Household water consumers often behave in complex ways that can have significant consequences for water-supply managers. Understanding the dynamics of water-conservation behaviors and consumption is thus helpful when formulating demand-management policies, as well as when planning and designing water infrastructure. In this manuscript, we define water conservation as the actual reduction of water use, and water-conservation behaviors as those actions that can be undertaken to reduce water consumption, such as installing water-saving appliances or reducing lawn irrigation. Studies exploring the relationships between residential water consumption, water-conservation behaviors, socio-demographic factors, environmental attitudes, and pricing have been widely conducted in industrialized nations, including the United States of America, Canada, New Zealand, Australia, Austria, and Spain [12,13,14,15,16,17,18]. Many of these studies show that wealth and environmental attitudes are both correlated with an increase in indoor water-conservation behaviors. Several household surveys indicate that higher-income respondents are more likely to report conserving water and installing water-efficient appliances than their poorer counterparts [19,20,21]. Although a study conducted by Willis, Stewart, Panuwatwanich, Williams and Hollingsworth reported the opposite—that households that expressed higher concern for the environment and water conservation had lower incomes—the relationship was not statistically significant [22]. Similarly, people who express environmental concerns and values are more likely to report engaging in water-conservation behaviors, including purchasing water-efficient appliances [12,20,23]. Empirical evidence suggests that the relationship between environmental attitudes and conservation behavior is stronger for low-income groups than for high-income groups; that is, environmentally conscientious wealthy households consume more water than their poorer environmentally conscientious counterparts [24].
The installation of water-conservation technology and adoption of water conservation behaviors do not necessarily reduce overall water use. While Fielding et al. found a weak but significant relationship between self-reported water-conservation behavior and a reduction in household water use, other studies indicate that environmental attitudes have no significant effects on actual consumption volumes [13,25,26,27]. Analogously, empirical evidence suggests that the installation of water-efficient appliances does not result in a reduction of water use, and may in some cases increase water demand [27]. These trends may be attributed to two factors: offsetting behavior (e.g., a rebound effect) and lawn irrigation. Campbell, Johnson and Larson posited that consumers who are aware that their appliances save water often engage in offsetting behavior, using these appliances more frequently or for longer durations [28]. This behavior could be attributed to the difficulties inherent in judging one’s own water use; consumers consistently overestimate their water savings and underestimate their water use [29,30]. However, when consumers are visually reminded of their water consumption, they consume less water overall [31].
Outdoor irrigation also contributes to the consumption of water by wealthy families, who have been shown to consume more water than their less wealthy peers [18,25,32]. Overall, indoor water use in the developed world has been decreasing for all income groups over the past two decades; this trend is attributed largely to the introduction of water-efficient appliances, which are more popular among wealthier households [18,33]. The single largest end use for water is lawn irrigation, however, and higher incomes strongly correlate with outdoor water use [33,34]. The notable exception to this rule is for wealthy families in multi-story buildings, who use less water on average than middle-income families who live in single family homes [12].
Education also has an equivocal relationship with water use. Some studies show that those with higher education are more likely to engage in environmentally conscientious behaviors [19,21]. However, other studies indicate that education is not a reliable predictor of water-conservation behaviors [20]. Still others report that higher education levels actually correlate with higher levels of water consumption [26].
A large body of conflicting literature exists on the impacts of water pricing on water consumption. Some studies show that higher water prices correlate with lower water consumption in the developed world [13,28,35,36], particularly those that focus on volumetric water pricing [13,37,38]. In other studies, prices have been found to have little influence on overall water consumption because water demands are largely price inelastic [12,39]. In their review of the literature on residential water demand in the developing world, Nauges and Whittington [40] show that water consumption in the developing world is largely price inelastic. Paying for one’s own water use also corresponds to an increase in water conservation: Millock found that households that are metered and charged individually are more likely to invest in water-saving appliances than those households that pay a flat fee [23].
A contextual understanding of the motivation for water-conservation behavior is useful for designing an effective demand-management policy. While many water-conservation studies have been conducted for developed countries, water-conservation behavior and underlying motivations may be very different between India and the Western world, and different economics factors and cultural emphases may yield a different set of trends in residential water-use behaviors. The general reduction of indoor water demands over the past 20 years that has occurred in industrialized nations, for example, is unlikely to have occurred in urban India.
More likely, the per capita water demand in India is increasing. India’s baseline per capita water demand was significantly lower than that of the West, and has increased as many members of India’s urban population enter the middle class, eschewing pit latrines for water closets and investing in water-intensive appliances such as evaporative coolers, which are used to cool rooms during the hot season [10,41]. Also, the correlation of higher incomes with higher water use may not apply in India. Instead, water-consumption rates may vary only slightly between high-income and middle-income consumers in densely populated Indian cities where many people do not have lawns, and those who do, have only small plots. In addition, while higher water pricing generally correlates with reduced consumption, the impact of water pricing on water use in urban India is uncertain, given the common practice of avoiding utility payments and paying bribes for falsified meter readings [42,43].
Many water-conservation behavior and consumption studies in the Western world examine the impact individual motivations have on behavior. Stern, for example, has developed a value–belief–norm theory to explain the impacts that values, beliefs, and personal norms have on environmental behaviors [44,45]. Intrinsic motivations, such as self-efficacy, or a feeling of being able to positively influence one’s environment, have been shown to increase water-conservation behaviors in an Australian study [27]. The influence of self-efficacy may not play as large a role in consumer behavior in India. Instead, within India’s collectivist culture, familial influences on behavior may play a larger role in water-use behaviors [46]. Social norms have been shown to influence citizens’ water-consumption patterns in a study in Zhangye City, China [47]. This correlation may also exist in India, given the cultural emphasis on community. The survey that is described in this research is designed to test for the influence of engagement in conservation behaviors and installation of water-conserving technologies, general water awareness, amenability to water-conservation technology, self-efficacy, social norms, and anticipated responses to various water-use scenarios on water use.
3. Materials and Methods
3.1. Study Area and Water Supply Description
Jaipur City, the capital and largest city of the state of Rajasthan, has more than tripled in population since 1981, and projections indicate its population will reach 5.4 million by 2021 [10,11]. Climate in this area is semi-arid. Jaipur receives an annual average of 525 mm of rain a year, 88.5% of which falls during the monsoon season [48], defined by the Indian Meteorological Department as 1 June to September 30. On average, Jaipur experiences a drought at least once every five years [49].
The Public Health Engineering Department–Rajasthan (PHED) provides water to most of Jaipur’s citizens. PHED draws water from the Bisalpur Reservoir and from 1897 wells distributed throughout the city [50]. The Bisalpur Reservoir, which became operational in 2009, lies on the Banas River, a seasonal river that often does not flow during the dry season. Previously, Jaipur’s water supply came from Ramgarh Lake, which was created in the 1890s, but dried up in the late 1990s due to mismanagement and excessive upstream diversions [51]. Jaipur relied solely on groundwater to meet its water demands during the interim between 1999 and 2009. According to a government audit, Bisalpur Reservoir has only 40% dependability; that is, only 40% of the designed capacity of the dam (317.2 million m3) can be expected to be continuously available under drought conditions [52]. Consequently, PHED still relies heavily on groundwater to meet Jaipur’s water demands, particularly when monsoon rains are low. Estimates show that the population is currently withdrawing water at 200% of the annual groundwater recharge rate, and in some areas of Jaipur District the groundwater table has dropped by over 25 m since 2001 [53].
Water supply is intermittent, and the majority of residents have access to running water for less than two hours per day. Many residents cope with this intermittency by storing water in tanks to use throughout the day. Select neighborhoods received 24-h water supply in 2011 as part of a pilot project. A small percentage of residents do not use PHED-supplied water, relying instead on private wells. Wealthier residents often have both a PHED water connection and a private well, which they use when PHED-supplied water does not meet household demands.
3.2. Data Collection
Household surveys were conducted at 248 separate households across 10 neighborhoods in Jaipur City at the end of the 2015 monsoon season, from mid-September to mid-October. This was a drier than normal year, with a monsoon that produced only 65% of the average precipitation (341.32 mm) [54]. Of the surveys conducted, a total of 21 surveys were discarded due to transcription errors or early termination of the survey by participants; the results presented below are based on the remaining 227 surveys. This project was approved by the North Carolina State University’s Internal Review Board under Protocol #6045 on 18 September 2015.
Neighborhoods were selected for this study based on their water supply’s original source (PHED supplies primarily groundwater to some neighborhoods and surface water to others) and to ensure the widest geographic coverage around the city. Once neighborhoods were identified, survey administrators selected streets and homes from those neighborhoods at random. Since approximately 16% of Jaipur’s population lives in slums, 29 of the household surveys were conducted in slum settlements. One participant answered questions for each household.
Demographic data for the respondents are listed in Table 1. Households were classified as Low Income, Middle Income, and High Income according to a truncated version of the Standard of Living Index used by the Department of Health Research in India, as shown in Table 2. The survey participants are significantly more educated than the population of Jaipur City as a whole for two primary reasons. First, many potential survey takers declined to participate due to the perception of survey administrators as authority figures; wealthier and/or more educated heads of households were more willing to take the survey and were also more likely to be home on the weekends. Second, a substantial portion of India’s population are domestic workers (estimates of the number of workers who fall into this category in India range from 2.5 to 90 million); these workers are generally poorly educated and often live with wealthier families [55]. Since they are not heads of the household, they did not participate in surveys.

Table 1.
Survey participant demographics.
Table 2.
Income-group determination criteria.
Half of the surveys were administered in neighborhoods supplied primarily by surface water from Bisalpur Dam: The Walled City, Vishwakarma Industrial Area, Jawahar Nagar, and Mansarovar. The second half of the survey was conducted in neighborhoods supplied more heavily by groundwater: Chitrakroot, Civil Lines, Jagatpura, Vidhyadar Nagar, and Gurjar ki Thadi. Approximate survey locations are shown in Figure 1.
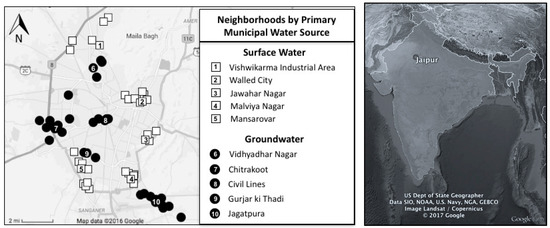
Figure 1.
Survey locations in Jaipur City and Jaipur City’s location in India.
3.3. Survey Design
Non-slum participants completed an in-depth survey about their household water supply, location-specific water end uses, engagement in conservation behaviors, general water awareness, amenability to water-conservation technology, environmental self-efficacy, environmental social norms, and anticipated responses to various water-use scenarios. The questions explored in this study are listed in the Appendix. No questions were asked about water pricing, because it is expected that some participants are not paying the correct amounts for their water usage due to corruption in the water-utility sector [43]. Due to a lack of functioning meters, overall water use was not measured in this study.
Initially, a similar survey was administered to slum participants. However, those participants’ responses were skewed by the impression of survey administrators as authority figures. For example, one participant, whose family used approximately 15 L of water per person per day, insisted that his family would reduce their water consumption by 50% if asked to do so by the government. The survey for slum residents was subsequently shortened to only assess their water consumption, based on how much water they carried from their water source each day. Although the demographic data listed in Table 1 encompasses all participants, the analysis that is described below is applied only to the data collected from 198 participants not living in slums.
3.4. Statistical Analysis
Survey results were analyzed to determine statistical correlations among engagement in water-conservation behaviors, anticipated responses to various water-use scenarios, demographic data and personal beliefs. Statistical analysis was conducted to find the relationship between independent variables, which include demographic characteristics, self-efficacy, and beliefs about social norms, and dependent variables, which are predispositions to change water-use behaviors and installation of dual-flush (DF) toilets. Two models were developed. The first model predicts changes in water-use behaviors in response to hypothetical scenarios, and a second model predicts installation of DF toilets.
The first model examined the predispositions to change water-use behaviors, including reducing water use and adopting DF toilets, among survey participants who had not already adopted DF technology. DF toilet owners did not answer questions about their future likelihood of installing DF toilets, because they already had adopted the technology. A multivariate analysis of variance (MANOVA) model was selected to conduct this analysis on all these questions as a group. MANOVA is simply an analysis of variance (ANOVA) with several dependent variables and tests for the difference in two or more vectors of means. An artificial dependent variable is constructed to represent the group of dependent variables as a linear combination of the measured dependent variables. MANOVA is selected for the set of questions that test for hypothetical water-conservation behaviors because there is a close relationship between responses to these questions. For example, the likelihood of installing a DF toilet in response to a family member’s suggestion is strongly correlated with the likelihood of installing a DF toilet in response to a close friend’s suggestion. Backward elimination based on Pillai’s Trace was then conducted to eliminate independent variables that had no significant impact on the MANOVA model fit. Univariate ANOVA was run for each significant independent variable, and the ANOVA results were then examined using pairwise comparisons to determine how the independent variables affected the model.
The second model examined the historic adoption of DF toilets among all survey participants. Logistic regression analysis was used to develop predictors of adoption of DF toilets using the independent variables (demographic characteristics, self-efficacy, and beliefs about social norms).
4. Results
4.1. Slum Results
Slum participants all reported obtaining water from PHED distribution points, where tanks carrying water from neighboring PHED-owned wells or Bisalpur Reservoir distribute water. The amounts of water used per household varied widely, from 20 L to 150 L per household per day, with an average daily household consumption rate of 65.7 L. The reported per capita water-consumption rate varied from 8 L to 21.4 L per day; the average consumption was 13.3 L per day per capita.
4.2. Non-Slum Results
4.2.1. Connection and Supply
Of the non-slum participants, 92% reported a water connection from PHED, and 8% relied only on personal wells. Of those participants who have municipally supplied water, 12% also used water from either personal wells or tanker services. On average, households with PHED water supply received 3.1 h of supply per day, with some residents only receiving half an hour of supply, and some, 24-h supply.
4.2.2. End Uses
Survey responses indicated that end uses vary widely between India and the West. End uses that are common in the West, such as lawn watering, are less common in India. Conversely, some domestic end uses that are largely unfamiliar in the West, such as evaporative coolers, are large contributors to water consumption.
The majority of participants, 67%, reported taking only traditional bucket baths, while only 3% of participants reported only taking showers; 30% reported using both methods. The average amount of water used per shower was not investigated in this study; however, it was examined in a recent study in Jodhpur, the second largest city in Rajasthan. According to Plappally et al., the majority of citizens in Jodhpur take showers that last between 4 and 7 min [8]. Assuming showerhead flows of 12–14 L per minute, the water consumption of the typical individual would be between 48 L and 98 L per day for bathing. The average person consumes 20 L of water per bucket bath, making traditional bucket bathing more water-efficient.
On average, households used 82.6 L of water per week to clean their houses, with amounts ranging from 20 L to 480 L per week.
Evaporative coolers, which are devices that vaporize water to cool the surrounding environment, are very popular, with 89% of participants owning at least one. These households possessed an average of 2.3 coolers per household, with an average capacity of 63 L, refilled on average 1.8 times a day. The average household thus consumes 260.82 L of water per day during the hot season (March to June). Of these households, 14% had purchased an additional cooler within the past 5 years. Van Ruijven et al. demonstrated that as incomes increase, households are more likely to purchase water coolers and other energy-intensive appliances [41]. Consequently, as Jaipur’s middle class grows, water consumption via water coolers is also likely to increase.
Most participants had neither a lawn nor a garden. Only 34% had only a garden, usually of potted plants. Lawns were uncommon, likely due to space restrictions. Just 2% of respondents had only a lawn, and 7% had both a lawn and a garden. On average, those with gardens watered them 6.5 times a week during the hot season, 3.7 times a week during the cold season, and 0.5 times a week during the monsoon season. The average garden size was 6.4 square meters. Assuming respondents use 5 L of water to water a square meter of their garden, the consumption rates of water are 208 L/week during the hot season, 118.4 L/week during the cold season, and 16 L/week during the monsoon.
Lawn sizes were on average 13.5 square meters, watered 7.2 times a week during the hot season, 4.2 times per week during the cold season, and 0.43 times a week during the monsoon season. Assuming a watering rate of 3 L/square meter of lawn, the consumption rates of water for residents with lawns are 291.6 L/week during the hot season, 170.1 L/week during the cold season, and 17.4 L/week during the monsoon.
4.2.3. Current Water-Conservation Behaviors and Technology
The majority of participants reported engaging in at least one water conservation behavior. As water-conservation behaviors increased in cost or level of effort required, their popularity decreased. The most popular conservation behavior was turning the faucet off when brushing teeth or washing dishes, which 94% of households reported doing. However, these self-reported numbers may not accurately reflect actual water-consumption behaviors.
Water-conservation behaviors that require some level of effort but no financial cost, such as reusing wastewater from filtration systems, were significantly less popular. A total of 73.7% of participants reported having some form of water-treatment system at home for treating drinking water. Reverse osmosis (RO) and combined RO–ultraviolet (UV) filtration systems were the most popular systems, owned by 58.1% of participants; 9.6% had UV filtration systems; 4.0% had granular filtration or mesh filters; and 26.2% of residents surveyed had no water-filtration systems at all. RO and RO–UV system recovery rates range from 35% to 85%; thus, their use generates a significant amount of water waste [56,57,58]; 44% of participants with RO or RO–UV systems reported reusing wastewater in various ways: watering plants, mopping, laundry, water cooler refills, and flushing toilets.
Conservation technology, which requires financial costs but no added effort after installation, is less popular than measures that require effort but no financial costs. Only 30% of households interviewed had installed water-conserving DF toilets. Of those participants who answered an open-ended question about why they had installed DF systems, 42% said they had installed them to conserve water, 35% said they did so based on advice, and 23% said they had installed it during renovations because it was new technology. Many participants were not familiar with the technology at all. Of those households that had installed DF toilets, 69% had installed them within the past five years (see Figure 2).
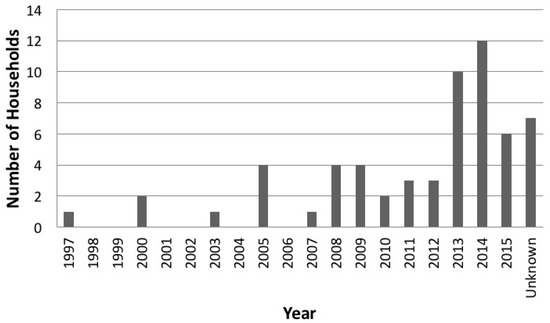
Figure 2.
Number of households that installed DF toilets, by year of installation.
Five percent of participating households reported that they had installed rainwater-harvesting systems, most of them within the past five years. Several participants mentioned interest in installing such systems and requested further information, while others remarked that they had not heard about the technology. This suggests that rainwater-harvesting systems may be uncommon due to their unfamiliarity, and that at least some residents of Jaipur would be receptive to a government rainwater-harvesting system installation initiative for private residences.
4.2.4. General Water Awareness, Self-Efficacy, and Social Norms
The second portion of the survey consisted of questions to evaluate respondents’ general water awareness, feelings of self-efficacy, and social norms. The questions were selected to increase the likelihood of respondents answering truthfully instead of in socially desirable ways by asking about general predilections and habits instead of specific consumption habits and views on water conservation. This section initially contained multiple questions related to each factor, but during the initial survey trials, multiple participants developed survey fatigue and refused to complete the survey. The section was then shortened to one to two questions for each factor. This approach may have introduced the possibility of mono-operation bias, but it greatly increased the rate of survey completion.
To evaluate general water awareness, respondents were first asked whether they had seen water leakage in their neighborhoods. Nearly half, 42%, of respondents reported seeing water leakage in their neighborhoods. This suggests a baseline level of water awareness among these participants and corroborates the argument that poorly maintained water infrastructure causes significant water loss in Jaipur [7]. One limitation to this approach is that it cannot be used to assess how many of the respondents are water unaware, because it is not possible to determine whether respondents had encountered water leaks and not noticed or lived in areas where water leakage is not prevalent.
Participants were then asked how frequently they discussed water issues with their friends and family as another metric to evaluate water awareness. Of the respondents, 20% claimed they discussed water issues with friends or family frequently, indicating they are very water aware. The majority, 54%, reported discussing water issues sometimes, indicating some level of water awareness, and 26% said they never discussed water issues, indicating they were water unaware.
Self-efficacy, or the feeling that one’s own actions can make a difference, was measured next by asking how much participants agreed with the statement “droughts are unpreventable natural disasters” on a Likert scale (where 1 is Strongly Disagree, 3 is Neither Agree nor Disagree, and 5 is Strongly Agree). Nearly half, 48%, of respondents disagreed with the statement, suggesting a sense of self-efficacy among these participants; 12% of participants neither agreed nor disagreed with the statement; while 39% of respondents believed droughts to be unpreventable, suggesting a lack of self-efficacy among these participants.
The survey then examined two social norms: expectations of the local government and community responsibilities. Respondents were asked how much they agreed with the statement “the government is obligated to provide relief during droughts” on a 5-point Likert scale (where 1 is Strongly Disagree, 3 is Neither Agree nor Disagree, and 5 is Strongly Agree). The majority of respondents, 56%, agreed that the government is obligated to provide relief during droughts; 24% disagreed that the government has an obligation to provide relief; and 20% neither agreed nor disagreed, indicating the respondents held a wide variety of beliefs about the government’s role in drought-relief provisions. Beliefs about community responsibility were much more unified. The vast majority of respondents, 91%, agreed with the statement “ensuring we have enough water is everyone’s responsibility”, whereas 5% disagreed, and 4% neither agreed nor disagreed.
4.2.5. Water-Conservation Scenarios—Social Influences
The next portion of the survey investigated respondents’ willingness to adopt water-conservation behaviors. Identifying water-conservation behaviors is inherently difficult because many personal water-consumption behaviors are unverifiable within a simple written survey, such as turning off the tap when washing dishes. Consequently, this study explored the installation of DF toilets as a possible proxy to determine water-conservation proclivities within the represented population.
First, participants answered a question about their general intent to install DF toilets in the future on a 5-point Likert scale (where 1 is “Very Unlikely,” 3 is “Neither Likely nor Unlikely,” and 5 is “Very Likely”) to examine social influences on imagined conservation behavior. Next, the participants were asked to imagine several scenarios in which prominent people in their lives (respected family members and close friends) and local leaders (the Minister of PHED and a local religious official) announced that they had installed DF toilets to conserve water. They then answered how likely they would be to install DF toilets, in light of the scenario.
When asked to imagine the likelihood of installing DF toilets independent of any outside influence, the average response was 2.88, or “Neither Likely nor Unlikely” (Table 3). Respondents answered on average almost a full point higher when imagining the respected family member scenario. Responses to the close friend and the PHED Minister scenario were slightly higher than the independent installation scenarios. When asked to imagine the local religious official scenario, responses were half a point lower than the independent installation scenario.
Table 3.
Survey responses on reported likelihood of installing DF toilets in various scenarios, on a Likert scale (1 = “Very Unlikely”, 3 = “Neither Likely nor Unlikely”, 5 = “Very Likely”).
Participants then were asked, if the PHED Minister requested residents to use 25% or 50% less water during a drought, how likely they would be to comply on the same Likert scale, and how likely they thought their neighbors would be to comply. These results are given in Table 4. Most participants indicated a willingness to reduce their water consumption by 25% if asked to do so, at least in the short term. They believed their neighbors were significantly less likely to do the same. Most deemed a 50% reduction too drastic a measure. Several respondents commented that it simply was not possible to survive on such a small amount of water, and others commented that they feel that they are already using as little water as possible.
Table 4.
Survey responses on reported likelihood of reducing water by a given percentage, self and others (1 = “Very Unlikely”, 3 = “Neither Likely nor Unlikely”, 5 = “Very Likely”).
4.3. Statistical Analysis of Results
An initial MANOVA model was developed to explore relationships between demographic data, water supply data, general water awareness, social norms, and self-efficacy questions as independent variables (as listed in Table 5) and the self-reported predispositions to conserve water as dependent variables (as listed in Table 6). Continuous demographic data were categorized due to sample size constraints, as detailed in Table 5 and Table 6. The belief that ensuring adequate water supply is everyone’s responsibility was not tested or included in the set of dependent variables because an insufficient number of respondents disagreed with the statement to test for correlation. Using backward elimination, a MANOVA model was developed by eliminating less significant independent variables. The final model shows a significant multivariate effect for the predispositions as a group due to a sub-set of independent variables, including the participants’ income group, water-supply duration, and self-efficacy (as measured by belief that droughts are unpreventable). Independent variables that had an insignificant effect on the dependent variables include gender, age, education level, municipal water-supply source, general water awareness, and the social norm belief that the government should provide relief during droughts. The significant results from the model are given in Table 7.
Table 5.
Categorization of independent variables for statistical analysis (both multivariate analysis of variance (MANOVA) and logistic regression).
Table 6.
Categorization of dependent variables for MANOVA analysis.
Table 7.
Significant results of MANOVA model, based on Pillai’s Trace, after conducting backward elimination of other independent variables.
Univariate ANOVA was run on the three independent variables that were statistically significant in the MANOVA model (Table 7). Post hoc pairwise comparison testing was conducted on the ANOVA results. Low-income group members were significantly more likely than high-income group individuals to be influenced by religious officials to install DF toilets (p = 0.08). Participants with high (p = 0.015) to intermediate (p = 0.059) levels of self-efficacy were significantly more likely to reduce water consumption by 25% during a drought than those with low self-efficacy. Participants who received two or less hours of water supply per day were less likely to agree to reduce consumption voluntarily than those with 4 or more hours of supply (p = 0.056).
A binomial logistic regression analysis was then conducted to determine what demographic, supply data, social norms, and self-efficacy factors (as listed in Table 3) predicted adoption of DF toilets. The statistically significant predictors of DF toilet adoption are: being in the age group 26–35 (Pr > χ2 = 0.061), being in the high-income group (Pr > χ2 = 0.100), and neither agreeing nor disagreeing with the statement that the government should provide assistance during a drought (Pr > χ2 = 0.011). Gender, education level, municipal supply source, water awareness, and self-efficacy were not statistically significant predictors of DF adoption. Results of the logistic regression analysis are detailed in Table 8.
Table 8.
Binomial logistic regression of DF toilet installation and age group, income group, and belief in government responsibility to provide aid.
5. Discussion
The findings of this study have several implications for residential water-demand policies in India and the developing world. In particular, the findings contribute to a growing body of literature demonstrating the disadvantages of providing intermittent supply and reducing water-supply duration in times of drought, which is the primary demand-management NPP in the developing world. Providing intermittent supply and reducing supply duration during droughts is so commonplace in Jaipur that one survey participant remarked that if the government wanted people to use less water, it could simply reduce everybody’s water supply by half an hour. However, the results from this study suggest that reducing water-supply duration may create a scarcity mindset, in which people are perversely less likely to engage in water-conservation behaviors. Households that already had limited supplies of water (those that received less than four hours of water supply per day and those that supplement their municipal supply with water from an alternate source) were less likely to agree to reduce their water consumption by a flat percentage. Yet these households were actually engaging in conservation behaviors less frequently than the average respondent. For example, only 27% of households who answered they would be unlikely to reduce water consumption also reported re-using wastewater, as compared to the average of 44%. Reducing water-supply duration could result in less frequent water-conservation behaviors by people who believe they are already consuming the minimum amount of water possible. Reducing supply also may not reduce water consumption, as long as hard demands are still met. If the intermittent supply provides enough water to meet consumers’ baseline demand, a 24-h supply does not appreciably increase residential water consumption, as shown by Andey and Kekar in four cities across India in 2009. If the intermittent supply is reduced so much that it no longer meets baseline demand, water consumption can be reduced, but it also results in riskier hygiene behaviors [59]. The intermittent supply strategy also comes at a significant cost, creating further strain on pipe systems and risking more leakage than water saved, as well as increasing the likelihood of contamination within the pipes [60]. Residents may also store more water than necessary and then use it frivolously when supplies are plentiful, which can result in greater overall water consumption [42,61].
On the other hand, the study results suggest that other NPPs, such as public messaging campaigns, may be effective in encouraging water-conservation behavior adoption. A critical component of encouraging conservation behaviors in the population is normalizing the behavior; in other words, if citizens think others are doing their part to save water, they may be more compelled to engage in conservation behavior as well [62]. Survey responses indicated that many of the participants felt that others were unconcerned with water resources: the belief that neighbors are less likely to reduce water consumption during a drought, the inability to recall any public water-conservation initiatives, and the regular occurrence of water leakage throughout the city all appear to contribute to this sentiment. Thus, a media campaign publicizing government-run water-conservation initiatives is another potential way to encourage water-conservation behaviors, by demonstrating that the government is invested in improving water security.
Educational campaigns that teach easy ways to conserve water may increase feelings of self-efficacy, and this study indicates self-efficacy correlates with a willingness to reduce water consumption during drought. Targeted educational campaigns about environmental conservation behaviors aimed at elementary students in the US have been shown to be effective in increasing those behaviors within their households [63]. An approach that teaches residents about the current strains on water supplies, how much the average person in India consumes on a daily basis, and the potential water savings a household could generate by adopting various conservation measures could increase household adoption of water-conservation behaviors.
The statistical significance of neither agreeing nor disagreeing with the statement that the government should provide relief during droughts could be due to several reasons. The neutral answer could be due to “cognitive laziness” or a desire not to alienate survey administrators, who may have been perceived as authority figures. Another possibility could be that survey participants were “saving face.” Sturgis, Roberts and Smith [64] found in a study of Likert scale questions that selecting a neutral answer is most often a reflection that survey takers are concerned about an issue, but are “saving face” to avoid looking unknowledgeable about the topic. If this is the case, then increasing educational campaigns about droughts could be beneficial.
A leading-by-example approach is likely to be more effective than public announcements from government officials asking residents to conserve water. The survey suggests that a public-awareness campaign that encourages people to pressure their peers to conserve water may be even more effective in reducing domestic water consumption. In particular, such a campaign targeted at the heads of families could increase the frequency of water-conservation behaviors among their family members and close friends.
6. Conclusions
This study shows trends in water consumption and conservation behaviors and explores their connections with self-efficacy, social norms, and amenability to conservation scenarios. Water-conservation behaviors that require little effort are most common, and as conservation behaviors require additional effort or financial investment, they drop in popularity. MANOVA analysis shows that individuals in high-income groups, those who have more than 4 h of water supply, and those who believe that droughts are preventable, were most amenable to adopting water-conservation behaviors and technologies. A binomial logistical regression shows that adults in their mid-twenties to mid-thirties, in high-income groups, who neither agree nor disagree that the government is responsible for providing aid during a drought are most likely to already own DF toilets, a popular water-conserving technology. People with limited water supply were less likely to report engaging in conservation behaviors than the rest of the population and less likely to agree to reduce their water consumption during times of drought. Although financial and enforcement capacities limit the government’s ability to implement many demand-management strategies popular in the developed world, NPPs such as messaging and educational campaigns may help reduce overall domestic water demands, if targeted effectively.
Acknowledgments
This work was supported by the National Science Foundation Graduate Research Fellowship Program under Grant No. DGE-1252376 and the Fulbright–Nehru Student Research Grant, which is administered by the United States Indian Educational Foundation and funded by the Government of India and the United States Government. The authors would like to thank Jonathan Duggins at North Carolina State University for his assistance with data analysis and the Centre for Development Communication (CDC) for their assistance in conducting the survey used to build this model. Authors would especially like to mention Col. (Ret.) Ravi Dhingra at CDC for his support. We also gratefully acknowledge the help of local graduate and undergraduate students at the Malaviya Nagar Institute of Technology in conducting surveys.
Author Contributions
Elizabeth Ramsey and Emily Zechman Berglund conceived and designed the surveys; Elizabeth Ramsey and Rohit Goyal designed the survey methodology; Elizabeth Ramsey analyzed the data; Elizabeth Ramsey and Emily Zechman Berglund wrote the paper.
Conflicts of Interest
The authors declare no conflict of interest. The founding sponsors had no role in the design of the study; in the collection, analyses, or interpretation of data; in the writing of the manuscript; and in the decision to publish the results.
Appendix A. Survey Questions for Non-Slum Households
| Household and Demographic Information | |||
| 1. | How many bedrooms does your household have? | ||
| 2. | Do you own your home? | ||
| 3. | What is your level of education? | ||
| 4. | How old are you? | ||
| 5. | How many people live in your household at least 9 months out of the year? | ||
| Connection and Supply | |||
| 6. | Do you get your water from the following sources? Please include all that apply. | ||
| (a.) | Municipal water supply | ||
| (b.) | Personal well | ||
| (c.) | Local public well | ||
| (d.) | Not sure | ||
| (e.) | Other (please explain) | ||
| 7. | Approximately how many hours per day do you get water supply? | ||
| End Uses, Water-Conservation Behaviors, and Technology | |||
| 8. | (A.) | What kind of water-filtration system do you have? | |
| (a.) | Reverse Osmosis (RO) | ||
| (b.) | Ultraviolet (UV) | ||
| (c.) | RO-UV | ||
| (d.) | Granular Filtration | ||
| (e.) | Other (please explain) | ||
| (f.) | None | ||
| (g.) | Don’t know | ||
| (B.) | If you have an RO or RO–UV filter, how do you dispose of the wastewater? | ||
| (a.) | Pour it down the drain | ||
| (b.) | Pour it outside | ||
| (c.) | Other (please explain) | ||
| (d.) | Don’t know | ||
| 9. | (A.) | How many desert coolers do you have in your home? | |
| (B.) | What are their capacities, in liters? | ||
| (C.) | How often do you refill them in the hot season per day? | ||
| (D.) | Have you purchased a new cooler in the past five years? | ||
| (E.) | If yes, how many have you purchased? | ||
| (F.) | If yes, was it an additional cooler or a replacement for a broken one? | ||
| 10. | (A.) | In the past five years, have you installed a rainwater-harvesting system? | |
| (B.) | If yes, what year did you install it? | ||
| (C.) | If yes, why did you install it? | ||
| 11. | In the past two years, have you turned the faucet off when washing dishes or brushing your teeth to conserve water? | ||
| 12. | (A.) | How many of each toilet do you have? | |
| (a.) | Dual-Flush | ||
| (b.) | Single-Flush | ||
| (c.) | Pour-Flush | ||
| (d.) | Other/don’t know | ||
| (B.) | If you have dual-flush toilets, what year did you install them? | ||
| (C.) | If you have dual-flush toilets, why did you install them? | ||
| 13. | Do you take Western-style showers or do you use a bucket? | ||
| 14. | (A.) | Do you have a garden? | |
| (B.) | If yes, how large is it, in square meters? | ||
| (C.) | If yes, how many times do you water it per week during the hot season? | ||
| (D.) | If yes, how many times do you water it per week during the cold season? | ||
| (E.) | If yes, how many times do you water it per week during the monsoon season? | ||
| (F.) | If yes, what do you use to water it? Please include all that apply. | ||
| (a.) | Sprinkler | ||
| (b.) | Drip-irrigation system | ||
| (c.) | Garden hose | ||
| (d.) | Watering can | ||
| (e.) | Other (please explain) | ||
| (f.) | I do not water it | ||
| 15. | (A.) | Do you have a grass lawn? | |
| (B.) | If yes, how large is it, in square meters? | ||
| (C.) | If yes, how many times do you water it per week during the hot season? | ||
| (D.) | If yes, how many times do you water it per week during the cold season? | ||
| (E.) | If yes, how many times do you water it per week during the monsoon season? | ||
| (F.) | If yes, what do you use to water it? Please include all that apply. | ||
| (a.) | Sprinkler | ||
| (b.) | Drip-irrigation system | ||
| (c.) | Garden hose | ||
| (d.) | Watering can | ||
| (e.) | Other (please explain) | ||
| (f.) | I do not water it | ||
| 16. | Roughly how much water do you use to clean your house per week? | ||
| General Water Awareness | |||
| 17. | How often do you speak to your friends/family about water issues (supply, quality, monsoons, etc.)? | ||
| (a.) | Never | ||
| (b.) | Sometimes (1–3 times per month) | ||
| (c.) | Frequently (>3 times a month) | ||
| 18. | (A.) | Please name any water-conservation initiatives in your area. If you can’t think of any, answer “none”. | |
| (B.) | What organization is behind those initiatives? If you don’t know, answer “I don’t know”. | ||
| 19. | Have you noticed any water leaks in your neighborhood? | ||
| Self-Efficacy | |||
| 20. | Here is a statement that people might make about an issue. “Droughts are unpreventable natural disasters.” How much do you agree or disagree with the statement? Please rate on a scale of 1–5, where 1 is “I strongly disagree”, 3 is “I neither agree nor disagree”, and 5 is “I strongly agree”. | ||
| Social Norms | |||
| 21. | Here are some statements that people might make about an issue. How much do you agree or disagree with the following statements? Please rate them on a scale of 1–5, where 1 is “I strongly disagree”, 3 is “I neither agree nor disagree”, and 5 is “I strongly agree”. | ||
| (A.) | Making sure we have enough water is everyone’s responsibility. | ||
| (B.) | The government is obligated to provide full relief during droughts. | ||
| Water-Conservation Scenario Amenability | |||
| 22. | Answer the following questions using a scale of 1–5, where 1 is “not at all likely”, 3 is “Neither Likely nor Unlikely”, and 5 is “very likely”. | ||
| (A.) | Imagine that the Minister of the Public Health Engineering Department–Rajasthan announced that everyone should use 25% less water at their residences to reduce the impact of a drought. | ||
| (I.) | How likely would you be to comply with that request? | ||
| (II.) | What do you think about the majority of people in your community? How likely is it that they would comply with that request? | ||
| (B.) | Imagine that the Minister of the Public Health Engineering Department–Rajasthan announced that everyone should use 50% less water at their residences to reduce the impact of a drought. | ||
| (I.) | How likely would you be to comply with that request? | ||
| (II.) | What do you think about the majority of people in your community? How likely is it that they would comply with that request? | ||
| 23. | If you have not installed dual-flush toilets, answer the following questions using a scale of 1–5, where 1 is “not at all likely”, 3 is “Neither Likely nor Unlikely”, and 5 is “very likely”. | ||
| (A.) | How likely are you to install dual-flush toilets to conserve water in the next year? | ||
| (B.) | Imagine the Minister of the Public Health Engineering Department–Rajasthan announced on the news that she was installing dual-flush toilets at her house to save water. How likely would you be to install dual-flush toilets as well? | ||
| (C.) | Imagine a local religious official announced on the news that he was installing dual-flush toilets at his house to save water. How likely would you be to install dual-flush toilets as well? | ||
| (D.) | Imagine a respected family member said that he was installing dual-flush toilets at his house to save water. How likely would you be to install dual-flush toilets as well? | ||
| (E.) | Imagine a close friend said that he was installing dual-flush toilets at his house to save water. How likely would you be to install dual-flush toilets as well? | ||
References
- Fuller, B.; Romer, P. Urbanization as Opportunity; Policy Research Working Paper; The World Bank: Washington, DC, USA, 2014. [Google Scholar]
- Mukherjee, S.; Shah, Z.; Kumar, M.D. Sustaining urban water supplies in India: Increasing role of large reservoirs. Water Resour. Manag. 2010, 24, 2035–2055. [Google Scholar] [CrossRef]
- United Nations. World Urbanization Prospects: 2014 Revision; United Nations: New York, NY, USA, 2014. [Google Scholar]
- Shiao, T.; Maddocks, A.; Carson, C.; Loizeaux, E. 3 Maps Explain India’s Growing Water Risks. Available online: http://www.wri.org/blog/2015/02/3-maps-explain-india’s-growing-water-risks (accessed on 1 May 2016).
- Ministry of Water Resources. National Water Policy (2012); Ministry of Water Resources: New Delhi, India, 2012; pp. 1–13. [Google Scholar]
- Jethoo, A.S.; Poonia, M.P. Sustainable Water Supply Policy for Jaipur City. Int. J. Environ. Sci. 2011, 1, 1235–1240. [Google Scholar]
- United States Agency for International Development. Municipal Water Use Efficiency Guideline: Jaipur; USAID: Washington, DC, USA, 2013.
- Plappally, A.K.; Hasija, A.; Kusins, J.; Jhaver, M.; Chee, A.; Panditrao, A.; Singh, N.K.; Kumar, N.; Singh, K.; Kumar, N.; et al. Water Use and Related Costs at Households in Western and Northern Parts of India. Hydrol. Curr. Res. 2013, 4. [Google Scholar] [CrossRef]
- Chatterjee, D.P. Oriental Disadvantage versus Occidental Exuberance: Appraising Environmental Concern in India A Case Study in a Local Context. Int. Sociol. 2008, 23, 5–33. [Google Scholar] [CrossRef]
- Office of the Registrar General & Census Commissioner, India. Census of India. 2011. Available online: http://www.censusindia.gov.in/pca/Searchdata.aspx (accessed on 1 January 2016).
- Jaipur Development Authority. Master Development Plan-2025; Jaipur Development Authority: Rajasthan, India, 2011.
- Domene, E.; Saurí, D. Urbanisation and water consumption: Influencing factors in the metropolitan region of Barcelona. Urban Stud. 2006, 43, 1605–1623. [Google Scholar] [CrossRef]
- Grafton, R.Q.; Ward, M.B.; To, H.; Kompas, T. Determinants of residential water consumption: Evidence and analysis from a 10-country household survey. Water Resour. Res. 2011, 47, 1–15. [Google Scholar] [CrossRef]
- Heinrich, M. Water End Use and Efficiency Project (WEEP): Final Report; BRANZ Ltd: Judgeford, New Zealand, 2007. [Google Scholar]
- Mayer, P.W.; DeOreo, W.B. Residential End Uses of Water; Aquacraft, Inc., Water Engineering and Management: Boulder, CO, USA, 1999. [Google Scholar]
- Trivedi, R.H.; Patel, J.D.; Savalia, J.R. Pro-environmental behaviour, locus of control and willingness to pay for environmental friendly products. Mark. Intell. Plan. 2015, 33, 67–89. [Google Scholar] [CrossRef]
- Turner, A.; White, S.; Beatty, K.; Gregory, A. Results of the largest residential demand management program in Australia. Water Sci. Technol. Water Supply 2005, 5, 249–256. [Google Scholar]
- Willis, R.M.; Stewart, R.A.; Panuwatwanich, K.; Capati, B.; Giurco, D. Gold Coast Domestic Water End Use Study. Water J. Aust. Water Assoc. 2009, 36, 79–85. [Google Scholar]
- Berk, R.A.; Schulman, D.; McKeever, M.; Freeman, H.E. Measuring the Impact of Water Conservation Campaigns in California. Clim. Chang. 1993, 24, 233–248. [Google Scholar] [CrossRef]
- Wolters, E.A. Attitude-behavior consistency in household water consumption. Soc. Sci. J. 2014, 51, 455–463. [Google Scholar] [CrossRef]
- Gilg, A.; Barr, S. Behavioural attitudes towards water saving? Evidence from a study of environmental actions. Ecol. Econ. 2006, 57, 400–414. [Google Scholar] [CrossRef]
- Willis, R.M.; Stewart, R.A.; Panuwatwanich, K.; Williams, P.R.; Hollingsworth, A.L. Quantifying the influence of environmental and water conservation attitudes on household end use water consumption. J. Environ. Manag. 2011, 92, 1996–2009. [Google Scholar] [CrossRef] [PubMed]
- Millock, K.; Nauges, C. Household adoption of water-efficient equipment: The role of socio-economic factors, environmental attitudes and policy. Environ. Resour. Econ. 2010, 46, 539–565. [Google Scholar] [CrossRef]
- Tarrant, M.A.; Cordell, H.K. The Effect of Respondent Characteristics on General Environmental Attitude-Behavior Correspondence. Environ. Behav. 1997, 29, 618–637. [Google Scholar] [CrossRef]
- Harlan, S.L.; Yabiku, S.T.; Larsen, L.; Brazel, A.J. Household Water Consumption in an Arid City: Affluence, Affordance, and Attitudes. Soc. Nat. Resour. 2009, 22, 691–709. [Google Scholar] [CrossRef]
- De Oliver, M. Attitudes and Inaction: A Case Study of the Manifest Demographics of Urban Water Conservation. Environ. Behav. 1999, 31, 372–394. [Google Scholar] [CrossRef]
- Fielding, K.S.; Van Kasteren, Y.; Louis, W.; McKenna, B.; Russell, S.; Spinks, A. Using individual householder survey responses to predict household environmental outcomes: The cases of recycling and water conservation. Resour. Conserv. Recycl. 2016, 106, 90–97. [Google Scholar] [CrossRef]
- Campbell, H.E.; Johnson, R.M.; Larson, E.H. Prices, devices, people, or rules: The relative effectiveness of policy instruments in water conservation. Rev. Policy Res. 2004, 21, 637–662. [Google Scholar] [CrossRef]
- Hamilton, L.C. Self-Reported and Actual Savings in a Water Conservation Campaign. Environ. Behav. 1985, 17, 315–326. [Google Scholar] [CrossRef]
- Hassell, T.; Cary, J. Promoting Behavioural Change in Household Water Consumption: Literature Review; Smart Water: Heatherton, Australia, 2007. [Google Scholar]
- Willis, R.M.; Stewart, R.A.; Panuwatwanich, K.; Jones, S.; Kyriakides, A. Alarming visual display monitors affecting shower end use water and energy conservation in Australian residential households. Resour. Conserv. Recycl. 2010, 54, 1117–1127. [Google Scholar] [CrossRef]
- Kim, S.H.; Choi, S.H.; Koo, J.Y.; Choi, S.I.; Hyun, I.H. Trend analysis of domestic water consumption depending upon social, cultural, economic parameters. Water Sci. Technol. Water Supply 2007, 7, 61. [Google Scholar] [CrossRef]
- De Oreo, W.B.; Mayer, P.W. Insights into declining single family residential water demands. J. Am. Water Works Assoc. 2012, 104, 383–394. [Google Scholar]
- Hurd, B.H. Water conservation and residential landscapes: Household preferences, household choices. J. Agric. Resour. Econ. 2006, 31, 173–192. [Google Scholar]
- Dandy, G.; Nguyen, T.; Davies, C. Estimating Residential Water Demand in the Presence of Free Allowances. Land Econ. 1997, 73, 125–139. [Google Scholar] [CrossRef]
- Taylor, R.G.; McKean, J.R.; Young, R.A. Alternate Price Specifications for Estimating Residential Water Demand with Fixed Fees. Land Econ. 2004, 80, 463–475. [Google Scholar] [CrossRef]
- Hewitt, J.A.; Hanemann, W.M. A Discrete/Continuous Choice Approach to Residential Water Demand under Block Rate Pricing. Land Econ. 1995, 71, 173–192. [Google Scholar] [CrossRef]
- Dalhuisen, J.M.; Florax, R.J.G.M.; de Groot, H.L.F.; Nijkamp, P. Price and Income Elasticities of Residential Water Demand: A Meta-Analysis. Land Econ. 2003, 79, 292–308. [Google Scholar] [CrossRef]
- Arbués, F.; García-Valiñas, M.Á.; Martínez-Espiñeira, R. Estimation of residential water demand: A state-of-the-art review. J. Sociol. Econ. 2003, 32, 81–102. [Google Scholar] [CrossRef]
- Nauges, C.; Whittington, D. Estimation of Water Demand in Developing Countries: An Overview. World Bank Res. Obs. 2009, 25, 263–294. [Google Scholar] [CrossRef]
- Van Ruijven, B.J.; van Vuuren, D.P.; de Vries, B.J.M.; Isaac, M.; van der Sluijs, J.P.; Lucas, P.L.; Balachandra, P. Model projections for household energy use in India. Energy Policy 2011, 39, 7747–7761. [Google Scholar] [CrossRef]
- Burt, Z.; Ray, I. Storage and Non-Payment: Persistent Informalities within the Formal Water Supply of Hubli-Dharwad, India. Water Altern. 2014, 7, 106–120. [Google Scholar]
- Davis, J. Corruption in public service delivery: Experience from South Asia’s water and sanitation sector. World Dev. 2004, 32, 53–71. [Google Scholar] [CrossRef]
- Stern, P.C. New Environmental Theories: Toward a Coherent Theory of Environmentally Significant Behavior. J. Soc. Issues 2000, 56, 407–424. [Google Scholar] [CrossRef]
- Stern, P.C.; Dietz, T.; Kalof, L. Value Orientations, Gender, and Environmental Concern. Environ. Behav. 1993, 25, 322–348. [Google Scholar] [CrossRef]
- Kumar, V.; Kumar, A.; Ghosh, A.K.; Samphel, R.; Yadav, R.; Yeung, D.; Darmstadt, G.L. Enculturating science: Community-centric design of behavior change interactions for accelerating health impact. Semin. Perinatol. 2015, 39, 393–415. [Google Scholar] [CrossRef] [PubMed]
- Chang, G. Factors influencing water conservation behavior among urban residents in China’s arid areas. Water Policy 2013, 15, 691–704. [Google Scholar] [CrossRef]
- Government of Rajasthan Rainfall Data (1957 to 2014). Available online: http://waterresources.rajasthan.gov.in/Daily_Rainfall_Data/Rainfall_Index.htm (accessed on 25 August 2015).
- Disaster Management and Relief Department Frequency of Drought. Available online: http://www.dmrelief.rajasthan.gov.in/index.php/irrigation-calender/frequency-of-drought (accessed on 2 March 2016).
- Public Health Engineering Department. Drinking Water Management of Jaipur City 2011. Available online: http://icrier.org/pdf/Jaipur_service.pdf.
- Bhandari, M.; Dangi, V.; Bhargava, A.K.; Singh, R.; Khanna, N.; Tamra, S.; Bhandari, A. SB Civil Writ Petition No. 11153/2011 Suo Motu vs. State of Rajasthan. 29 May 2012, pp. 1–33. Available online: http://www.ielrc.org/content/e1208.pdf (accessed on 2 November 2017).
- Comptroller and Auditor General of India, Report of 2010-Performance and Compliance Audit on Civil Government of Rajasthan, Report No. 2. 2010; pp. 13–84. Available online: http://www.cag.gov.in/sites/default/files/audit_report_files/Rajasthan_Civil_2010.pdf (accessed on 2 November 2017).
- Jaipur: Groundwater Table Sinks 25 Metres in 10 Yrs; Times of India: New Delhi, India, 2015.
- Rajasthan State Department of Water Resources Daily Rainfall & Tank Gauge Bulletin: 30 September 2015. Available online: http://waterresources.rajasthan.gov.in/RAINFALL/Daily Rainfall bulletin.pdf (accessed on 15 October 2015).
- International Labour Organization. Domestic Workers Across the World: Global and Regional Statistics and the Extent of Legal Protection; International Labour Organization: Geneva, Switzerland, 2013. [Google Scholar]
- Tularam, G.A.; Ilahee, M. Environmental concerns of desalinating seawater using reverse osmosis. J. Environ. Monit. 2007, 9, 805–813. [Google Scholar] [CrossRef] [PubMed]
- Greenlee, L.F.; Lawler, D.F.; Freeman, B.D.; Marrot, B.; Moulin, P. Reverse osmosis desalination: Water sources, technology, and today’s challenges. Water Res. 2009, 43, 2317–2348. [Google Scholar] [CrossRef] [PubMed]
- Hanford, J. Reverse Osmosis. Plumb. Mech. 2003, 21, 14. [Google Scholar]
- Fan, L.; Liu, G.; Wang, F.; Ritsema, C.J.; Geissen, V. Domestic Water Consumption under Intermittent and Continuous Modes of Water Supply. Water Resour. Manag. 2014, 28, 853–865. [Google Scholar] [CrossRef]
- Christodoulou, S.; Agathokleous, A. A study on the effects of intermittent water supply on the vulnerability of urban water distribution networks. Water Sci. Technol. Water Supply 2012, 12, 523–530. [Google Scholar] [CrossRef]
- Srinivasan, V.; Gorelick, S.M.; Goulder, L. A hydrologic-economic modeling approach for analysis of urban water supply dynamics in Chennai, India. Water Resour. Res. 2010, 46, 1–20. [Google Scholar] [CrossRef]
- Thomas, C.; Sharp, V. Understanding the normalisation of recycling behaviour and its implications for other pro-environmental behaviours: A review of social norms and recycling. Resour. Conserv. Recycl. 2013, 79, 11–20. [Google Scholar] [CrossRef]
- Woollam, T.; Griffiths, T.; Williams, K. Do Children Take the Recycling Message Home? In Proceedings of the Twenty-First International Conference on Solid Waste Technology and Management, Philadelphia, PA, USA, 26–29 March 2006. [Google Scholar]
- Sturgis, P.; Roberts, C.; Smith, P. Middle Alternatives Revisited. Sociol. Methods Res. 2014, 43, 15–38. [Google Scholar] [CrossRef]
© 2017 by the authors. Licensee MDPI, Basel, Switzerland. This article is an open access article distributed under the terms and conditions of the Creative Commons Attribution (CC BY) license (http://creativecommons.org/licenses/by/4.0/).