Article

Spatial and Temporal Dynamics of Potentially Toxic Cyanobacteria in the Riverine Region of a Temperate Estuarine System Altered by Weirs

1
Department of Environmental Engineering & Biotechnology, Mokpo National Maritime University, Mokpo 58628, Korea
2
Department of Biological Science, Chonnam National University, Gwangju 61186, Korea
3
Department of Environmental Education, Sunchon National University, Suncheon 57922, Korea
*
Author to whom correspondence should be addressed.
Water 2017, 9(11), 819; https://doi.org/10.3390/w9110819
Submission received: 19 July 2017 / Revised: 4 September 2017 / Accepted: 19 October 2017 / Published: 25 October 2017

Abstract

:
The effects of weirs on fish and other biological communities have garnered considerable study, whereas the effects of weirs on community composition of toxic cyanobacteria have not yet been well documented. In this study, temporal and spatial variations in species composition and the abundance of potentially toxic cyanobacteria were investigated in the riverine regions of the temperate Youngsan River estuary, where two weirs have recently been constructed. Four stations were sampled 0.5 m below the surface monthly along the channel of the upper river from May 2014 to April 2015 to explore cyanobacterial composition and abundance, while physicochemical and biological parameters were measured to elucidate possible mechanisms controlling these dynamics. Two stations were located upstream at free-flowing sites, and the other stations were located downstream at impounded sites near the weirs. Twenty-eight cyanobacterial species were identified, seven of which were potentially toxic: Microcystis sp., M. aeruginosa, M. flos-aquae, Dolichospermum sp., Aphanocapsa sp., Oscillatoria sp. and Phormidium sp. Microcystis sp. was the most abundant in June 2014 at the lowest station near the weir. Meanwhile, Phormidium sp. occurred at low abundance throughout the study period, except during the winter months, when its abundance was elevated. The interactive forward selection method highlighted dissolved inorganic nitrogen and zooplankton abundance as explanatory variables for this observed variation, but their effects on cyanobacterial growth are unclear. However, temperature was the major determinant for the temporal variation in cyanobacterial populations. Cluster analysis showed that the downstream stations near the weirs had a high similarity of potentially toxic cyanobacteria. Significantly higher abundance, especially of Microcystis sp., was also recorded at the impounded sites suggesting that the presence of weirs might affect variations in toxic cyanobacterial communities.

1. Introduction

Cyanobacteria are one of the most primal organisms on earth, dating back approximately 3500 million years [1]. They are naturally pervasive in both freshwater and marine environments. Their widespread adaptability is credited to their proficient internal characteristics, such as sheath pigments that absorb UV light for radical scavenging [2], buoyancy regulation for advantageous access to light and atmospheric CO2 [3], and their capacity to undergo spontaneous pre-selective mutations [4]. Despite their high adaptability, cyanobacterial abundance and diversity are still influenced by certain environmental conditions such as light intensity [5], temperature [6,7], turbidity [6,8], grazer populations [9], and nitrogen and phosphorus availability, as well as their ecophysiological characteristics (e.g., growth rate) [9]. These factors are crucial in understanding bloom formation, although eutrophication is generally a major cause of cyanobacterial blooms [6,10,11]. Blooms impact ecosystems by depleting oxygen and light supply in the water, but more importantly, certain species of cyanophytes produce toxins that can be transferred to higher trophic levels. Cyanobacteria also exude chemicals with foul tastes or odours (geosmin and 2-methylisoborneol) [12,13] that alter drinking water palatability.
The aforementioned factors can be affected by hydrological modifications in aquatic ecosystems, including riverine zones of estuaries. The natural conditions of lotic environments are especially modified when man-made structures are introduced. These structures can change riverine systems to lacustrine conditions [10,14]. When riverine waters become impounded, changes in water quality and biota are detected [15,16]. For example, the Murray River in Australia has been observed to be more favourable to cyanobacterial growth in areas where weirs were installed, as opposed to free-flowing areas [17]. The study pointed out that the presence of weirs was advantageous for cyanobacteria over other phytoplankton species because they are capable of buoyancy. Nutrient accumulation, particularly dissolved inorganic nitrogen (DIN) and phosphorus (DIP), aggravated by the presence of weirs, sequentially contributed to bloom formation [7,18,19]. A hydrological–ecological model revealed that changes in hydrology promote algal biomass proliferation [20]. This suggests that modifications in water dynamics can stimulate shifts in cyanobacterial taxonomic composition, but these effects on species composition are not fully understood.
In Korea, multiple weirs have been constructed in the lotic zones of major rivers as part of the Four Major Rivers Restoration Project. This project was designed to regulate problems related to flooding and drought in the Youngsan River, one of the four major rivers connected to an estuary. Two weirs, the Seungchon Weir and Juksan Weir, were constructed transecting a stretch of the Youngsan River. Although an increase in algal blooms has been reported since the construction of the weirs in the river [21], the temporal and spatial patterns of outbreaks of cyanobacteria that are potentially capable of producing toxins have not yet been explored. We hypothesised that the construction of weirs may have contributed to the increased blooms, particularly those of toxic cyanobacteria. The objective of this study was to compare cyanobacterial composition and abundance, particularly of potentially toxic cyanobacteria, in the free-flowing and impounded sites of the riverine region of the Youngsan River estuary. Physicochemical and biological parameters were measured to determine the major factors controlling variability in cyanobacterial composition and abundance.

2. Materials and Methods

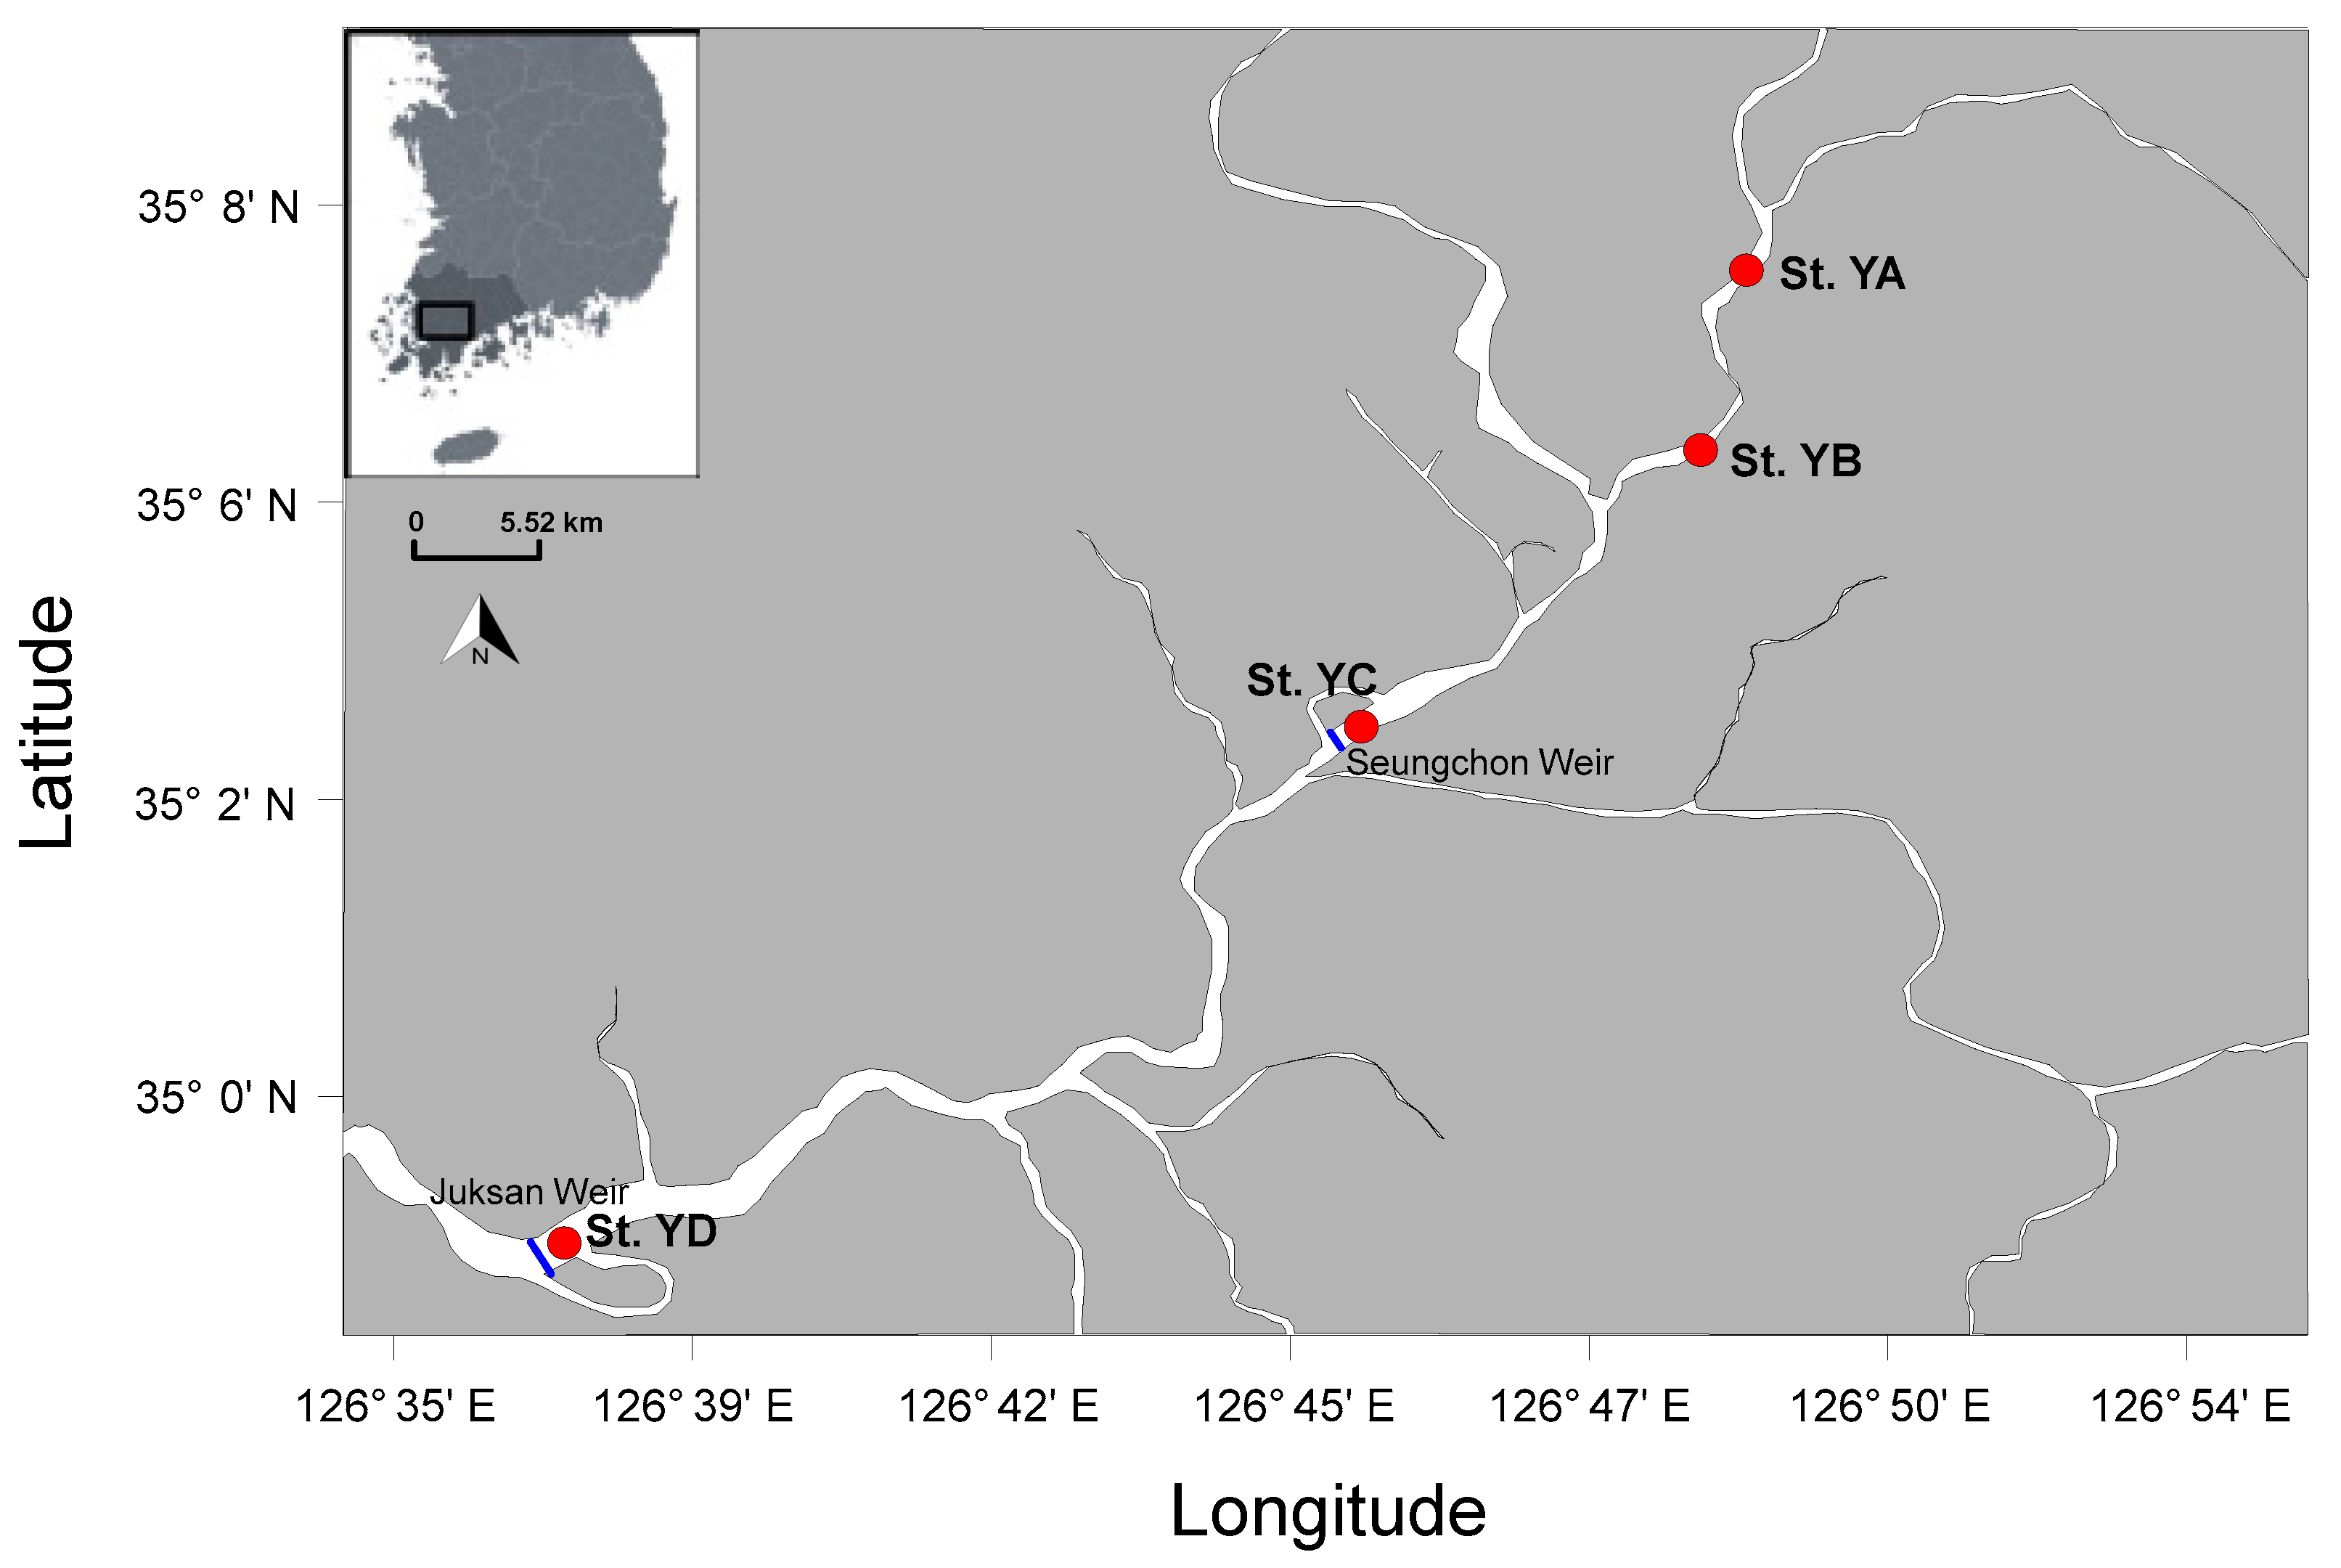
2.1. Study Site and Field Sampling

The Youngsan River, located in southwest Korea, is about 129.5 km in length and has a basin area of 3455 km2 [22]. It serves as the lifeline of the Jeollanam province, catering to the agricultural, industrial, water consumption and leisure needs of the residents [23]. Four sampling stations, designated YA, YB, YC and YD, with depths ranging from 1.3 to 4.5 m, were monitored along the channel of the upper region of the estuary (Figure 1) on a monthly basis from May 2014 to April 2015. The first two stations (control; YA and YB) were situated far from the weirs, whereas the other two sites (treatment; YC and YD) were sampled just upstream of the weir structures. Water samples were collected 0.5 m below the surface at the sampling stations using Niskin bottles and stored in 2 L amber polycarbonate bottles in a dark and cool environment (<24 °C) until further analysis. Sample collection was based on the methods of Hötzel and Croome [24].

2.2. Determination of Physicochemical Parameters

In situ water temperature (°C) and turbidity (NTU) were measured using the YSI Model 6600 Multi-parameter Water Quality Sonde (YSI, Inc., Yellow Springs, OH, USA). A photosynthetically active radiation (PAR; µmol·m−2·s−1) Quantum Radiometer (LICOR, Lincoln, NE, USA) was used to measure light intensity from 0 cm (surface level) to 50 cm water depth (at 10 cm intervals). Light attenuation coefficient (kd; m−1) values were derived from the Beer-Lambert equation [25]:
Iz = I0 (e−kdz),
where
Iz = irradiance at depth,
I0 = irradiance at surface,
kd = light attenuation coefficient,
and
z = depth.
No PAR data are available for the months of October and November at station YD owing to technical problems during sampling. Dissolved inorganic nutrients (µM) were measured by filtering 15 mL of each water sample using Whatman 25 mm GF/F glass microfiber filters (0.7 µm pore size; Whatman, Buckinghamshire, UK). The filtrates were immediately stored at −75 °C until further analysis. Nutrient concentration analysis was conducted with a QuAAtro Autoanalyser (SEAL Analytical, Inc., Norderstedt, Germany). The detection limit for DIN is 0.02–0.03 μM, while that for DIP is 0.006 μM. DIN was calculated as the sum of ammonium (NH4+), nitrite (NO2) and nitrate (NO3); DIP was equal to the soluble reactive phosphate (PO43−) concentration [26].

2.3. Determination of Chlorophyll a

The water samples (100 mL) were filtered under ≤100 mmHg pressure using Whatman 25 mm GF/F glass microfiber filters (0.7 µm pore size). The filters were placed inside 8 mL amber glass bottles pre-filled with 90% acetone solution and stored at 4 °C for 12 h. Chlorophyll (Chl) extracts were measured using a 10-AU fluorometer (Turner Designs, Sunnyvale, CA, USA). The method used for Chl a measurement was based on Arar and Collins [27].

2.4. Determination of Zooplankton Abundance

Zooplankton were collected from 20 to 50 L water samples filtered with a 60-μm net. Samples were preserved by adding 10% formalin (4% final concentration). Large zooplankton were counted using an inverted microscope at 25 or 50× magnification, and smaller zooplankton were counted at 100 or 400× magnification. Identification was made to the genus or species level using Voigt [28], Smirnov and Timms [29] and Einsle [30] as references.

2.5. Cyanobacteria Identification and Enumeration

Water samples were placed into opaque 1 L bottles pre-filled with 3 mL iodine potassium-iodide (IKI) solution [31] and stored at room temperature for identification. The bottles were allowed to stand until the phytoplankton settled to the bottom, after which the water above was removed, while the remaining 50 mL of the sample containing the phytoplankton was transferred to a conical tube [24]. Cyanobacteria were counted in a 1 mL Sedgewick–Rafter counting chamber using a Zeiss microscope (Zeiss® Axiolab, Jena, Germany). For identification of species, the following references were used: Hirose et al. [32], Komárek and Anagnostidis [33,34].

2.6. Statistical Analyses

Using CANOCO software ver. 5 (Microcomputer Power, Ithaca, NY, USA), ecological ordination analysis was applied to elucidate the relationships between cyanobacterial communities, environmental parameters and biotic factors (zooplankton abundance and Chl a). An unconstrained unimodal detrended correspondence analysis (DCA) was initially performed to determine the homogeneity of the data. The first DCA axis determines the method to use, and in this study, redundancy analysis (RDA) was employed. To test the significance of the relationships, a permutation test (significant at p < 0.05) was applied. Subsequently, interactive forward selection method was further employed to detect changes in variables that may influence cyanobacterial communities and abundance. The false discovery rate (FDR) p-value correction method was applied to prevent inclusion of unnecessary predictors. Monthly means of the potentially toxic species were used in the analyses. To determine the similarity among sites, hierarchical cluster analysis was performed in Primer 6 (Quest Research Limited, Auckland, New Zealand). The total abundances of the potentially toxic cyanobacteria were used to determine similarity. The complete linkage method of distance clustering was used. Based on the cluster analysis results, the study sites were categorised into two groups: free-flowing (stations YA and YB; control) and impounded (stations YC and YD; treatments). The paired t-test (significant at p < 0.05) was used to compare environmental parameters and toxic cyanobacterial abundances between the groups. The data were transformed to log(x + 1) values prior to the statistical analysis.

3. Results

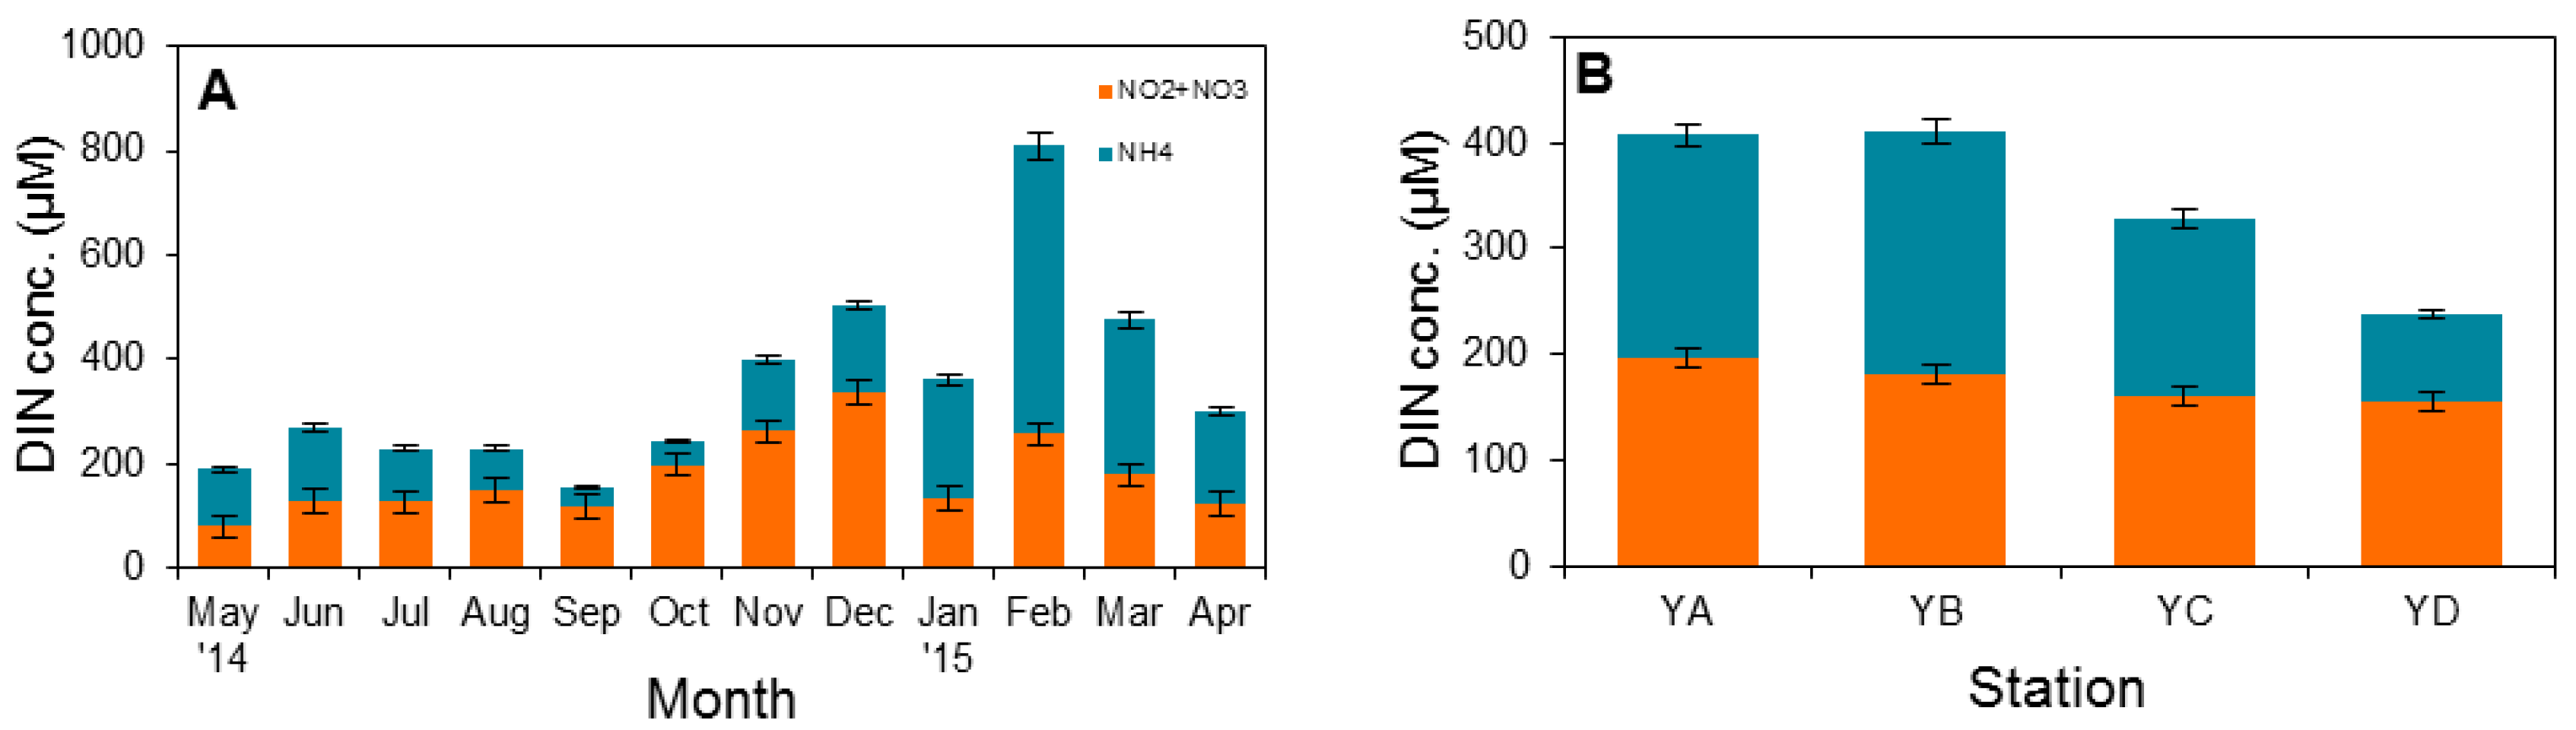
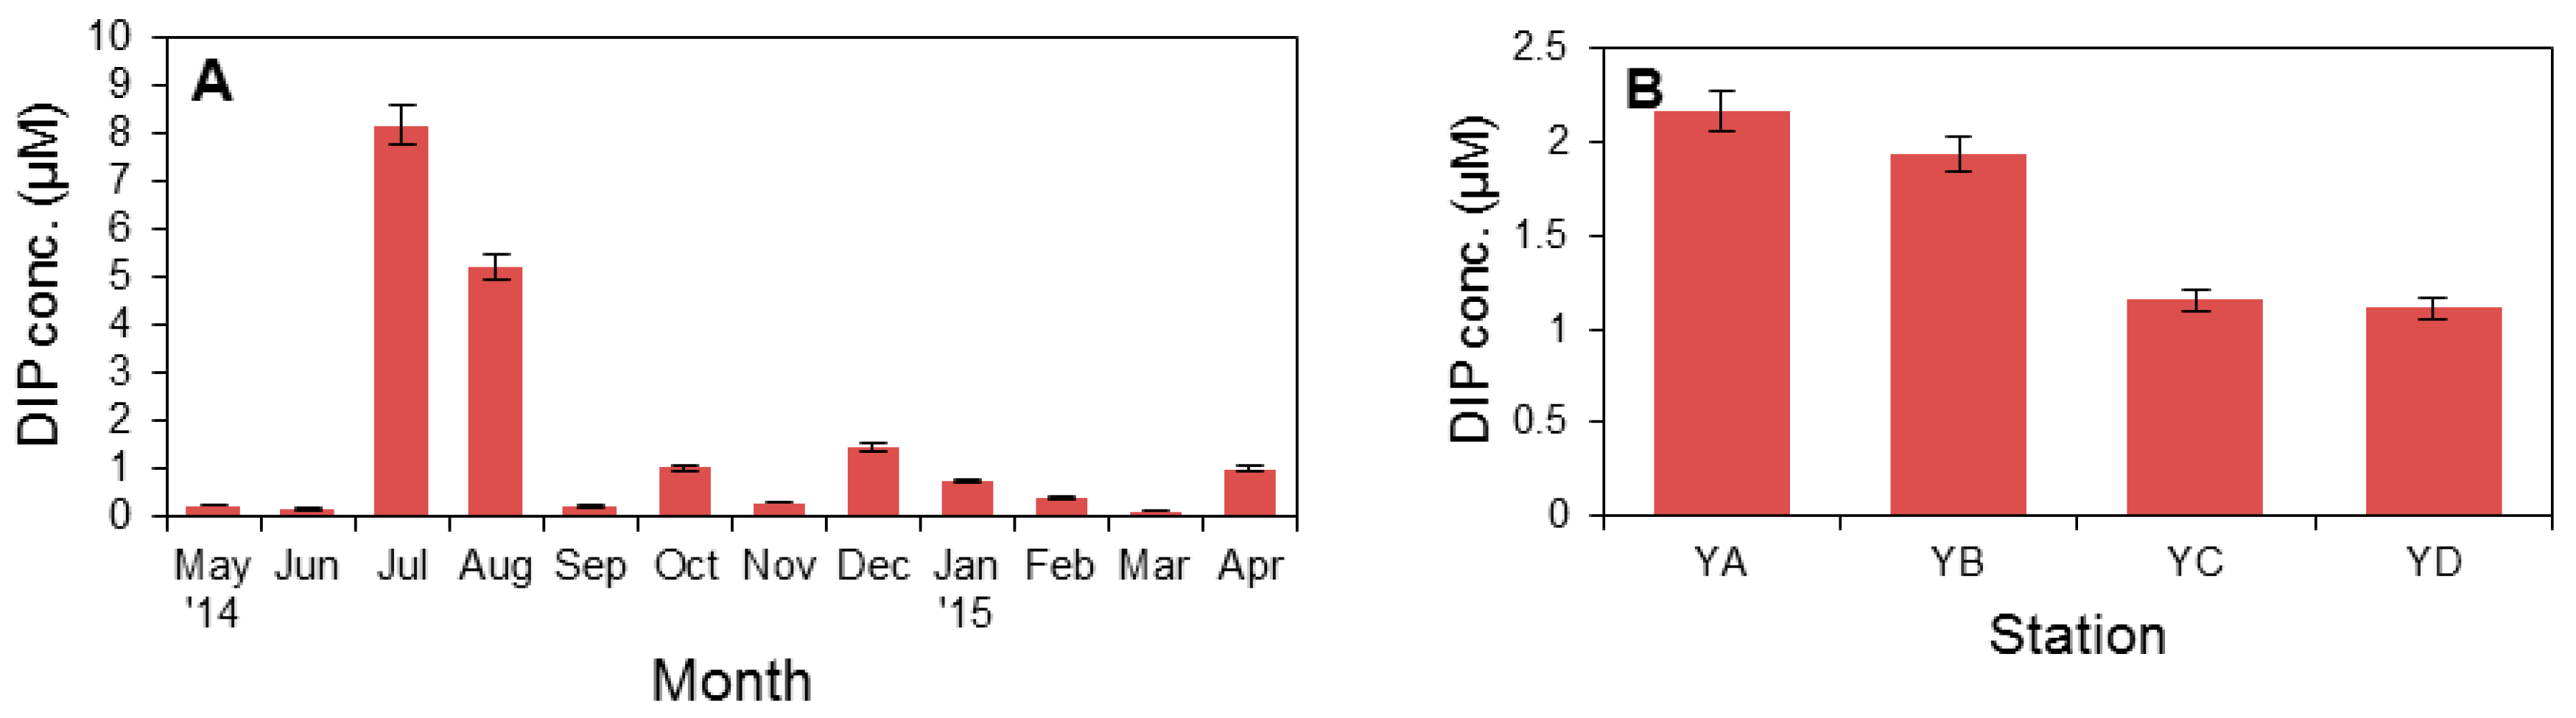
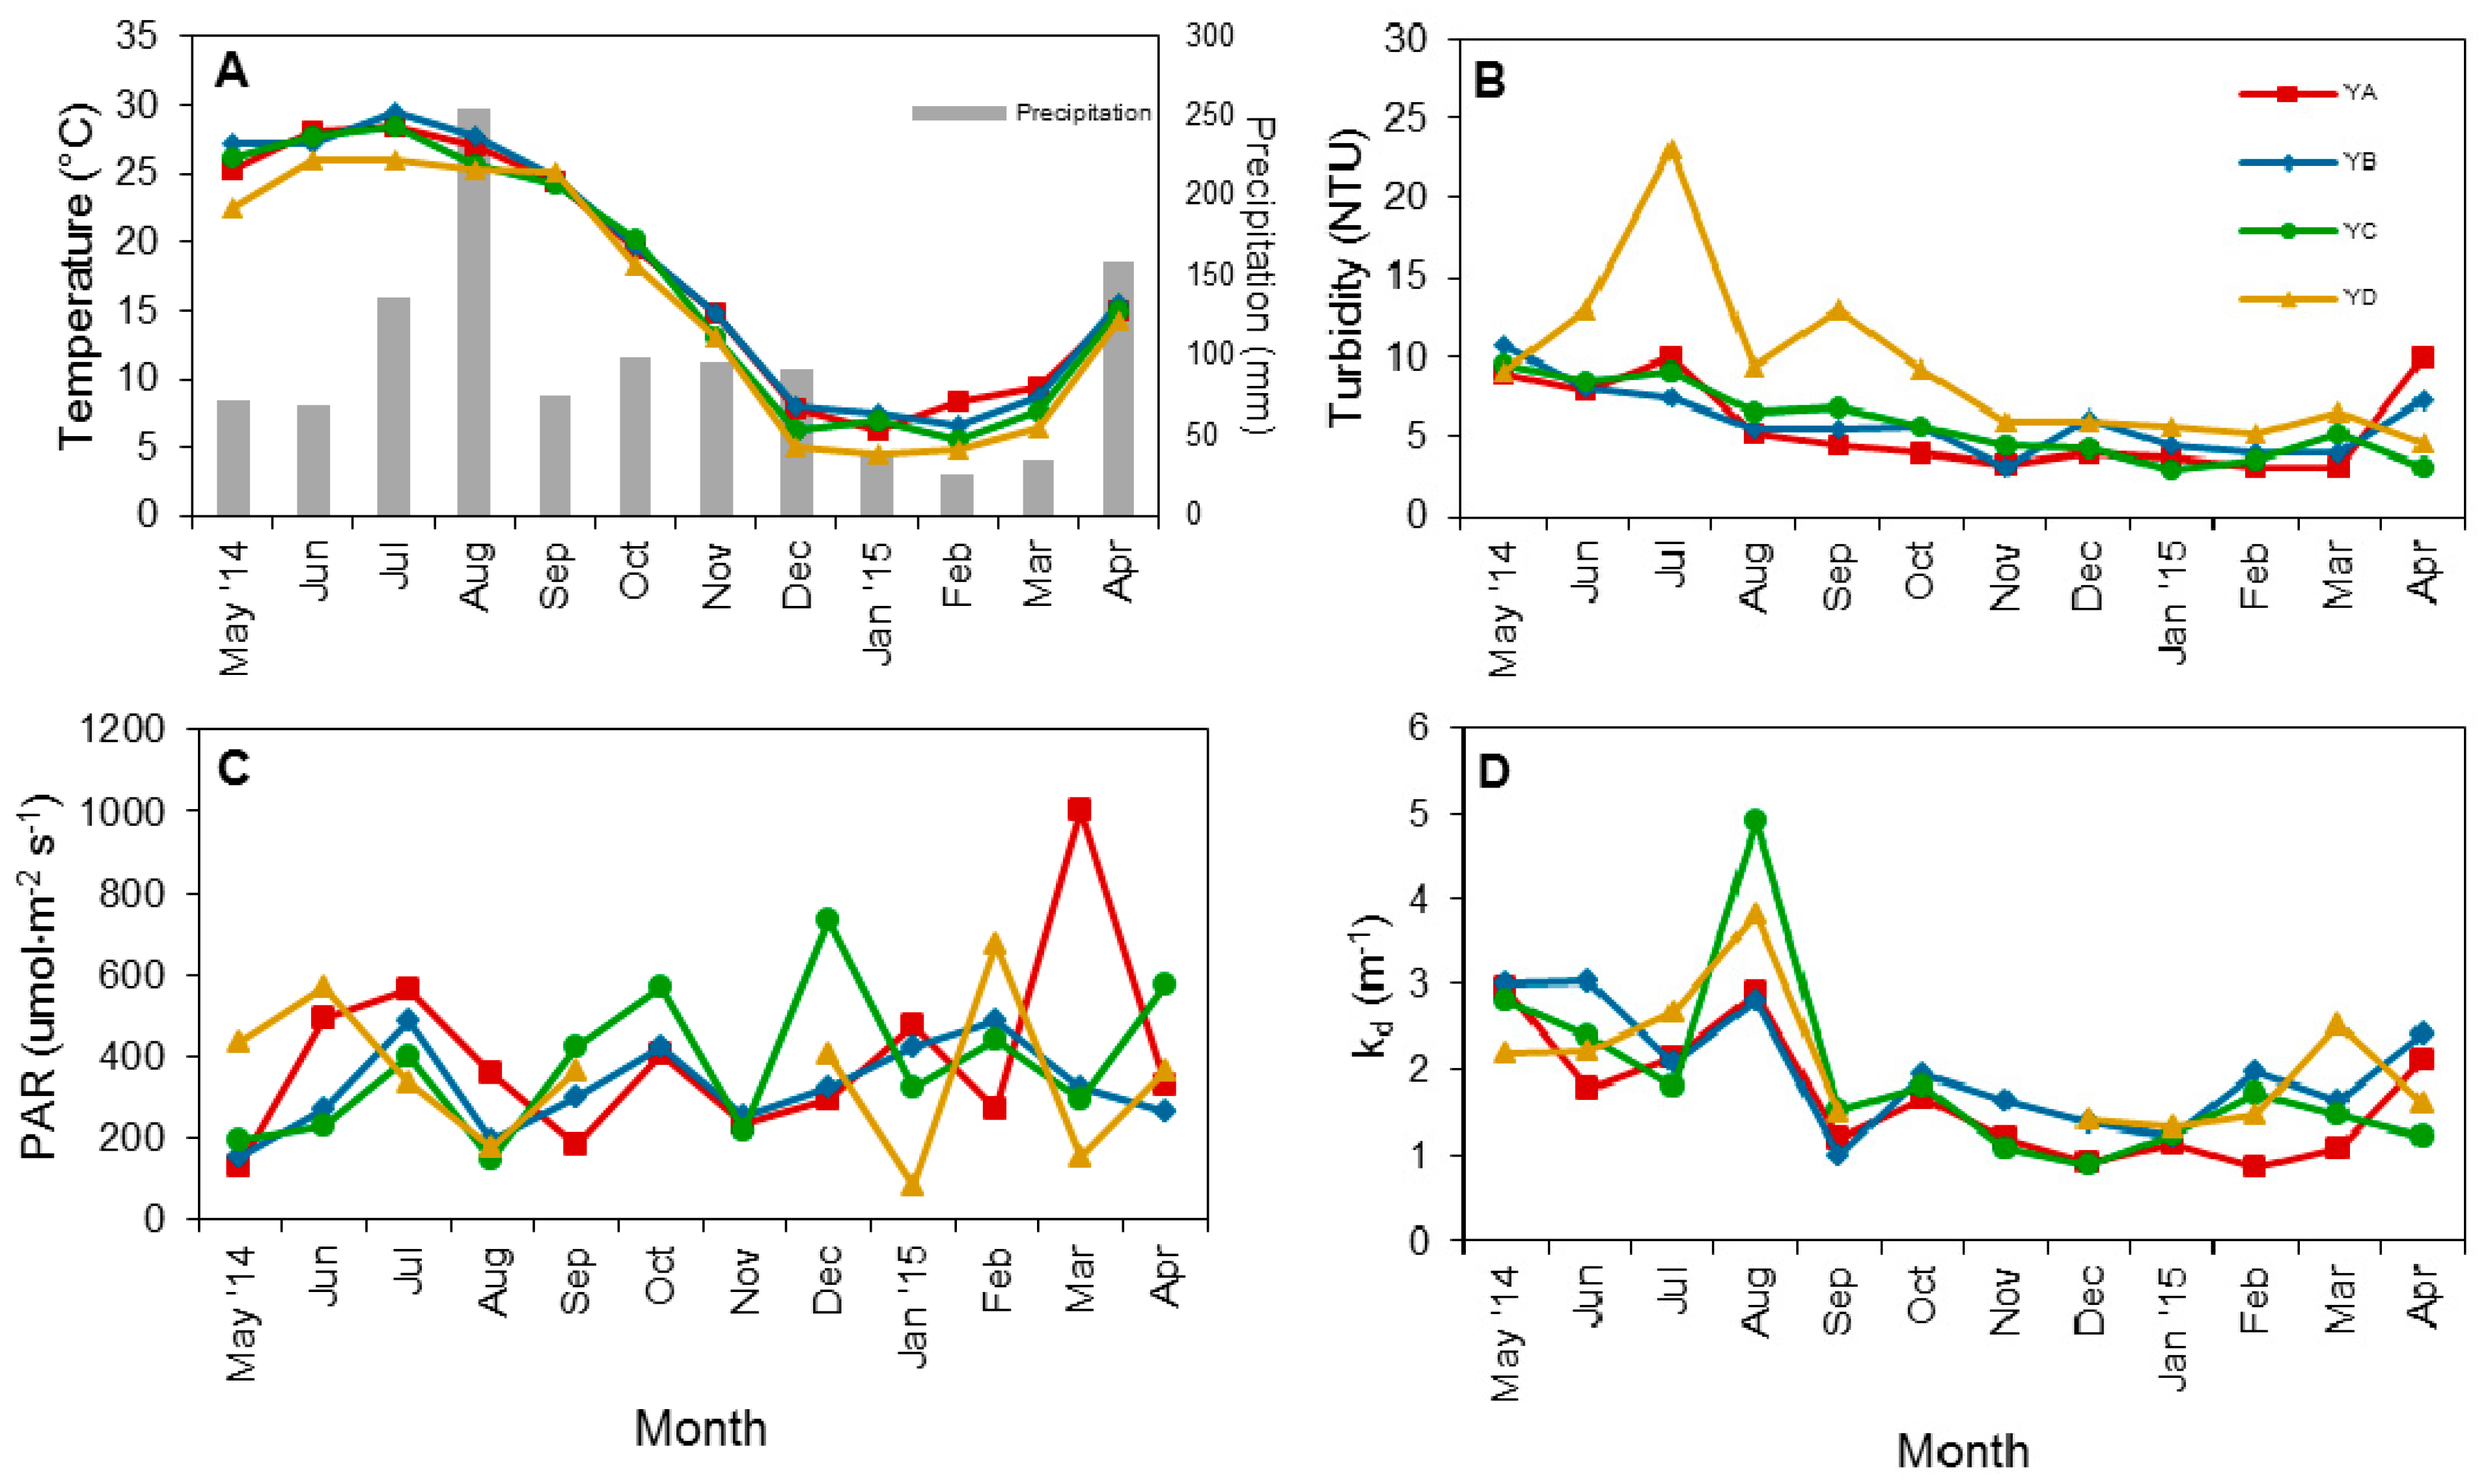
3.1. Physical Factors and Inorganic Nutrient Concentrations

Surface water temperatures followed a general seasonal trend: highest during the summer and lowest in winter (Figure 2A). The highest average precipitation was observed in the summer months of August and July, as well as in April (spring). Turbidity was relatively constant from August to April for stations YA–YC (Figure 2B), whereas turbidity at station YD gradually increased until it peaked in July, then abruptly dropped in August. The turbidity at YD was already stable and low by the end of autumn. PAR at the surface (0.5 m water depth) fluctuated from month to month or every other month (Figure 2C). A peak in the light attenuation coefficient (kd) was recorded during the month of August for all sampling sites, with the highest peak at station YC. The rest of the months were stable, as with the trend in turbidity (Figure 2D).
On a monthly basis, DIN was consistently between 200 and 400 µM, but increased from October to December and peaked in February (Figure 3A). DIN was lowest at station YD and highest at YA and YB (Figure 3B), decreasing in concentration along the downstream course of the river system. DIP concentration (Figure 4A) was highest in July (DIP = 8.17 µM) and August and lowest in June (DIP = 0.17 µM). The concentrations at YA and YB, and YC and YD, were similar (Figure 4B).

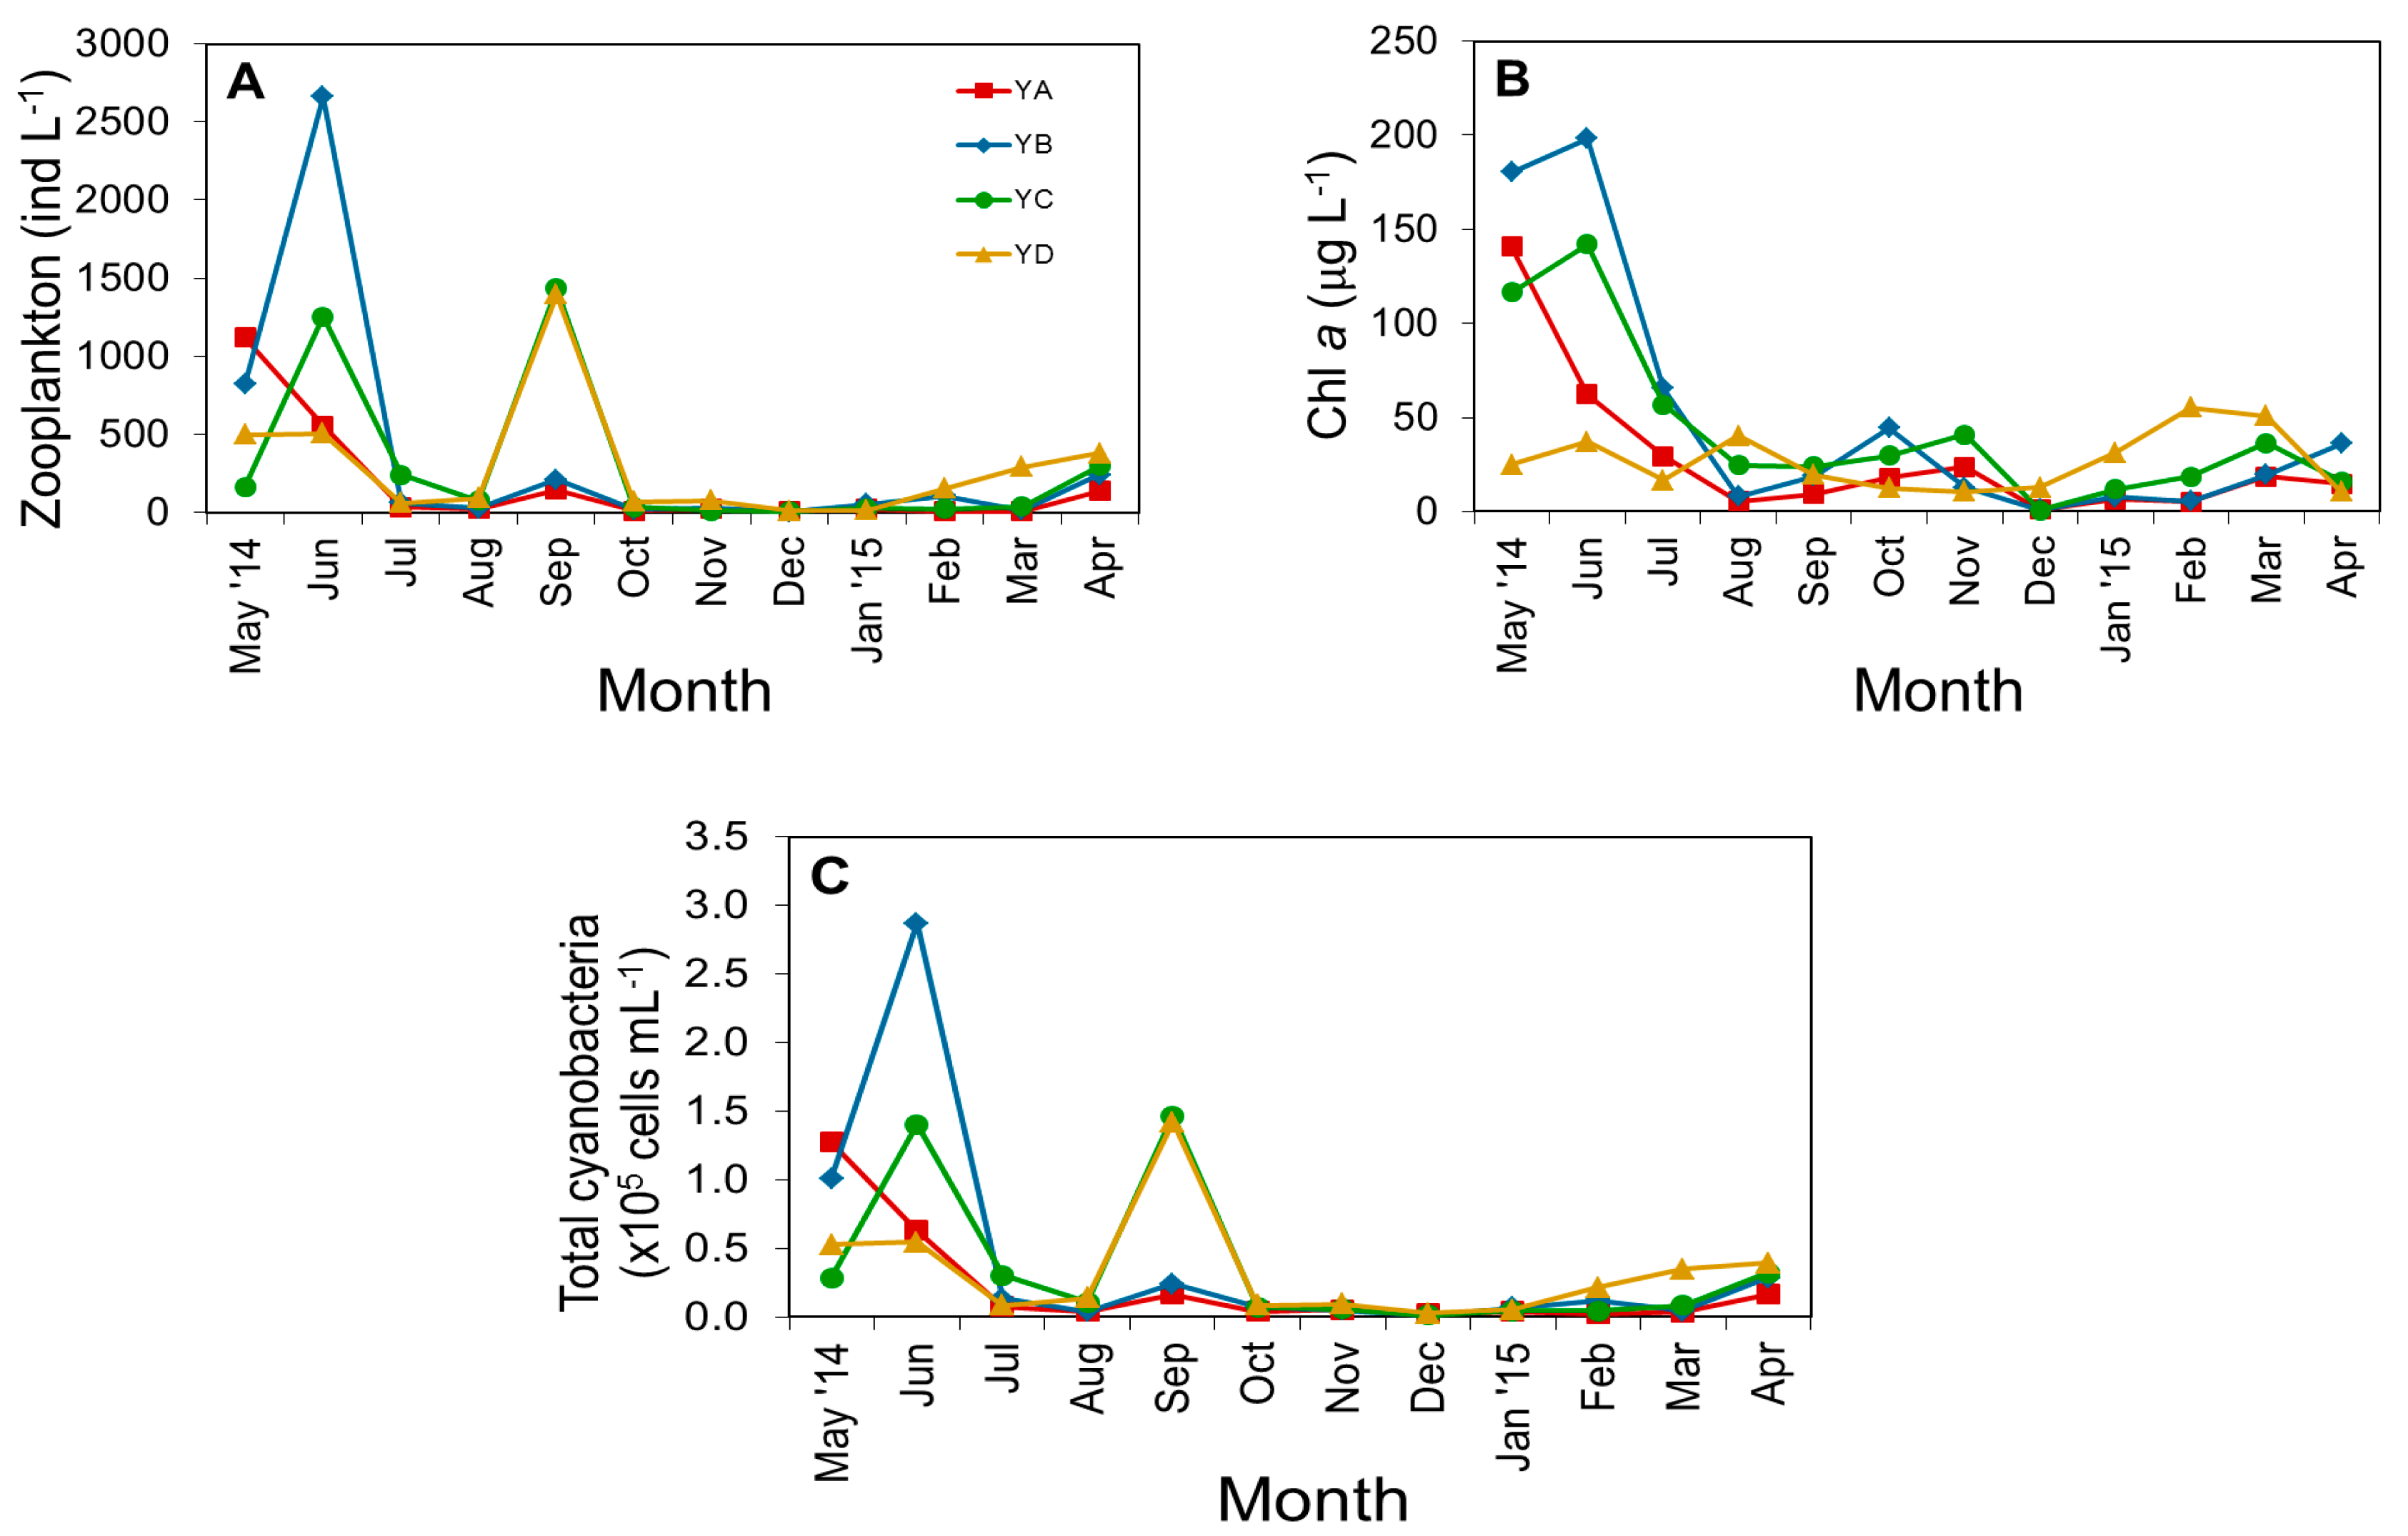
3.2. Biological Parameters

Zooplankton was most abundant in June at station YB (2661 ind·L−1), followed by YC. The second peak of abundance was observed in September at stations YC (1433 ind·L−1) and YD (1395 ind·L−1). Zooplankton species at these stations proliferated either during the onset of summer or in early autumn (Figure 5A). The concentration of Chl a was also prominently high during the early summer at all stations except YD. Lower concentrations of less than 50 µg·L−1 were maintained throughout the remaining months (Figure 5B).
Cyanobacterial count rose during June, with the highest population at station YC, followed by YB (Figure 5C). Abundant cyanobacteria were also observed in September at YC, and a similar trend was confirmed for zooplankton abundance. Overall, there was a clear concurrent trend between stations YB and YC during June. PAR and turbidity values during this month were similar at both stations.

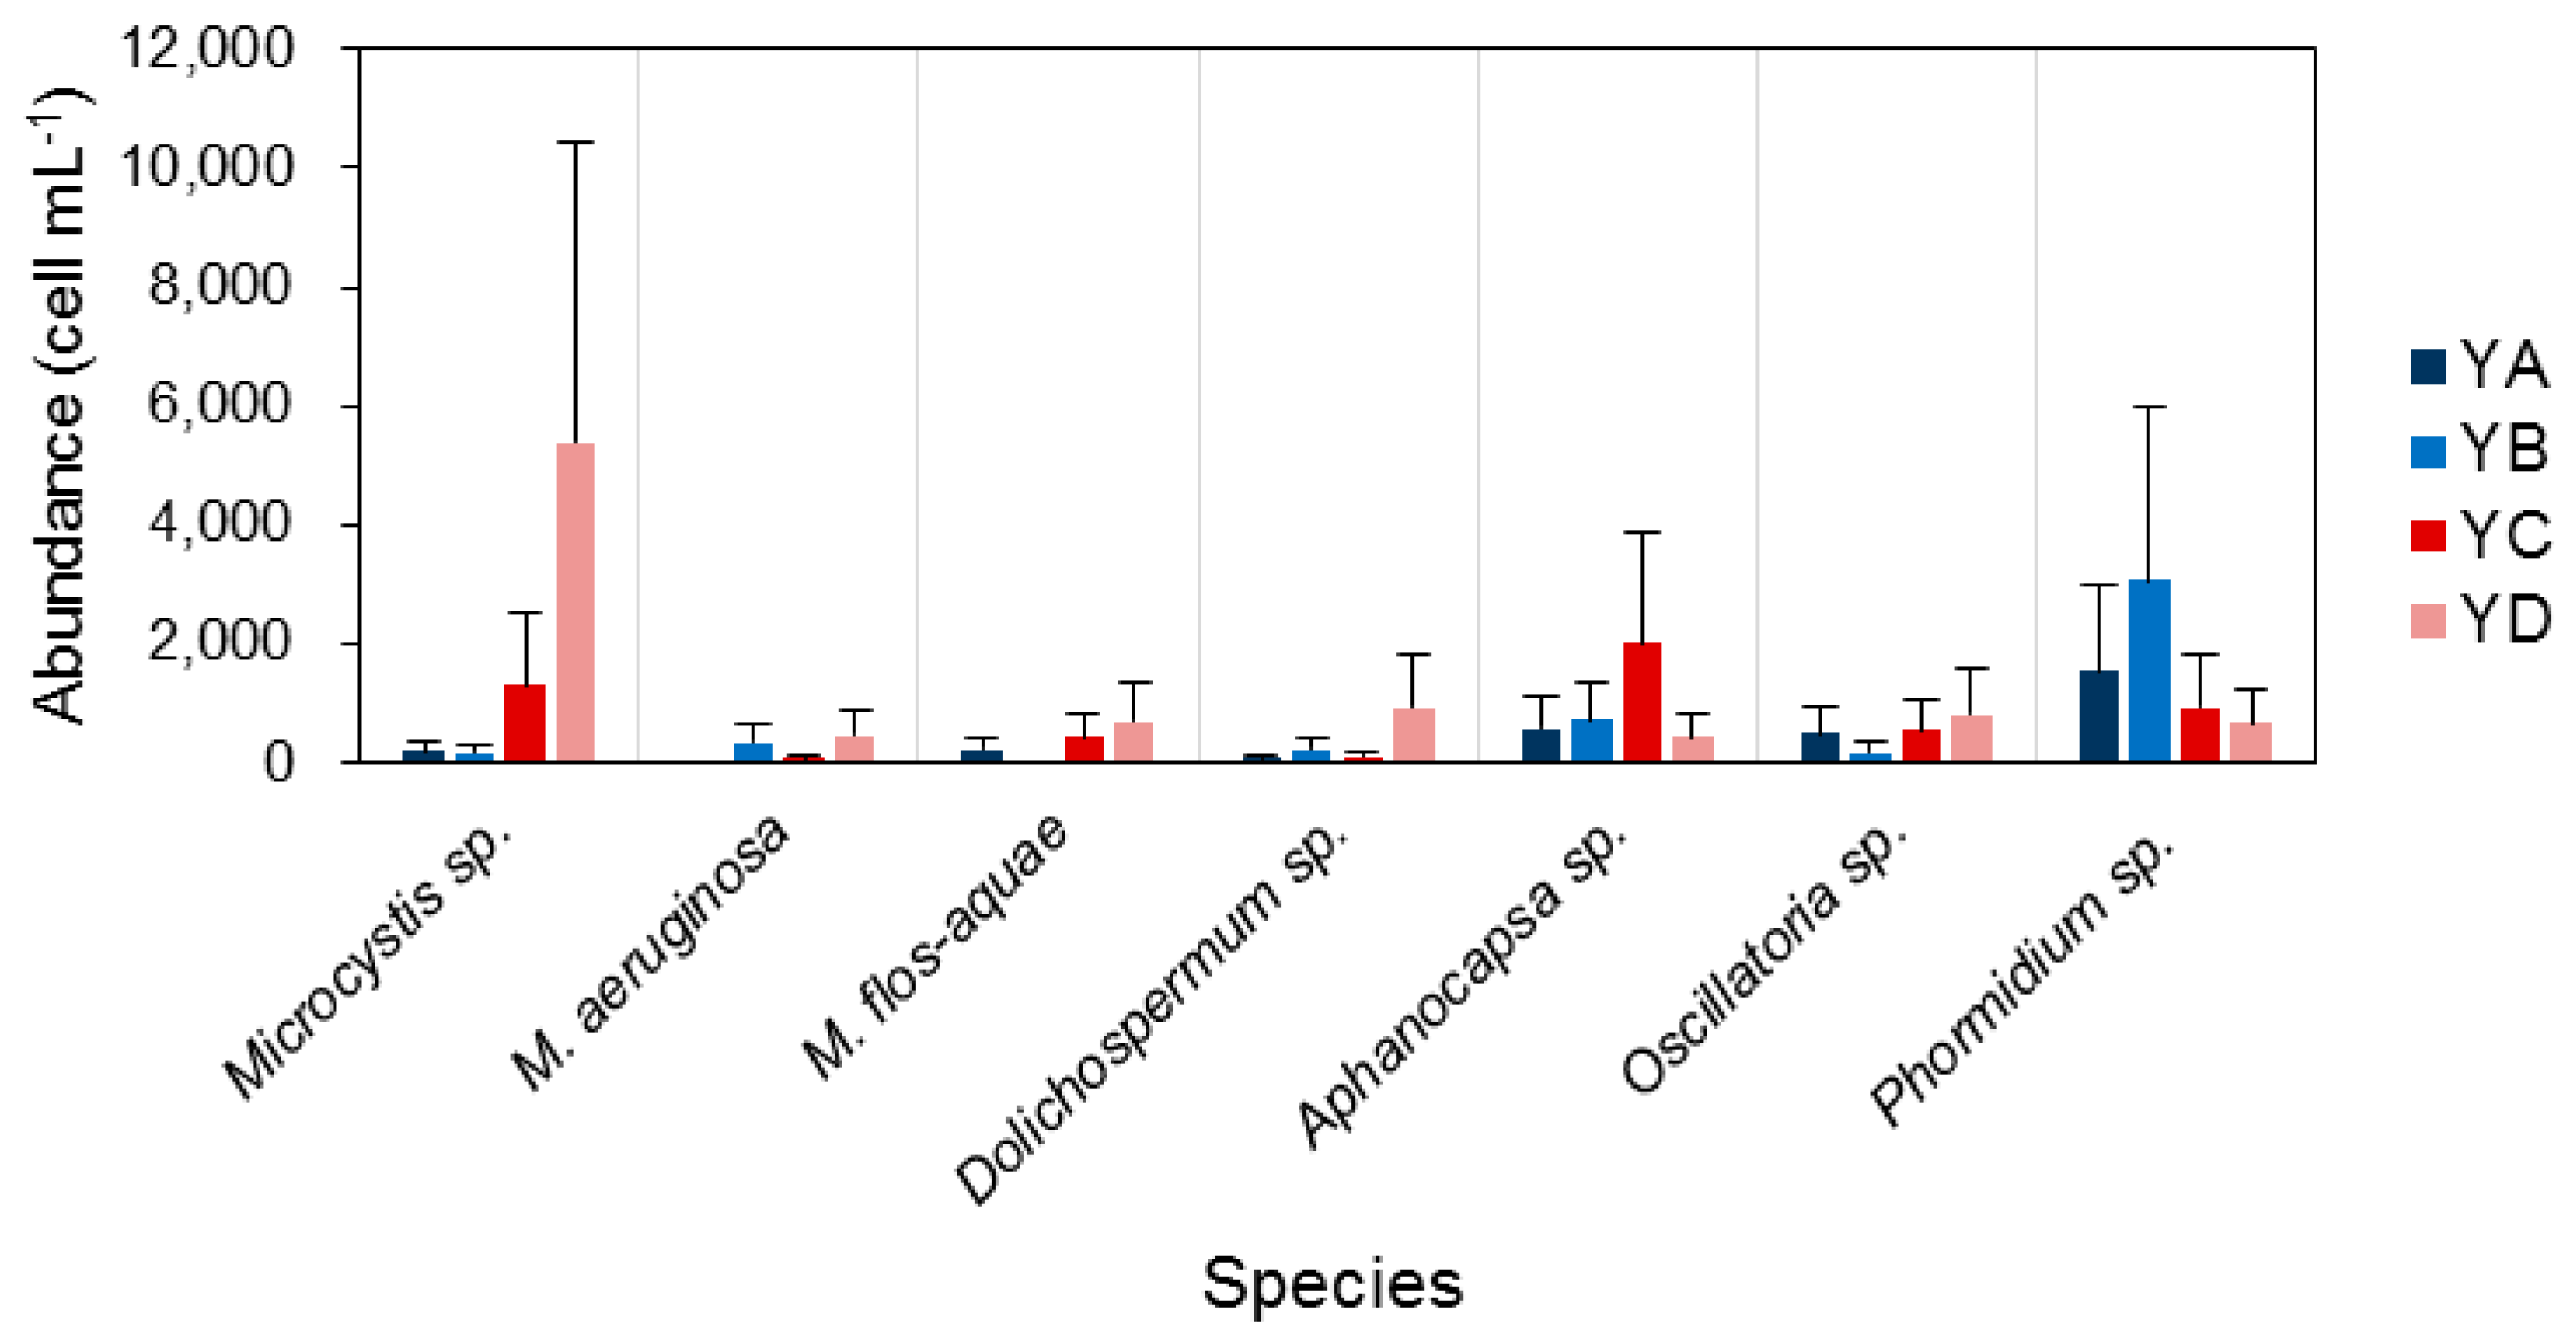
3.3. Spatiotemporal Variation of Potentially Toxic Cyanobacteria

Out of the 28 cyanobacterial species identified (Table S1 in Supplementary Materials), seven were potentially toxic strains classified in previous studies: Microcystis sp., M. aeruginosa, M. flos-aquae, Dolichospermum sp., Aphanocapsa sp., Oscillatoria sp. and Phormidium sp.
Figure 6 displays the abundance of the seven genera and species at different sites. Among the potentially toxic species, Microcystis sp. was the most abundant at station YD, followed by YC, with cell counts of 5365 cells·mL−1 and 1298 cells·mL−1, respectively (Figure 6). Aphanocapsa sp. was primarily found at station YC. The cell count of Phormidium sp. was higher in the upper part of the freshwater zone and steadily decreased downriver. The other species were recorded in the summer months and early autumn (Figure 7). However, the occurrence of Phormidium sp. was more evident during the coldest months of the year.

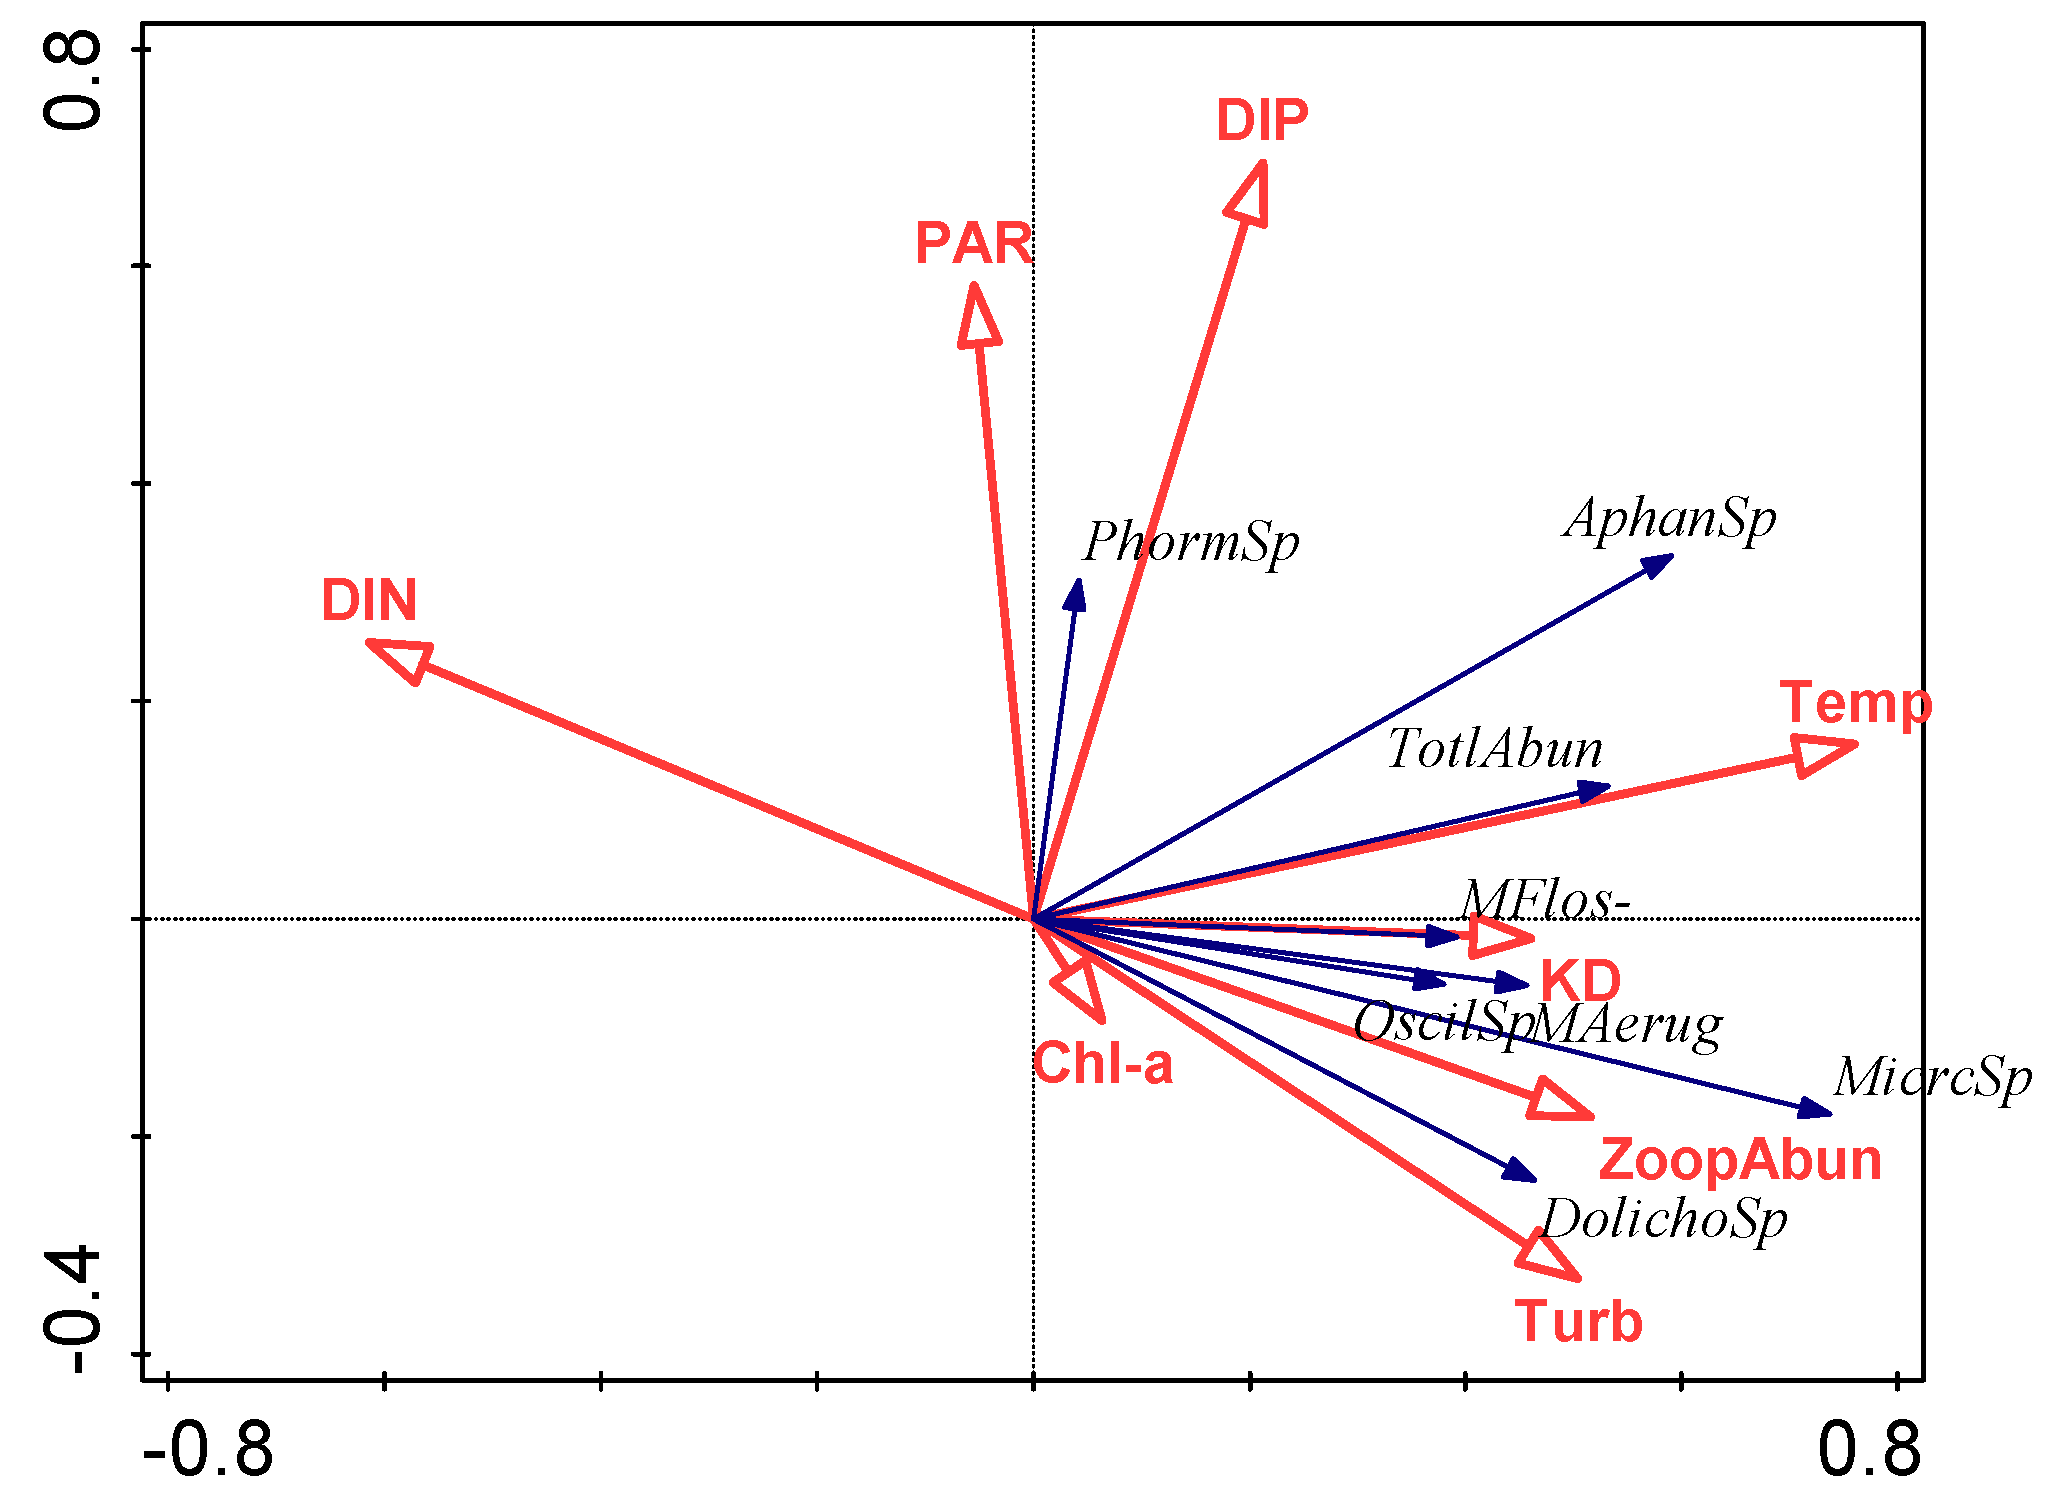
3.4. Relationship between Environmental Factors and Cyanobacterial Species

The gradient length of the first axis was <4, suggesting that the cyanobacterial abundance data were homogenously distributed (Table 1), and therefore, linear methods were used.
The RDA biplot (Figure 8) summarises the relationships among environmental factors and potentially toxic cyanobacteria. The percentages explained by each axis are as follows: Axis 1 = 77.53%, Axis 2 = 14.09%, Axis 3 = 5.70%, and Axis 4 = 2.69%. The Microcystis genus was closely associated with Dolichospermum sp. and Oscillatoria sp. in the RDA analysis. These species were highly positively correlated with turbidity and zooplankton abundance, while displaying negative relationships with DIN. Surface water temperature and the light attenuation coefficient also demonstrated strong relationships with the aforementioned cyanobacterial species. Surface water DIP and PAR were positively related to the abundance of Phormidium sp. Total abundance was highly positively correlated with temperature. The explained variation accounted for 39.3% of the total variability in potentially toxic cyanobacterial abundance (adjusted explained variation = 25.8%). Furthermore, the permutation test (significant at p < 0.05; p = 0.028) confirmed the significance of these relationships.
The interactive forward selection analysis considered all variables in explaining 39.3% of the total variation, the same as that computed by RDA. Of the eight variables considered, three variables appeared to contribute to the overall variation. Table 2 shows the significant explanatory variables governing the abundance of the toxic cyanobacteria species.

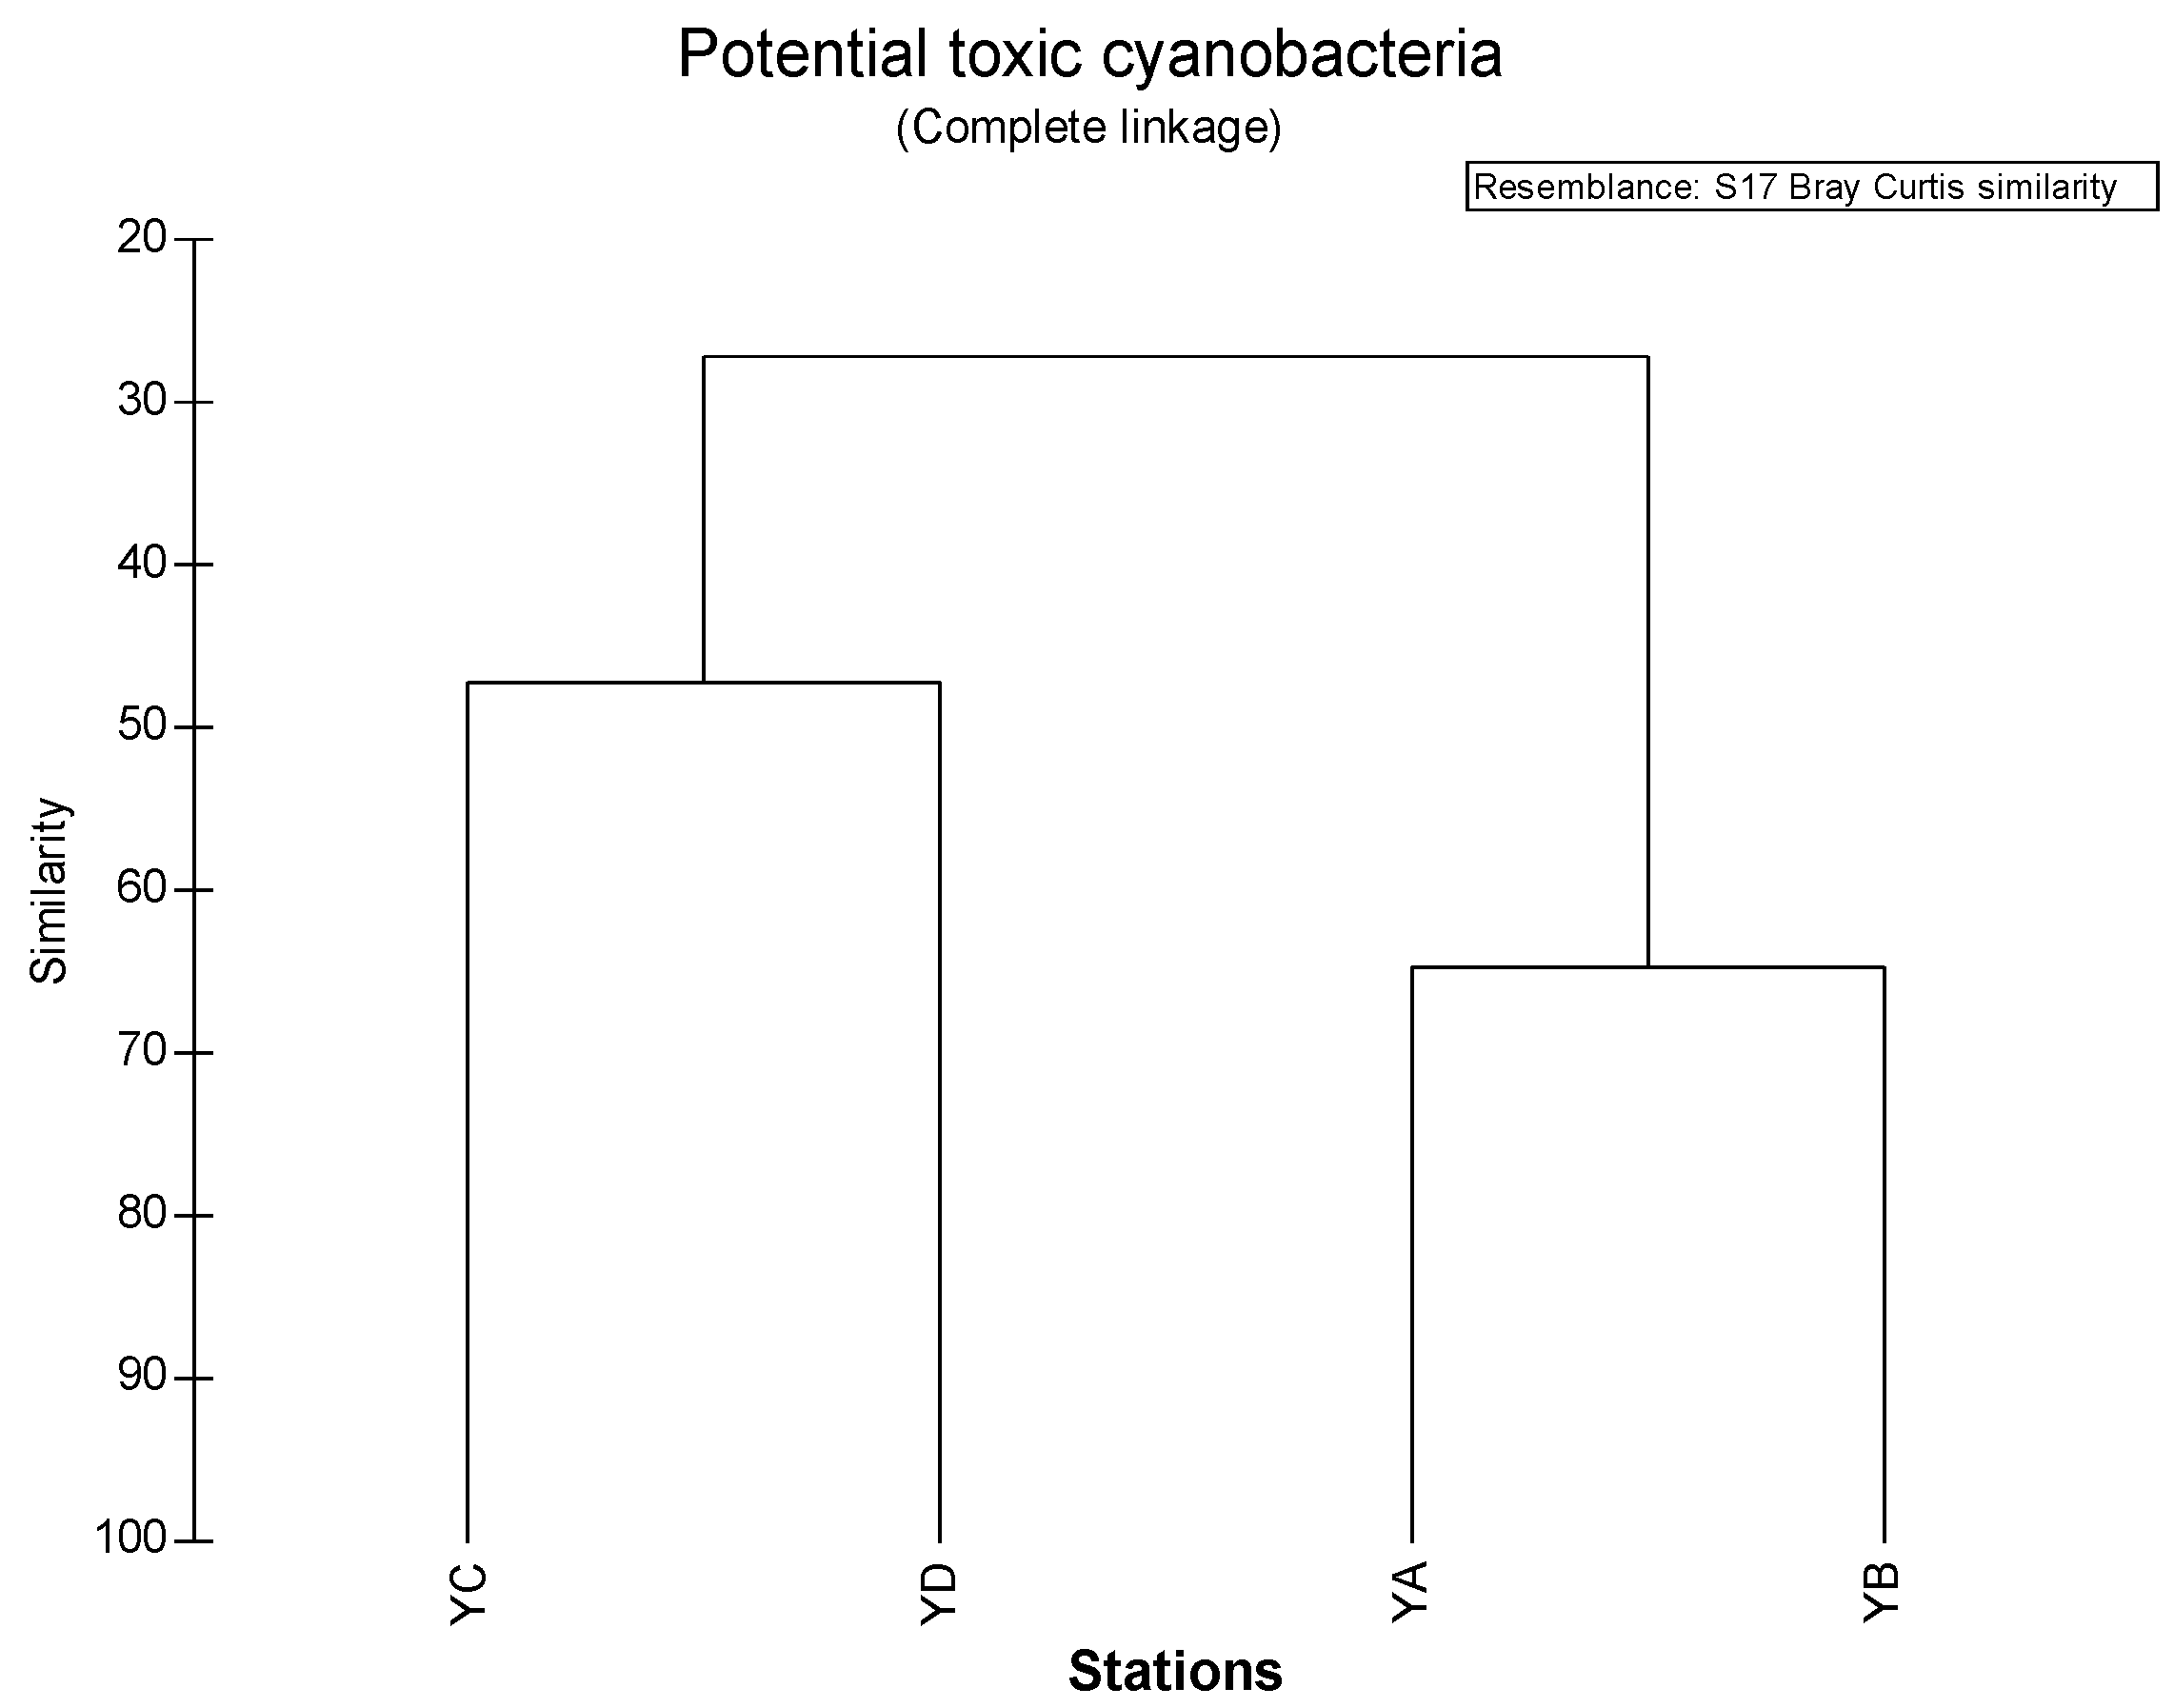
3.5. Similarity among Sampling Sites

Hierarchical cluster analysis among sampling stations (Figure 9) suggested that stations YA and YB were the most similar (Bray Curtis Index (BCI) = 64.64), followed by YC and YD (BCI = 47.16). Integrating the stations into clusters, two groups were composed in which the similarity was very low (BCI = 27.17), indicating that stations near the weirs and those far from the weirs differed in terms of potentially toxic cyanobacterial abundance.
The t-test results (Table 3) also showed that the abundances of Microcystis sp., a dominant genus in the river, and Phormidium sp. were significantly different between the free-flowing (stations YA and YB) and impounded (stations YC and YD) sites. Environmental variables, such as DIN, water temperature, turbidity and zooplankton abundance, were also significantly different. DIN and temperature were higher, whereas turbidity and zooplankton were lower, at the free-flowing than the impounded sites.

4. Discussion

4.1. Temporal and Spatial Dynamics of Cyanobacteria

Temperature, light and nutrient concentration are the major determinants of cyanobacterial temporal variation [35]. Cyanobacteria generally thrive from midsummer to early autumn due to favourably high temperatures and high light intensities [36]. Blooms occur during the period from July to September in tropical settings [37], and summer months (June–August) are the peak season for blooms in temperate regions [38]. This study confirmed that most potentially toxic cyanobacteria occur during the summer months, extending until the onset of autumn. On a spatial scale, the presence of cyanobacterial species varied. Microcystis spp., the most common cyanobacterial species, appear mainly in the upper, freshwater zones of estuaries [39,40]. Their photosynthetic efficiency diminishes while moving down the estuary [41]; therefore, the abundance of the toxic species decreases downstream [21]. However, in this study, the abundance of Microcystis sp. was more evident at station YD. Because YD is near Juksan weir, the weir may contribute to Microcystis abundance by manipulating hydrological factors. In terms of the water column, toxic Microcystis cells are abundant in surface water [42], which may be attributed to their efficient buoyancy regulation relative to other algal species [43].
Potentially toxic Dolichospermum cells have been documented since 1993 in the Swan-Canning River and numerous wetlands in Perth, Australia [44]. This species is known to grow in freshwater to brackish regions [45], suggesting its wide range of adaptability to the different salinity gradients of estuaries. In this study, the abundance of Dolichospermum sp. was most prominent at station YD, close to the Juksan weir. According to Sin and colleagues [46], Dolichospermum sp. dominated in the upper portions of the Youngsan River but was also detected in the seawater zone.
Aphanocapsa sp. is observed in turbid, low water levels [47,48], such as littoral zones of saline lakes [49]. This species thrived well at station YC. The Oscillatoria genus is documented to settle in freshwater areas [50]. Not much difference in abundance was observed among the stations in this study. Phormidium sp. has a competitive advantage in that the species can thrive in the oligotrophic portions or riverine zones [15]. This species was more abundant at stations without weirs.
According to the Korean National Institute of Environmental Research [51], the weirs in the Youngsan River were predicted to increase the residence time of water 1.7–38.8 times. Romo et al. [52] reported that a longer water residence time contributes to cyanobacterial bloom outbreaks. In this context, cyanobacterial blooms may be affected by the presence of weirs in the Youngsan River. Toxic species in this study were mostly observed during the summer season, suggesting that there is probable thermal stratification of the water system, which further promotes propagation of cyanobacterial abundance. The cluster analysis results support the hypothesis that the presence of weirs may affect cyanobacterial abundance, because stations close to the weirs were similar, and those distant from the weirs were grouped together. The t-test also showed that the abundance of Microcystis sp. was significantly higher at the impounded sites (p < 0.05), supporting the hypothesis. On the other hand, the proliferation of Phormidium sp. at the upriver stations rather than the latter stations contradicts the hypothesis about the impact of the presence of weirs on this species, suggesting that the effects of weir construction on spatial variations may be species dependent.

4.2. Effect of Environmental Variables on Cyanobacteria and Potentially Toxic Species

The spatial and temporal variations of algal species are primarily due to the physical and chemical characteristics governing a particular system [35,46]. In this study, temperature, inorganic nitrogen, and zooplankton abundance were associated with variation in the cyanobacterial species based on the forward selection method. Temperature accounted for 45.2% of the total variability in potentially toxic cyanobacterial species in the upper riverine region of the Youngsan River estuary. The Kruskal-Wallis test confirmed a significant difference in cyanobacterial abundance among the different seasons (p < 0.05; Table S2). A positive relationship between blue-green algae and water temperature has been widely documented. The optimal growth rate of cyanobacteria usually occurs in warm conditions around 20–30 °C [53,54]. Microcystis blooms in the Youngsan River estuary developed in the range of 24–27 °C, conforming to the established findings. Unlike most cyanobacteria, Phormidium sp. thrived during the colder months. Phormidium sp. is known to grow well at temperatures ranging from 4 to 20 °C [55]. Temperature is a crucial element to emphasise because of the ongoing issue of global climate change. The Korea Ministry of Environment [56] reported the proliferation of harmful cyanobacterial cells in mid-May 2015, earlier than their usual appearance. One reason for this was the slight increase in temperature over the past years. Continuous temperature elevation over the years may promote the occurrence of cyanobacteria, especially toxic strains. The temperature effect is correlated with toxin formation. In mixed cultures, the abundance of toxic strains was often higher than non-toxic strains when exposed to higher temperatures [57,58]. Increases in temperature concurrent with increases in phosphorus concentration intensify the occurrence of toxic Microcystis populations [59].
For nutrient concentrations, the RDA biplot illustrated the negative relationship of DIN to most species. DIN was also significantly higher at the free-flowing than at the impounded sites, whereas Microcystis sp. abundance was lower. It is inferred that nitrogen may contribute to increases in cyanobacterial species. Cyanobacterial occurrence can be influenced by the concentrations of nitrogen or phosphorus, or both [60]. Although there was a significant negative correlation, the amount of DIN was still high for a riverine system (200–800 µM); therefore, nitrogen may not be a limiting nutrient. The DIP concentration was also too high to be considered a limiting nutrient.
Zooplankton abundance and most of the toxic cyanobacterial species in this study were linked in a positive relationship. A similar pattern was reported by Jia et al. [61]. Zooplankton and Microcystis sp. abundances were also higher at the impounded sites near the weirs than at the free-flowing sites, suggesting that when a high abundance of cyanobacteria was recorded, enough food was supplied for zooplankton communities. Another possible explanation is the presence of other phytoplankton species as food sources.
Because the environmental variables explained only 39% of the variability of cyanophytes in the RDA analysis, other possible regulatory factors should be explored, such as hydrodynamics [62], and other biological communities (e.g., bacteria) [63].

5. Conclusions

Seven potentially toxic cyanobacteria were identified, including Microcystis sp., M. aeruginosa, M. flos-aquae, Dolichospermum sp., Aphanocapsa sp., Oscillatoria sp. and Phormidium sp. A high incidence of Microcystis spp. was observed in the early summer, whereas Phormidium sp. thrived during the colder months. Although variables such as zooplankton and DIN contributed to the overall variations, their effects on cyanobacterial abundance remain unclear. Therefore, temperature is the major determinant of potentially toxic cyanobacteria variation (especially temporal). Sampling stations near the weirs had higher similarity with each other and higher abundances of potentially toxic cyanobacteria than did the sites with no weirs, suggesting that the presence of weirs might have an effect on potentially toxic cyanobacterial species, especially Microcystis spp. Further studies incorporating a time series before and after weir construction should be conducted to strengthen our understanding of the effects of weirs on cyanobacteria.

Supplementary Materials

The following are available online at www.mdpi.com/2073-4441/9/11/819/s1, Table S1: Cell abundance (mean ± SD, cell·mL−1) of the cyanobacteria species observed during sampling (n = 12). Potentially toxic species are marked by (*), Table S2: Kruskal-Wallis test of the variation of potentially toxic cyanobacterial abundance among the seasons. Monthly data were grouped into four seasons.

Acknowledgments

This research was supported by the Basic Science Research Program through the National Research Foundation of Korea (NRF), funded by the Ministry of Education (2015R1D1A1A01060341).

Author Contributions

Yongsik Sin and Jacqueline Martha Malazarte were in charge of the formulation, writing and analysis of the paper. Hakyoung Lee identified the cyanobacterial species. Hyun-Woo Kim provided the zooplankton data.

Conflicts of Interest

The authors declare no conflicts of interest.

References

  1. Awramik, S. The oldest records of photosynthesis. Photosynth. Res. 1992, 33, 75–89. [Google Scholar] [CrossRef] [PubMed]
  2. Matsui, K.; Nazifi, E.; Hirai, Y.; Wada, N.; Matsugo, S.; Sakamoto, T. The cyanobacterial UV-absorbing pigment scytonemin displays radical-scavenging activity. J. Gen. Appl. Microbiol. 2012, 58, 137–144. [Google Scholar] [CrossRef] [PubMed]
  3. Klemer, A.; Cullen, J.; Mageau, M.; Hanson, K.; Sundell, R. Cyanobacterial Buoyancy Regulation: The paradoxical roles of carbon. J. Phycol. 1996, 32, 47–53. [Google Scholar] [CrossRef]
  4. Lopez-Rodas, V.; Maneiro, E.; Costas, E. Adaptation of cyanobacteria and microalgae to extreme environmental changes derived from anthropogenic pollution. Limnetica 2006, 25, 403–410. [Google Scholar]
  5. Su, M.; Yu, J.; Pan, S.; An, W.; Yang, M. Spatial and temporal variations of two cyanobacteria in the mesotrophic Miyun reservoir, China. J. Environ. Sci. 2014, 26, 289–298. [Google Scholar] [CrossRef]
  6. Zhang, M.; Zhang, Y.; Yang, Z.; Wei, L.; Yang, W.; Chen, C.; Kong, F. Spatial and seasonal shifts in bloom-forming cyanobacteria in Lake Chaohu: Patterns and driving factors. Phycol. Res. 2015, 64, 44–55. [Google Scholar] [CrossRef]
  7. Bormans, M.; Ford, P.; Fabbro, L. Spatial and temporal variability in cyanobacterial populations controlled by physical processes. J. Plankton Res. 2005, 27, 61–70. [Google Scholar] [CrossRef]
  8. Harris, J.; Vinobaba, P.; Kularatne, R.; Kankanamge, C. Spatial and temporal distribution of cyanobacteria in Batticaloa Lagoon. J. Environ. Sci. 2016, 47, 211–218. [Google Scholar] [CrossRef] [PubMed]
  9. Mur, L.; Skulberg, O.; Utkilen, H. Chapter 2: Cyanobacteria in the environment. In Toxic Cyanobacteria in Water: A Guide to Their Public Health Consequences, Monitoring and Management; Chorus, I., Bartram, J., Eds.; World Health Organization (WHO): Geneva, Switzerland, 1999. [Google Scholar]
  10. Paerl, H.; Hall, N.; Calandrino, E. Controlling harmful cyanobacterial blooms in a world experiencing anthropogenic and climatic-induced change. Sci. Total Environ. 2011, 409, 1739–1745. [Google Scholar] [CrossRef] [PubMed]
  11. Conley, D.; Paerl, H.; Howarth, R.; Boesch, D.; Seitzinger, S.; Havens, K.; Lancelot, C.; Likens, G. Controlling Eutrophication: Nitrogen and Phosphorus. Science 2009, 323, 1014–1015. [Google Scholar] [CrossRef] [PubMed]
  12. Suurnakki, S.; Gomez-Saez, G.V.; Rantala-Ylinen, A.; Jokela, J.; Fewer, D.P.; Sivonen, K. Identification of geosmin and 2-methylisoborneol in cyanobacteria and molecular detection methods for the producers of these compounds. Water Res. 2015, 68, 56–66. [Google Scholar] [CrossRef] [PubMed]
  13. Juttner, F.; Watson, S. Biochemical and ecological control of geosmin and 2-Methylisoborneol in source waters. Appl. Environ. Microbiol. 2007, 73, 4395–4406. [Google Scholar] [CrossRef] [PubMed]
  14. Yan, Q.; Bi, Y.; Deng, Y.; He, Z.; Wu, L.; Nostrand, J.; Shi, Z.; Li, J.; Xi, W.; Hu, Z.; et al. Impacts of the Three Gorges Dam on microbial structure and potential function. Sci. Rep. 2015, 5, 8605. [Google Scholar] [CrossRef] [PubMed]
  15. Heath, M.; Wood, S.; Ryan, K. Spatial and temporal variability in Phormidium mats and associated anatoxin-a and homoanatoxin-a in two New Zealand rivers. Aquat. Microb. Ecol. 2011, 64, 69–79. [Google Scholar] [CrossRef]
  16. Miranda, R.; Oscoz, J.; Leunda, P.; Garcia-Fresca, C.; Escala, M.C. Effects of weir construction on fish population structure in the River Erro (North of Spain). Ann. Limnol. Int. J. Limnol. 2005, 41, 7–13. [Google Scholar] [CrossRef]
  17. McCarthy, B.; Gawne, B.; Meredith, S.; Roberts, J.; Williams, D. Effects of Weirs in the Mallee Tract of the River Murray; MDFRC Technical Report; Murray-Darling Freshwater Research Centre: Wodonga, Australia, 2004. [Google Scholar]
  18. Thackeray, S. Plankton: A Guide to their Ecology and Monitoring for Water Quality. J. Fish Biol. 2010, 76, 1869–1870. [Google Scholar] [CrossRef]
  19. Swan River Trust. Seasonal nutrient dynamics in the canning river and estuary, 1995–98. River Sci. 2002, 2, 1–12. [Google Scholar]
  20. Chan, T.; Hamilton, D.; Robson, B.; Hodges, B.; Dallimore, C. Impacts of hydrological changes on phytoplankton succession in the Swan River, Western Australia. Estuaries 2002, 25, 1406–1415. [Google Scholar] [CrossRef]
  21. Characteristics and Control of Algal Blooms in the Youngsan and Sumjin River Basins; Korea Ministry of Environment: Sejong, Korea, 2015.
  22. Yeongsan River Flood Control Office. Available online: www.yeongsanriver.go.kr (accessed on 4 June 2016).
  23. Kang, J.H.; Lee, S.W.; Cho, K.H.; Seo, S.J.; Cha, S.M.; Kim, J.H. Linking land-use type and stream water quality using spatial data of fecal indicator bacteria and heavy metals in the Yeongsan river basin. Water Res. 2010, 44, 4143–4157. [Google Scholar] [CrossRef] [PubMed]
  24. Hötzel, G.; Croome, R. A Phytoplankton Methods Manual for Australian Freshwaters; Land and Water Resources Research and Development Corporation (LWRRDC): Canberra, Australia, 1999. [Google Scholar]
  25. Swineheart, D. The Beer-Lambert Law. J. Chem. Educ. 1962, 39, 333. [Google Scholar] [CrossRef]
  26. Kolzau, S.; Wiedner, C.; Rucker, J.; Kohler, J.; Kohler, A.; Dolman, A. Seasonal Patterns of Nitrogen and Phosphorus Limitation in Four German Lakes and the Predictability of Limitation Status from Ambient Nutrient Concentrations. PLoS ONE 2014, 9, e96065. [Google Scholar] [CrossRef] [PubMed]
  27. Arar, E.J.; Collins, G.B. In Vitro Determination of Chlorophyll a and Phaeophytin in Marine and Freshwater Algae by Fluorescence. In Methods for the Determination of Chemical Substances of Marine and Estuarine Environmental Matrices, 2nd ed.; U.S. Environmental Protection Agency: Cincinnati, OH, USA, 1997. [Google Scholar]
  28. Voigt, M.; Koste, W. Rotatoria: Die Räderiere Mitteleuropas, ein Bestimmungswerk: Überordnung Monogononta; Bornträger: Stuttgart, Germany, 1978. (In German) [Google Scholar]
  29. Smirnov, N.N.; Timms, B.V. A Revision of the Australian Cladocera (Crustacea); The Australian Museum: Sydney, Australia, 1983; Volume 1, pp. 1–132. [Google Scholar]
  30. Einsle, U. Crustacea, Copepoda: Calanoida und Cyclopoida; Gustav Fischer Verlag: Stuttgart, Germany, 1993. (In German) [Google Scholar]
  31. Protocol for Phytoplankton Sampling. Protocols Manual for Water Quality Sampling in Canada. Canadian Council of Ministers of the Environment: Canada, 2011. Available online: http://www.ccme.ca/files/Resources/water/water_quality/protocols_document_e_final_101.pdf (accessed on 10 July 2017).
  32. Hirose, H.M.; Akiyama, T.; Imahori, K.; Kasaki, H.; Kumano, S.; Kobayasi, H.; Takahashi, E.; Tsumura, T.; Hirano, M.; Yamagishi, T. Illustrations of the Japanese Freshwater Algae; Uchidarokakuho Publ Co., Ltd.: Tokyo, Japan, 1977. [Google Scholar]
  33. Komarek, J.; Anagnostidis, K. Cyanoprokaryota Teil 2: Oscillatoriales; Budel, B., Krienitz, L., Gartner, G., Schagerl, M., Eds.; Spektrum Akademischer Verlag: Heidelberg, Germany, 2005; p. 750. [Google Scholar]
  34. Komárek, J.; Anagnostidis, K. Cyanoprokaryota Teil 2 Chroococcales; Ettl, H., Gärtner, G., Heynig, H., Mollenhauer, D., Eds.; Spektrum Akademischer Verlag: Heidelberg, Germany, 1998; Volume 19, p. 548. [Google Scholar]
  35. Wetzel, R. Limnology: Lake and River Ecosystems, 3rd ed.; Elsevier: Amsterdam, The Netherlands, 2001. [Google Scholar]
  36. Graham, J.; Loftin, K.; Ziegler, A.; Meyer, M. Cyanobacteria in Lakes and Reservoirs: Toxin and Taste-and-Odor Sampling Guidelines; U.S. Geological Survey: Reston, VA, USA, 2008.
  37. Zakeel, M.; Weerasinghe, P.; Kumari, B.; Wickremasinghe, H. Spatial and temporal dynamics and parameters of growth of toxic cyanobacteria in Nuwara wewa and Nachchaduwa wewa in Sri Lanka. Am. J. Environ. Prot. 2015, 4, 23–28. [Google Scholar] [CrossRef]
  38. Guidelines for Safe Recreational Water Environments Volume 1 Coastal and Fresh Waters; World Health Organization: Geneva, Switzerland, 2003.
  39. Lehman, P.W.; Kendall, C.; Guerin, M.A.; Young, M.B.; Silva, S.R.; Boyer, G.L.; Teh, S.J. Characterization of the Microcystis bloom and its Nitrogen Supply in the San Francisco Estuary using Stable Isotopes. Estuar. Coasts 2015, 38, 165–178. [Google Scholar] [CrossRef]
  40. Sellner, K.G.; Lacouture, R.V.; Parrish, C.R. Effects of increasing salinity on a cyanobacteria bloom in the Potomac River estuary. J. Plankton Res. 1988, 10, 49–61. [Google Scholar] [CrossRef]
  41. Paerl, H.W.; Bland, P.T.; Blackwell, J.H.; Bowles, N.D. The Effects of Salinity on the Potential of a Blue-Green Algal (Microcystis aeruginosa) Bloom in the Neuse Estuary; N.C. Working Paper 84-1; UNC Sea Grant College Program: Raleigh, NC, USA, 1984. [Google Scholar]
  42. Baxa, D.; Kurobe, T.; Ger, K.; Lehman, P.; Teh, S. Estimating the abundance of toxic Microcystis in the San Francisco Estuary using quantitative real-time PCR. Harmful Algae 2010, 9, 342–349. [Google Scholar] [CrossRef]
  43. Walsby, A.E.; McAllister, G.K. Buoyancy Regulation by Microcystis in Lake Okaro. N. Z. J. Mar. Freshw. Res. 1987, 21, 521–524. [Google Scholar] [CrossRef]
  44. John, J.; Kemp, A. Cyanobacterial Blooms in the Wetlands of the Perth region, Taxonomy and Distribution: An Overview. J. R. Soc. West. Aust. 2006, 89, 51–56. [Google Scholar]
  45. Stanne, S.; Panetta, R.; Forist, B. The Hudson: An Illustrated Guide to the Living River; Rutgers University Press: New Brunswick, NJ, USA, 1996. [Google Scholar]
  46. Sin, Y.; Lee, E.; Lee, Y.; Shin, K. The river-estuarine continuum of nutrients and phytoplankton communities in an estuary physically divided by a sea dike. Estuar. Coast Shelf Sci. 2015, 163, 279–289. [Google Scholar] [CrossRef]
  47. Teixeira, L.M.; Bohnenberger, J.; Rodrigues, L.; Schulz, U.; Marques, D.; Crossetti, L. Temporal variability determines phytoplankton structure over spatial organization in a large shallow heterogeneous subtropical lake. Inland Waters 2016, 6, 325–335. [Google Scholar]
  48. Kihwele, E.S.; Lugomela, C.; Howell, K.M.; Nonga, H.E. Spatial and Temporal Variations in the Abundance and Diversity of Phytoplankton in Lake Manyara, Tanzania. Int. J. Innov. Stud. Aquat. Biol. Fish 2015, 1, 1–14. [Google Scholar]
  49. Bryanskaya, A.V.; Malup, T.; Lazareva, E.; Peltek, S. The role of environmental factors for the composition of microbial communities of saline lakes in the Novosibirsk region (Russia). BMC Microbiol. 2016, 16, S4. [Google Scholar] [CrossRef] [PubMed]
  50. Graneli, E.; Turner, T. Ecology of Harmful Algae; Springer: Berlin, Germany, 2007. [Google Scholar]
  51. Simulation Results of the Residence Time of Water in the Four Major Rivers Report; Korean National Institute of Environmental Research: Incheon, Korea, 2013.
  52. Romo, S.; Soria, J.; Fernandez, F.; Ouahid, Y.; Baron-Sola, A. Water residence time and the dynamics of toxic cyanobacteria. Freshw. Biol. 2013, 58, 513–522. [Google Scholar] [CrossRef]
  53. Lurling, M.; Eshetu, F.; Faassen, E.; Kosten, S.; Huszar, V. Comparison of cyanobacterial and green algal growth rates at different temperatures. Freshw. Biol. 2013, 58, 552–559. [Google Scholar] [CrossRef]
  54. Konopka, A.; Brock, T. Effect of temperature on Blue-Green Algae (Cyanobacteria) in Lake Mendota. Appl. Environ. Microbiol. 1978, 36, 572–576. [Google Scholar] [PubMed]
  55. McAllister, T. Environmental Factors That Promote Phormidium Blooms in Canterbury Rivers; Waterways Centre for Freshwater Management: Christchurch, New Zealand, 2014. [Google Scholar]
  56. Korea Ministry of Environment. Status of cyanobacterial blooms and management in Korea. In Proceedings of the International Symposium on Freshwater Ecology, Chuncheon, Korea, 16 October 2015. [Google Scholar]
  57. Dziallas, C.; Grossart, H.P. Increasing oxygen radicals and water temperature select for toxic Microcystis sp. PLoS ONE 2011, 6, e25569. [Google Scholar] [CrossRef] [PubMed]
  58. Imai, H.; Chang, K.; Nakano, S. Growth Responses of Harmful Algal Species Microcystis (Cyanophyceae) under Various Environmental Conditions. In Interdisciplinary Studies on Environmental Chemistry—Environmental Research in Asia; TerraPub: Tokyo, Japan, 2009; pp. 269–275. [Google Scholar]
  59. Davis, T.; Berry, D.; Boyer, G.; Gobler, C. The effects of temperature and nutrients on the growth and dynamics of toxic and non-toxic strains of Microcystis during cyanobacterial blooms. Harmful Algae 2009, 8, 715–725. [Google Scholar] [CrossRef]
  60. Elser, J.; Marzolf, E.; Goldman, C. Phosphorus and nitrogen limitation of phytoplankton growth in the freshwaters of North America: A review and critique of experimental enrichments. Can. J. Fish Aquat. Sci. 1990, 47, 1468–1477. [Google Scholar] [CrossRef]
  61. Jia, J.; Shi, W.; Chen, Q.; Lauridsen, T. Spatial and temporal variations reveal the response of zooplankton to cyanobacteria. Harmful Algae 2017, 64, 63–73. [Google Scholar] [CrossRef] [PubMed]
  62. Mueller, M.; Pander, J.; Geist, J. The effects of weirs on structural stream habitat and biological communities. J. Appl. Ecol. 2011, 48, 1450–1461. [Google Scholar] [CrossRef]
  63. Krstulović, N.; Šolić, M.; Marasović, I. Relationship between bacteria, phytoplankton, and heterotrophic nanoflagellates along the trophic gradient. Helgol. Mar. Res. 1998, 51, 433. [Google Scholar] [CrossRef]
Figure 1. The sampling stations situated far from the weirs (YA, YB) and near the weirs (YC, YD) in the upper Youngsan River estuary, South Korea.
Water 09 00819 g001
Figure 2. Monthly and spatial variations of physical variables. (A) Temperature and precipitation, (B) Turbidity, (C) photosynthetically active radiation (PAR), and (D) light attenuation coefficient at stations YA, YB, YC, and YD in the upper Youngsan River estuary.
Water 09 00819 g002
Figure 3. Average (A) monthly and (B) spatial variations in dissolved inorganic nitrogen (DIN) concentrations in the upper Youngsan River estuary. Error bars represent standard deviations.
Water 09 00819 g003
Figure 4. Average (A) monthly and (B) spatial variations of dissolved inorganic phosphate (DIP) concentrations in the upper Youngsan River estuary. Error bars represent standard deviations.
Water 09 00819 g004
Figure 5. Monthly and spatial variations of biological variables: (A) zooplankton abundance, (B) chlorophyll a, and (C) total cyanobacterial count at stations YA, YB, YC and YD in the upper Youngsan River estuary.
Water 09 00819 g005
Figure 6. Variation in spatial abundance of the potentially toxic species in the upper part of the Youngsan River estuary. Bars in blue hues indicate upstream stations away from weirs (stations YA and YB), while red bars indicate stations near the weirs (stations YC and YD).
Water 09 00819 g006
Figure 7. Variation in temporal abundance of the potentially toxic species in the upper regions of the Youngsan River estuary.
Water 09 00819 g007
Figure 8. RDA biplot of the environmental variables and potentially toxic species. Total abundance (TotlAbun) and potentially toxic cyanobacteria species (Microcystis sp. = MicrcSp; M. aeruginosa = MAerug; M. flos-aquae = MFlos-; Dolichospermum sp. = DolichoSp; Oscillatoria sp. = OscilSp; Aphanocapsa sp. = AphanSp; Phormidium sp. = PhormSp) are represented by blue lines, whereas environmental factors are represented by red lines.
Water 09 00819 g008
Figure 9. Cluster analysis of the sampling sites. Two clusters were formed: stations further away from the weirs (YA, YB) and stations near the weirs (YC, YD).
Water 09 00819 g009
Table 1. Detrended correspondence analysis results for the homogeneity of variables.
StatisticAxis 1
Eigenvalues0.3528
Explained variation (cumulative)32.34
Gradient length2.34
Table 2. Explanatory variables for the abundance of potentially toxic cyanobacterial species.
Environmental VariableContribution %P-adj
Temperature45.20.008
DIN32.10.008
Zooplankton abundance22.00.028
Table 3. Paired t-test results for the environmental variables and abundances (cell·mL−1) of potentially toxic cyanobacteria collected from free-flowing (stations YA and YB; control) and impounded (stations YC and YD; treatment) sites. The data were transformed to log(x + 1) values prior to the statistical analysis.
VariablesControl (Mean ± SD) *Treatment (Mean ± SD) *p-Values (One-Tailed)
Environmental
Temperature17.97 ± 8.4216.61 ± 8.730.00026
DIN409.27 ± 223.73284.0 ± 149.569.0386 × 10−5
Turbidity5.80 ± 2.367.52 ± 4.230.01451
Zooplankton abundance264 ± 570298 ± 4280.01098
Toxic cyanobacteria
Microcystis sp.164 ± 4773331 ± 92340.00752
Phormidium sp.2300 ± 3867776 ± 10000.00324
Note: * Means and standard deviations prior to transformation to log(x + 1) values.

