Article

Sunshine Duration Variability in Haihe River Basin, China, during 1966–2015

1
College of Resource Environment and Tourism, Capital Normal University, Beijing 100048, China
2
Department of Water Resources, China Institute of Water Resources and Hydropower Research, Beijing 100038, China
*
Author to whom correspondence should be addressed.
Water 2017, 9(10), 770; https://doi.org/10.3390/w9100770
Submission received: 17 July 2017 / Revised: 1 October 2017 / Accepted: 1 October 2017 / Published: 9 October 2017

Abstract

:
Sunshine can have a profound impact on the systematic change in climate elements, such as temperature and wind speed, and in turn affects many aspects of the human society. In recent years, there has been a substantial interest in the variation of sunshine duration due to the dramatic global climate change. Hence, there is a need to better understand the variation of sunshine duration in order to cope with climate change. This study aimed to analyze the variation of sunshine duration in Haihe River basin, China, and its relationship with temperature, wind speed and low-level cloudiness. The annual, seasonal and monthly changes of sunshine duration were analyzed based on the data collected from 33 meteorological stations over the Haihe River basin during 1966–2015. It is evident that the annual, seasonal and monthly sunshine duration shows a decreasing trend over time. In addition, the annual sunshine duration is lower with a higher climate tendency rate in the southern and eastern coastal regions than that in the northwestern regions. It is negatively correlated with temperature (r = −0.50) and low-level cloudiness (r = −0.29), but positively with wind speed (r = 0.61). Wind speed may be one of the important causes of the decrease of sunshine duration in the Haihe River basin during 1966–2015. These changes may have significant implications for the hydrological cycle in the area.

1. Introduction

Sunshine is a key factor in most climate processes [1]. In recent years, there has been a substantial interest in the variation of sunshine duration due to the dramatic global climate change [2,3]. The seasonal and annual duration of sunshine decreased in the Northern and Eastern Austria in the 30-year period of 1960–1989, but a remarkable increase in sunshine duration was observed in high mountain regions [4]. In Western Europe, the annual sunshine duration showed an overall decrease since the 1950s until the early 1980s, followed by a recovery during the next two decades [5]. In Krakow, there was a decrease in the number of sunshine hours in the period from the 1950s to the 1980s, but an increase in the period from the 1980s to 2000s; and the time course of air temperature showed a statistically significant positive linear trend for the period 1884–2012 [6]. Previous studies in China have focused primarily on the sunshine duration variability in the densely populated and economically developed regions. The notable exceptions are the studies on the sunshine duration variability in river basins, such as the Yellow River [7] and the Yangtze River [8]. Zhang and Feng [9] found that annual and seasonal sunshine hours showed a declining trend in Puyang City during 1960–2010. Zheng et al. [10] found that the annual sunshine duration was decreased by −11.8% per decade on the northern Yunnan-Guizhou Plateau during 1961–2005, but increased by +3.5% per decade on the southwestern Yunnan-Guizhou Plateau during the same period. Kaiser et al. [11] found a significant decrease in sunshine duration over the latter half of the 20th century over much of China, which appeared to be related to the large increase in atmospheric anthropogenic aerosol loading in China. In addition, aerosol loading decreased the duration and intensity of sunshine in Southeastern China and thus lowered summertime maximum temperatures.
Haihe River basin is located in northern China, and it is one of the three major grain production bases in China. The decrease in sunshine duration has been shown to be detrimental to crop growth [12,13]. The sunshine duration was decreased by 17% and 20% in the growth period of wheat and maize in the Haihe River basin for the period 1960–2009, resulting in a 6.5% decrease in wheat yield and a 6.8% decrease in maize yield, respectively [14]. Thus, there is a need to better understand the variation of sunshine duration in the Haihe River basin over the past decades. To address this need, the annual, seasonal and monthly change of sunshine duration in the Haihe River basin over a 50-year period from 1966 to 2015 were analyzed in this study. The rest of this paper is structured as follows. Section 2 introduces the study area and methods used in this study. Section 3 analyses the temporal and spatial change of sunshine duration and its relationship with temperature and wind speed. Section 4 discusses the results. Section 5 summarizes the conclusions drawn in this study.

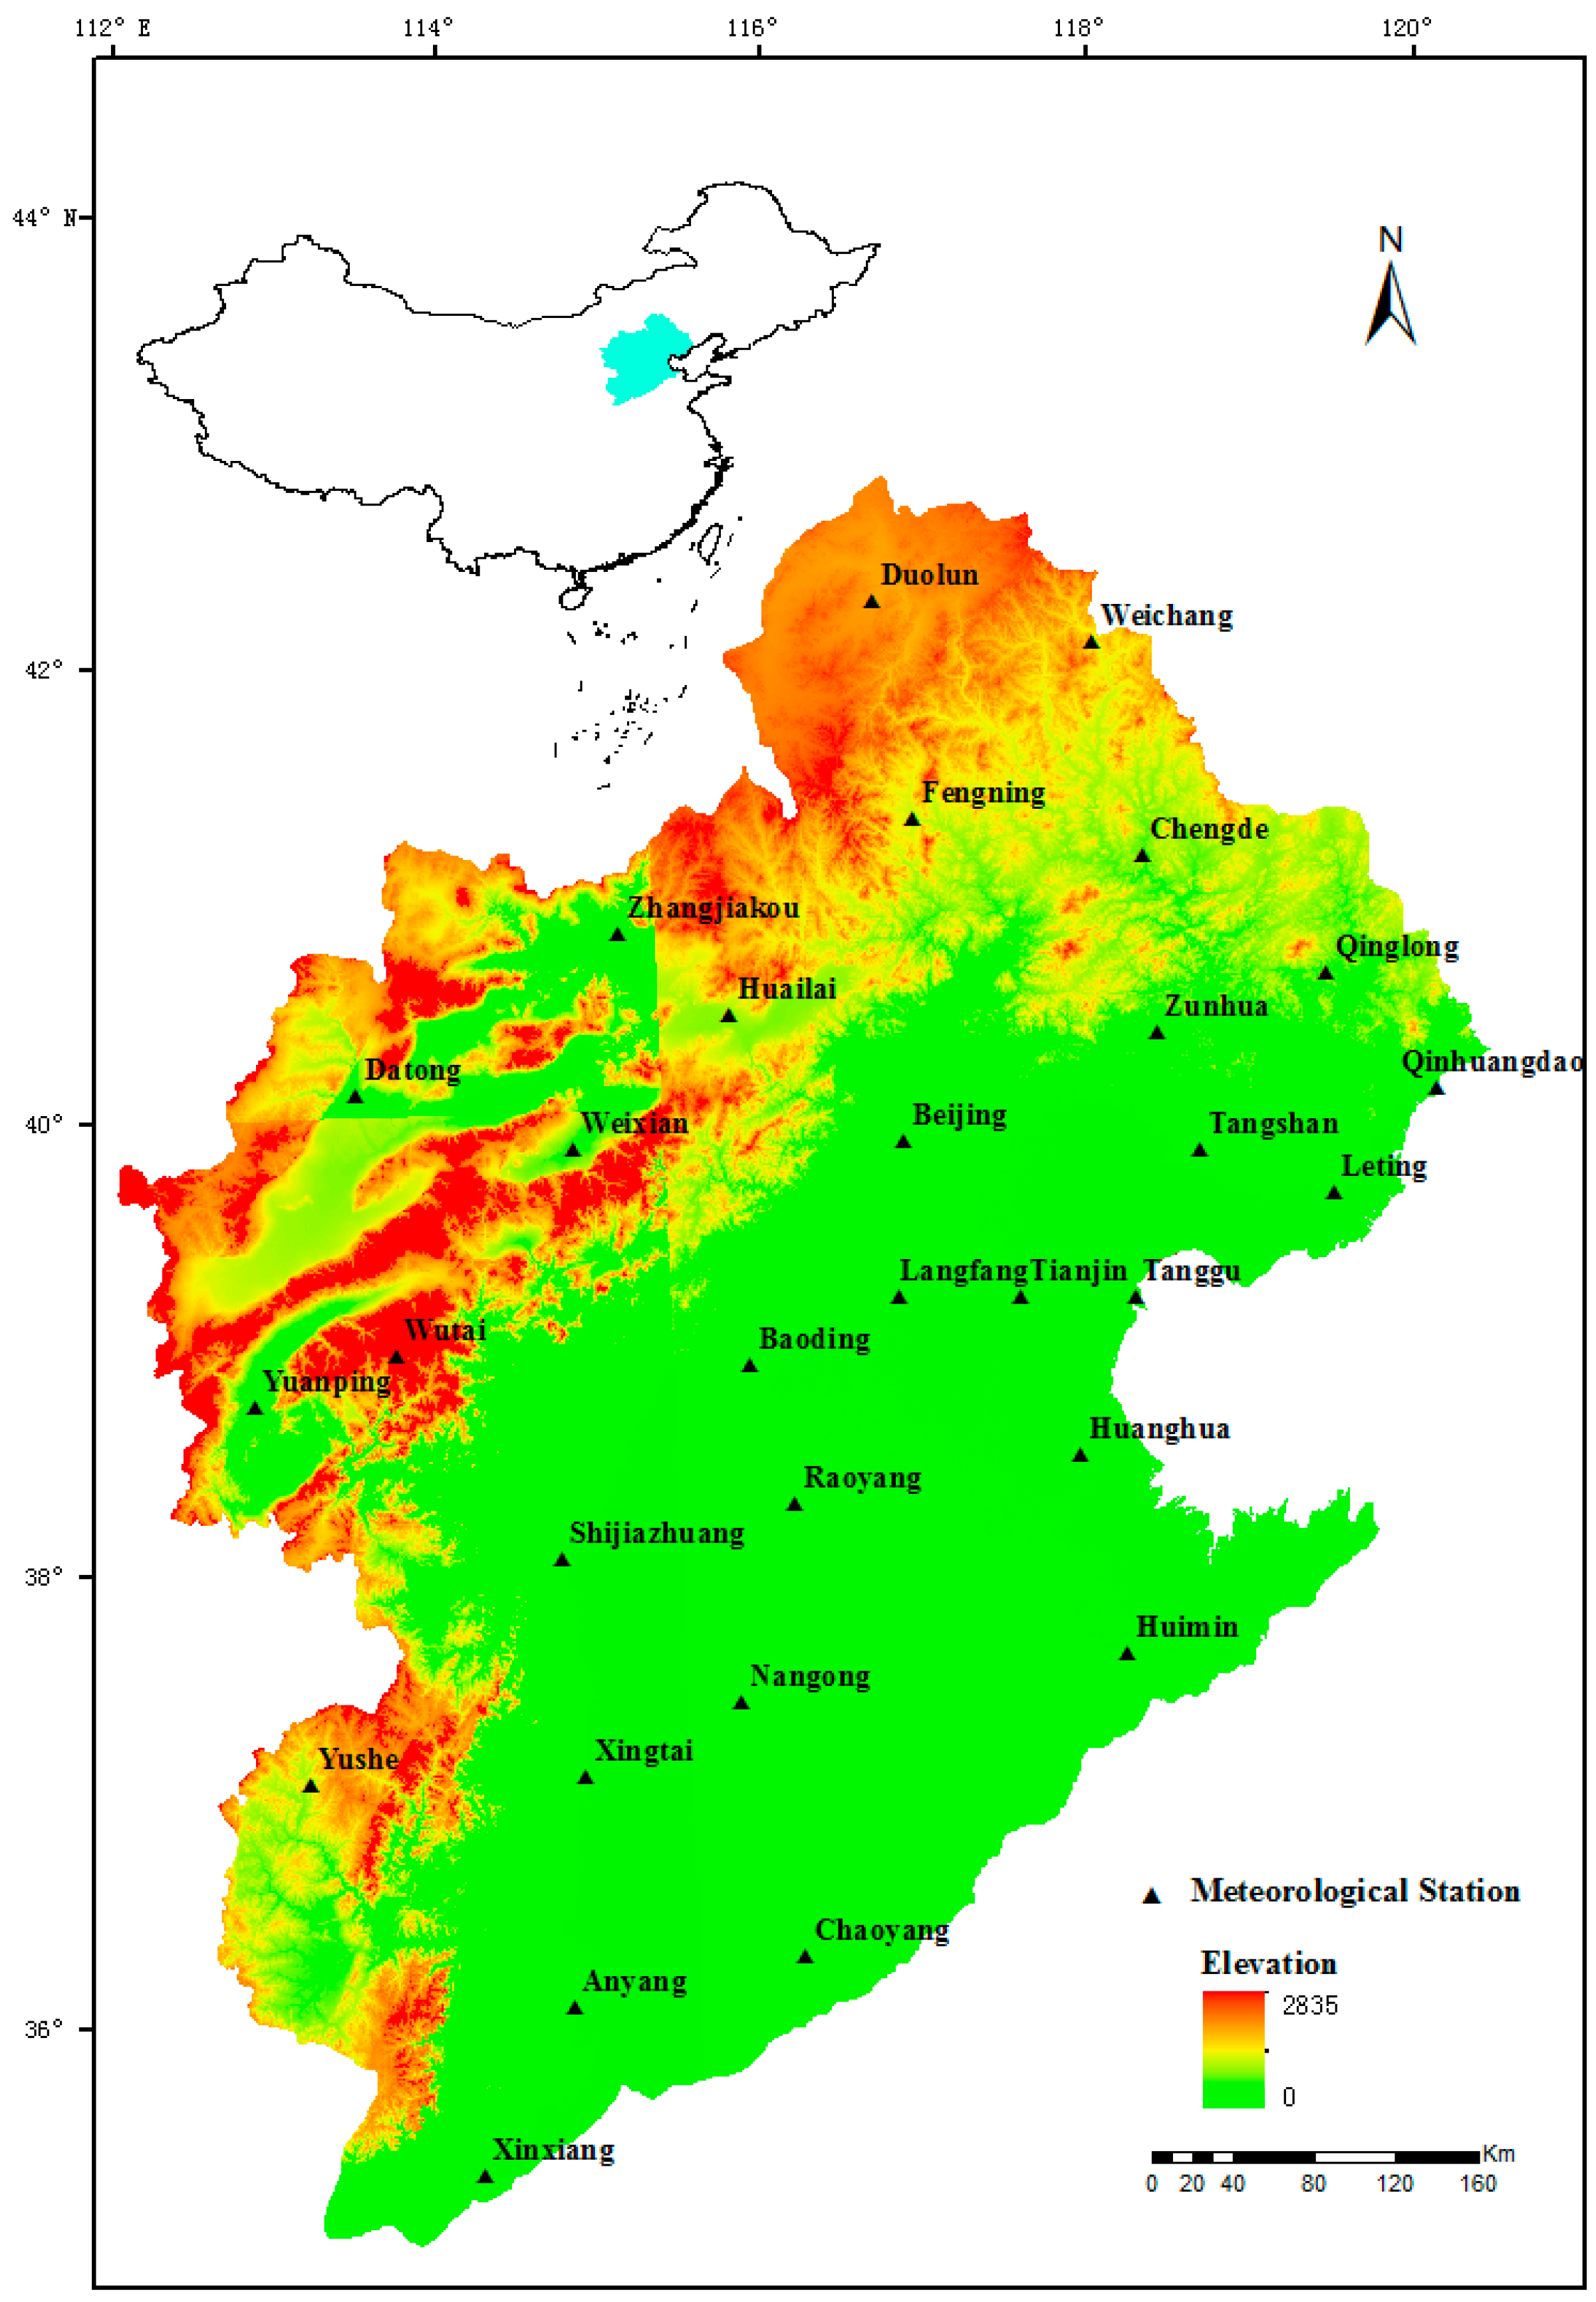
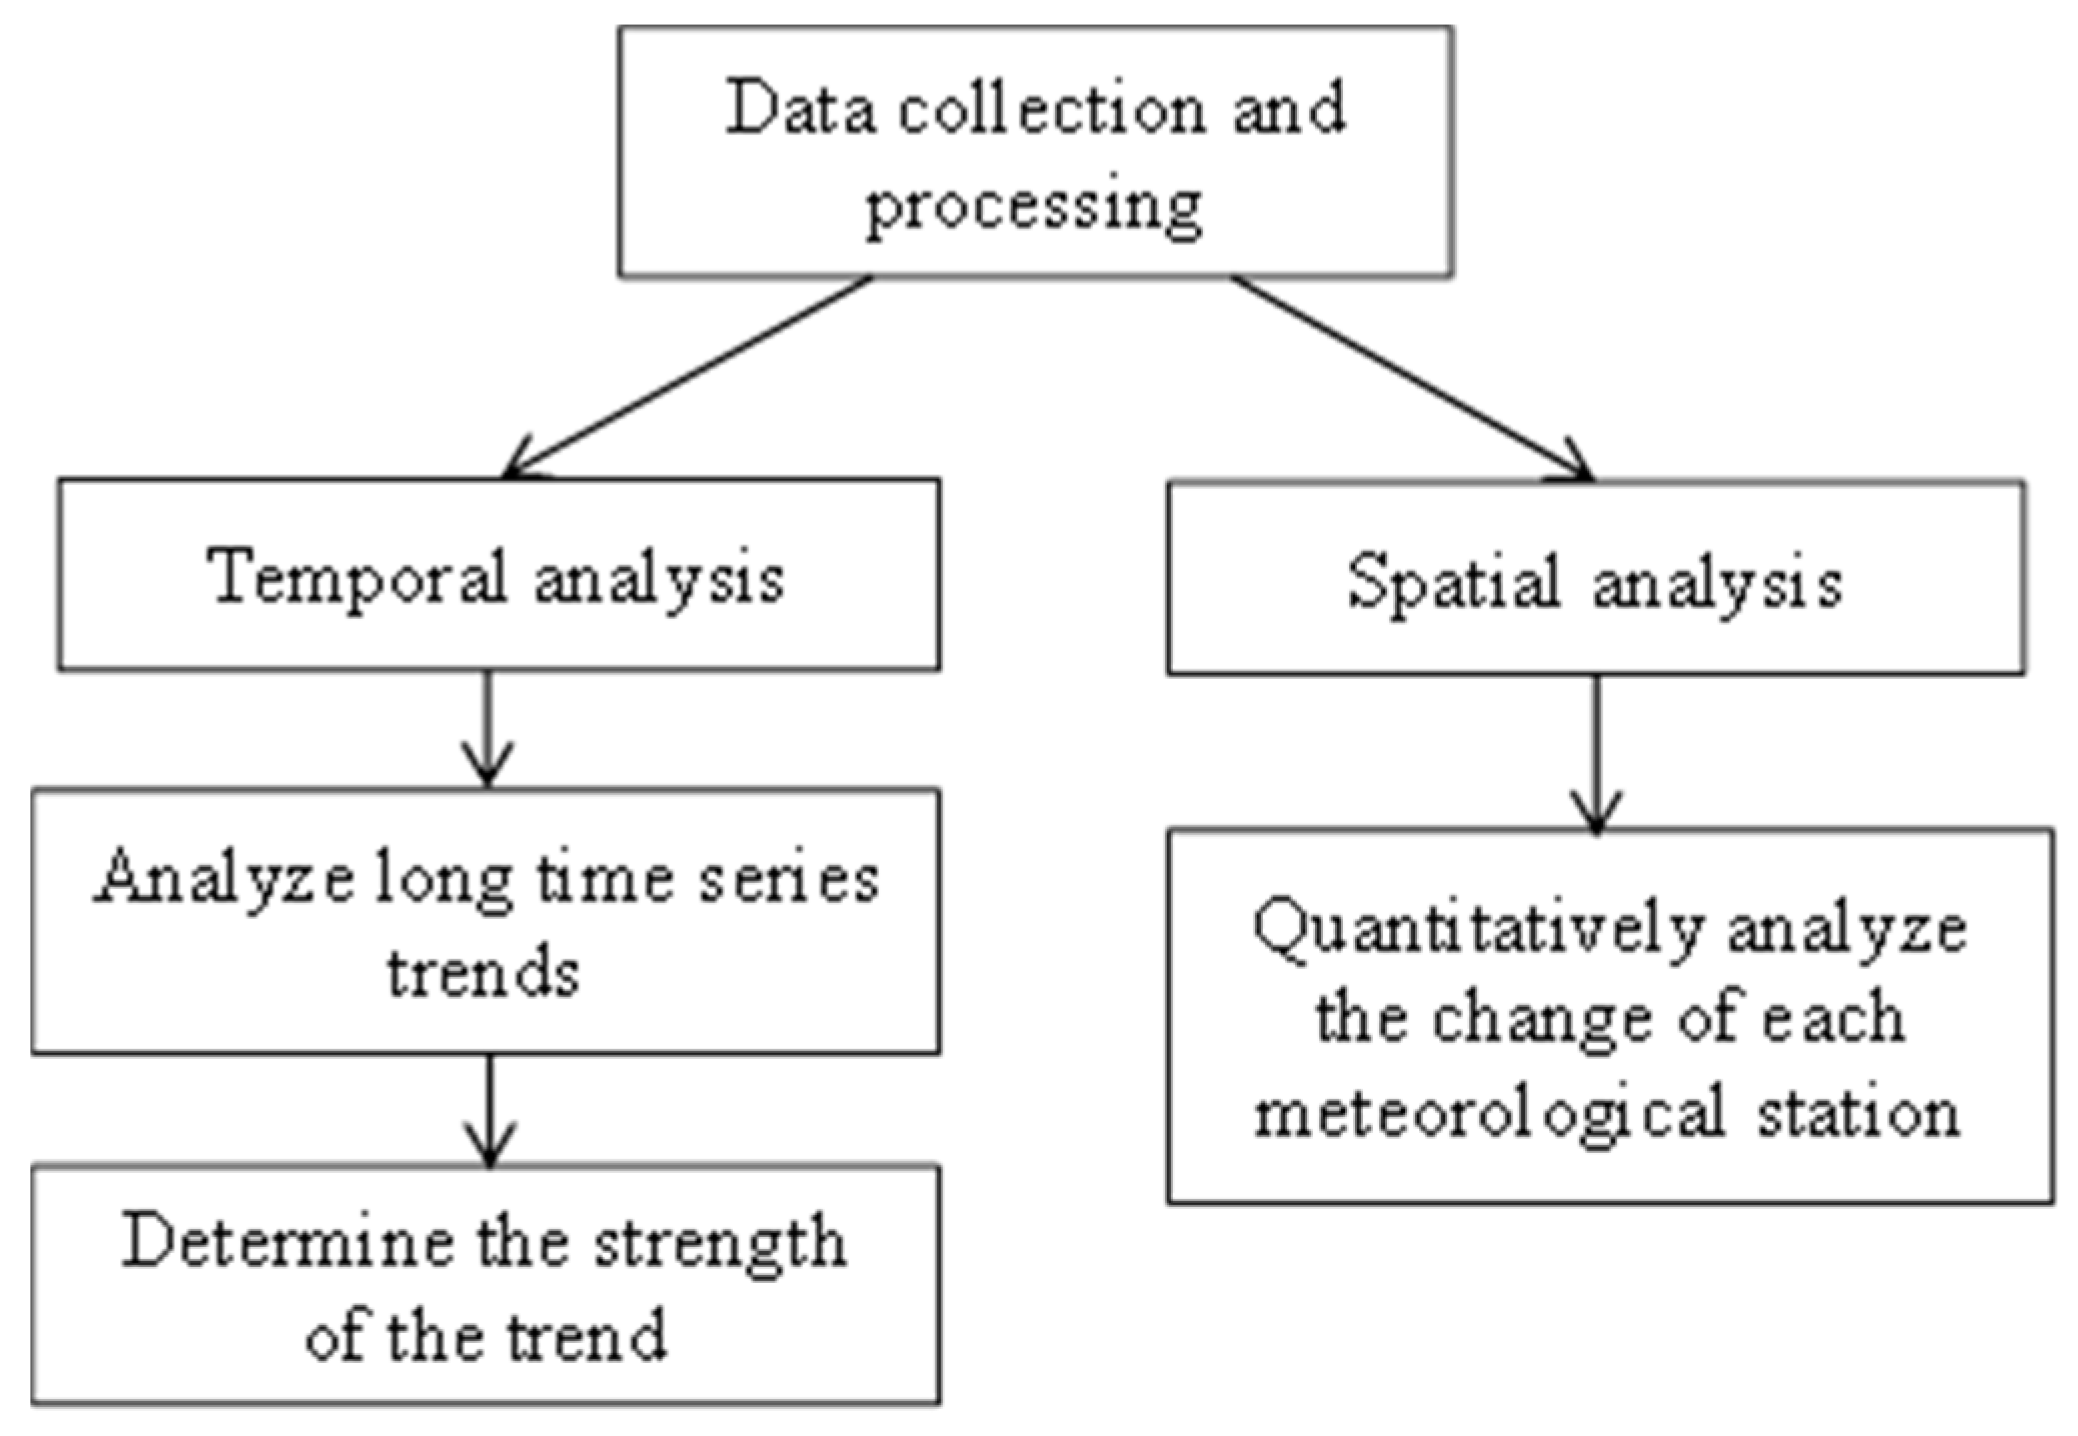
2. Study Area and Methods

Study Area and Data

Haihe River basin is located in Northern China (112–120° E and 35–43° N), including Beijing City, Tianjin City, most of Hebei province, northern Shandong province and Henan province, and a small part of Inner Mongolia and Liaoning province. It is bordered by the Bohai Sea in the east, the Yellow River in the south, the Shanxi plateau in the west and the Mongolia plateau in the north. It is a typical sector river basin with an average length of 450 km and an average width of 700 km. It has a total of 110,000 km2 of cultivated land, accounting for about 33% of the total area of the basin. Winter wheat and summer maize are the major crops in the study area. This area has an East Asian monsoon climate with hot and humid low-latitude Western Pacific wind in summer; but cold and dry Siberian wind in winter. It belongs to the semi-humid and semi-arid temperate continental monsoon climate zone, where there is a high frequency of drought and the ecological environment is very fragile [2,15].
The daily sunshine duration, temperature, wind speed and low-level cloudiness data at 33 meteorological stations (of which 30 meteorological stations in the basin) (Figure 1) were provided by the China Meteorological Data Sharing Service System (http://cdc.cma.gov.cn). These stations are China national observation stations, sunshine duration is recorded by Campbell-Stokes, and the observation instruments and methods have not changed since 1950s. The observation data of these stations have good temporal and spatial continuity. Data quality control was developed and maintained by Fengling Zou, Yanjun Zhu and Yan Xu at the China Meteorological Information Center. Documentation is available online for downloading (http://data.cma.cn/site/index.html). After data quality control and a homogeneity assessment, the accuracy of data is very high. In this study, seasons are defined as winter (December–February), spring (March–May), summer (June–August), and autumn (September–November).
The temporal trend was analyzed using linear trend analysis, slide average method, significance test, and so forth; and the spatial trend was analyzed using ArcGIS software. Linear trend analysis is the most commonly used method for climate change analysis because of its simple calculation. The significance test includes parametric t-test and Mann-Kendall (M-K) test, the former of which is used to test the significance of the long-term linear trend, while the latter of which is used to analyze the change trend of different periods in the analyzed time series that does not require certain distribution data. Obviously, M-K test is suitable for sequential variables.
Data were analyzed by the following four steps (Figure 2): (1) data pre-processing: daily sunshine duration, temperature and wind speed data were checked for errors, missing values and outliers; (2) analysis of the long time series by the linear trend; (3) analysis of the trend strength by the M-K test; and (4) analysis of the spatial variation at each meteorological station based on the climate tendency rate.
The M-K test [16,17] is a nonparametric method commonly used to assess the significance of monotonic trends in hydro-meteorological time series. It is based on the correlation between the ranks of a time series and their time order. For a time series x with a sample size n, the test statistic S k is:
S k = i < j r i j
where
r i j = s i g n ( x j x i ) = {     1   x i < x j   0   x i = x j 1   x i > x j
Under the null hypothesis of no trend, S k is normally distributed, whose expected value E( S k ) and variance Var( S k ) are as follows:
E ( S k ) = n ( n 1 ) 4
Var ( S k ) = n ( n 1 ) ( 2 n + 5 ) 72
Under the above assumption, the statistic index UFk is defined as:
U F k = [ S k E ( S k ) ] V a r ( S k )
U F k follows a standard normal distribution. In a two-sided trend test, the null hypothesis should be rejected at a significance level α if | U F | > U F ( 1 α / 2 ) , where U F ( 1 α / 2 ) is the critical value of the standard normal distribution with a probability exceeding α / 2 . A positive UF value indicates a positive trend, while a negative one indicates a negative trend.
In this paper, the significance level is set to α = 5%, thus U F ( 1 α / 2 ) = ±1.96. U F k and U F b are the UF values calculated with progressive and retrograde series, respectively. The intersection point of the U F k and U F b curves indicates the beginning of the trend within the time series. The null hypothesis (the sample is not affected by a trend) must be rejected if the intersection point is significant at a 5% significant level [18,19].
The change trend of climate elements is expressed by a linear equation,   X ( t ) = a 0 + a 1 t , t = 1, 2, …, n, a 1 = d X ( t ) / d t , and a 1 · 10 is the climate tendency rate over a 10-year period (h/10a). It can better reflect the changing trend of climate factors, and directly shows the spatial distribution of change rate of sunshine duration in Haihe River basin.
In order to extract the relationship between sunshine duration and wind speed/temperature/low-level cloudiness, correlation coefficients between each pair of variables are calculated using the formula in Equation (6). The DPS software was used to remove the trend prior to the correlation calculation. The correlation coefficient formula is:
r = Σ ( x x ¯ ) ( y y ¯ ) Σ ( x x ¯ ) 2 Σ ( y y ¯ ) 2
The value of r varies between +1 and −1. When r lies around ±1, then it is said to be a perfect degree of association between the two variables [20].
Spatial interpolation method has been used to obtain spatially-continuous estimations from ground point measurements. Universal Kriging is a type of linear unbiased optimal SI algorithm, which can be seen as a point interpolation. In contrast to other commonly-used SI algorithms, such as Voronoi and the inverse distance weighting method, it considers the spatial correlation between the points that need to be interpolated and their neighboring points, as well as giving the estimation error. It relies on the semivariogram model and regionalized variable, and exists an underlying trend, this trend can be modeled as a function of the spatial coordinates. In this paper, the universal kriging algorithm provides more accurate interpolation results than other spatial interpolation method, and it is applied widely in the geological interpolation area and climate variables [21,22,23].

3. Results

3.1. Temporal Change of Sunshine Duration

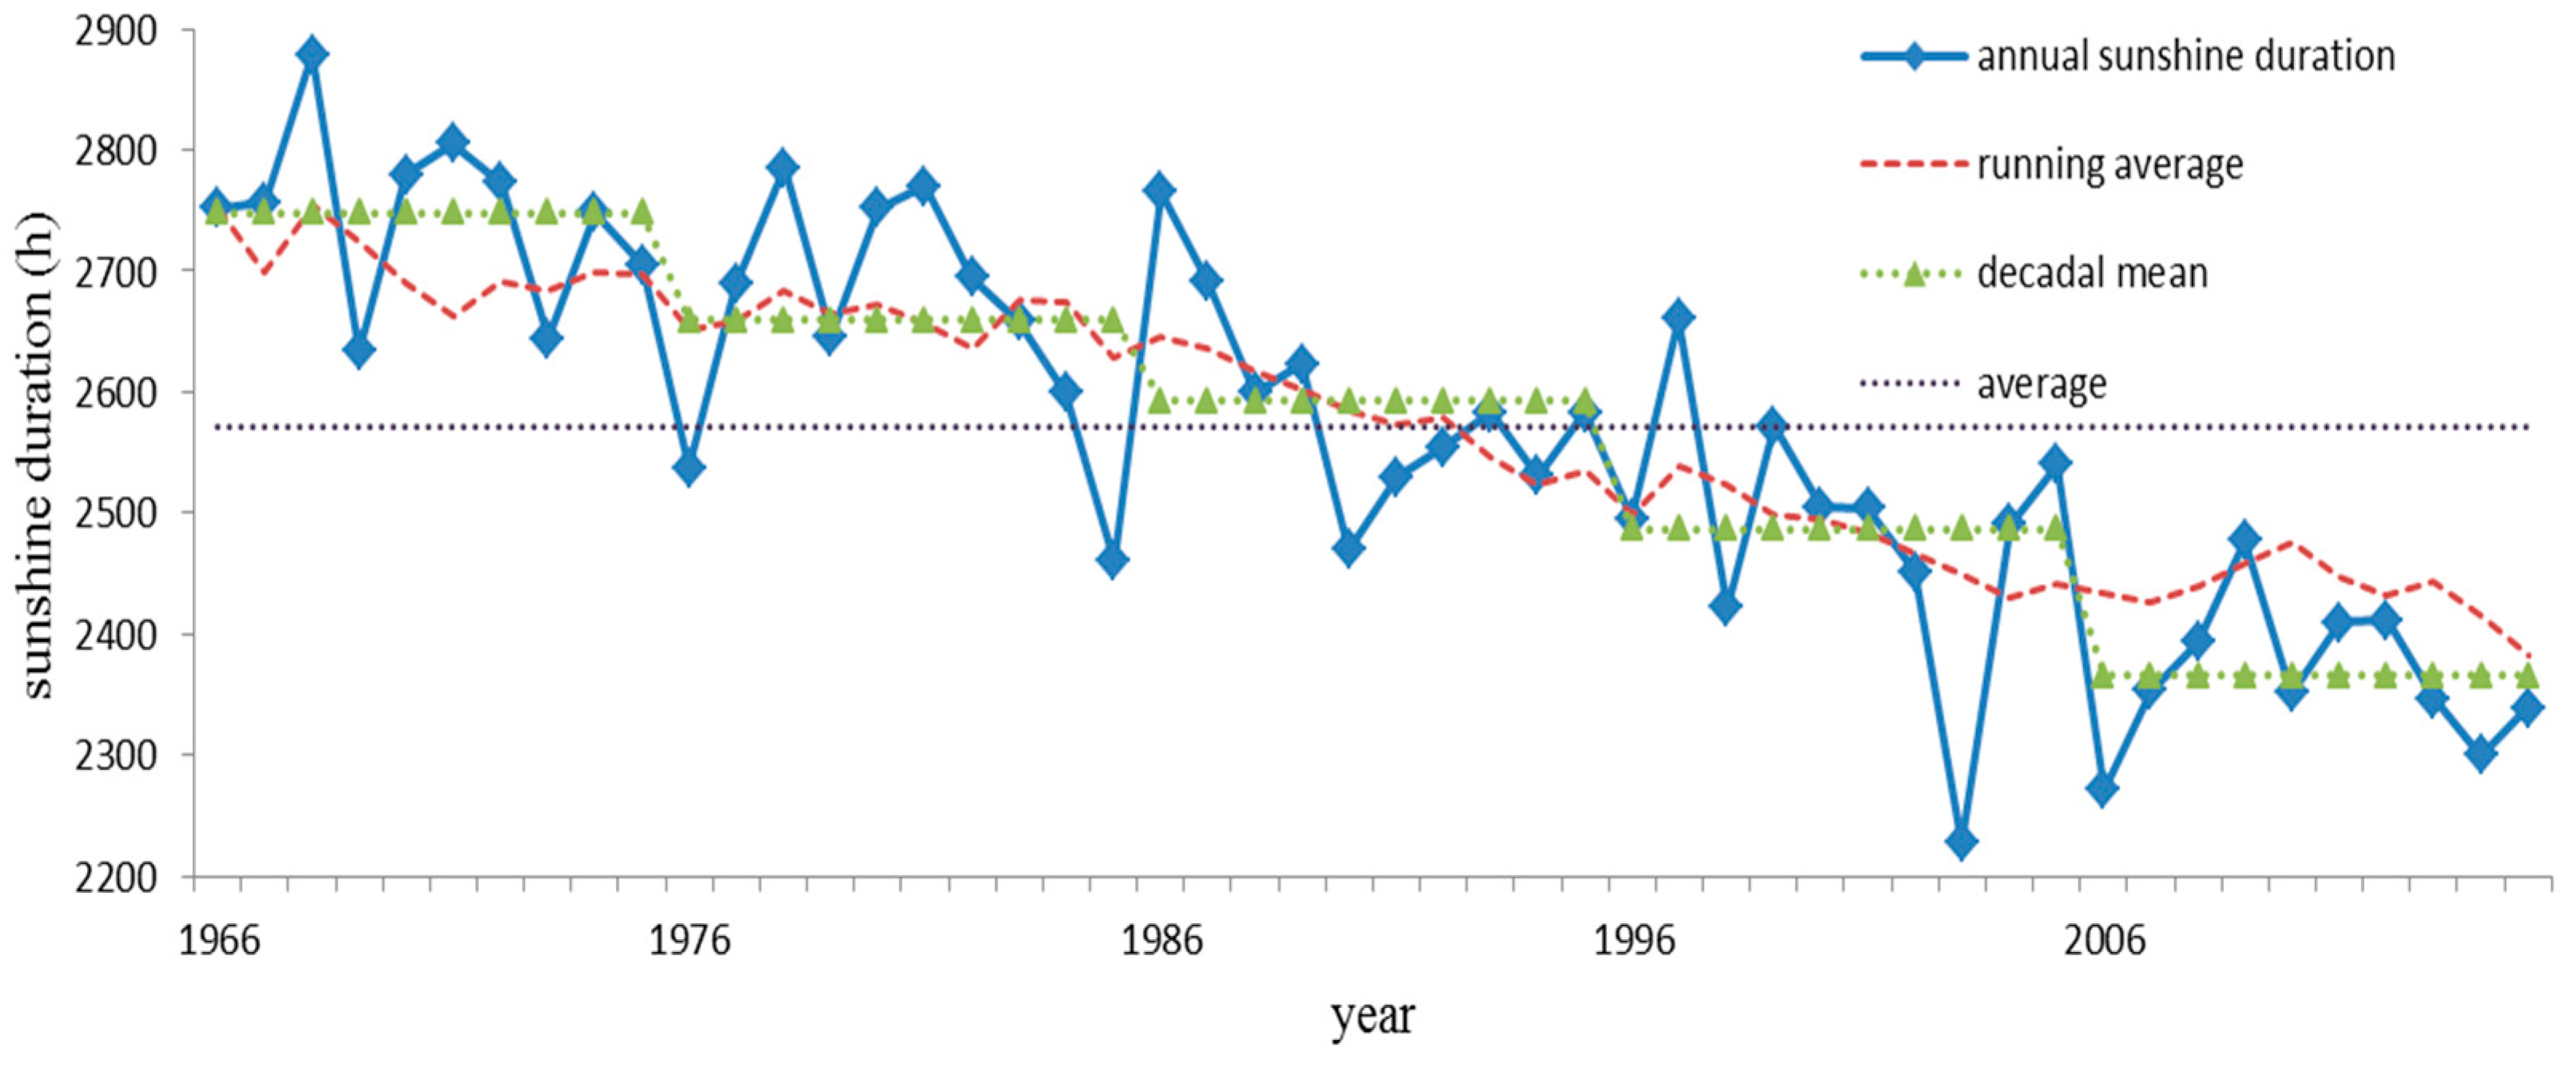
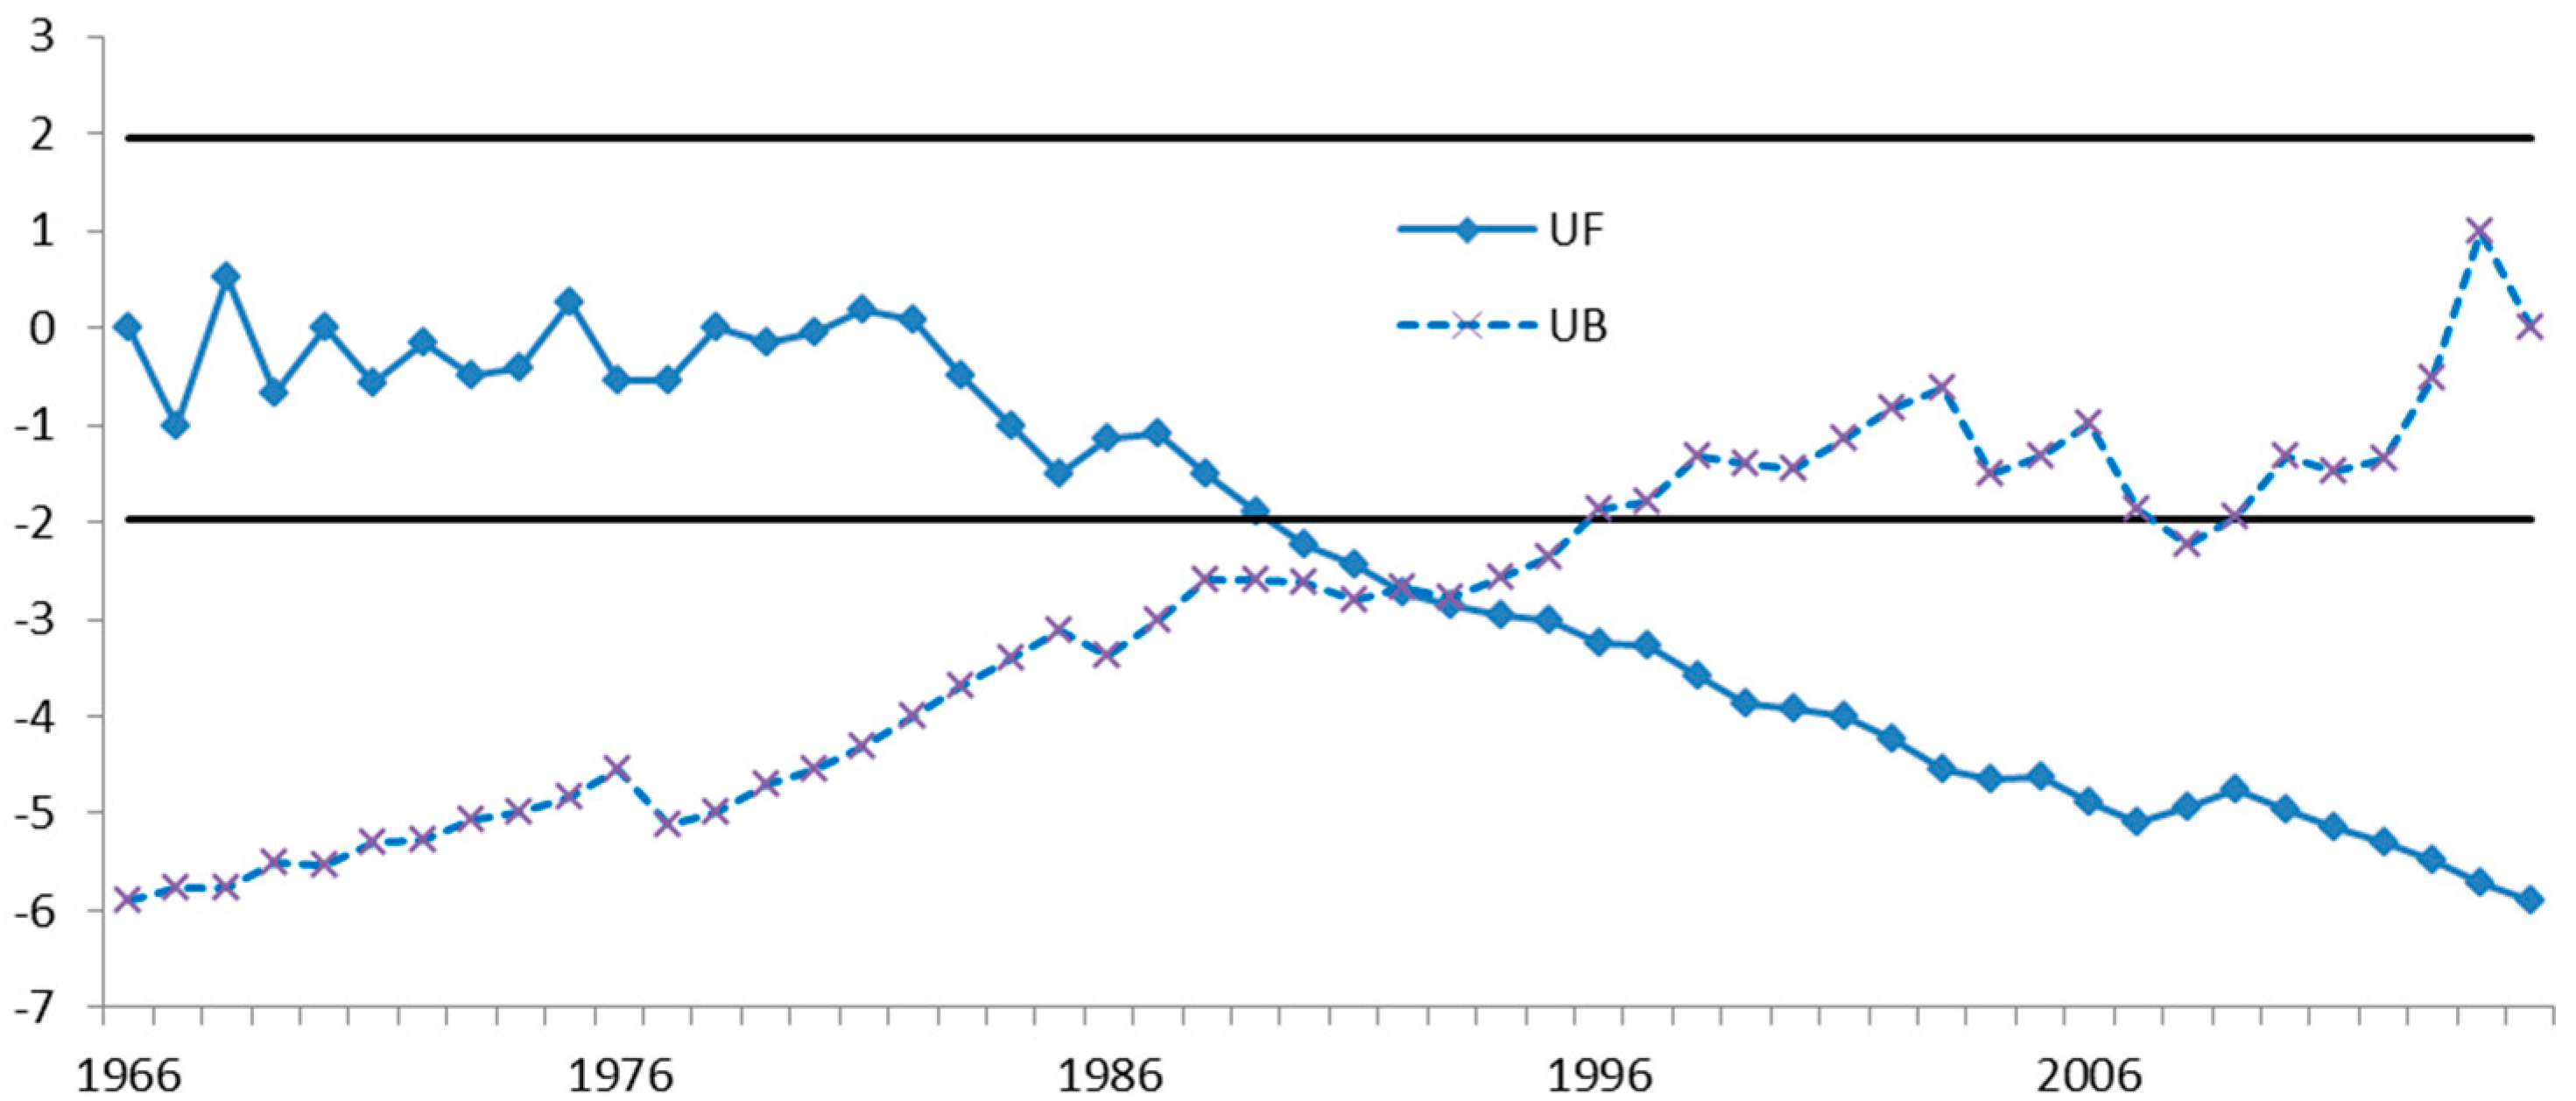
3.1.1. Annual Sunshine Duration

Figure 3 shows that the mean annual sunshine duration is 2570.5 h in the Haihe River basin for the period 1966–2015, with a maximum of 2879.1 h in 1968 and a minimum of 2227.7 h in 2003. From the trend line and 10-year running average line, the annual sunshine duration in the Haihe River basin has a decreasing trend in the last 50 years, with a tendency rate of −9.39 h/a. Since the beginning of the 20th century, the decreasing trend slows down. The annual sunshine duration during 1966–1985 is higher than the long-term mean, whereas that during 1996–2005 is lower than the mean with only a few exceptions. Notably, a lower sunshine duration is observed in 1976 and 1985 and a higher sunshine duration is observed in 1997. In addition, it is important to note that the annual sunshine duration changes dramatically during 1986–1995, and the difference between the maximum and the minimum is 295.5 h.
The M-K test shows that the sunshine duration decreases continuously since 1981 (Figure 4). The average M-K value is −2.41, which exceeds the significance level of α = 5%. Importantly, the trend value exceeds the critical value of α = 5% since 1989 and the critical value of α = 1% since the 1990s, indicating a significant decrease in the annual sunshine duration in the Haihe River basin.

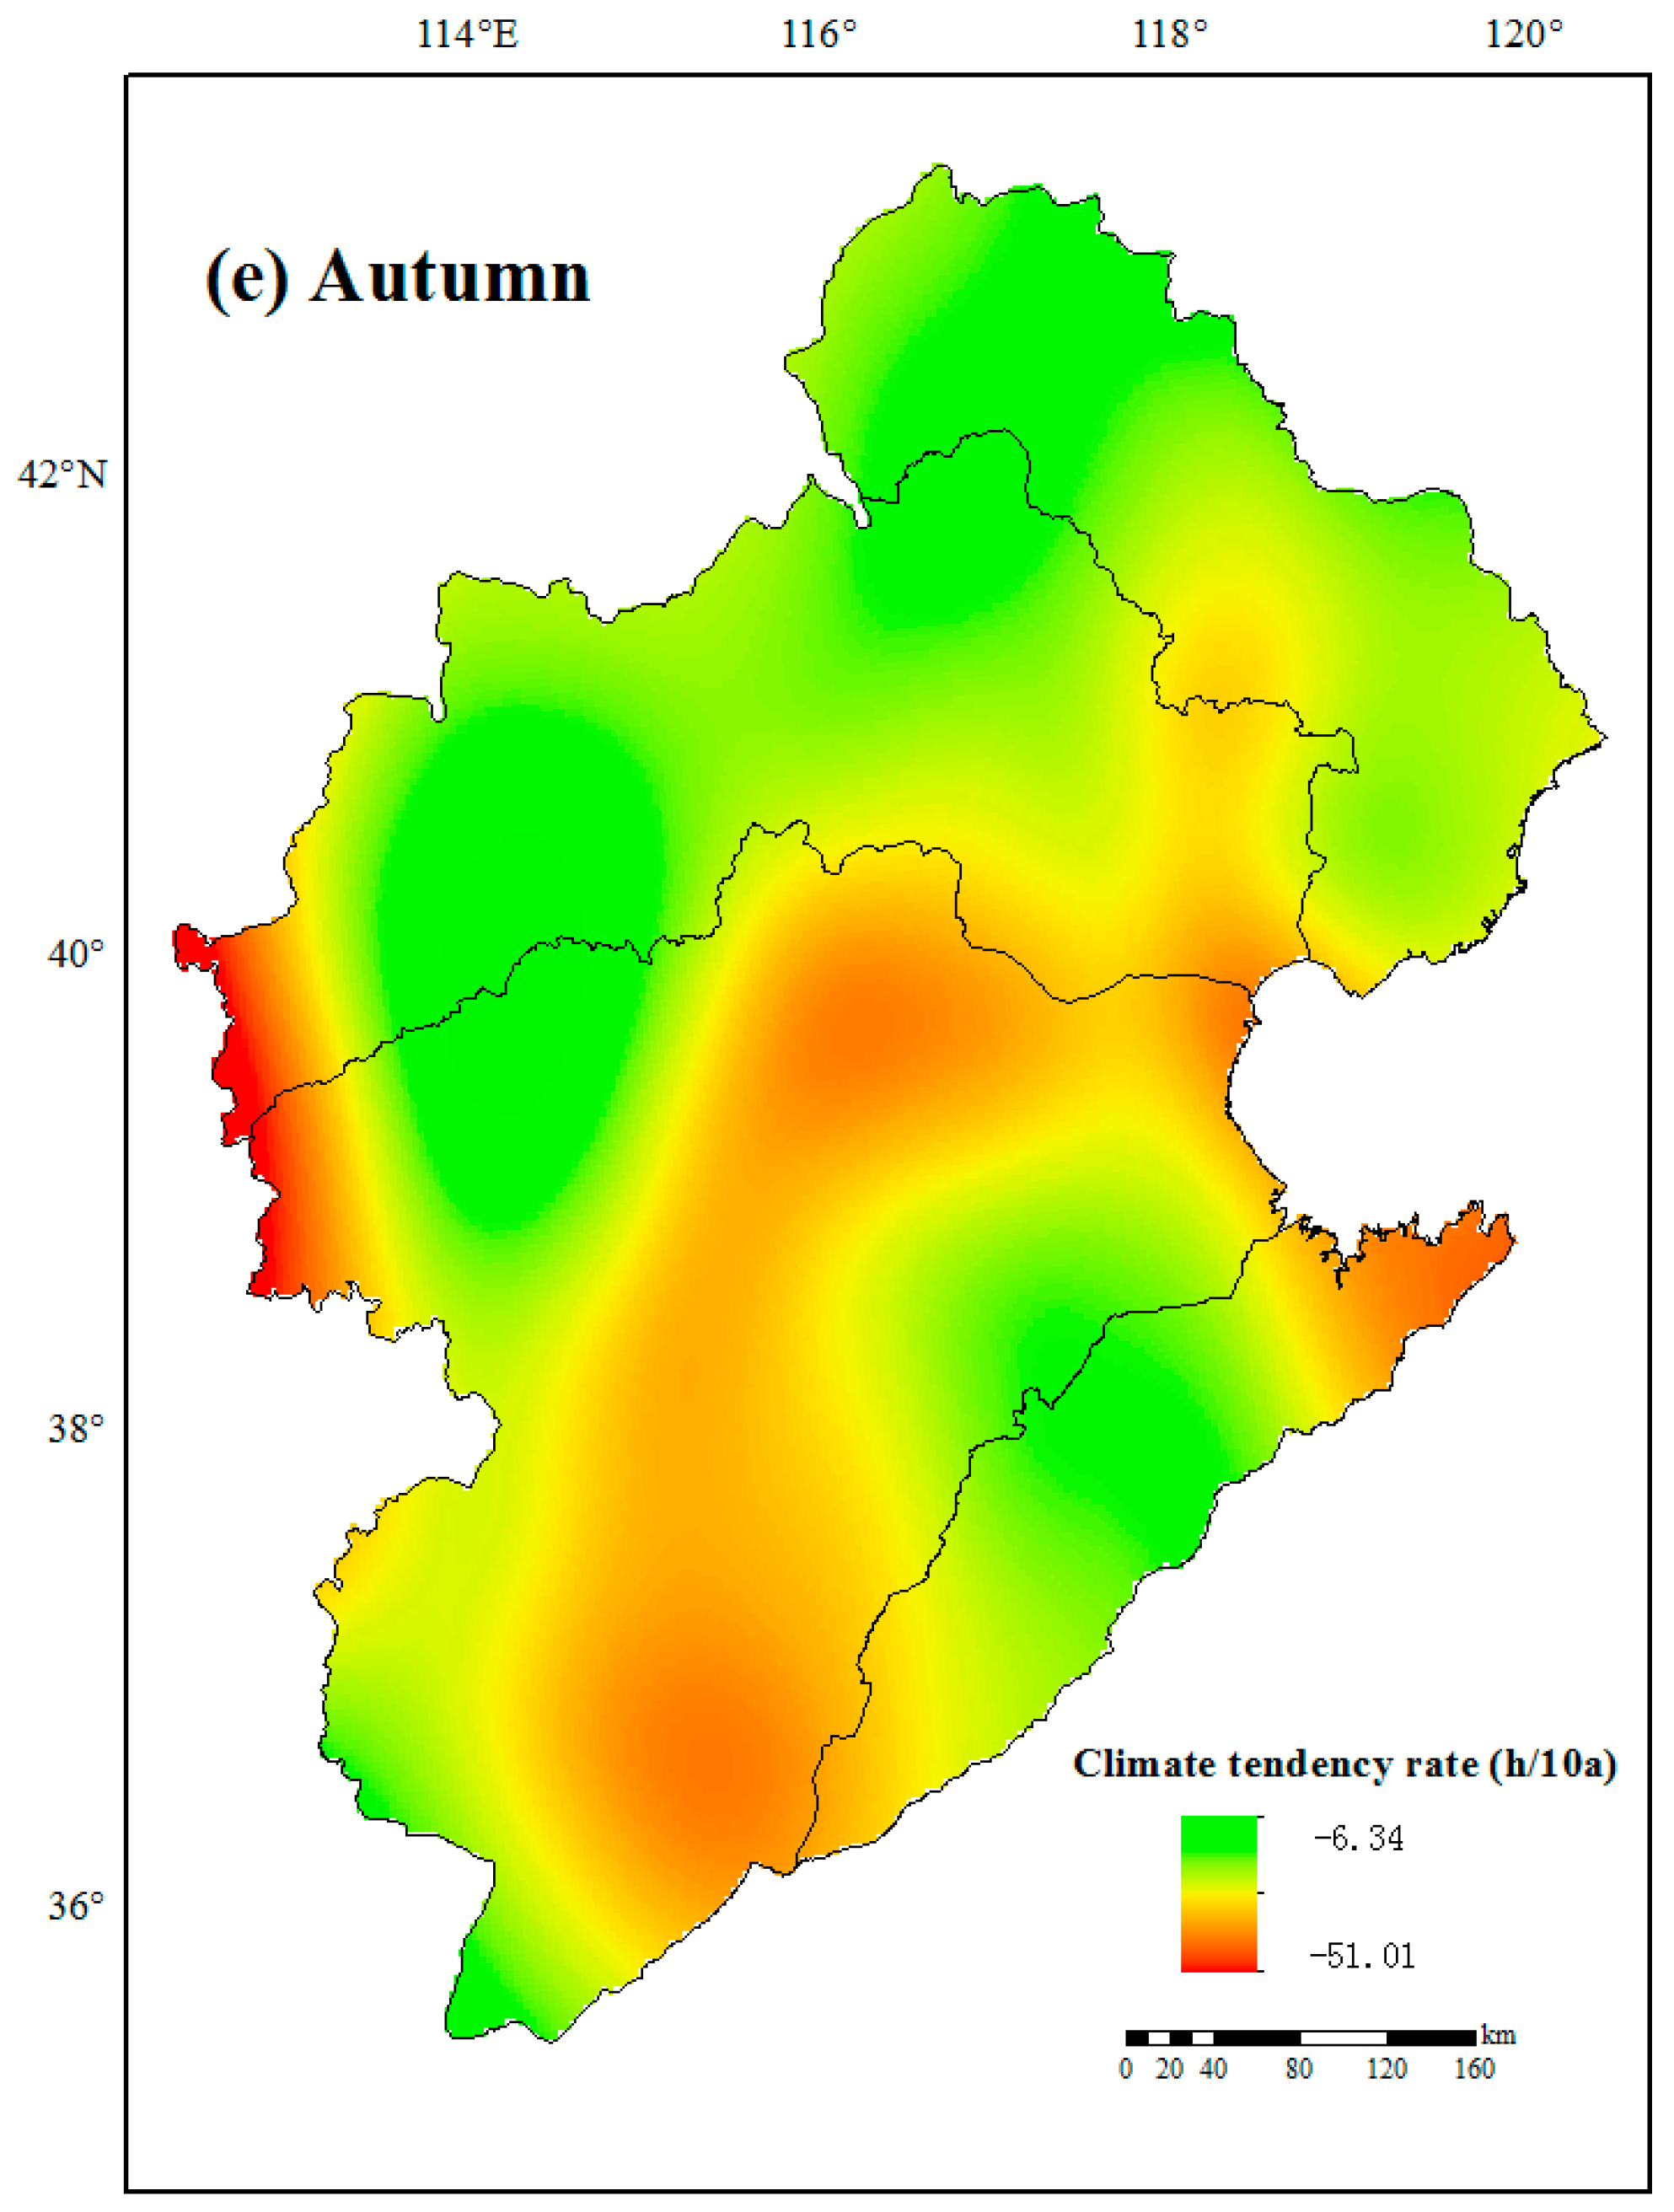
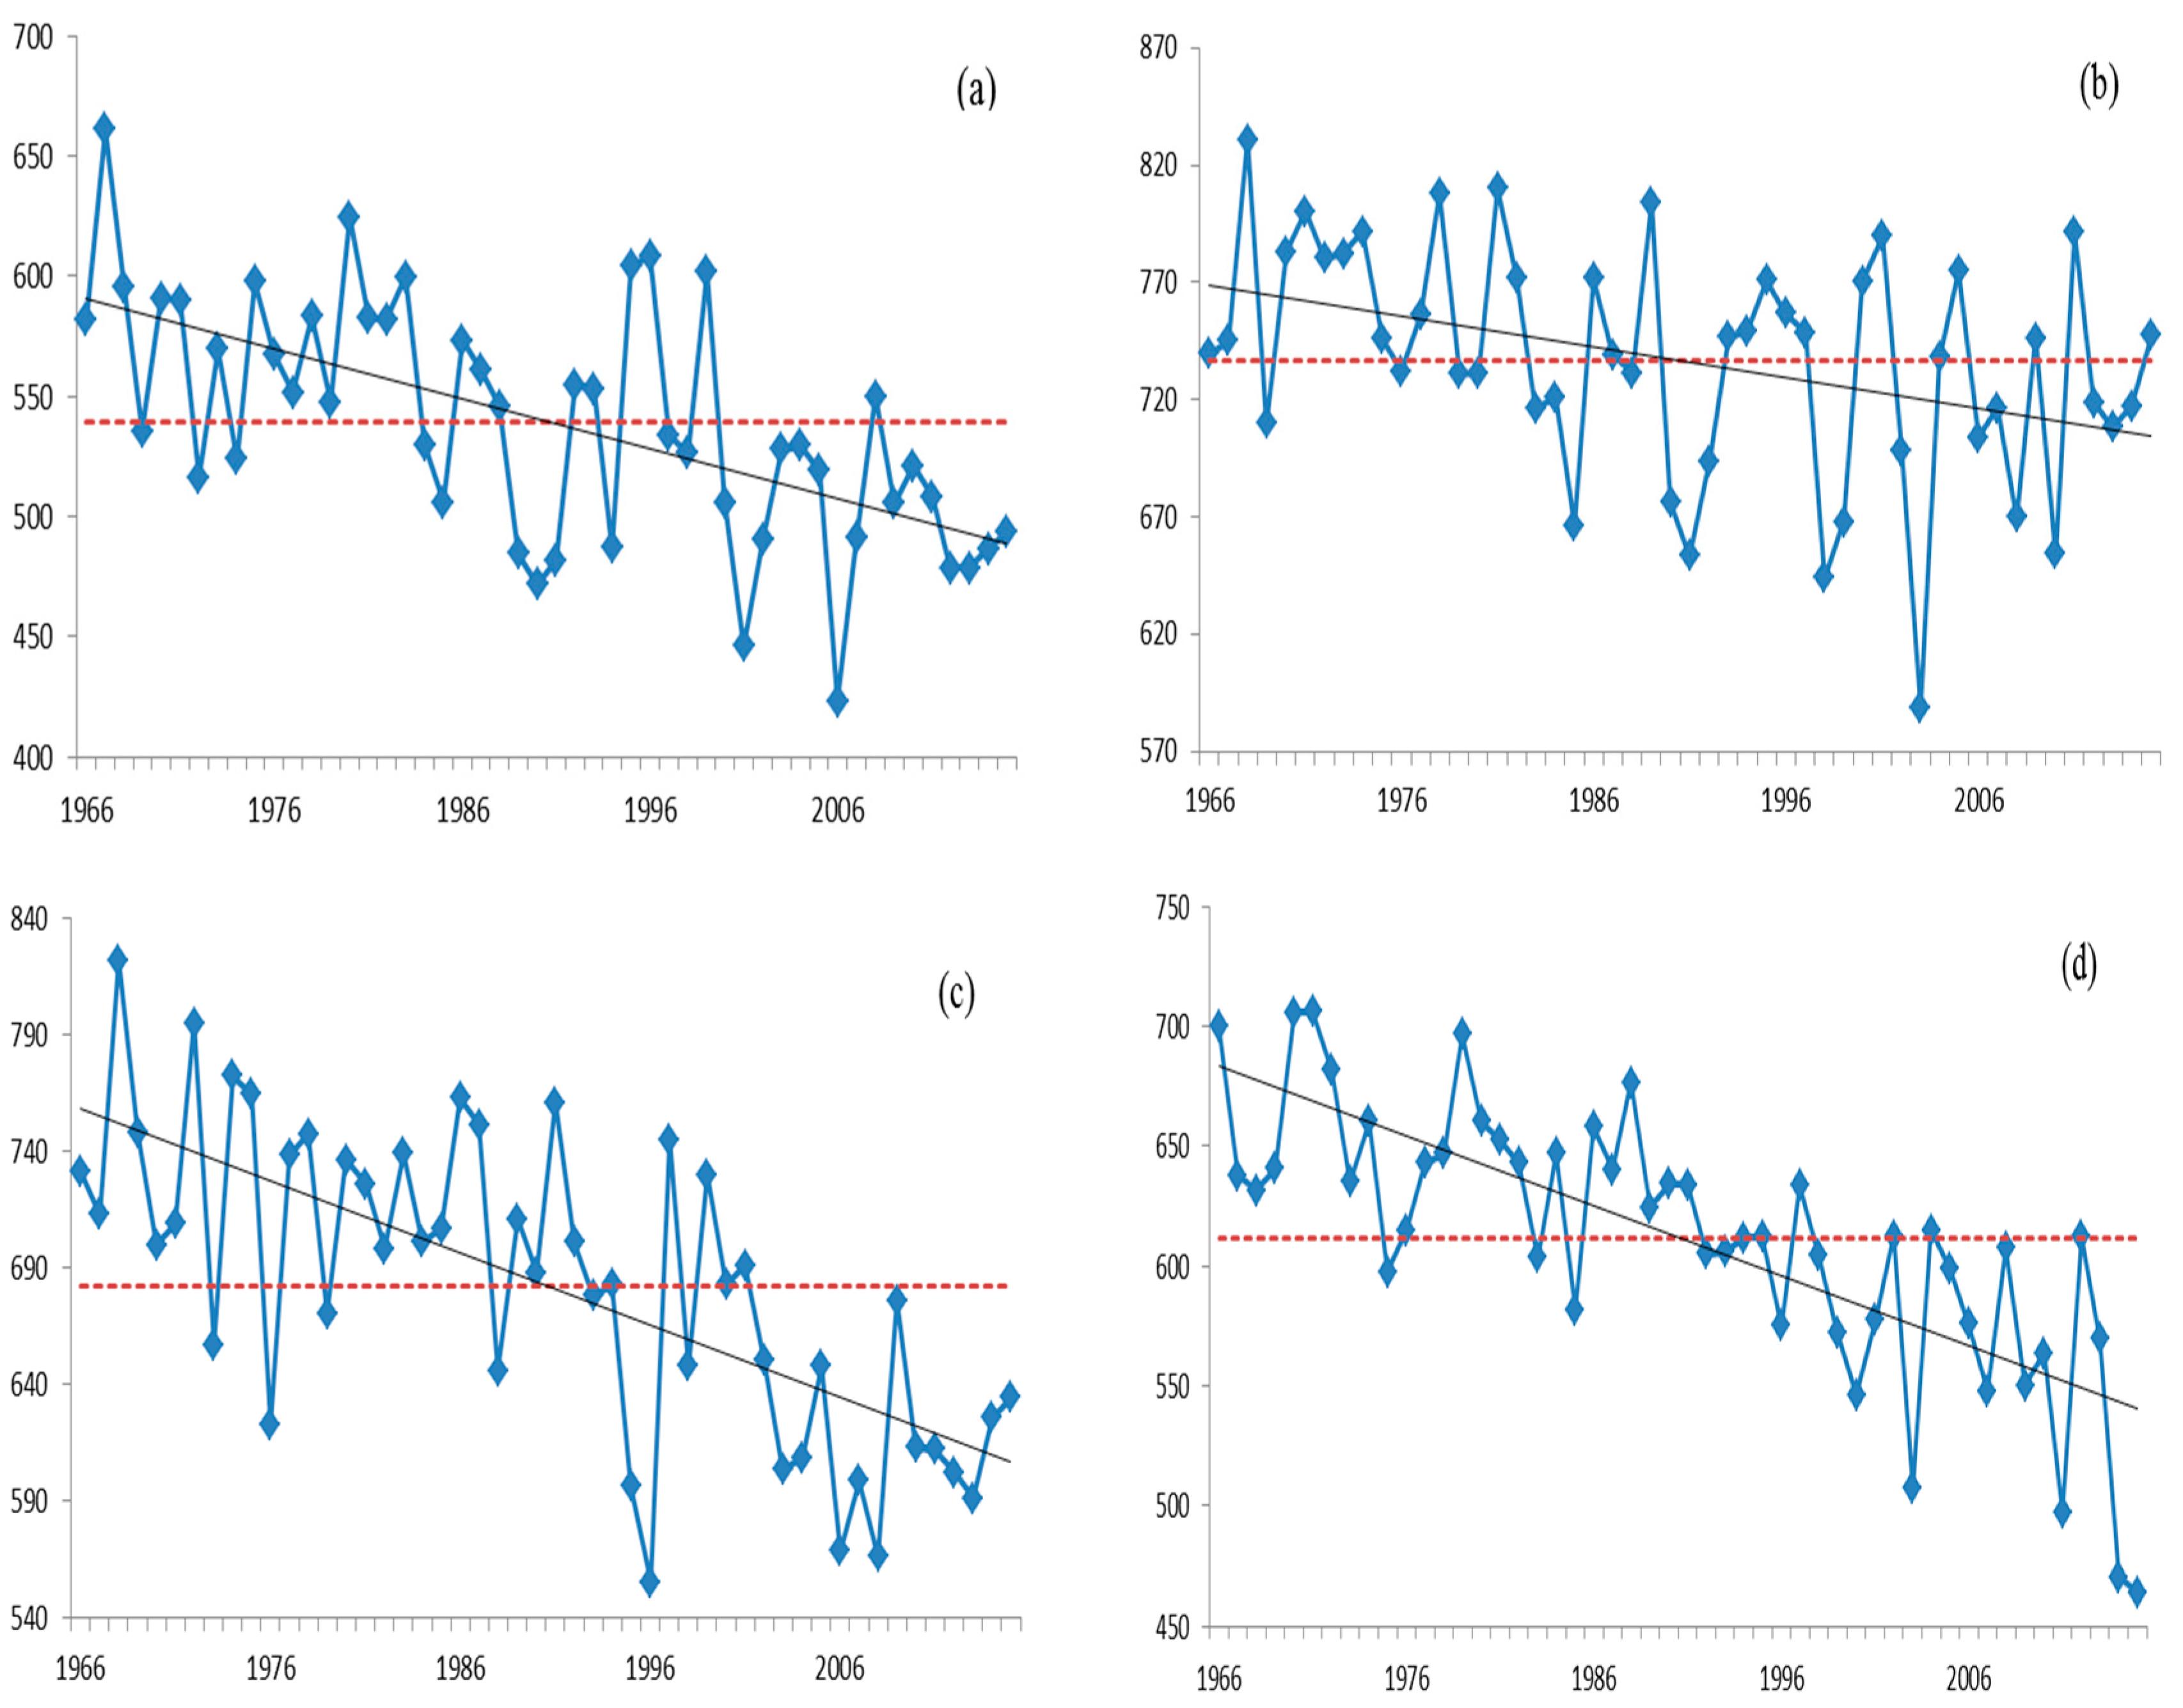
3.1.2. Seasonal Sunshine Duration

Figure 5 shows the change of seasonal sunshine duration in Haihe River basin during 1966–2015. The seasonal sunshine duration is decreased by 1.30–3.09 h per year for the period 1966–2015. The maximum decrease is observed in summer with a tendency rate of −3.09 h/a, followed by that in autumn, winter and spring, with a tendency rate of −2.91, −2.08 and −1.30 h/a, respectively. The mean seasonal sunshine duration follows an order of spring (736.80 h) > summer (682.40 h) > autumn (611.81 h) > winter (539.47 h). The long sunshine duration in spring can be attributed to the less clouds and relatively longer daytime in spring. In summer where there is the longest daytime, the rainy days increase in the Haihe River basin, resulting in a slightly lower sunshine duration. The lowest sunshine duration in winter can be attributed to the shortest daytime during this period of time.

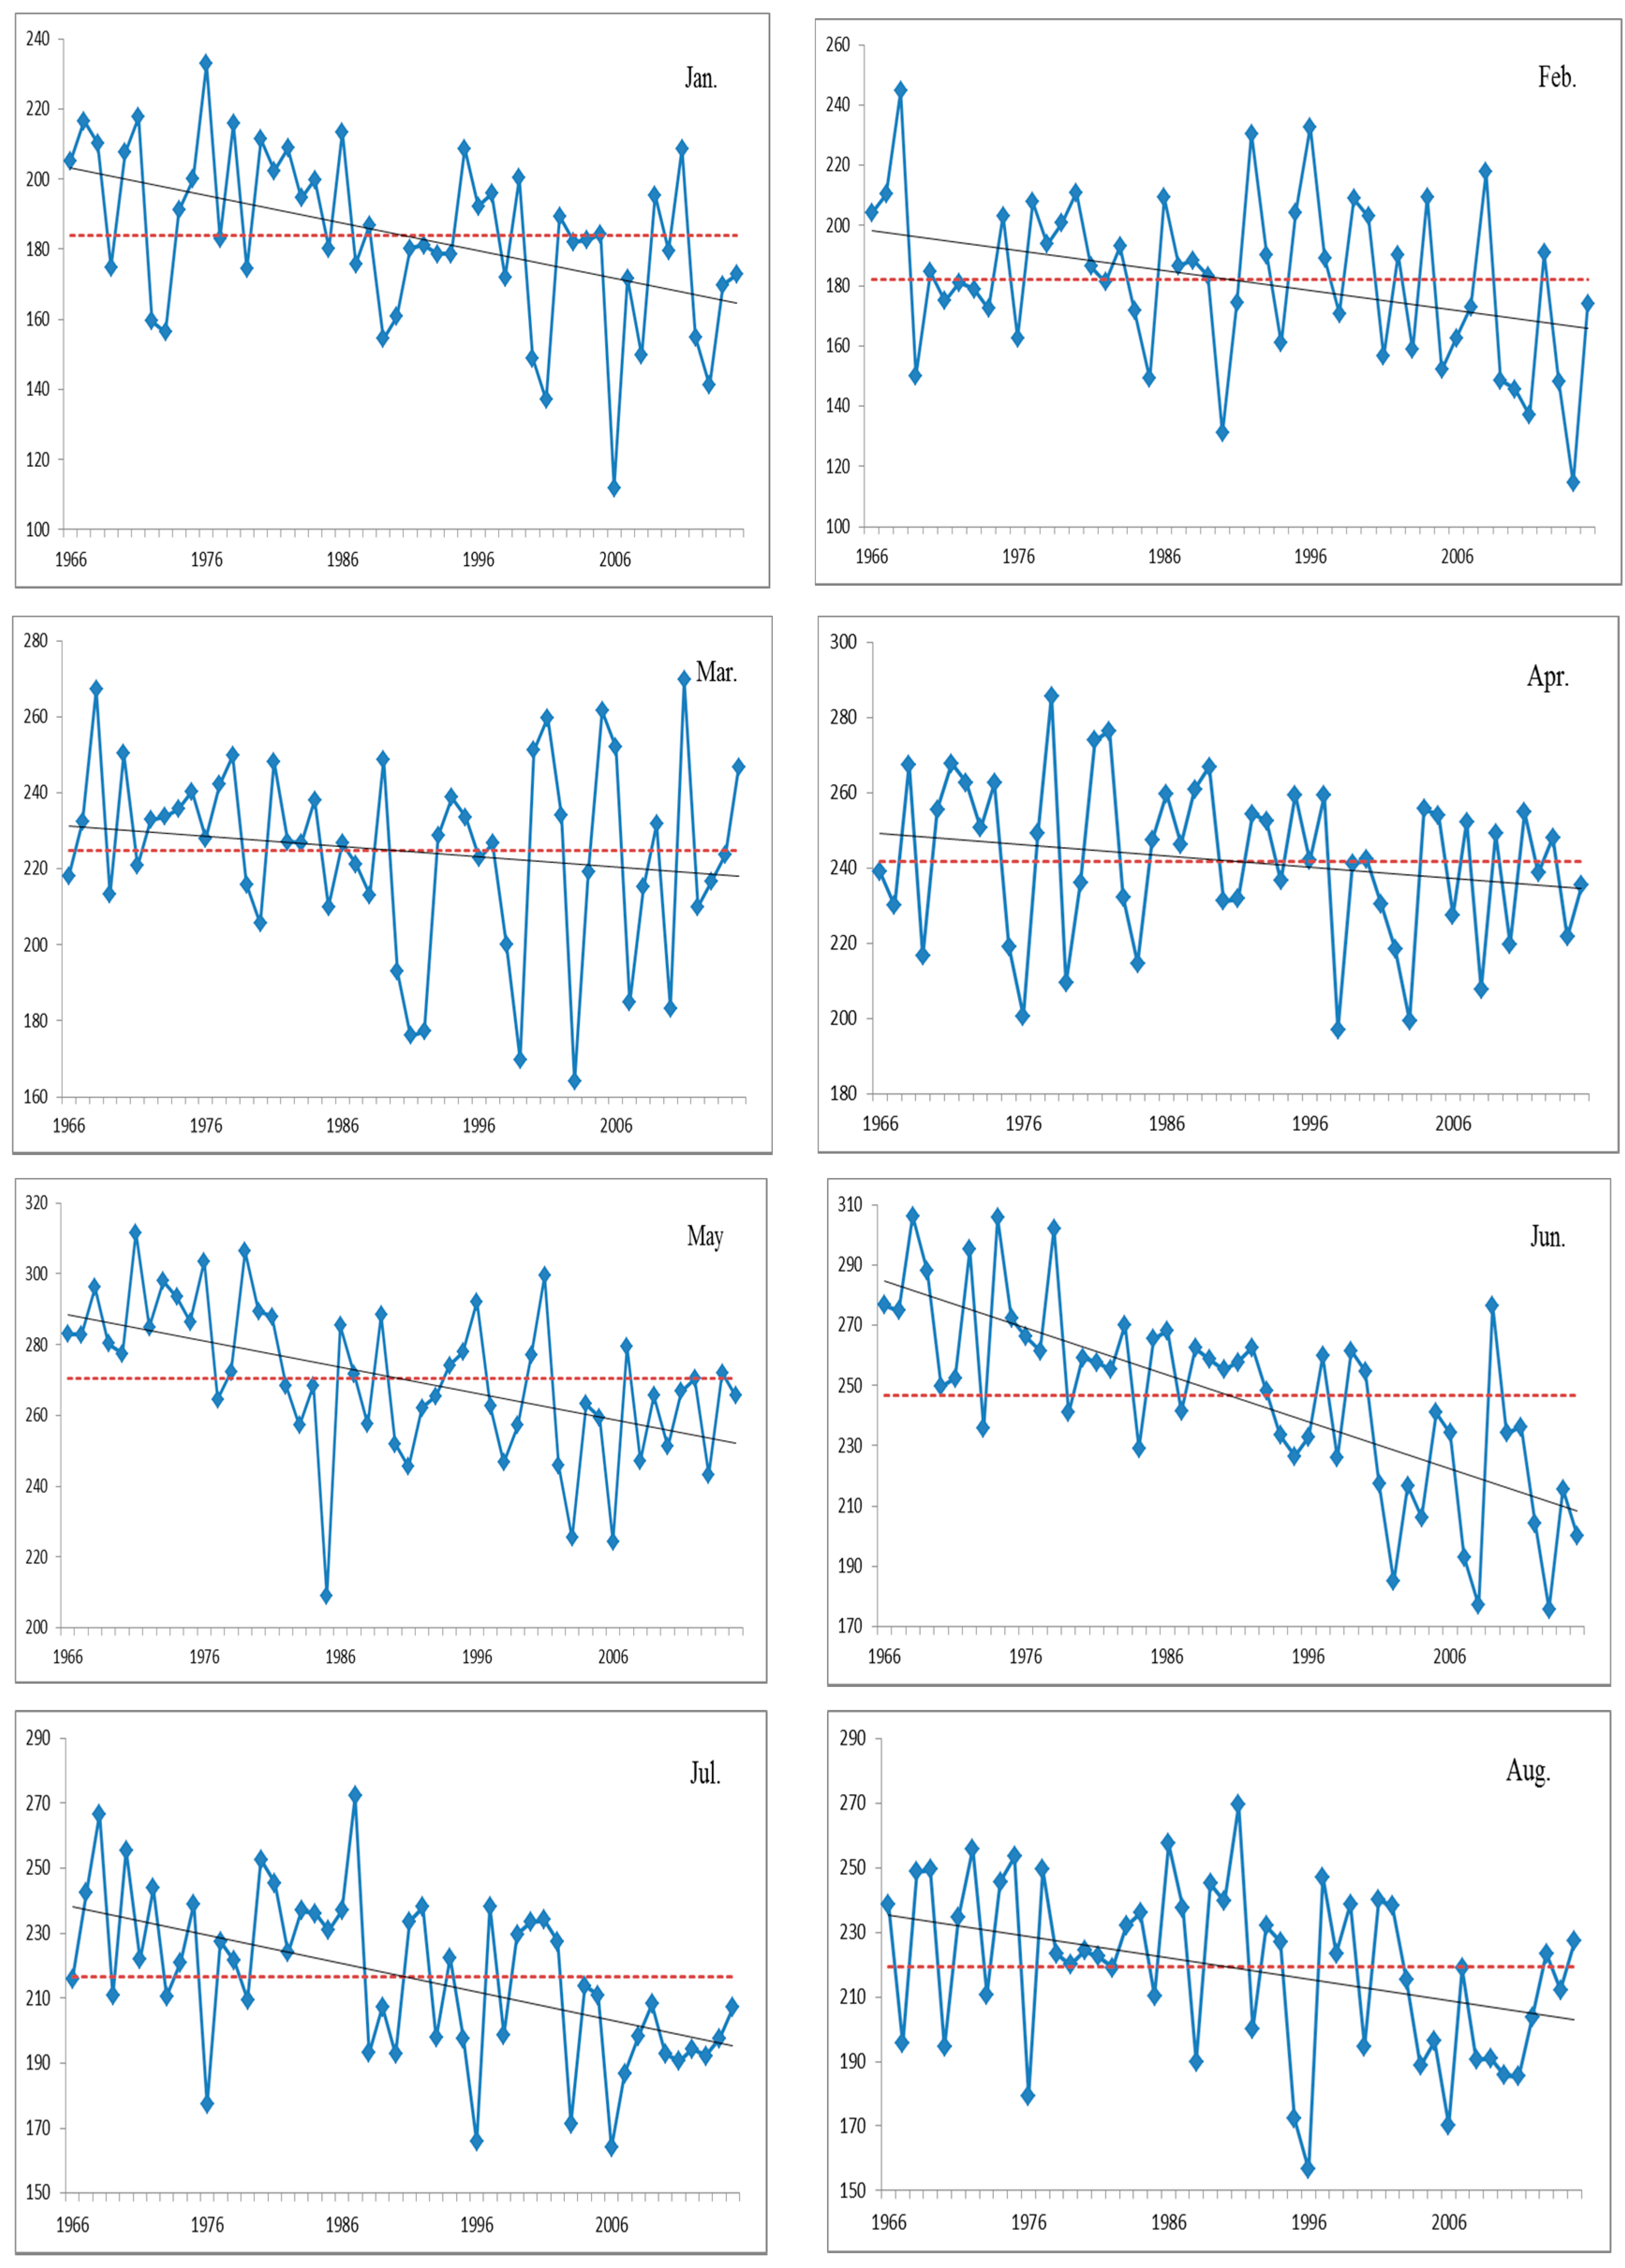
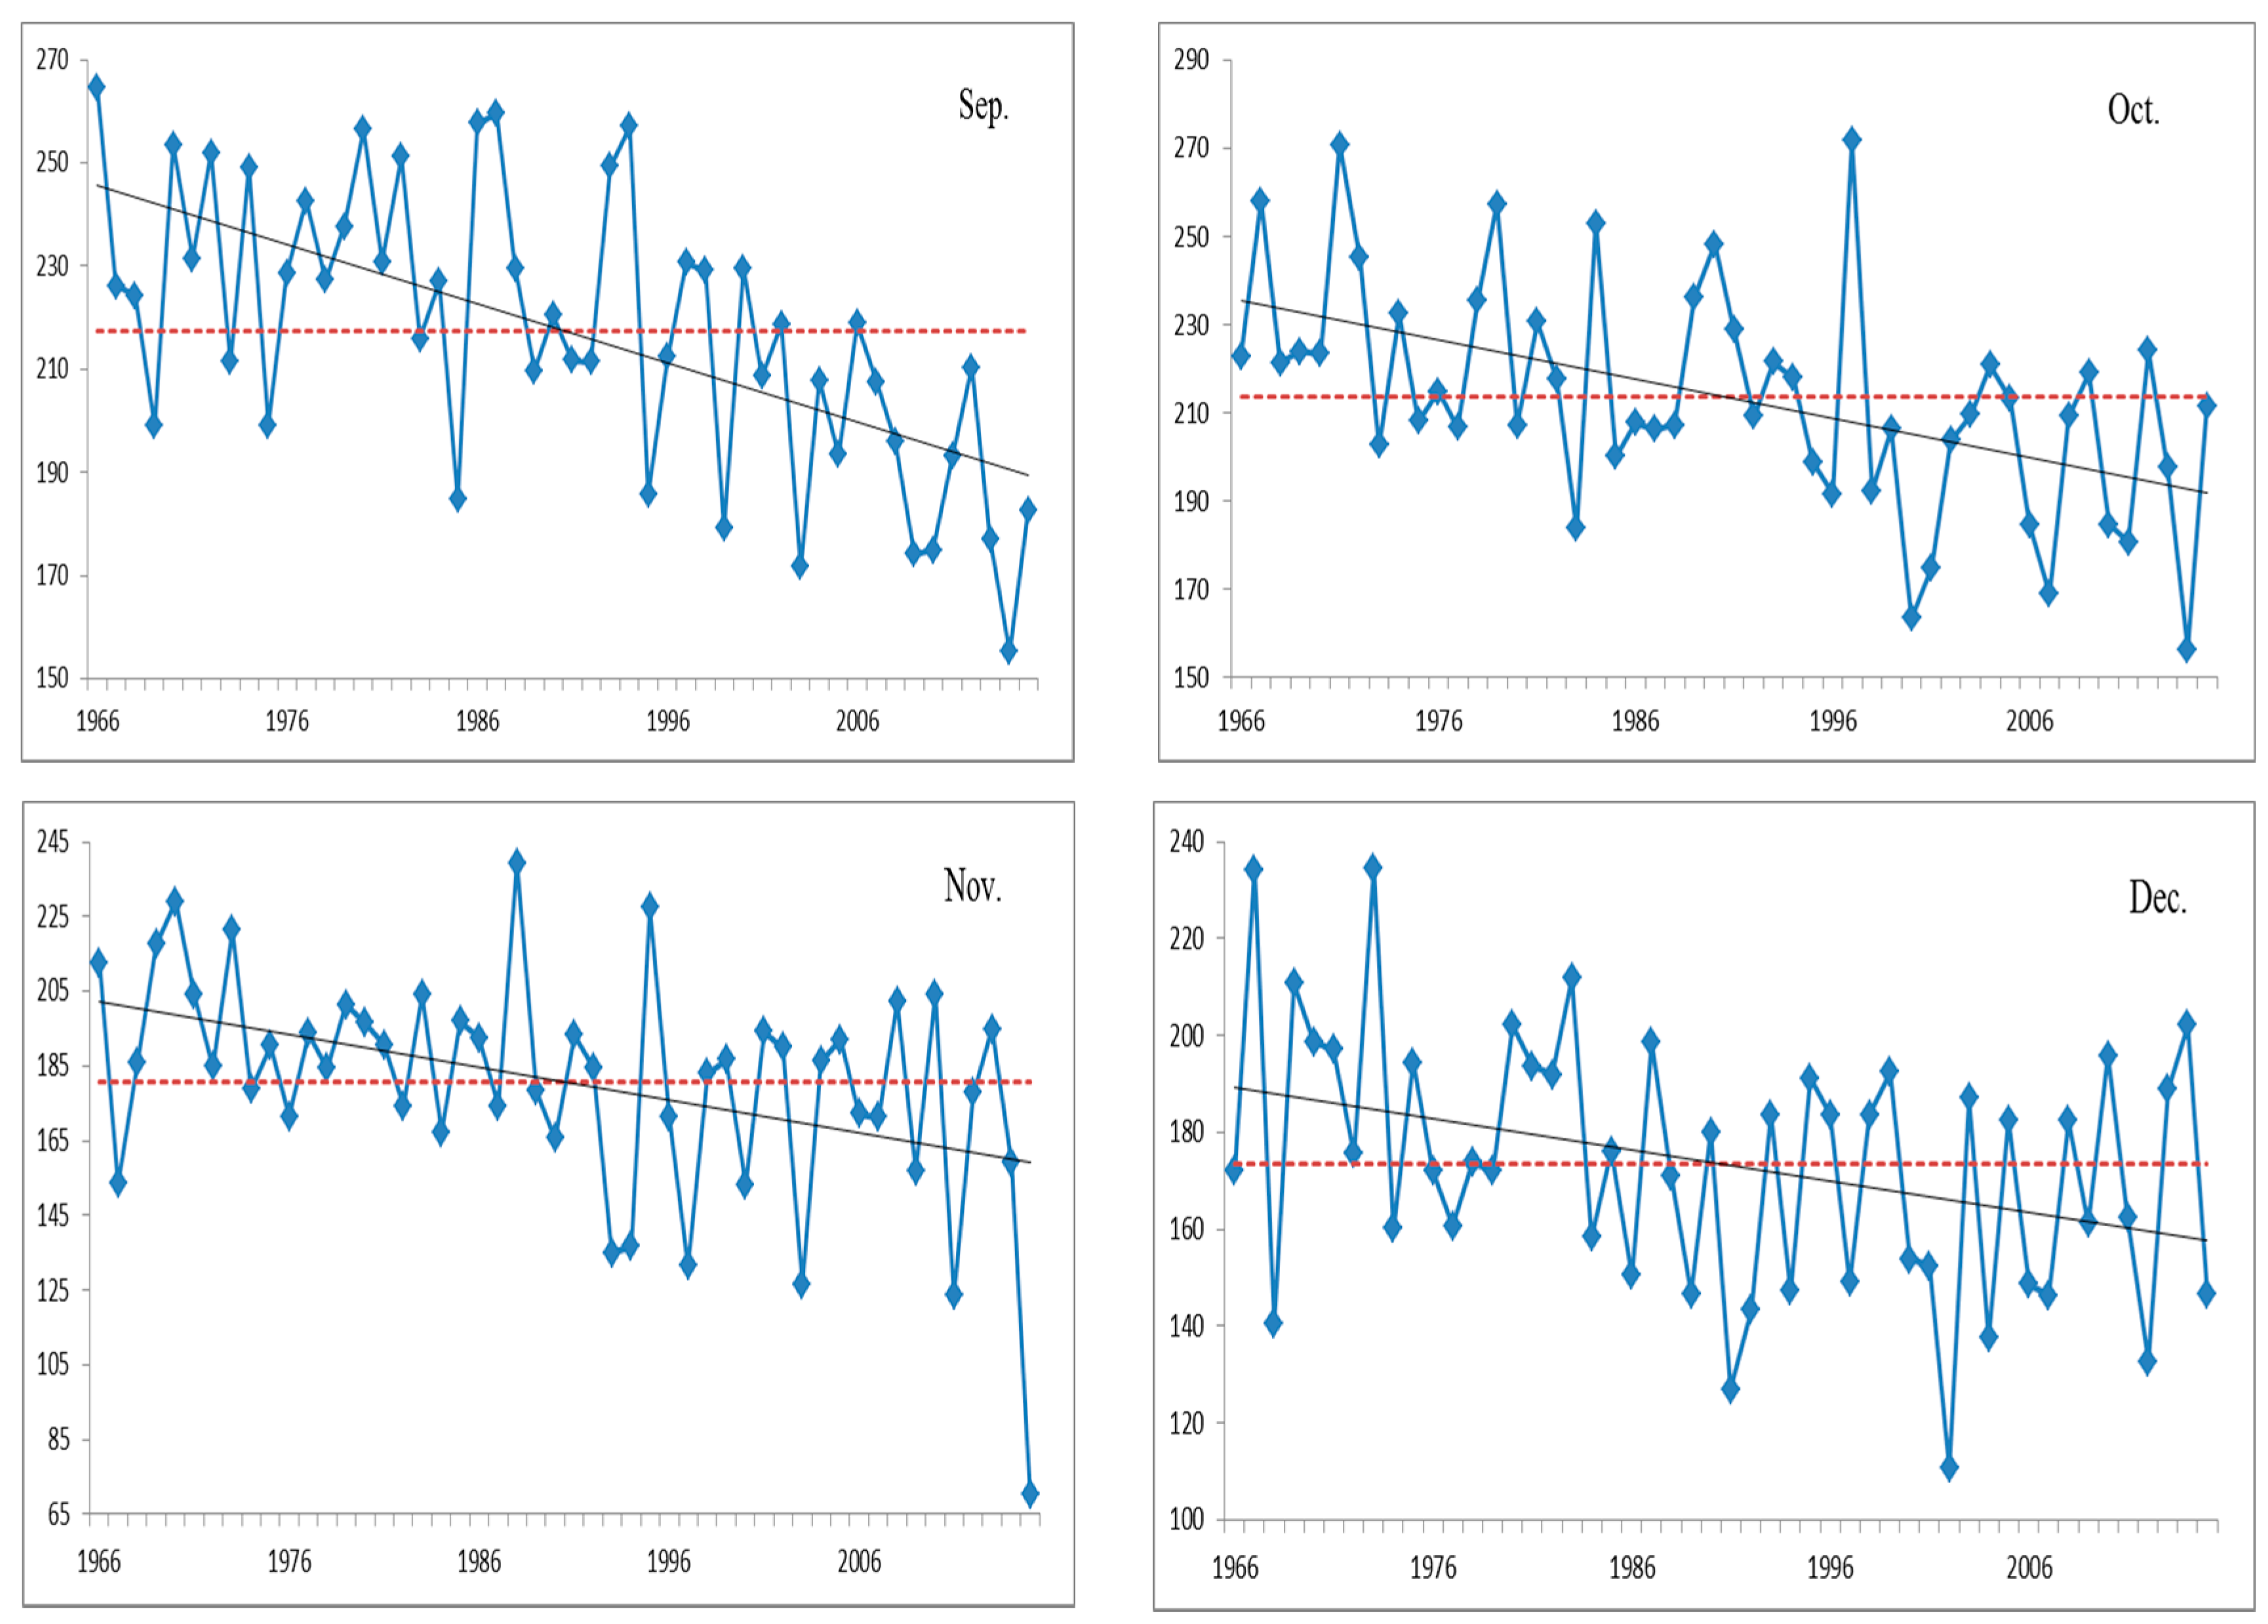
3.1.3. Monthly Sunshine Duration

Figure 6 shows that the monthly sunshine duration also shows a declining trend in the Haihe River basin during 1966–2015, with a maximum tendency rate of −1.56 h/a in June and a minimum tendency rate of −0.27 h/a in March. The mean monthly sunshine duration reaches a maximum of 270.3 in May where there is a long daytime, and a minimum of 173.4 h in December (Table 1). Beginning in July, the Haihe River basin is in the rainy season, resulting in a remarkable decrease in monthly sunshine duration.

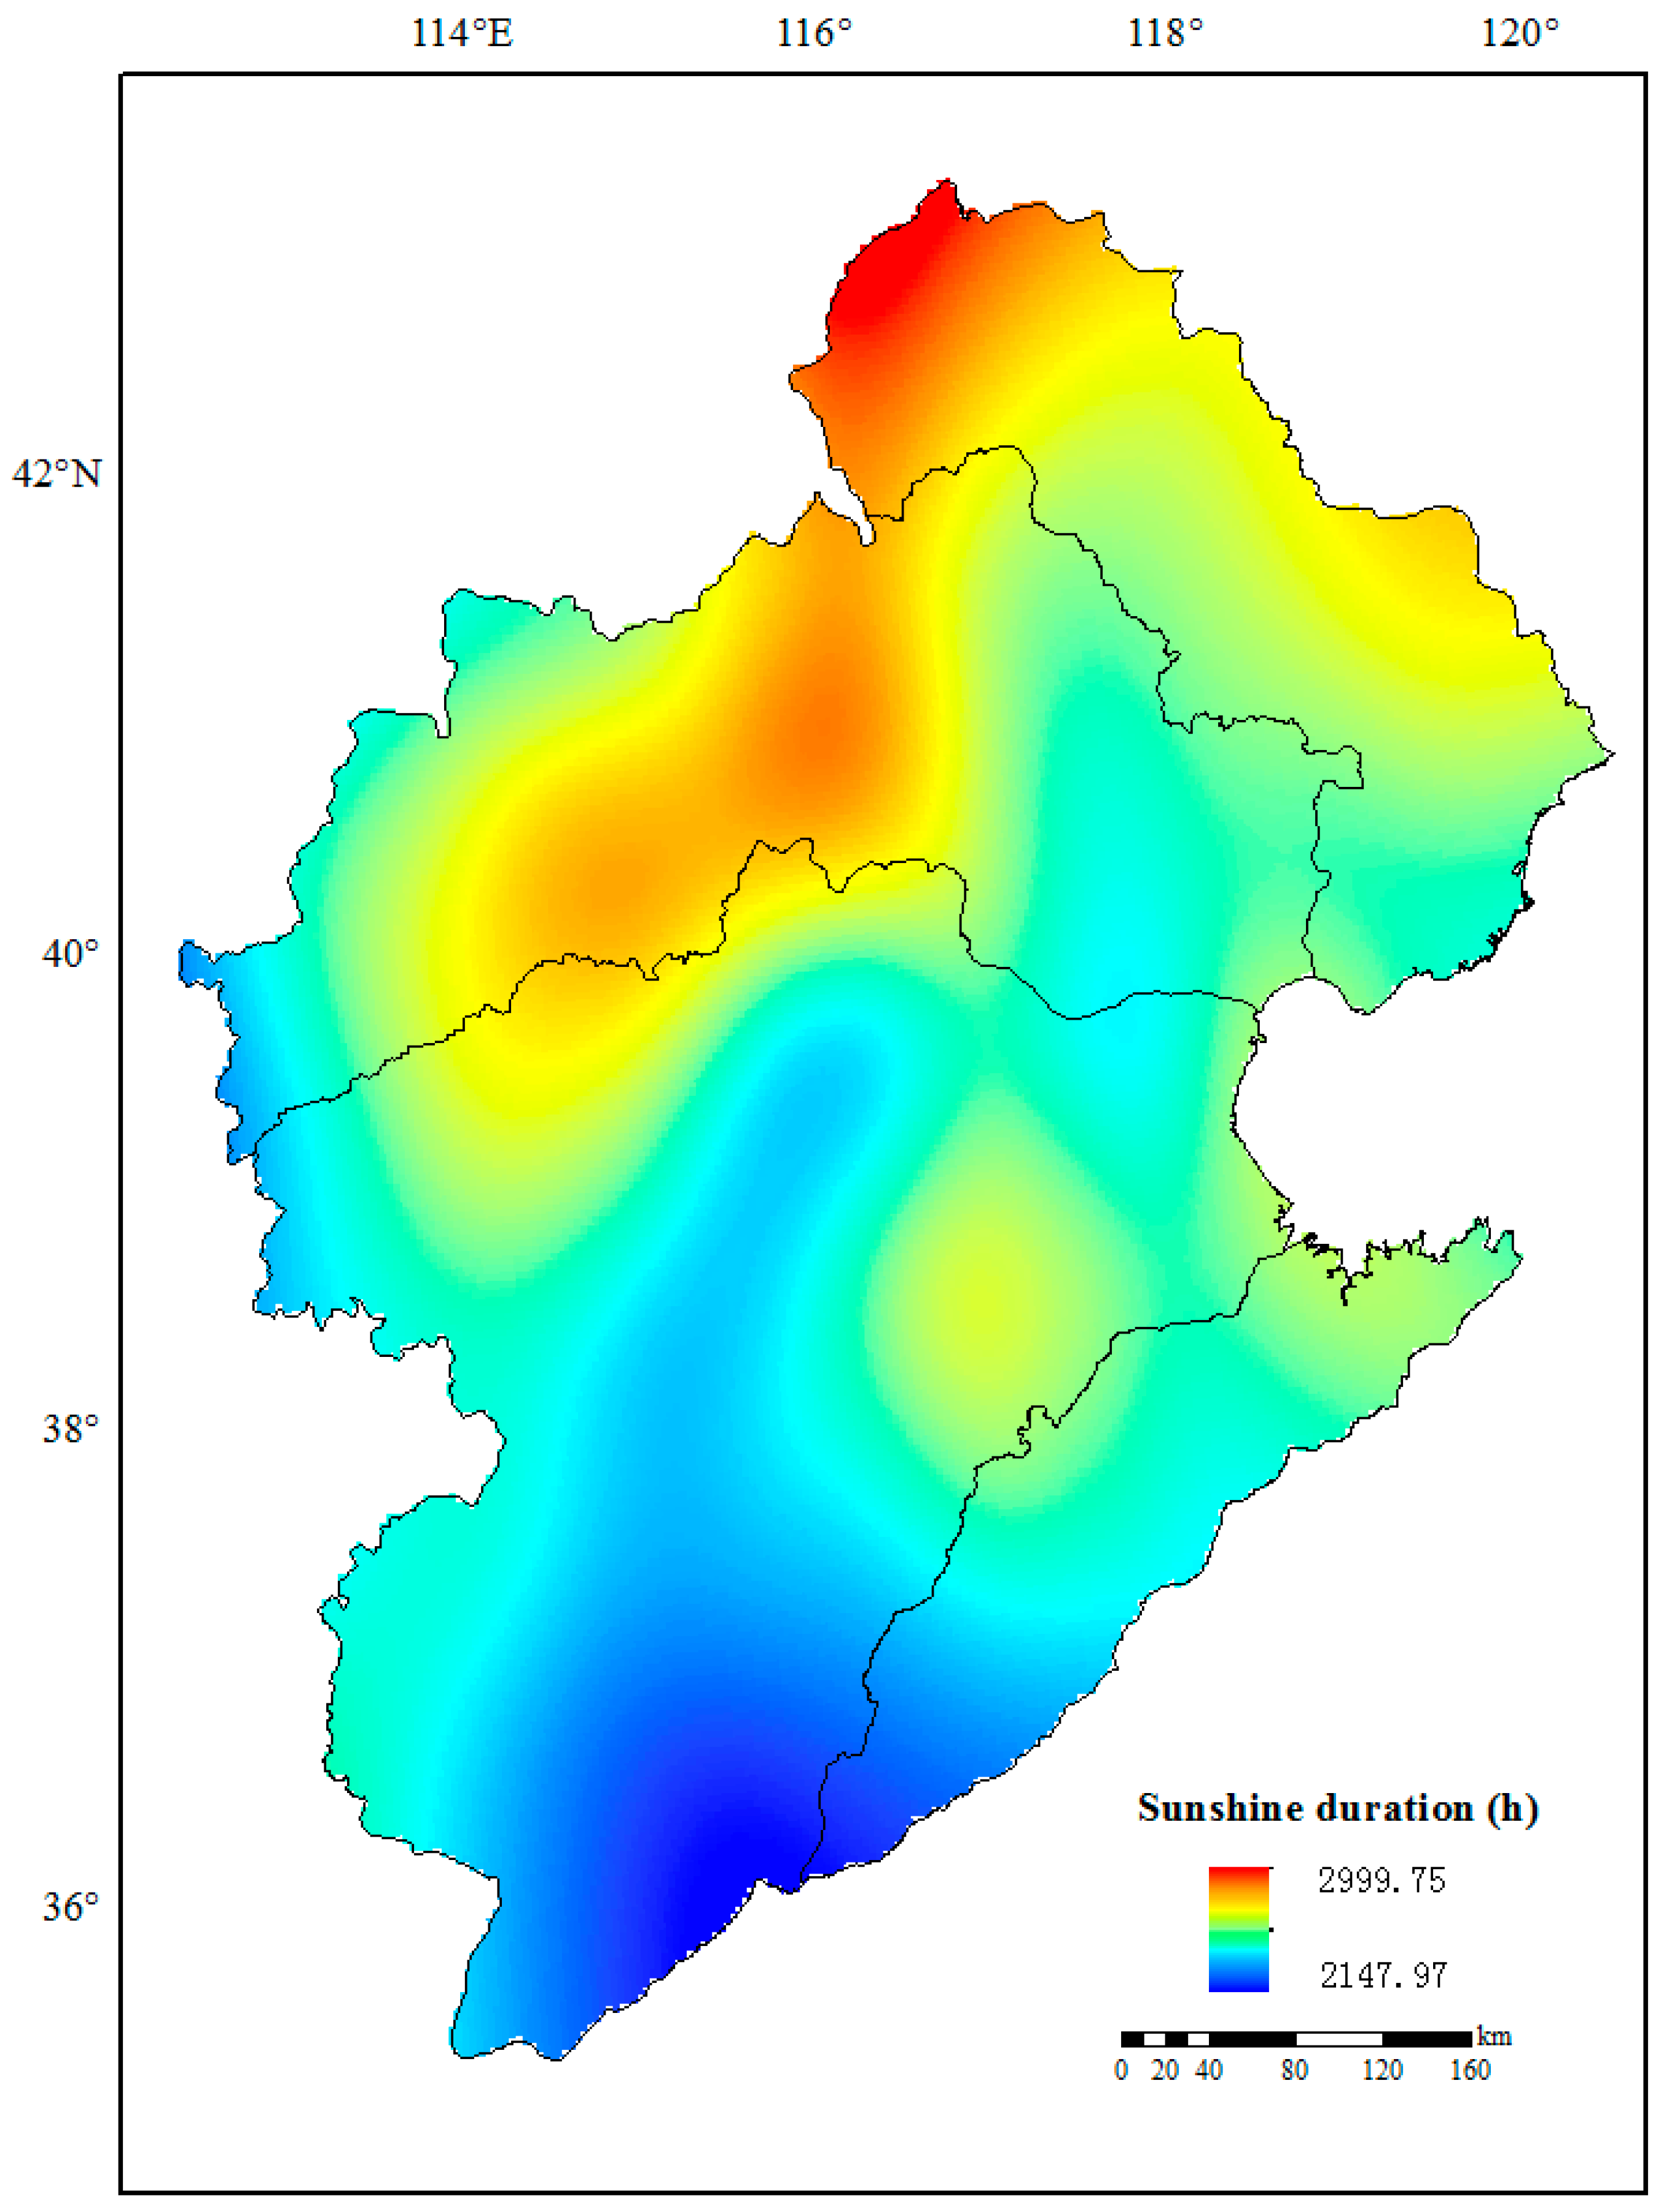
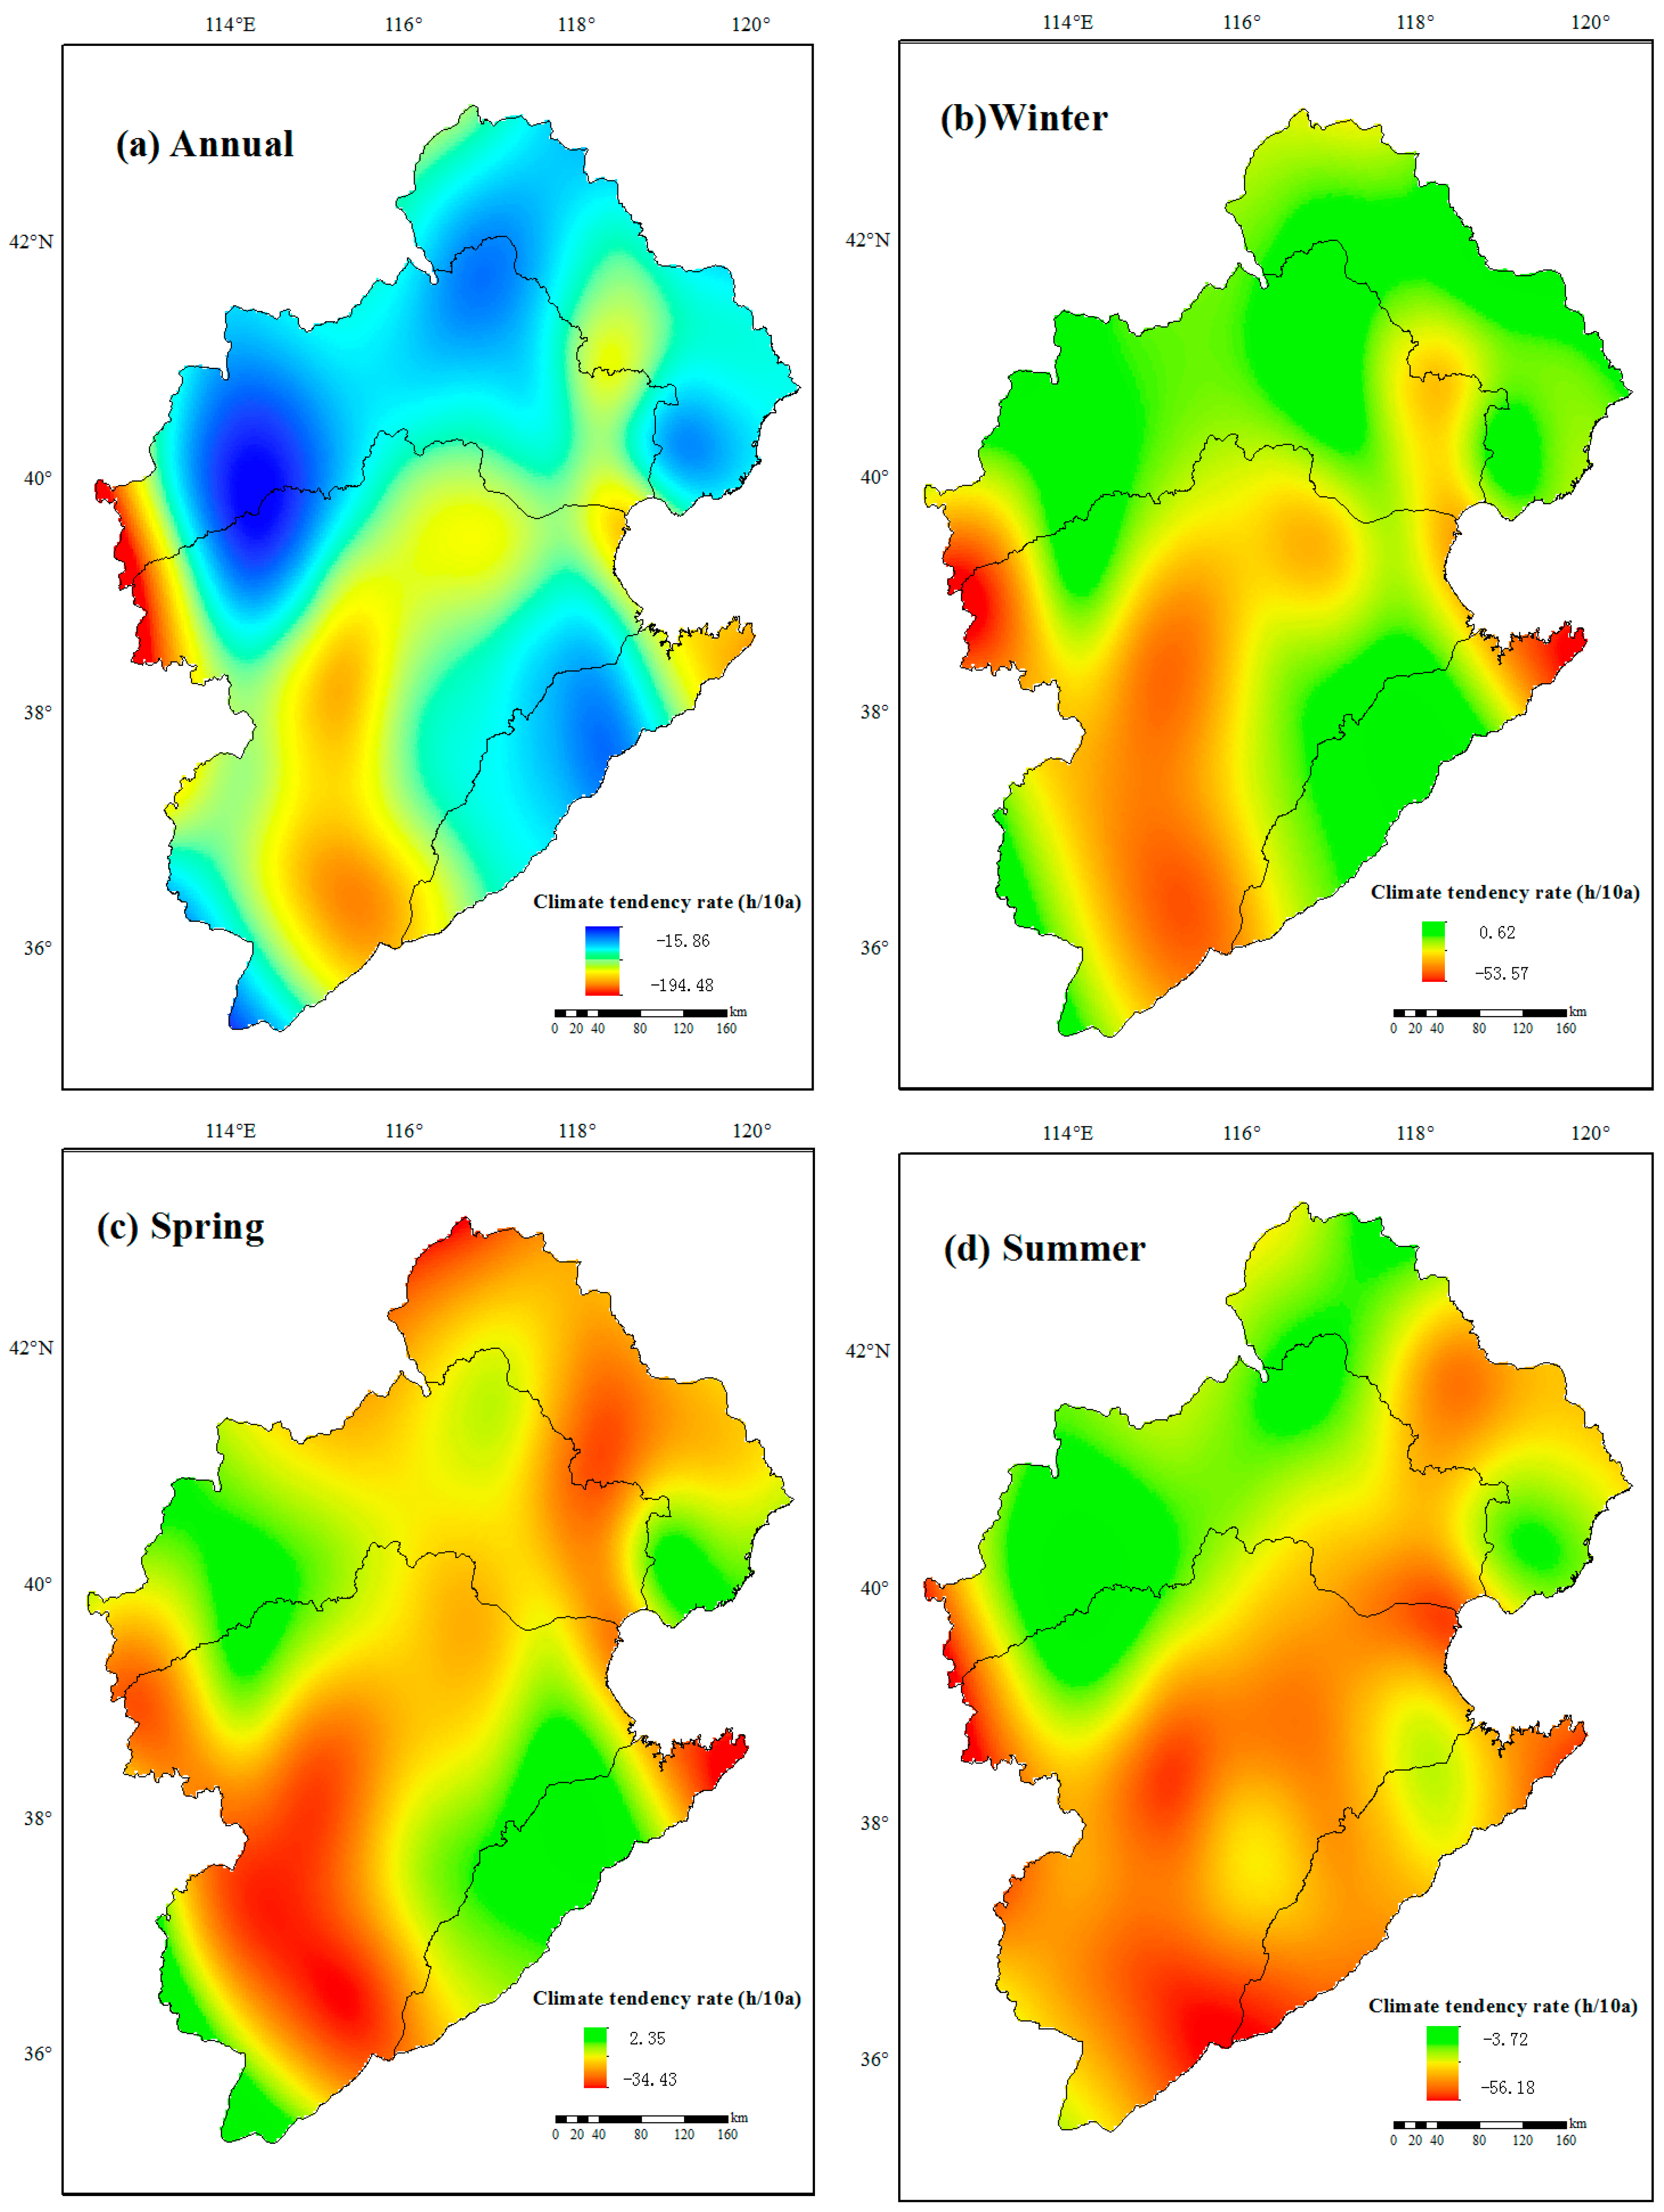
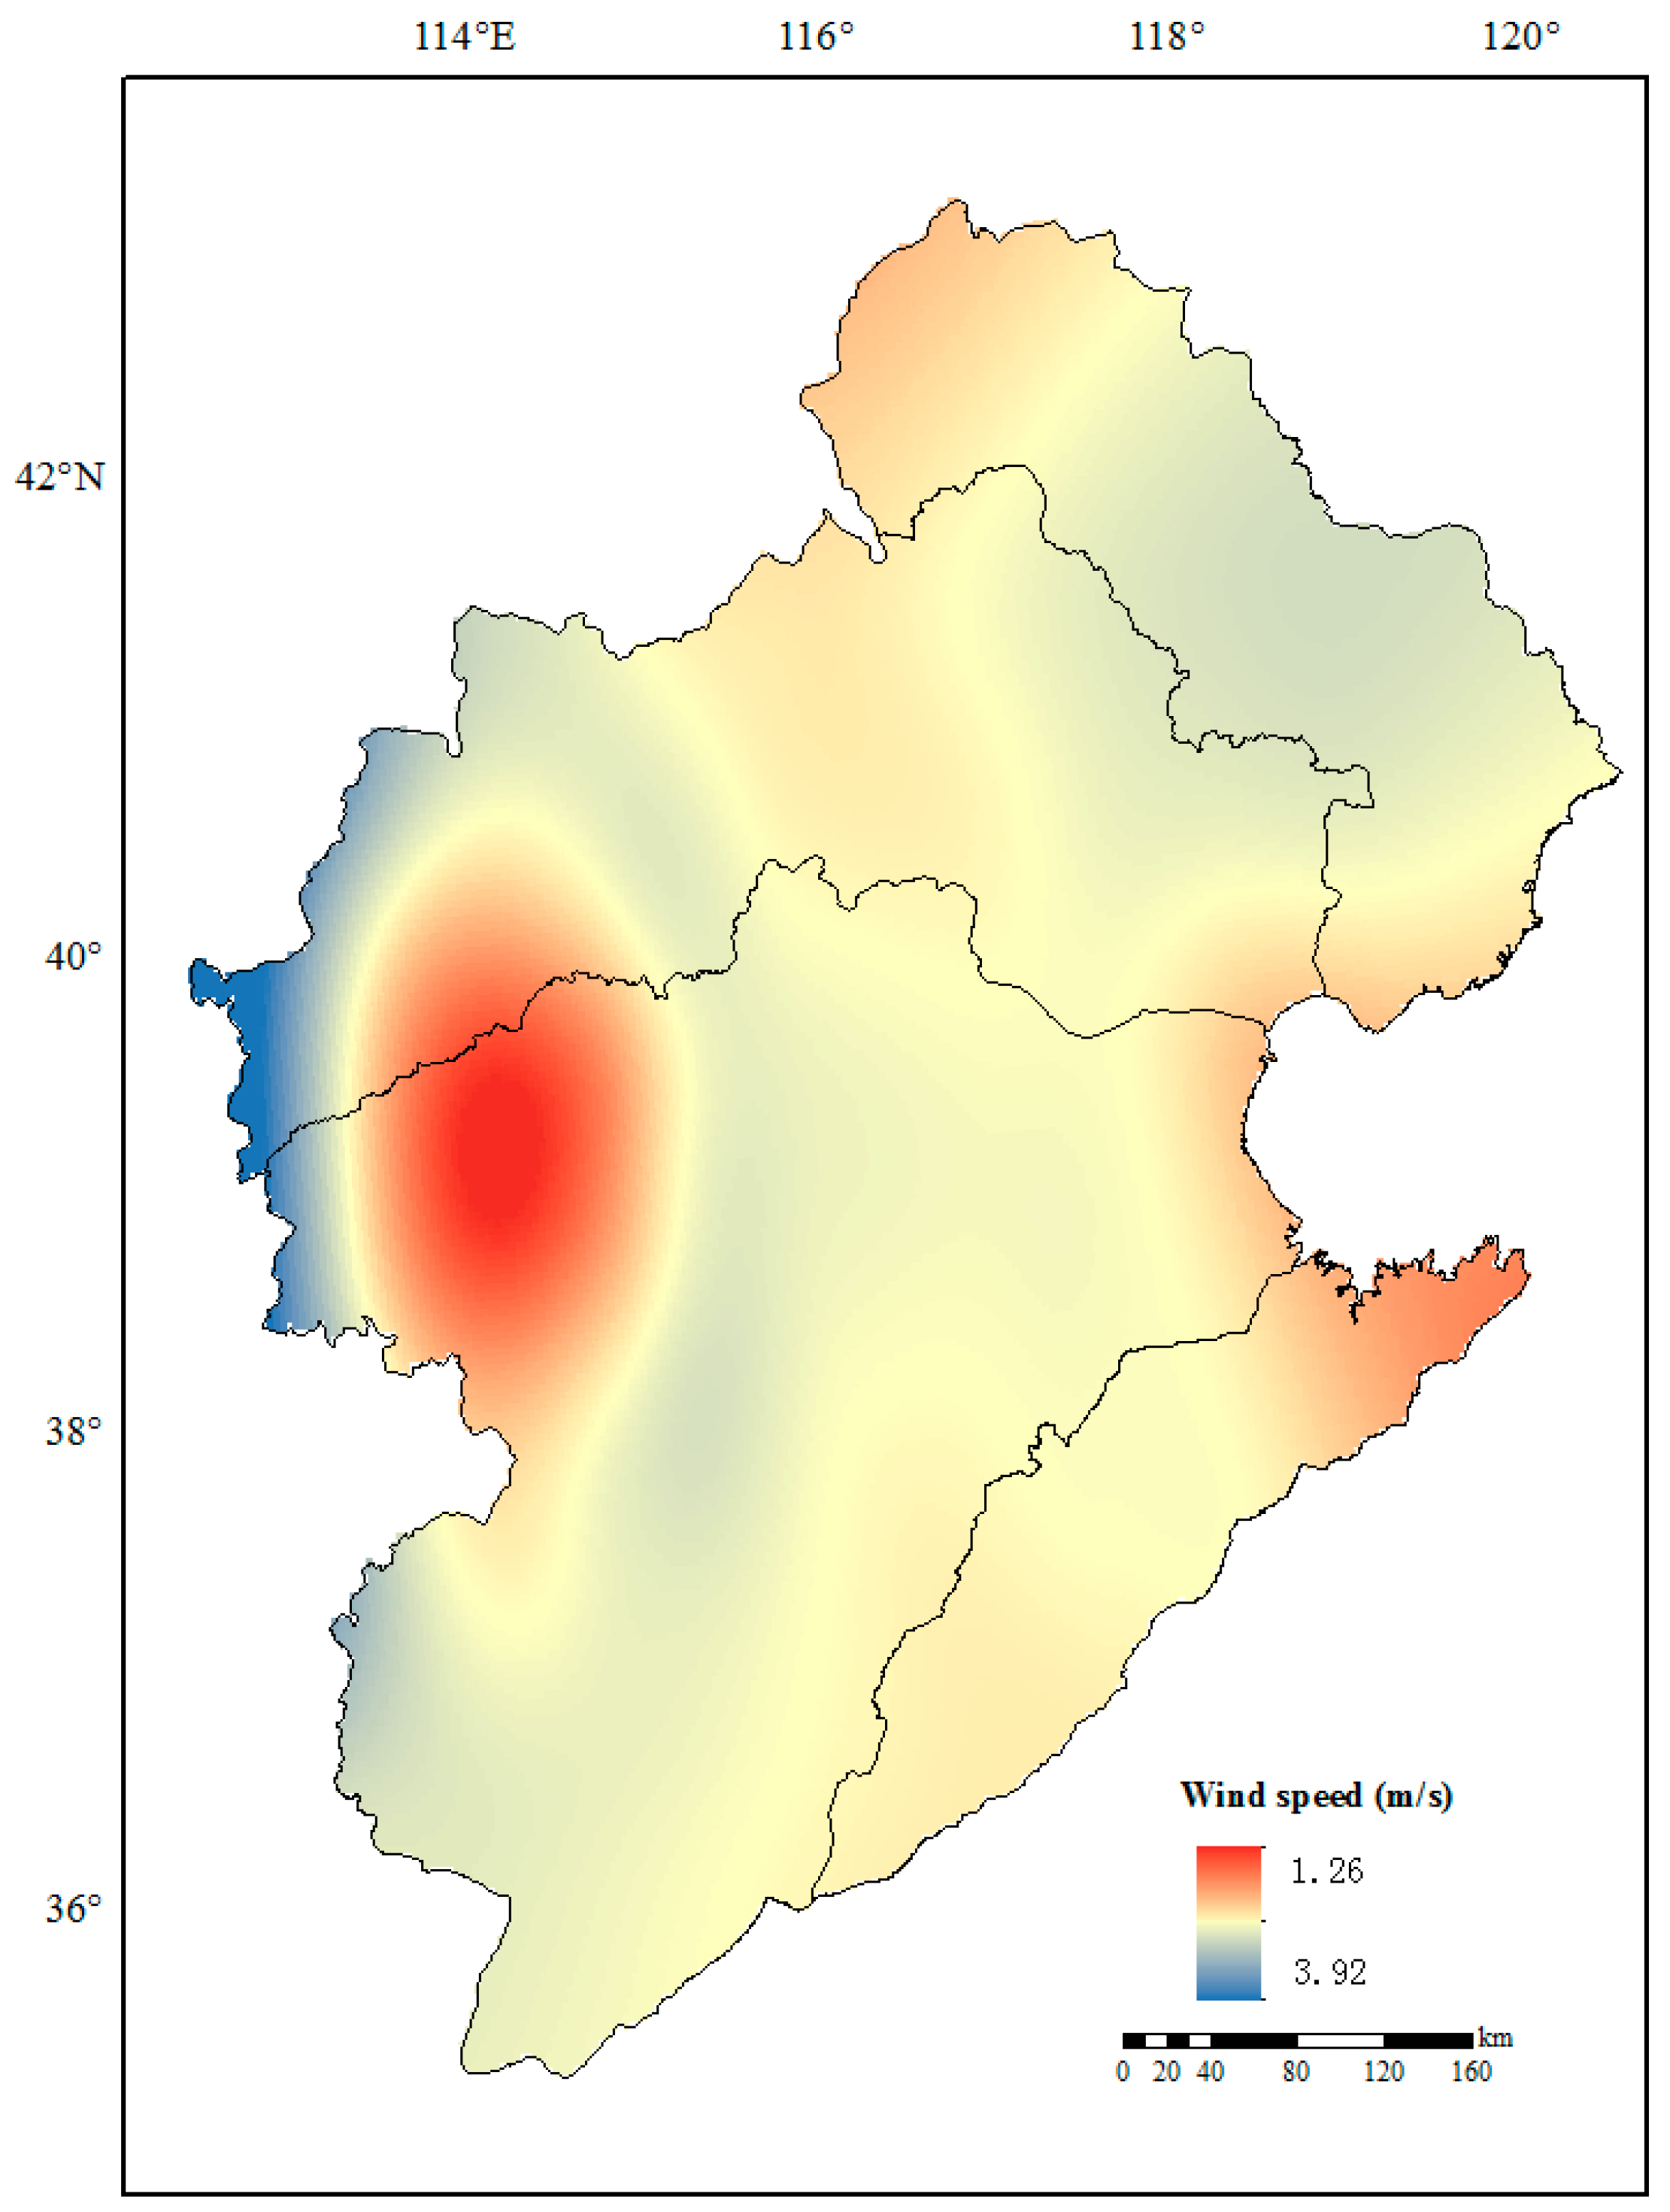
3.2. Spatial Change of Sunshine Duration

Figure 7 shows the spatial variability of annual sunshine duration in the Haihe River basin during 1966–2015. It is evident that the annual sunshine duration is much longer in the northwest Yanshan and Taihang mountainous regions with a low population density than in the southeast regions with a high population density. The maximum annual sunshine duration is observed at Duolun station (2999.75 h); while the minimum one is observed at Anyang station (2147.97 h). However, despite the significant spatial variability, the annual sunshine duration at all stations shows a decreasing trend, with the most significant decrease occurring at those stations in the southern regions.
Figure 8 shows the spatial distribution of climate tendency rate in the Haihe River basin during 1966–2015. Similarly, almost all the stations show a decreasing trend in winter, with the most significant decrease observed at Yuanping station in the southern region with a climate tendency rate of −53.57 h/10a. However, it is important to note that an increasing trend is observed at Fengning station located in the northwestern Yanshan and Taihang mountainous regions with a low population density. In spring, 93% stations show a decreasing trend, with the most significant decrease observed in lower-altitude regions, especially in southern and eastern coastal regions; whereas stations in higher-altitude regions show no significant change. In addition, the decreasing trend is more obvious in summer than in autumn. Overall, the sunshine duration decreases in the lower-altitude regions, but increases in the higher-altitude regions.

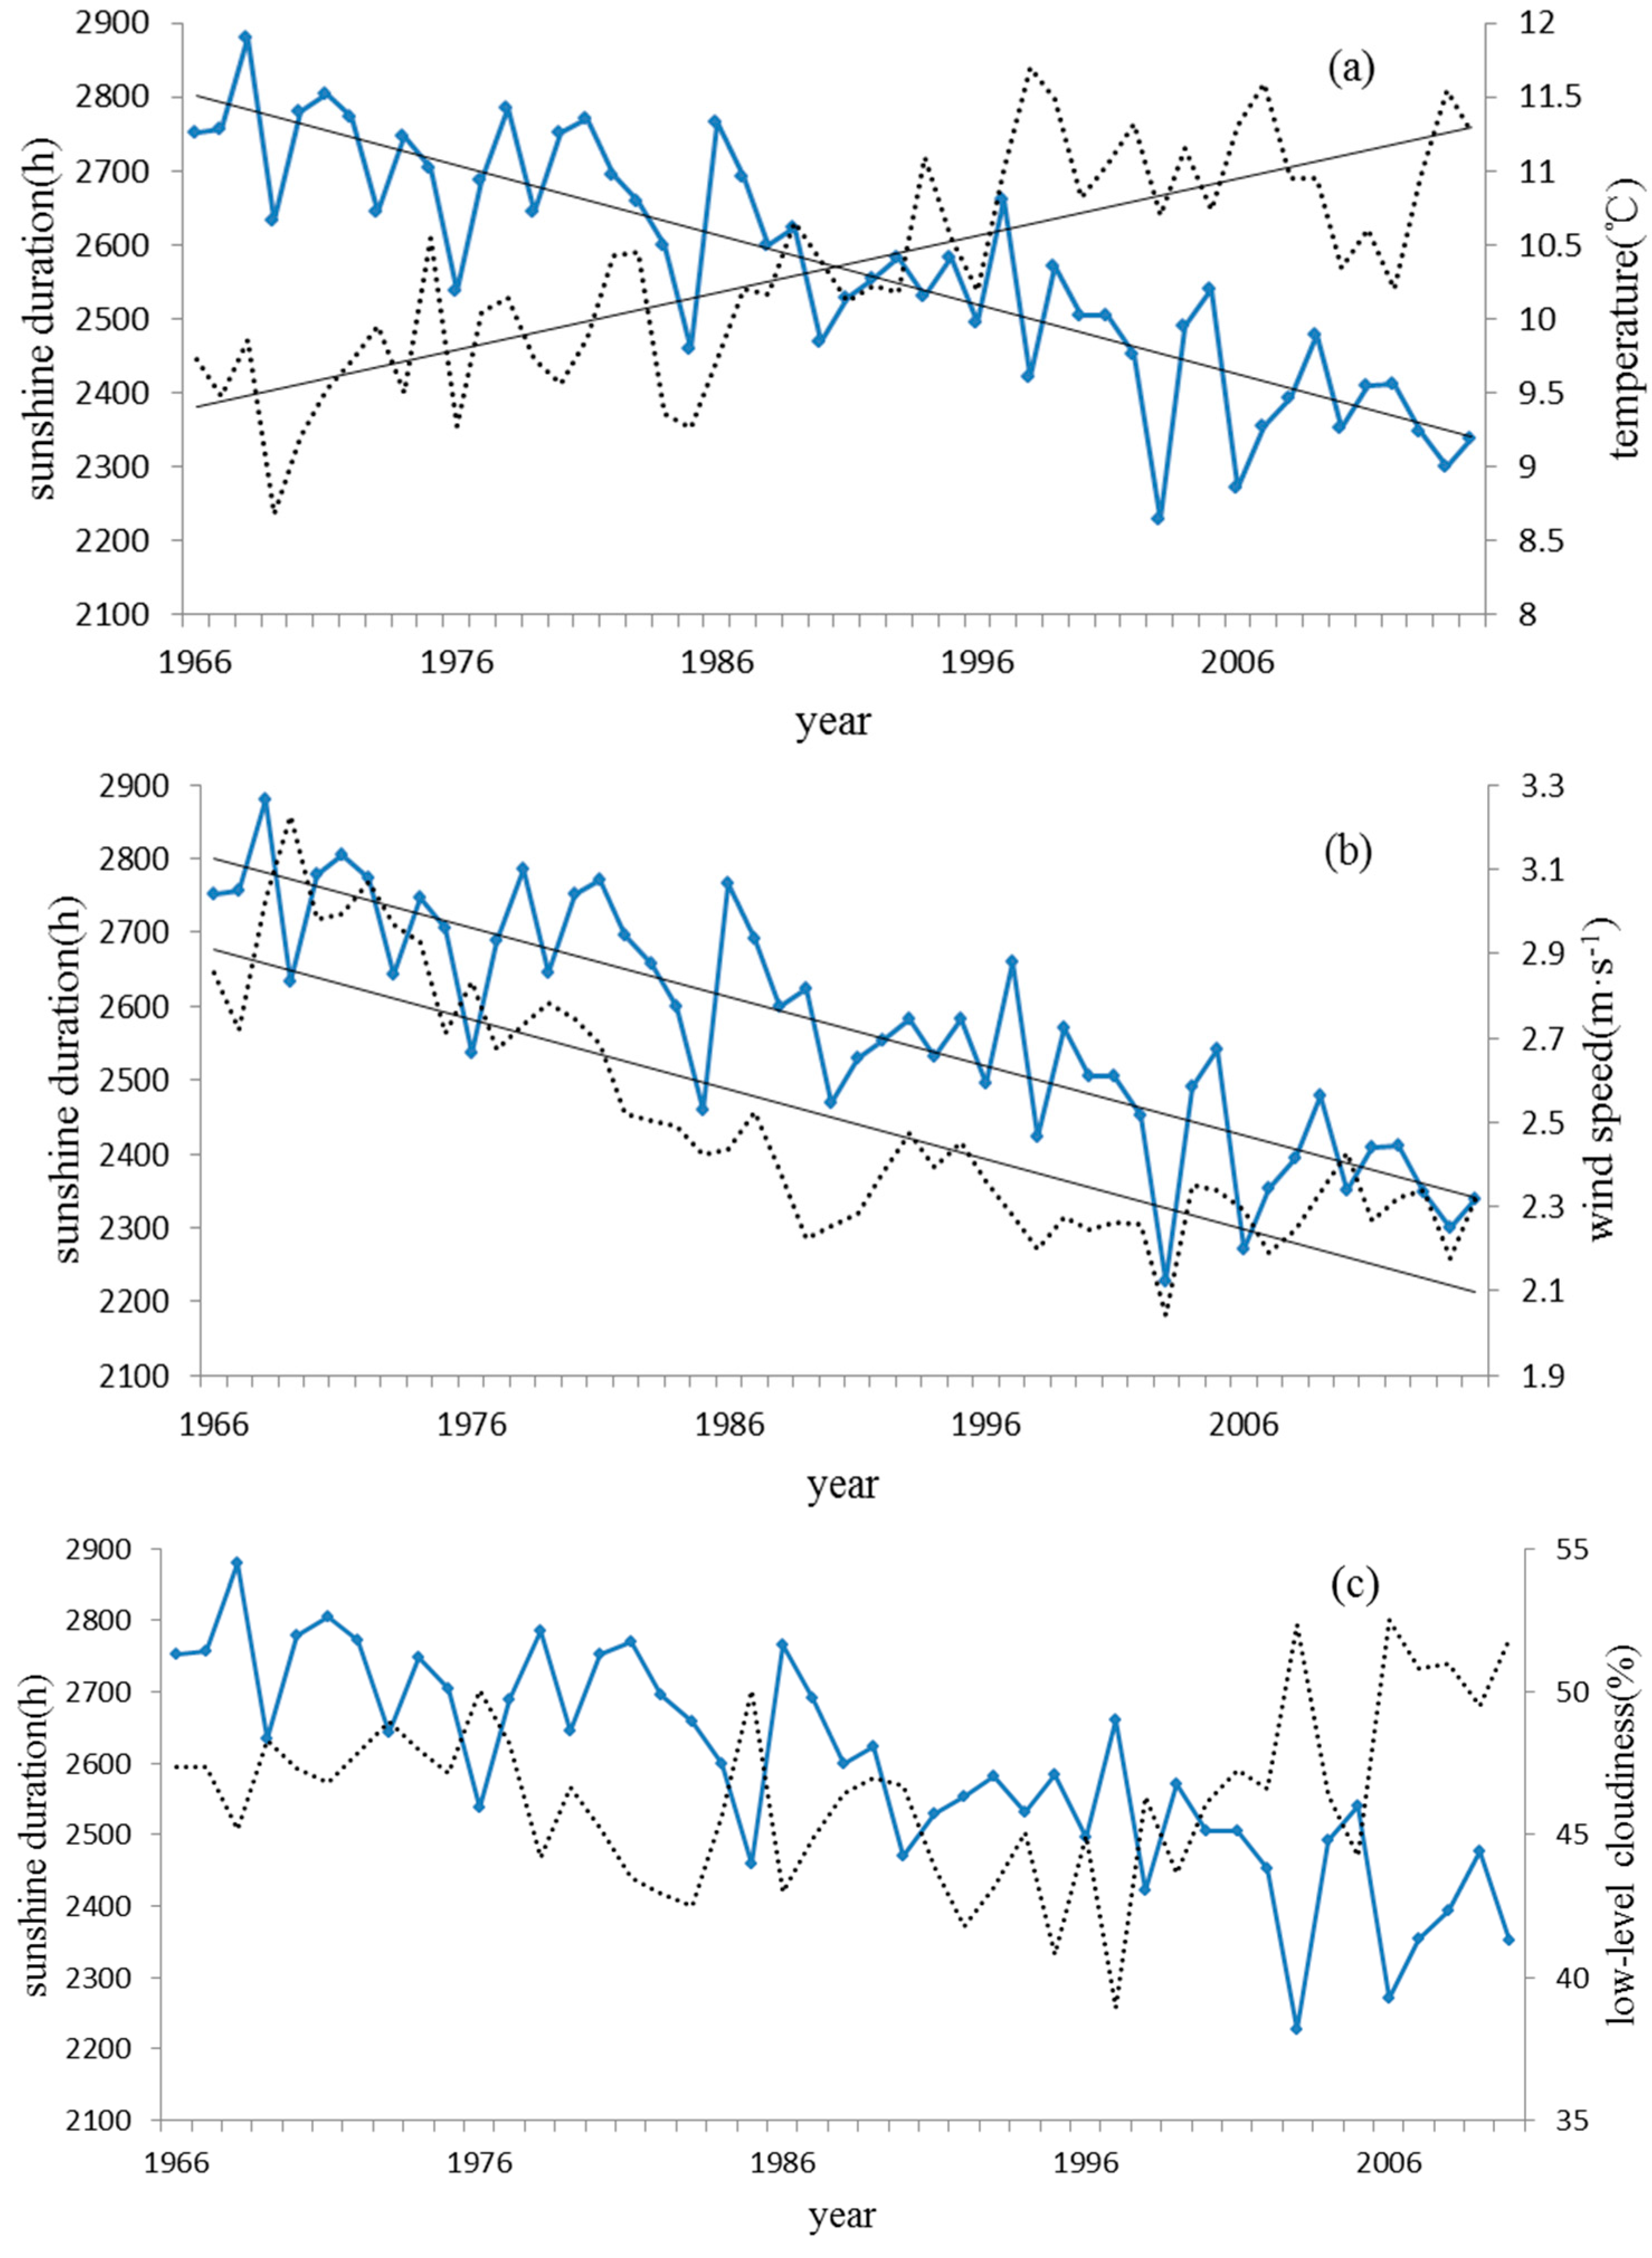
3.3. Relationship of Sunshine Duration with Temperature and Wind Speed

The mean annual temperature of the Haihe River basin during 1966–2015 is 10.35 °C, with a maximum of 11.67 °C in 1998 and a minimum of 8.68 °C in 1969. The annual temperature is increased by 0.04 °C/a. The intersection point of UF and UB curves is observed in 1988, which lies within the two critical lines at a significance level α of 5%, indicating a significant change in annual average temperature in 1988. Since the 1990s, the increasing trend in annual average temperature becomes more pronounced. The seasonal temperature in winter, spring, summer and autumn is increased by 0.026–0.056 °C/a. The maximum increase is observed in winter, with a tendency rate of 0.056 °C/a, followed by that in spring, autumn and summer, with a tendency rate of 0.041, 0.031 and 0.026 °C/a, respectively.
The mean annual wind speed of the Haihe River basin during 1966–2015 is 2.504 m/s, with a maximum of 3.227 m/s in 1969 and a minimum of 2.043 m/s in 2003. Also, it shows a declining trend with a tendency rate of 0.17 m/s per decade. However, the annual wind speed in 2006–2015 is 0.029 m/s higher than that in 1996–2005. The mean M-K value is −3.95. Since 1972, the annual mean wind speed decreases continuously. In 1980, the trend value exceeds the critical value of α = 5%, indicating a significant decline in the annual wind speed. The maximum decrease is observed in winter, with a tendency rate of −0.0214 h/a, followed by that in spring, autumn and summer, with a tendency rate of −0.0205, −0.0149 and −0.0095, respectively. The wind speed in winter (2.53 m/s) and spring (3.10 m/s) is higher than the mean, whereas in autumn (2.22 m/s) and summer (2.18 m/s) it is lower than the mean.
Table 2 shows that the annual sunshine duration is negatively correlated with the annual temperature, but positively correlated with the annual wind speed. Figure 9 shows that the annual sunshine duration decreases as the annual temperature increases or as the annual wind speed decreases. However, there is no significant correlation between seasonal sunshine duration and temperature; but a significant negative correlation exists between seasonal sunshine duration and wind speed, especially in autumn.

4. Discussion

The decline trend of sunshine duration in the Haihe River basin is similar to that observed in China [24,25] and many other regions [26,27,28]. Since the beginning of the 20th century, the decreasing slows down. It is in accordance with the recent solar brightening. The analysis of seasonal variation led to the same conclusion, and the maximum sunshine duration decrease mainly happened in summer. The spatial distribution of wind speed (Figure 10) is very consistent with the declining trend in sunshine duration (Figure 8). Seasonally, the minimum decrease of wind speed in summer tallies well with the maximum decrease in sunshine duration. Also, the correlation coefficient suggests that the wind speed is an influencing factor of sunshine duration. Figure 9 depicts a significant decline in wind speed over the 50 years. This trend is quite similar to that observed by Yang [2] and Xu [29]. Low wind speed is hardly strong enough to naturally blow away clouds, aerosols and other air pollutants, and stronger winds lead to longer sunshine duration, further validating that wind speed influences sunshine duration. Similar studies like Satheesh and Moorthy [30] showed that wind speed could significantly affect global radiative forces by affecting natural aerosol concentration. Many studies also have observed a correlation between aerosol and wind speed [31,32,33]. The interactions between wind speed and aerosol loading may be the enabling forces behind the influence of wind speed on changes in sunshine duration [34].
In general, an increase in temperature is normally associated with an increase in sunshine duration. However, with the rise in temperature, more moisture is evaporated from the ocean, therefore increasing the amount of atmospheric water vapor—greenhouse gas. In this way, the greenhouse effect becomes stronger, resulting in a further increase in temperature. Additionally, urbanization processes in this area enhance the rise in temperatures [35,36]. Thus, though the annual mean temperature in the Haihe River basin is on the rise, the sunshine duration is decreasing.
According to the latest IPCC (Intergovernmental Panel on Climate Change) report, human activity is likely to be the main cause of global warming since the middle of the 20th century, and continued emission of greenhouse gases would cause further warming and aerosols [37]. Aerosols can absorb solar radiation, resulting in a reduction in the solar radiation reaching the ground and, consequently, a reduction in the sunshine duration [11,38]. In the Haihe River basin, there is a significant correlation between the aerosol index and sunshine duration, indicating that change in aerosols has an impact on the decrease in sunshine duration. It is found that the aerosol index increases sharply since 1989, which is consistent with the trend in sunshine duration. Spatially, the most obvious increase in aerosol index is observed in the eastern and southern regions of the basin where there is a decrease in solar radiation [39].
Low-level cloudiness and sunshine duration has apparent correlation [40]. In general, the clouds can absorb and hinder the sunshine, and the decrease of sunshine duration is closely related to the increase of cloud cover. However, in this study, the variation of low-level cloudiness was insignificant and even decreasing accompanying the fall in sunshine duration for 1966–1997. The mean annual low-level cloudiness of the Haihe River basin during 1966–2010 is 46.10%, with a maximum of 52.49% in 2006 and a minimum of 38.94% in 1997 (Figure 9). During 1980–1990, the trend value exceeds the critical value of α = 5%, indicating a significant decline in the annual low-level cloudiness. In the late 1990s, however, the trend is increasing, and annual low-level cloudiness is increased by 0.083. The maximum increase is observed in winter, and in spring, the low-level cloudiness is decreased. The correlation between annual sunshine duration and annual low cloud cover is not significant (Table 2), but seasonal correlation exceeds the critical value of α = 1%. In winter, the correlation coefficient of sunshine duration with low-level cloudiness is −0.81, which is the highest.
The decrease in sunshine hours is not driven by cloud cover change in the study area. Beginning in the 20th century the low-level cloudiness was increasing. Similarly, Kaiser [41] found a decreasing trend for most of the stations in China during 1951–1994, and Qian [42] found the decrease trend in 1955–2000. Albrecht [43] explained that increases in aerosol concentrations over the oceans may increase the amount of low-level cloudiness. The increase of low-level cloudiness in winter may be caused by burning fossil fuels for winter heating.

5. Conclusions

In this study, the temporal and spatial variability of sunshine radiation and its relationship with temperature and wind speed were analyzed based on the data from 33 meteorological stations in the Haihe River basin during 1966–2015. The results show that the annual, seasonal and monthly sunshine duration in the Haihe River basin shows a decreasing trend. The annual sunshine duration is much longer in the northwest Yanshan and Taihang mountainous regions with a low population density than that in the southeast regions with a high population density. Annual sunshine duration is correlated negatively with temperature, but positively with wind speed. However, seasonal sunshine duration is positively correlated only with wind speed, and negatively correlated with low-level cloudiness. Thus, wind speed may be one of the important causes of the decrease of sunshine duration in the Haihe River basin. These changes may have significant implications for the hydrological cycle in the area.

Acknowledgments

The research was financed by the Major Science and Technology Program for Water Pollution Control and Treatment (No. 2017ZX07104) and the Nation Science and Technology Support Plan during the 12-Five-Year Period of China projects (Grant No. 2012BAC19B03). The authors would like to thank the editors and the anonymous reviewers for their crucial comments, which improved the quality of this paper.

Author Contributions

Jing Ren and Liu Xiang analyzed the data; and Jing Ren wrote the paper. Yuhu Zhang, Mingna Wang and Xiaohui Lei revised the paper.

Conflicts of Interest

The authors declare no conflict of interest.

References

  1. Ranzi, R.; Rosso, R. Distributed estimation of incoming direct solar radiation over a drainage basin. J. Hydrol. 1995, 166, 461–478. [Google Scholar] [CrossRef]
  2. Yang, Y.H.; Zhao, N.; Hao, X.H.; Li, C.Q. Decreasing trend of sunshine hours and related driving forces in North China. Theor. Appl. Climatol. 2009, 97, 91–98. [Google Scholar] [CrossRef]
  3. Lenuta, M.; Marius-Victor, B.; Roxana, B.; Alexandru, D.; Magdalena, M.D.; Ancuta, M. An overview of annual climatic changes in Romania: Trends in air temperature, precipitation, sunshine hours, cloud cover, relative humidity and wind speed during the 1961–2013 period. Carpathian J. Earth Environ. 2014, 9, 253–258. [Google Scholar]
  4. Dobesch, H. On the variations of sunshine duration in Austria. Theor. Appl. Climatol. 1992, 46, 33–38. [Google Scholar] [CrossRef]
  5. Sanchez-Lorenzo, A.; Calbo, J.; Martin-Vide, J. Spatial and Temporal Trends in Sunshine Duration over Western Europe (1938–2004). J. Clim. 2008, 21, 6089–6098. [Google Scholar] [CrossRef]
  6. Matuszko, D.; Weglarczyk, S. Relationship between sunshine duration and air temperature and contemporary global warming. Int. J. Climatol. 2015, 35, 3640–3653. [Google Scholar] [CrossRef]
  7. Xu, Z.; Zhao, F. Variation of Sunlight Radiation Duration in the Yellow River Basin. Resour. Sci. 2005, 27, 153–159. (In Chinese) [Google Scholar]
  8. Zhang, L.; Lou, W. Temporal and spatial variations of sunshine duration and its influence factors in lower-middle reach of the Changjiang River in recent 50 years. Resour. Environ. Yangtze Basin 2013, 5, 595–601. (In Chinese) [Google Scholar]
  9. Zhang, M.; Shan, F.; Sheng, Y. Analysis on the Variation Characteristics of Sunshine Hours in Puyang City. Meteorol. Environ. Res. 2011, 2, 23–26. [Google Scholar]
  10. Zheng, X.; Kang, W.; Zhao, T.; Luo, Y.; Duan, C.; Chen, J. Long-term trends in sunshine duration over Yunnan-Guizhou Plateau in Southwest China for 1961–2005. Geophys. Res. Lett. 2008, 35. [Google Scholar] [CrossRef]
  11. Kaiser, D.P.; Qian, Y. Decreasing trends in sunshine duration over China for 1954–1998: Indication of increased haze pollution? Geophys. Res. Lett. 2002, 29, 38-1–38-4. [Google Scholar] [CrossRef]
  12. Lobell, D.B.; Asner, G.P. Climate and management contributions to recent trends in U.S. agricultural yields. Science 2003, 299, 1032. [Google Scholar] [CrossRef] [PubMed]
  13. Deng, N.; Ling, X.; Sun, Y.; Zhang, C.; Fahad, S.; Peng, S.; Cui, K.; Nie, L.; Huang, J. Influence of temperature and solar radiation on grain yield and quality in irrigated rice system. Eur. J. Agron. 2015, 64, 37–46. [Google Scholar] [CrossRef]
  14. Hu, S.; Mo, X.; Lin, Z. The contribution of climate change to the crop phenology and yield in Haihe River Basin. Geogr. Res. 2014, 33, 3–12. (In Chinese) [Google Scholar]
  15. Chu, J.T.; Xia, J.; Xu, C.; Singh, V.P. Statistical downscaling of daily mean temperature, pan evaporation and precipitation for climate change scenarios in Haihe River, China. Theor. Appl. Climatol. 2010, 99, 149–161. [Google Scholar] [CrossRef]
  16. Mann, H.B. Nonparametric Tests against Trend. Econometrica 1945, 13, 245–259. [Google Scholar] [CrossRef]
  17. Kendall, M.G. Rank Correlation Methods; Charles Griffin: London, UK, 1975. [Google Scholar]
  18. Zhang, Q.; Xu, C.; Becker, S.; Jiang, T. Sediment and runoff changes in the Yangtze River basin during past 50 years. J. Hydrol. 2006, 331, 511–523. [Google Scholar] [CrossRef]
  19. Yue, S.; Pilon, P.; Cavadias, G. Power of the Mann-Kendall and Spearman’s rho tests for detecting monotonic trends in hydrological series. J. Hydrol. 2002, 259, 254–271. [Google Scholar] [CrossRef]
  20. Fisher, R.A. Statistical Methods, Experimental Design, and Scientific Inference; Oxford University-Press: New York, NY, USA, 1990. [Google Scholar]
  21. Bartier, P.M.; Keller, C.P. Multivariate interpolation to incorporate thematic surface data using inverse distance weighting (IDW). Comput. Geosci. 1996, 22, 795–799. [Google Scholar] [CrossRef]
  22. Urraca, R.; Martinez-de-Pison, E.; Sanz-Garcia, A.; Antonanzas, J.; Antonanzas-Torres, F. Estimation methods for global solar radiation: Case study evaluation of five different approaches in central Spain. Renew. Sustain. Energy Rev. 2017, 77, 1098–1113. [Google Scholar] [CrossRef]
  23. Rodríguez-Amigo, M.D.C.; Díez-Mediavilla, M.; González-Peña, D.; Pérez-Burgos, A.; Alonso-Tristán, C. Mathematical interpolation methods for spatial estimation of global horizontal irradiation in Castilla-León, Spain: A case study. Sol. Energy 2017, 151, 14–21. [Google Scholar] [CrossRef]
  24. Zhang, Y.L.; Qin, B.Q.; Chen, W.M. Analysis of 40 year records of solar radiation data in Shanghai, Nanjing and Hangzhou in Eastern China. Theor. Appl. Climatol. 2004, 78, 217–227. [Google Scholar] [CrossRef]
  25. You, Q.; Kang, S.; Flügel, W.A.; Sanchez-Lorenzo, A.; Yan, Y.; Huang, J.; Martin-Vide, J. From brightening to dimming in sunshine duration over the eastern and central Tibetan Plateau (1961–2005). Theor. Appl. Climatol. 2010, 101, 445–457. [Google Scholar] [CrossRef]
  26. Liepert, B.G.; Kukla, G.J. Decline in Global Solar Radiation with Increased Horizontal Visibility in Germany between 1964 and 1990. J. Clim. 1997, 10, 2391–2401. [Google Scholar] [CrossRef]
  27. Stanhill, G. Long-term trends in, and spatial variation of, solar irradiances in Ireland. Int. J. Climatol. 1998, 18, 1015–1030. [Google Scholar] [CrossRef]
  28. Liepert, B.G. Observed reductions of surface solar radiation at sites in the United States and worldwide from 1961 to 1990. Geophys. Res. Lett. 2002, 29, 61-1–61-4. [Google Scholar] [CrossRef]
  29. Xu, M.; Chang, C.P.; Fu, C.; Qi, Y.; Robock, A.; Robinson, D.; Zhang, H.M. Steady decline of East Asian monsoon winds, 1969–2000: Evidence from direct ground measurements of wind speed. J. Geophys. Res. 2006, 111, D24111. [Google Scholar] [CrossRef]
  30. Moorthy, K.K.; Satheesh, S.; Murthy, B.V.K. Characteristics of spectral optical depths and size distributions of aerosols over tropical ocean regions. J. Atmos. Sol. Terr. Phys. 1998, 60, 981–992. [Google Scholar] [CrossRef]
  31. O’Dowd, C.D.; Smith, M.H. Physicochemical properties of aerosols over the northeast Atlantic: Evidence for wind-speed-related submicron sea-salt aerosol production. J. Geophys. Res. 1993, 98, 1137–1149. [Google Scholar] [CrossRef]
  32. Kumar, P.; Fennell, P.; Britter, R. Effect of wind direction and speed on the dispersion of nucleation and accumulation mode particles in an urban street canyon. Sci. Total Environ. 2008, 402, 82–94. [Google Scholar] [CrossRef] [PubMed] [Green Version]
  33. Satheesha, S.K.; Moorthy, K.K. Radiative effects of natural aerosols: A review. Atmos. Environ. 2005, 39, 2089–2110. [Google Scholar] [CrossRef]
  34. Zongxing, L.; Qi, F.; Wei, Z.; Yuanqing, H.; Xufeng, W.; Catto, N.; Meng, H. Decreasing trend of sunshine hour and related driving forces in Southwestern China. Theor. Appl. Climatol. 2012, 109, 305–321. [Google Scholar] [CrossRef]
  35. Ren, G.Y.; Chu, Z.Y.; Chen, Z.H.; Ren, Y.Y. Implications of temporal change in urban heat island intensity observed at Beijing and Wuhan stations. Geophys. Res. Lett. 2007, 34, L05711. [Google Scholar] [CrossRef]
  36. Fang, S.; Qi, Y.; Yu, W.; Liang, H.; Han, G.; Li, Q.; Shi, G. Change in temperature extremes and its correlation with mean temperature in mainland China from 1960 to 2015. Int. J. Climatol. 2017, 37, 3910–3918. [Google Scholar] [CrossRef]
  37. Alexander, L.; Allen, S.; Bindoff, N.L.; Breon, F.M.; Church, J.; Cubasch, U.; Emori, S.; Forster, P.; Friedlingstein, P.; Gillett, N.; et al. Climate Change 2013: The Physical Science Basis Summary for Policymakers; IPCC WGI Fifth Assessment Report; IPCC: Geneva, Switzerland, 2013.
  38. Wang, Y.; Yang, Y.; Zhao, N.; Liu, C.; Wang, Q. The magnitude of the effect of air pollution on sunshine hours in China. J. Geophys. Res. Atmos. 2012, 117. [Google Scholar] [CrossRef]
  39. Liu, C.; Liu, X.; Zheng, H.; Yan, Z. Change of the solar radiation and its causes in the Haihe River Basin and surrounding areas. J. Geogr. Sci. 2010, 20, 569–580. [Google Scholar] [CrossRef]
  40. Palle, E.; Butler, C.J.; O’Brien, K. The possible connection between Ionisation in the Atmosphere by Cosmic Rays and Low-level Clouds. J. Atmos. Sol. Terr. Phys. 2004, 66, 1779–1790. [Google Scholar] [CrossRef]
  41. Kaiser, D.P. Analysis of total cloud amount over China, 1951–1994. Geophys. Res. Lett. 1998, 25, 3599–3602. [Google Scholar] [CrossRef]
  42. Qian, Y.; Kaiser, D.P.; Leung, L.R.; Xu, M. More frequent cloud-free sky and less surface solar radiation in China from 1955 to 2000. Geophys. Res. Lett. 2006, 33, L01812. [Google Scholar] [CrossRef]
  43. Albrecht, B.A. Aerosols, Cloud Microphysics, and Fractional Cloudiness. Science 1989, 245, 1227–1230. [Google Scholar] [CrossRef] [PubMed]
Figure 1. The distribution of meteorological stations in the Haihe River basin 2.2. Methodology.
Water 09 00770 g001
Figure 2. Data processing flow chart.
Water 09 00770 g002
Figure 3. Variability of annual sunshine duration in the Haihe River basin during 1966–2015.
Water 09 00770 g003
Figure 4. Mann-Kendall (M-K) test of annual sunshine duration in Haihe River basin during 1966–2015.
Water 09 00770 g004
Figure 5. Variability of seasonal average sunshine duration(blue line) with the average (red line) and linear trend (black line) in the Haihe River basin during 1966–2015: (a) Winter; (b) Spring; (c) Summer; (d) Autumn.
Water 09 00770 g005
Figure 6. Variability of monthly sunshine duration (blue line) with the average (red line) and linear trend (black line) in the Haihe River basin during 1966–2015.
Water 09 00770 g006aWater 09 00770 g006b
Figure 7. Spatial variability of annual sunshine duration in the Haihe River basin during 1966–2015.
Water 09 00770 g007
Figure 8. Spatial distribution of climate tendency rate for sunshine duration during 1966–2015.
Water 09 00770 g008aWater 09 00770 g008b
Figure 9. Relationship of sunshine duration (blue line) with (a) temperature (dotted line), (b) wind speed (dotted line ) and (c) low-level cloudiness (dotted line).
Water 09 00770 g009
Figure 10. Spatial distribution of wind speed in the Haihe River basin.
Water 09 00770 g010
Table 1. Mean monthly sunshine duration in the Haihe River basin during 1966–2015.
MonthJan.Feb.Mar.Apr.MayJun.
Sunshine duration183.99182.09224.74241.77270.30246.50
MonthJul.Aug.Sep.Oct.Nov.Dec.
Sunshine duration216.69219.20217.52213.62180.67173.39
Table 2. Correlation coefficients of sunshine duration with temperature, wind speed and low-level cloudiness in the Haihe River basin.
PeriodAnnualWinterSpringSummerAutumn
Temperature1966–2015−0.50 b−0.31 a−0.040.004−0.37 a
Wind speed1966–20150.61 b0.61 b0.38 b0.51 b0.61 b
Low-level cloudiness1966–2010−0.29−0.81 b−0.17−0.72 b−0.60 b
Notes: a means the correlation exceeds the critical value of α = 5%, b means the correlation exceeds the critical value of α = 1%.

