Surrogate Models for Sub-Region Groundwater Management in the Beijing Plain, China


1
College of Water Sciences, Beijing Normal University, Beijing 100875, China
2
Engineering Research Center of Groundwater Pollution Control and Remediation of Ministry of Education, Beijing Normal University, Beijing 100875, China
3
Department of Civil, Environmental, and Construction Engineering, University of Central Florida, Orlando, FL 32765, USA
*
Author to whom correspondence should be addressed.
Water 2017, 9(10), 766; https://doi.org/10.3390/w9100766
Submission received: 26 August 2017
/
Revised: 27 September 2017
/
Accepted: 3 October 2017
/
Published: 9 October 2017
Abstract
:Overexploitation of groundwater resources has caused groundwater-related problems all over the world. Effective groundwater governance is a favorable guarantee for its protection and sustainable utilization. Accurate prediction of groundwater level (GWL) or depth to groundwater (GWD) plays an important role in groundwater resource management. Due to the limitations and complexity of numerical models, this study aims to develop surrogate models that can dually control the GWL (or GWD) and groundwater quantity (GWQ) in each district of the Beijing Plain, China, using the methods of multiple linear regression (MLR) and back propagation artificial neural network (BP-ANN). This study used 180 monthly GWD data records, including the first 168 data records for model development (training) and the remaining 12 data records for model verification. The results indicate that the Nash–Sutcliffe efficiency coefficient (NSE) and correlation coefficient (R) for both the MLR and BP-ANN models are high in most districts and that the MLR models are more appropriate in this study. Fifteen scenarios under different conditions of groundwater use and precipitation are designed to demonstrate the applicability of the developed model in groundwater management. The surrogate models are effective tools that can be used by decision-makers for groundwater management.
1. Introduction
Excluding glacial water, groundwater is the largest fresh water resource in the world. Due to characteristics such as well water quality, strong regulation ability and steady storage, groundwater plays a vital role in agriculture, industry, public supply and ecosystems in many countries [1]. The demand for groundwater has been intensely increased with economic development and population growth. Overexploitation of groundwater resources will distort the natural recharge–discharge equilibrium of the groundwater system and thereby result in the decline of groundwater levels, leading to freshwater scarcity, saltwater intrusion and land subsidence in different parts of the world [2,3]. For example, there are many areas throughout the world where aquifers face depletion, such as California’s Central Valley in the United States [4], the North China Plains Aquifers [5], and the Neogene and Dammam Aquifers in eastern Saudi Arabia [6]. Many studies have been undertaken, from both technical and managerial perspectives, to address groundwater-related issues [7,8,9,10]. The need for improved groundwater management is becoming increasingly obvious, as it is becoming clear that technical changes alone cannot solve the problems [11]. Effective groundwater resource management is a favorable guarantee for the rational allocation of groundwater resources and the coordinated development of resources, the environment, the economy and society [3,12].
Effective groundwater management needs the support of national laws [13]. Many countries, such as USA [12], Australia [14] and Europe [15,16], have developed a number of laws and regulations for the management of groundwater resources [17]. The healthy development of groundwater resources has benefited from strong legal support and good administrative decisions about groundwater management in these countries. In China, with more and more attention being paid to the protection of groundwater resources, the Chinese government has issued a series of water resource management systems and policies, wherein a strict water resource management system is a new policy provided by the Ministry of Water Resources of China in 2012, and has become a fundamental measure to solve the problem of water shortage in China. This policy clearly notes that the management and the dynamic monitoring of groundwater must be strengthened, both the total groundwater quantity (GWQ) and groundwater level (GWL) must be controlled, and the overexploitation of groundwater must be cut down, especially in the overexploitation region, to realize the balance of groundwater recharge and recovery. The water-related government emphasizes the establishment of water resource management responsibilities and investigative systems, which can offer an important basis for comprehensive assessment by the local government managers. Previously in China, groundwater resource management was mainly based on groundwater use. However, the quantity of groundwater use is difficult to supervise and control under actual operation. GWL is the comprehensive reflection of the hydrogeological condition; not only can it reflect the variation law of groundwater recharge, runoff and discharge but it is also an important indicator of whether there exists a potential environmental problem, as well as its severity.
From the perspective of sustainable utilization of groundwater resources, the determination of a reasonable GWL is a fundamental basis for the evaluation of groundwater resources and control of the total amount of groundwater intake. The observation of the GWL is an important and direct means of understanding the status of groundwater. To relieve the stress of groundwater overdraft, the Chinese government has invested over one billion Yuan in recent years to implement the national groundwater-monitoring project, which is jointly carried out by the Ministry of Land and Resources and the Ministry of Water Resources, China. At the local level in China, groundwater management legislation has been issued. Some provinces have carried out practical studies on the management of the groundwater level. In Shanxi Province, the GWL monitoring network has been developed, and the fluctuation of the GWL has been incorporated into the appraisal index system for the government of local districts, including 11 cities and 119 counties since 2008. A percentage grading system is used to assess the effectiveness of groundwater management, which classifies grades into good, qualified and unqualified, according to the degree of controlled GWL. The government whose assessment is unqualified must make an improvement action, and the relevant leaders must shoulder the responsibility. Eight second-level indicators are used to evaluate deep groundwater management efficiency from three aspects, which are law enforcement capability, management ability and management effectiveness in Tianjin City [18]. According to the targets of groundwater management, the variation index criteria of the GWL are put forward as the basis for assessment in each district and county. The city of Shanghai, Hebei and Shandong Provinces have also taken active measures on the prohibited value of the total GWQ and completed an assessment according to the change in groundwater in each district. Overall, groundwater management legal support is still relatively weak in China, so it is urgent to introduce relevant management regulations, especially on groundwater “double control” (GWQ and GWL), as soon as possible to strengthen the management of GWL [11].
Numerical simulation is an important and common method to analyze groundwater dynamics [19,20,21]. An accurate numerical model depends on ample data related to the groundwater system. However, it is difficult to obtain these important and sufficient data due to the limitation of human and material resources, as well as acquisition methods and techniques in a short time period. Moreover, there is a strong requirement for high-performance computers that have high division accuracy in space and time. Therefore, it is necessary to find a surrogate model that can make an accurate prediction, while mainly depending on a limited amount of data. This model not only can reduce the cost of modeling but also may be more suitable and available for managers to act in groundwater management due to its speed, convenience and friendlier operability. Therefore, data-driven models are a good choice when data are limited and the groundwater system is very complex [22]. Data-driven models such as multiple linear regression (MLR), Back-Propagation Artificial Neural Network (BP-ANN), Support Vector Machines (SVM) and Power Function Models (PFM), are gradually used for groundwater level prediction, and thus, comparative studies on the above prediction techniques have been widely used and applied by some researchers [23,24,25].
Beijing, the political, economic and cultural center of China, should be guaranteed the safety of its water supply. However, Beijing is one of the most water-scarce cities, with a population of more than 20 million. The annual available water is less than 100 m3 per person per year, which is one-twentieth of the average in China [26]. Groundwater plays an importance role in urban water supply, which accounts for approximately 2/3 of the total water supply. Due to a lack of water resources, groundwater in the Beijing Plain area has experienced excessive exploitation that has continued for over 30 years, leading to problems such as land subsidence and deterioration of water quality [27]. Considering the above problems, a series of laws and regulations have been implemented in recent years, especially the implementation of the assessment system for groundwater resources in all districts and counties. These policies mainly strengthen the management and protection of groundwater resources from the two aspects: the total amount of groundwater and the water level.
The objectives of this paper aim at developing surrogate models, which can dually control the GWL and GWQ to evaluate groundwater dynamics quickly and accurately in each district of the Beijing Plain. These models use the data of groundwater use, precipitation and a series of depths to groundwater (GWDs) by multiple linear regression (MLR) and the back propagation artificial neural network (BP-ANN) method. The surrogate model uses modern science and technology to offer a more convenient way for managers to quickly estimate the amplitude of fluctuation of GWD in each administrative region, and can provide effective, timely, and scientifically based decision support for the management of water resources in the Beijing Plain.
2. Methods
2.1. The Principle of Water Level Control
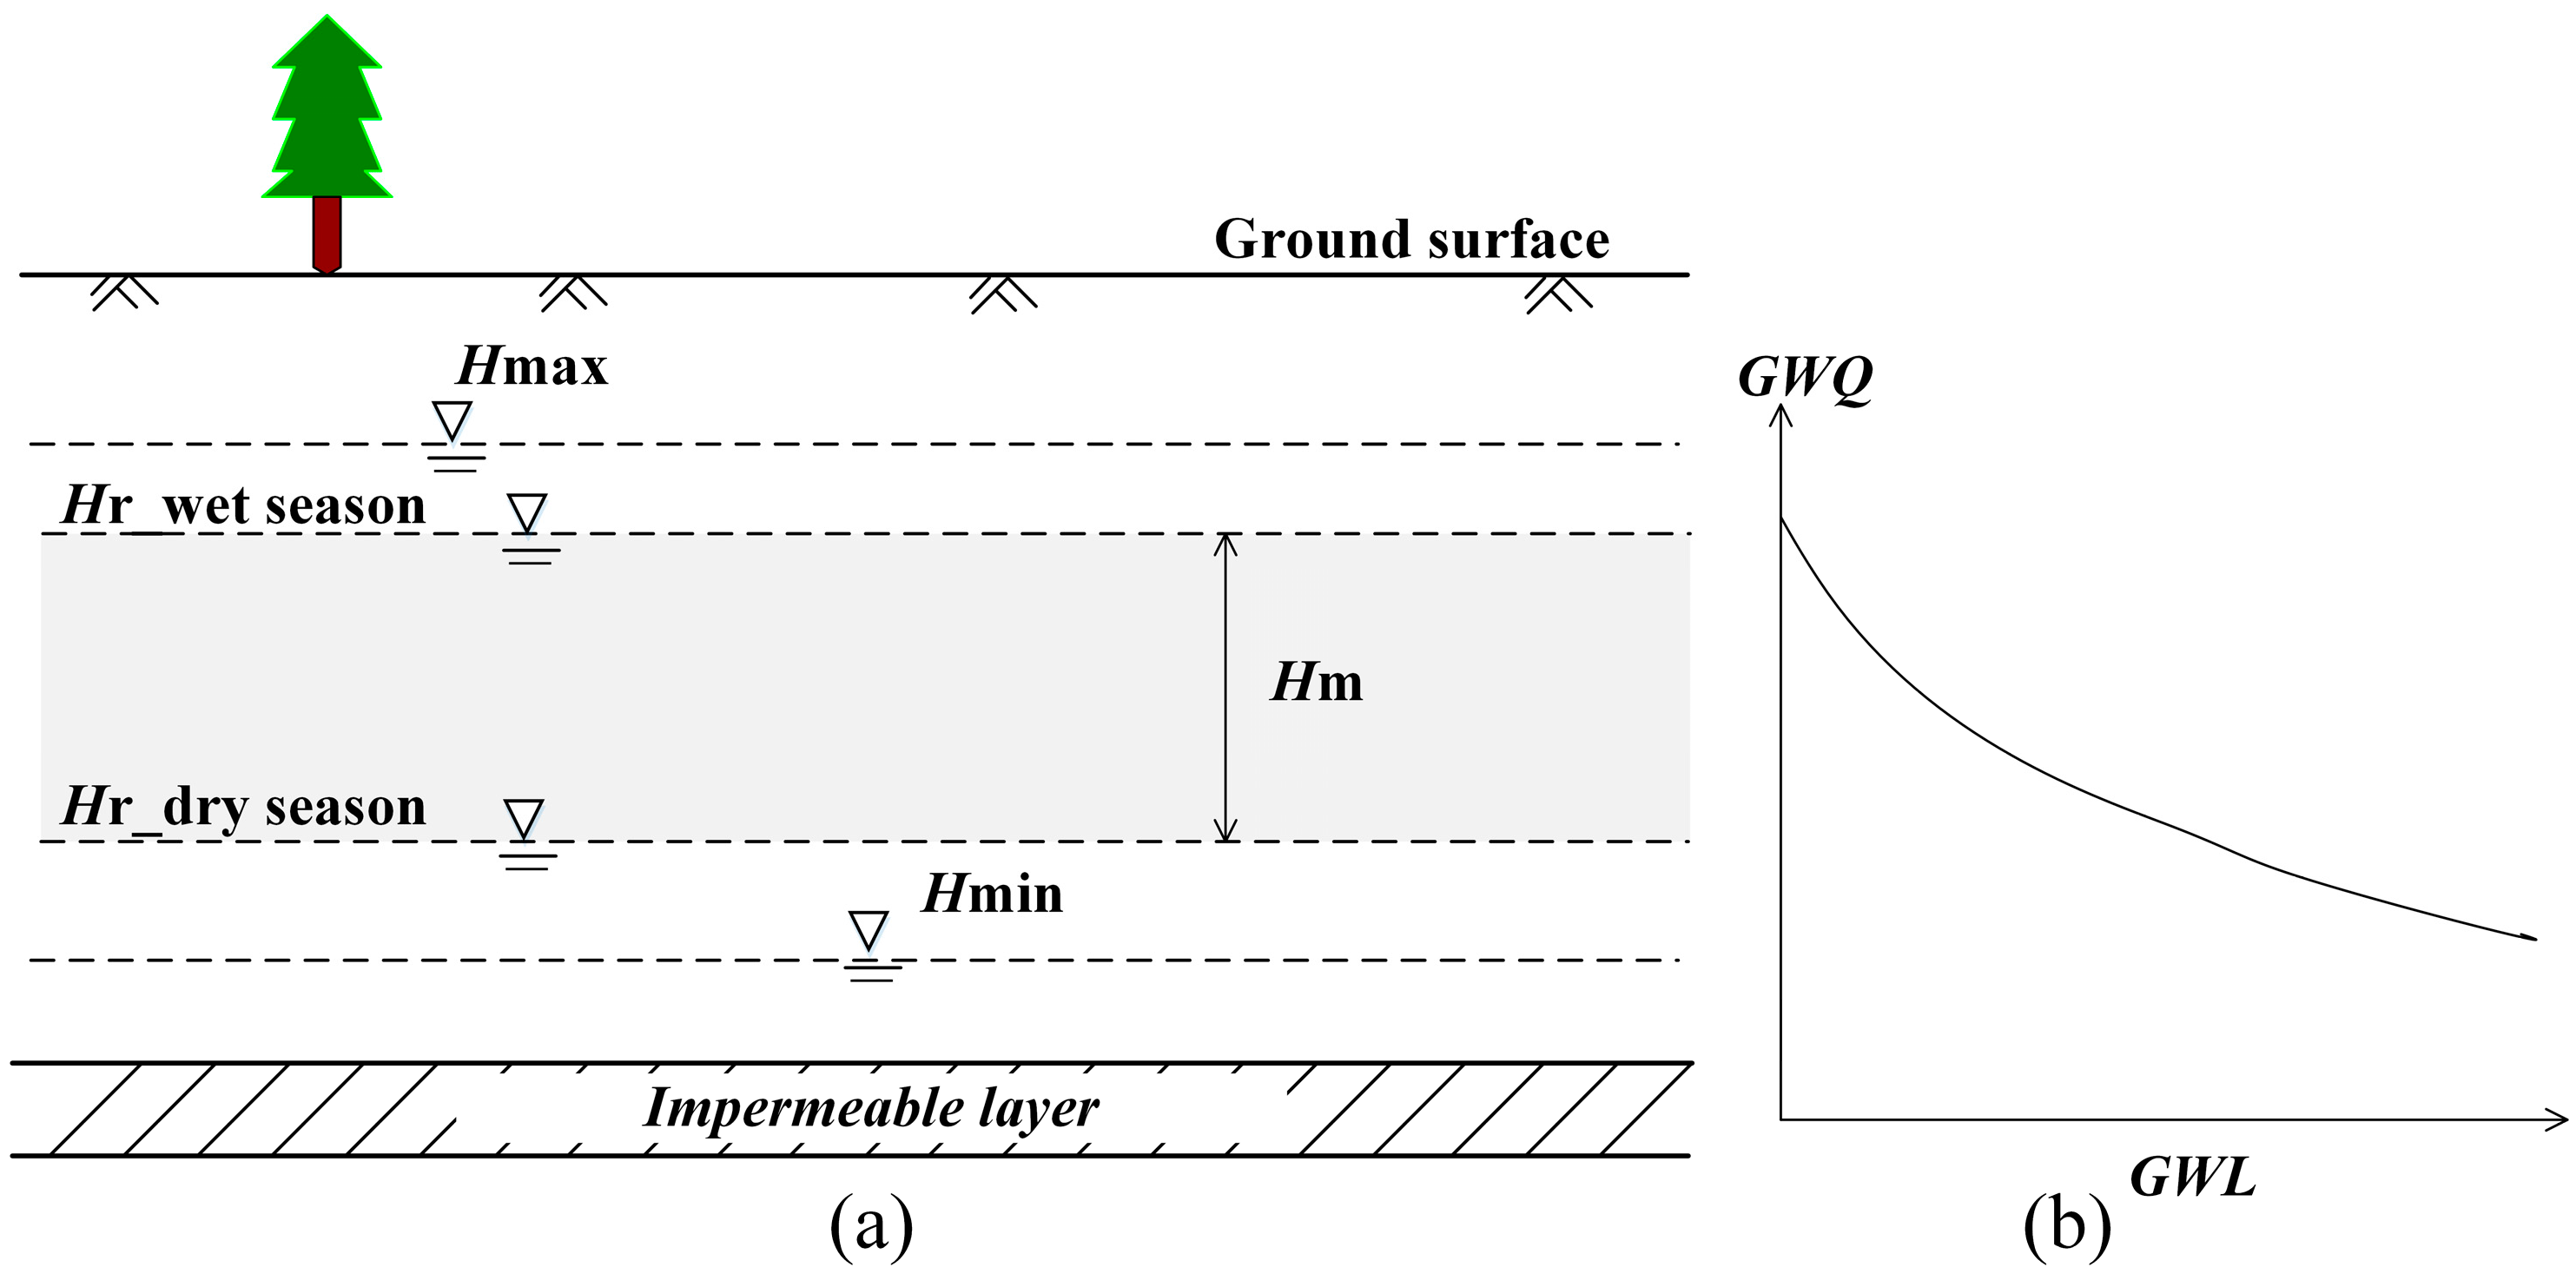
The policy “Opinions of the People’s government of Beijing municipal on implementing the strictest water resources management system” (2012) specifies the establishment of management responsibility and an assessment system of water resources. The assessment for the prohibited values, which are the control of groundwater resource utilization, water-use efficiency and pollutant carrying capacity of water function areas, are subsumed into the municipal government performance evaluation system. The prohibited values, namely, the management GWL (denoted by Hm), the upper level (denoted by Hmax) and lower level (denoted by Hmin), are the expected or threshold value (Figure 1a). These values must be confirmed by groundwater-related managers to implement the groundwater management objectives such as the total groundwater use, control of geological disasters, governance for the groundwater overdraft, and maintaining the balance of groundwater discharge and replenishment in a period (usually one year). Combined with the indexes of total water consumption, statistical models that can effectively reflect the relation between GWQ and GWL (Figure 1b) and reference the groundwater level (denoted by Hr) under wet, normal and dry seasons can be obtained. Based on Hr, Hm can be designated in each district for the groundwater management well implementation and combined with the requirement during the actual strict management work by the local government.
2.2. Relation between Groundwater Level and Groundwater Pumping
The observation data of GWL can synthetically reflect groundwater storage changes under the influence of various factors, such as precipitation recharge, pumping, and evaporation. An index management system, namely, the dual control of GWQ and GWL, can be used to guide and manage the rational exploitation and utilization of groundwater resources [18]. Districts usually have different geological and hydrogeological conditions. By choosing an appropriate evaluation method, models can be developed to predict the groundwater level and other influencing factors in each district. Generally, the analysis and prediction models, which can indicate the relation of groundwater level and source and sink terms such as precipitation and groundwater use, mainly include a regression statistical analysis method [28,29], back-propagation neural network method [30,31,32] and numerical models [29,33]. Unlike the traditional numerical models, the statistical models do not require explicit characterization of the physical properties and parameters; rather, they simply determine the system patterns based on the relations between inputs and outputs [28]. These kinds of data-driven models typically use input variables that are more accessible to make predictions and therefore circumvent the data reliance inherent to the numerical models.
2.2.1. Multiple Linear Regression Method
The statistical model is based on the relations among rainfall, groundwater use and GWL. Multiple linear regression (MLR) is a classical approach that has been largely applied for predicting the values of a dependent variable from predictor variables [34]. MLR is used to study the relation of a dependent variable (GWL) to two independent variables, such as rainfall and groundwater use, and the error term [30]. MLR can describe how the independent variables affect the dependent variable, and can be described as Equation (1).
The regression coefficients are among the GWL (or GWD), precipitation and groundwater use. Then, the statistical regression equation can be established in Equation (2).
2.2.2. Method of BP-ANN
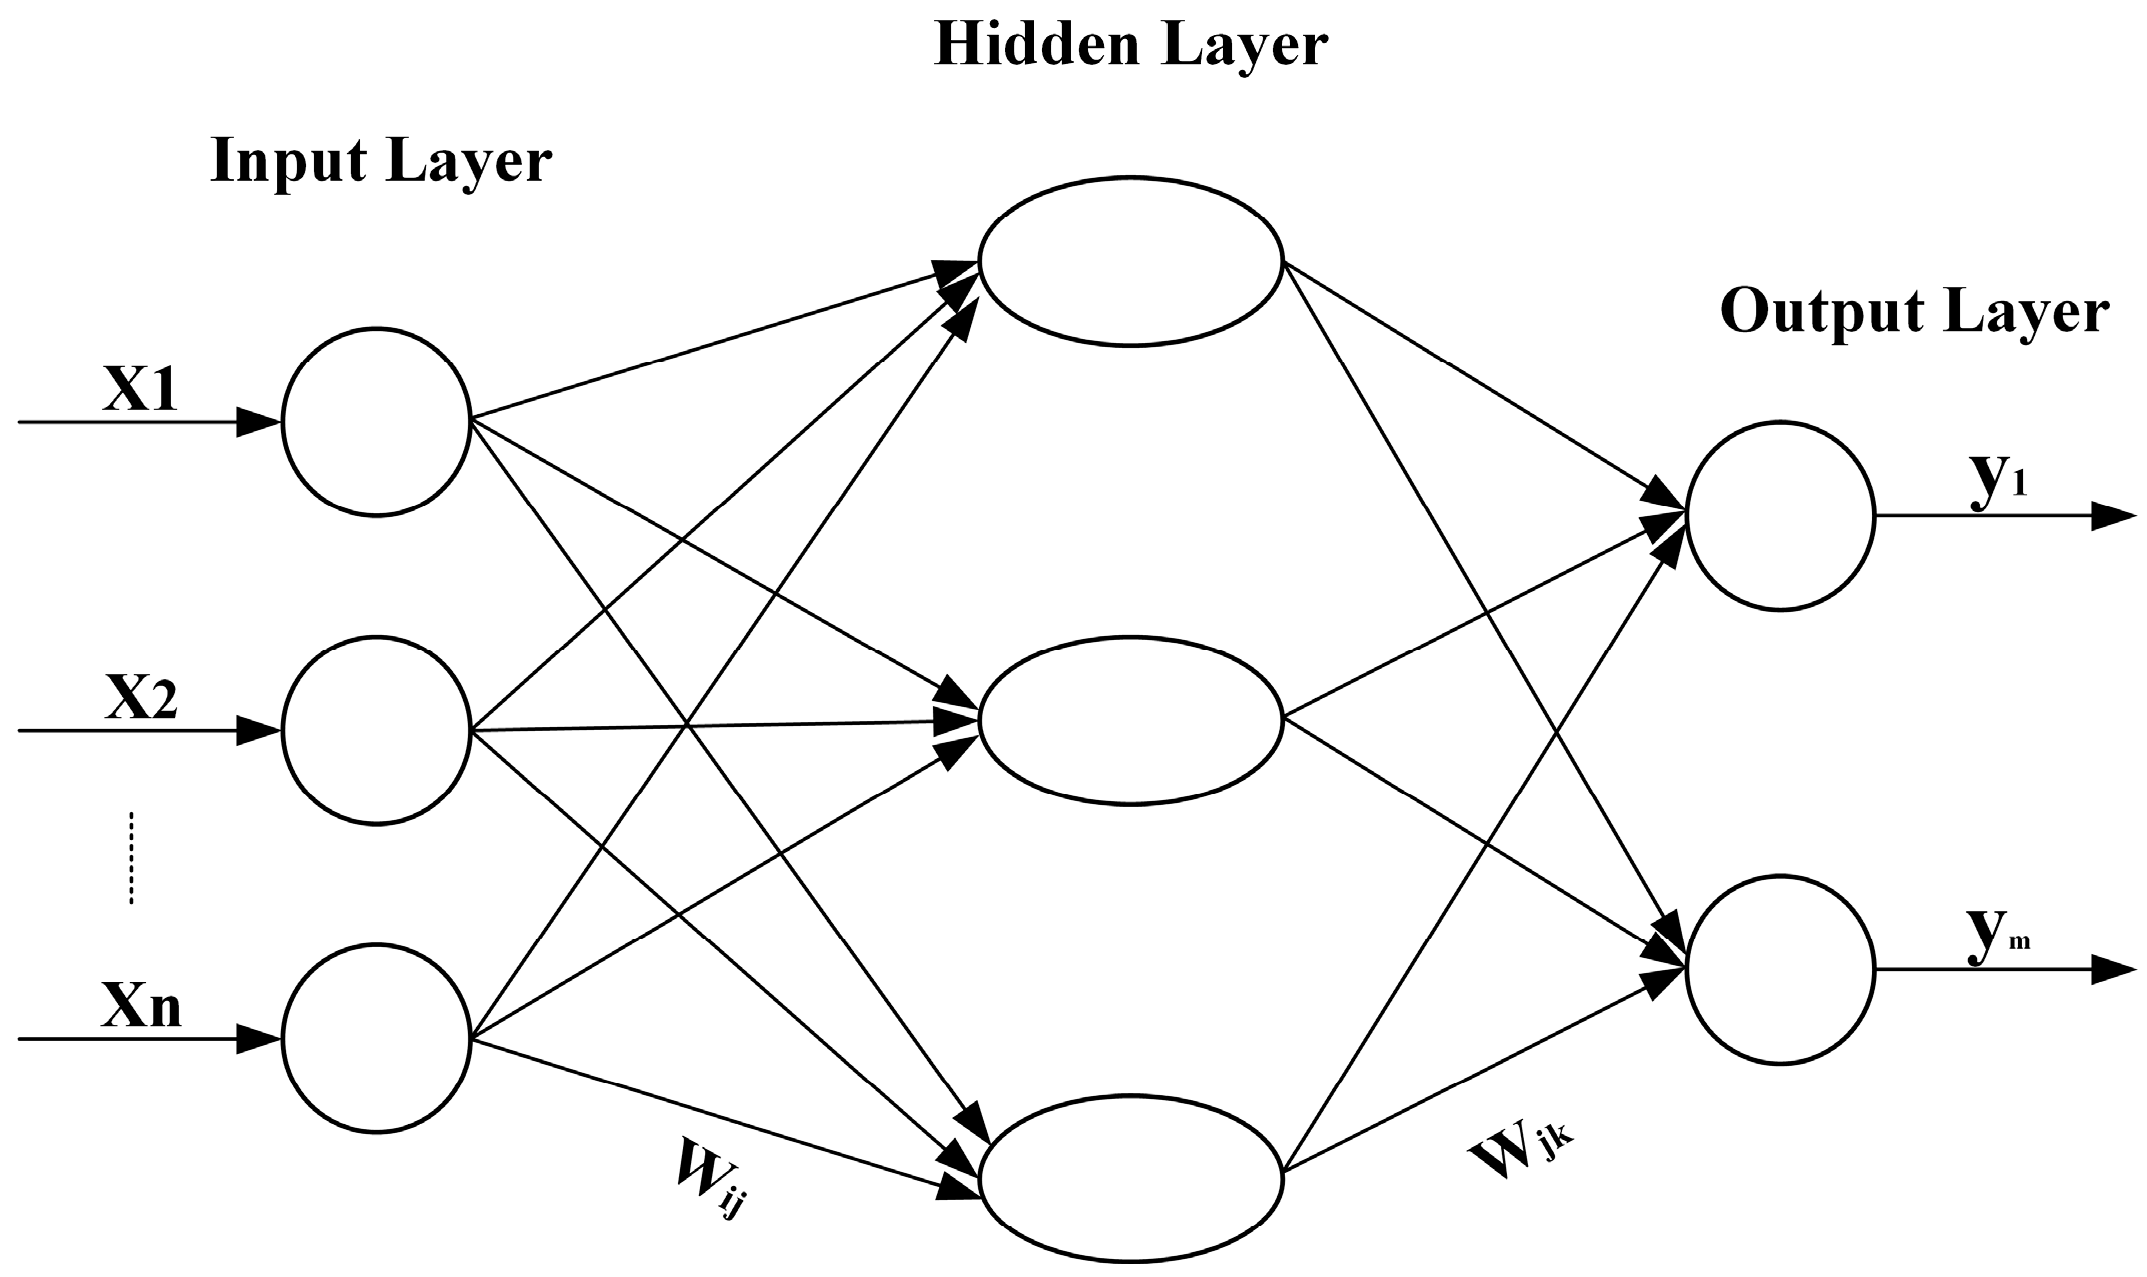
Back propagation artificial neural network (BP-ANN) technology is one of the most widely used artificial neural network models in the prediction of groundwater level because of its characteristics of nonlinear pattern recognition [35,36]. The BP-ANN model generally contains three layers: an input layer, hidden layer and output layer [37,38]. The structure is shown in Figure 2, where X1 to Xn represents the input variables, y1 to ym represents the outputs, and Wij and Wjk are the connection weights. The input layer simply passes the inputs to a single hidden layer, which performs a nonlinear transformation from the input space to the hidden space. Each layer has one or more neurons, and there is no connection between the neurons in the layer. The neurons between layers are connected by different weights. The learning process consists of two parts, namely, the forward propagation of the input signal and the backward propagation of the error signal. For the forward propagation process, the inputs are fed through the input layer and, after being multiplied by synaptic weights, are delivered to the hidden layer. Then, the weighted sum of inputs is transformed to the output layer by a nonlinear activation function, which is usually chosen as the logistic or the hyperbolic tangent. If the outcomes cannot reach the output neuron, the error turns back to propagation. Following the rules of reducing the error between the desired output and the actual output, the error information of each unit is returned from the output layer to the input layer through the middle layer to modify the connection weights and thresholds until the outcomes reach the precision requirement.
Based on hydrogeology conditions and rich data related to groundwater monitoring wells, the structure of the aquifer system and changes in the groundwater level; the quantitative model, which controls both the GWL and GWQ in each district, can be developed using MLR and BP-ANN. Then, the quantitative model needs to be verified using actual data to ensure that the model can truly reflect the relations among the groundwater level, groundwater use and precipitation. This model provides quick, effective and reliable scientific support for groundwater management.
2.3. Groundwater Management in the Beijing Plain
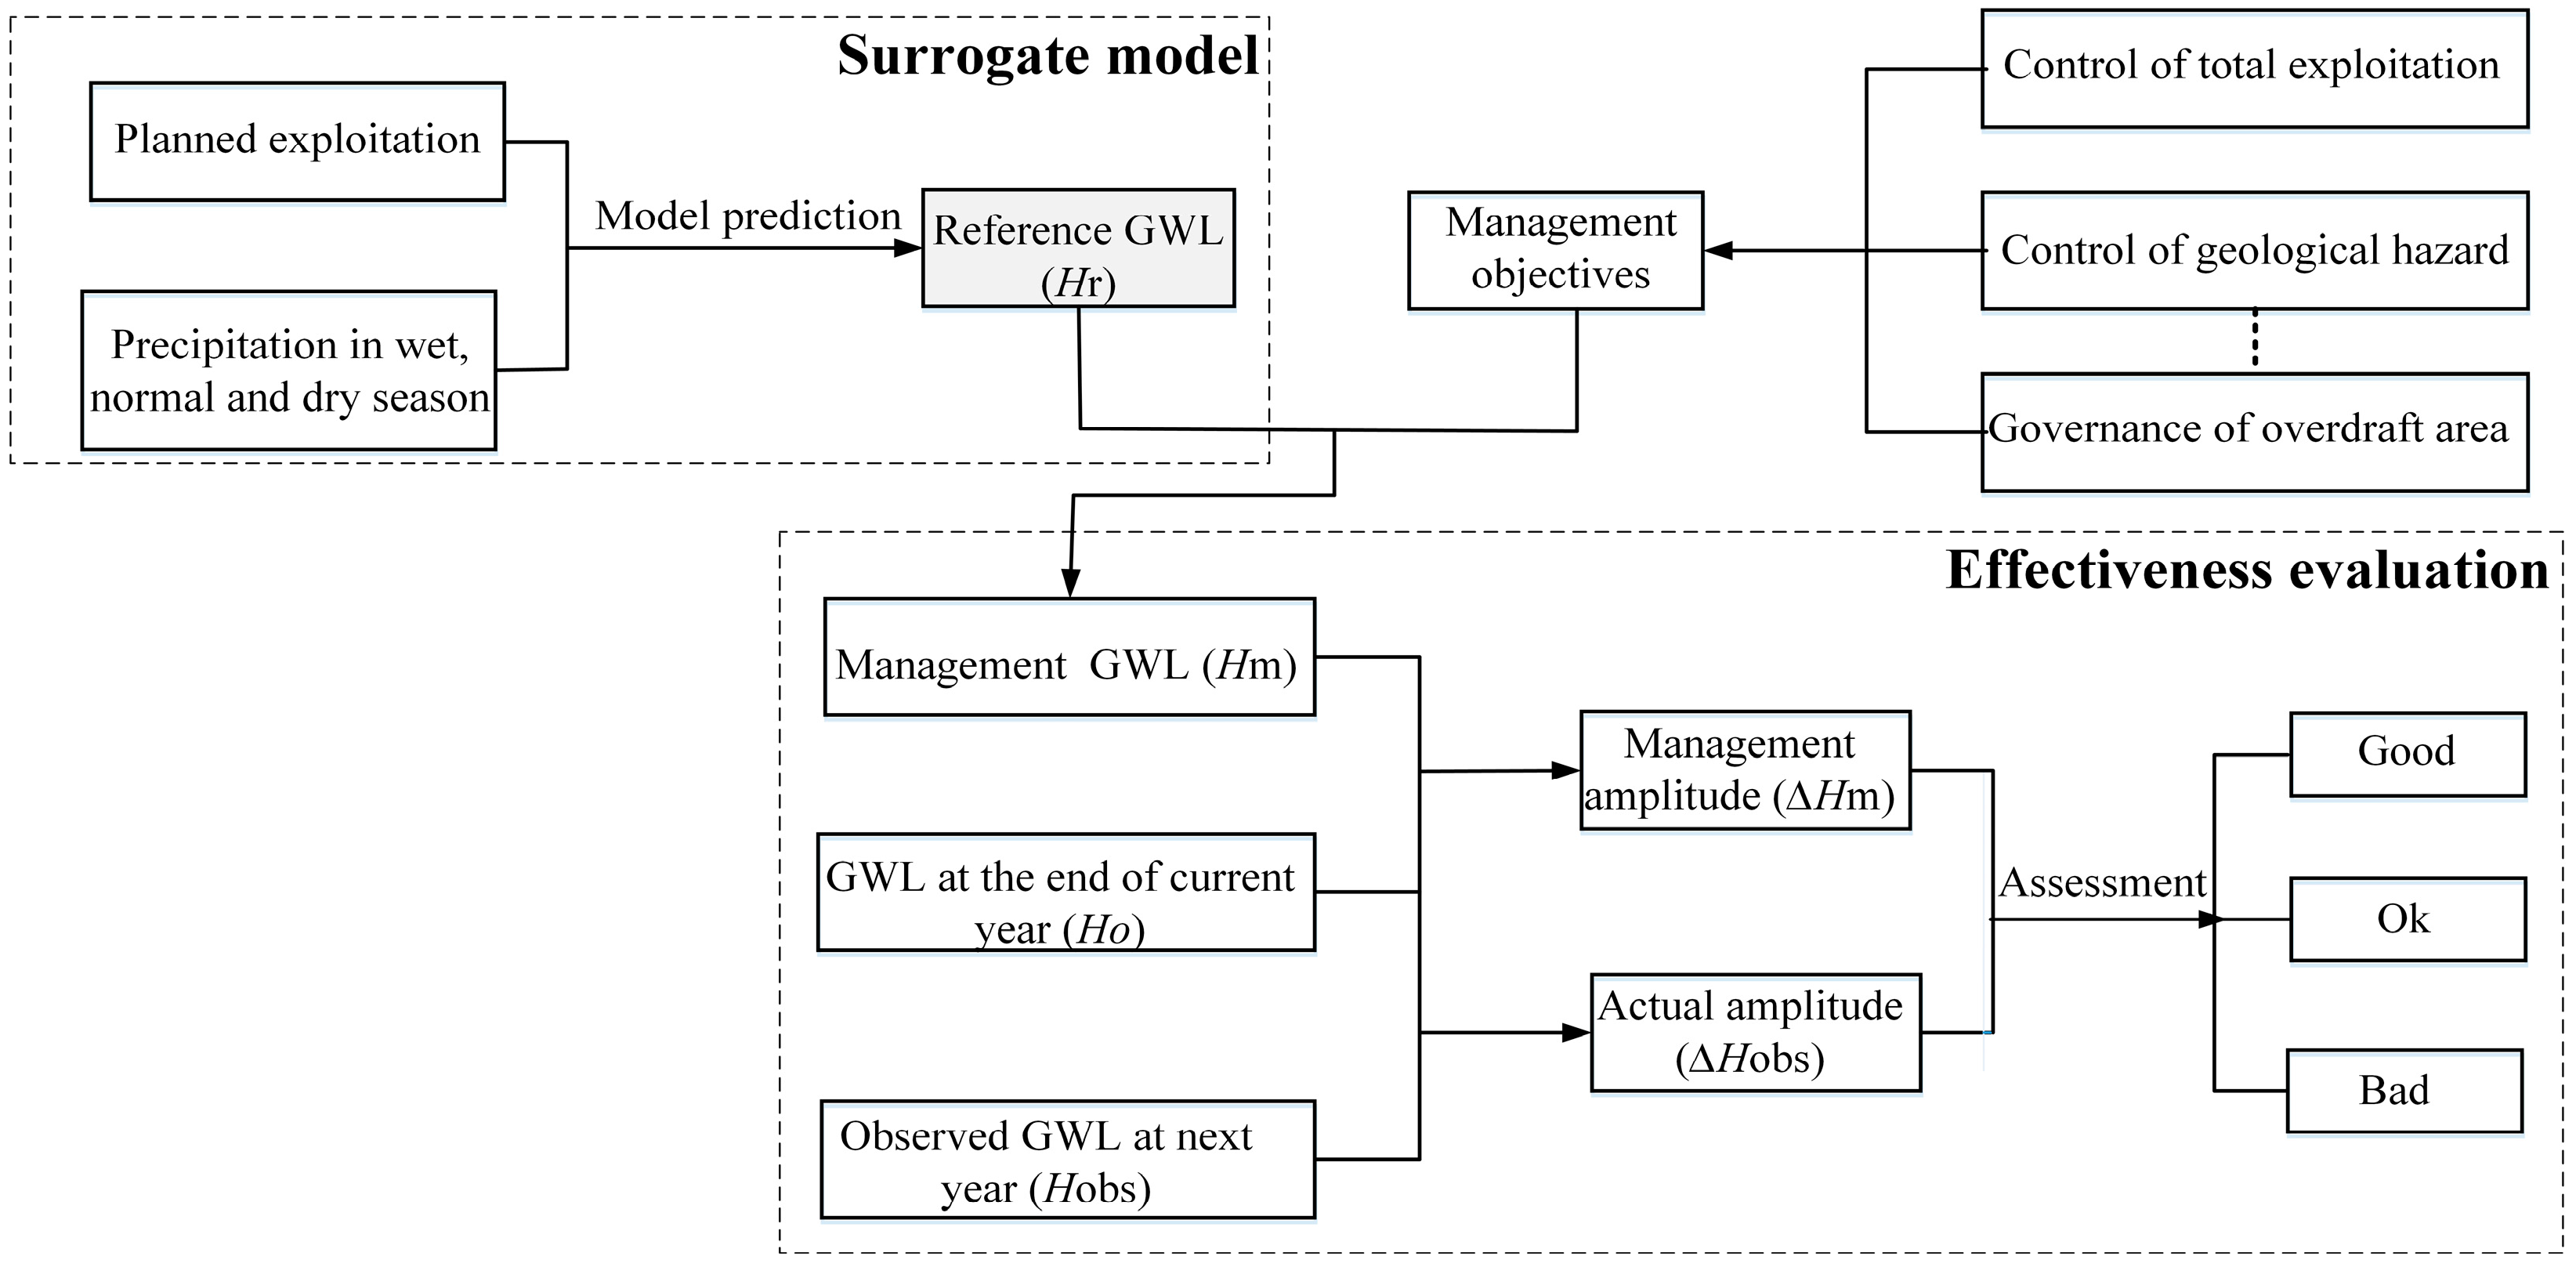
The available process of groundwater management in the Beijing Plain is shown in Figure 3. At first, the allowable yield or planned use of groundwater in each district can be determined by collecting data about meteorology, hydrology, local water resources, social development of the population and economics, problems with water in the environment and the distribution of monitoring wells. Using the developed surrogate models, the reference groundwater levels (Hr) under wet, normal and dry seasons for the following year can be obtained based on the GWL at the end of the reference year. The management of the GWL (Hm) can be determined by managers based on the Hr under different precipitation scenarios. Thus, the management amplitude of the GWL (△Hm), namely, the acceptable limitation of the average groundwater amplitude, can be calculated. Then, the monthly GWL (Hobs) in the following year can be calculated using the observed GWD. Thus, the actual amplitude (△Hobs) can be obtained. By comparing △Hm with △Hobs, the state of GWL at present, namely, the management grade, can be identified in combination with the actual management and evaluation standard. Based on the management grade, corresponding management strategies can be determined, and a reasonable water level and mining schemes can be made. The rational development and utilization of groundwater through this double control index system to guide groundwater management, which not only limits the groundwater quantity but also can evaluate the groundwater quantity indirectly through groundwater level, has obvious advantages in assessment. The developed surrogate models also need to be calibrated anew using actual precipitation, GWDs and groundwater use to ensure their efficiency at the end of each year.
3. Background of the Study Area
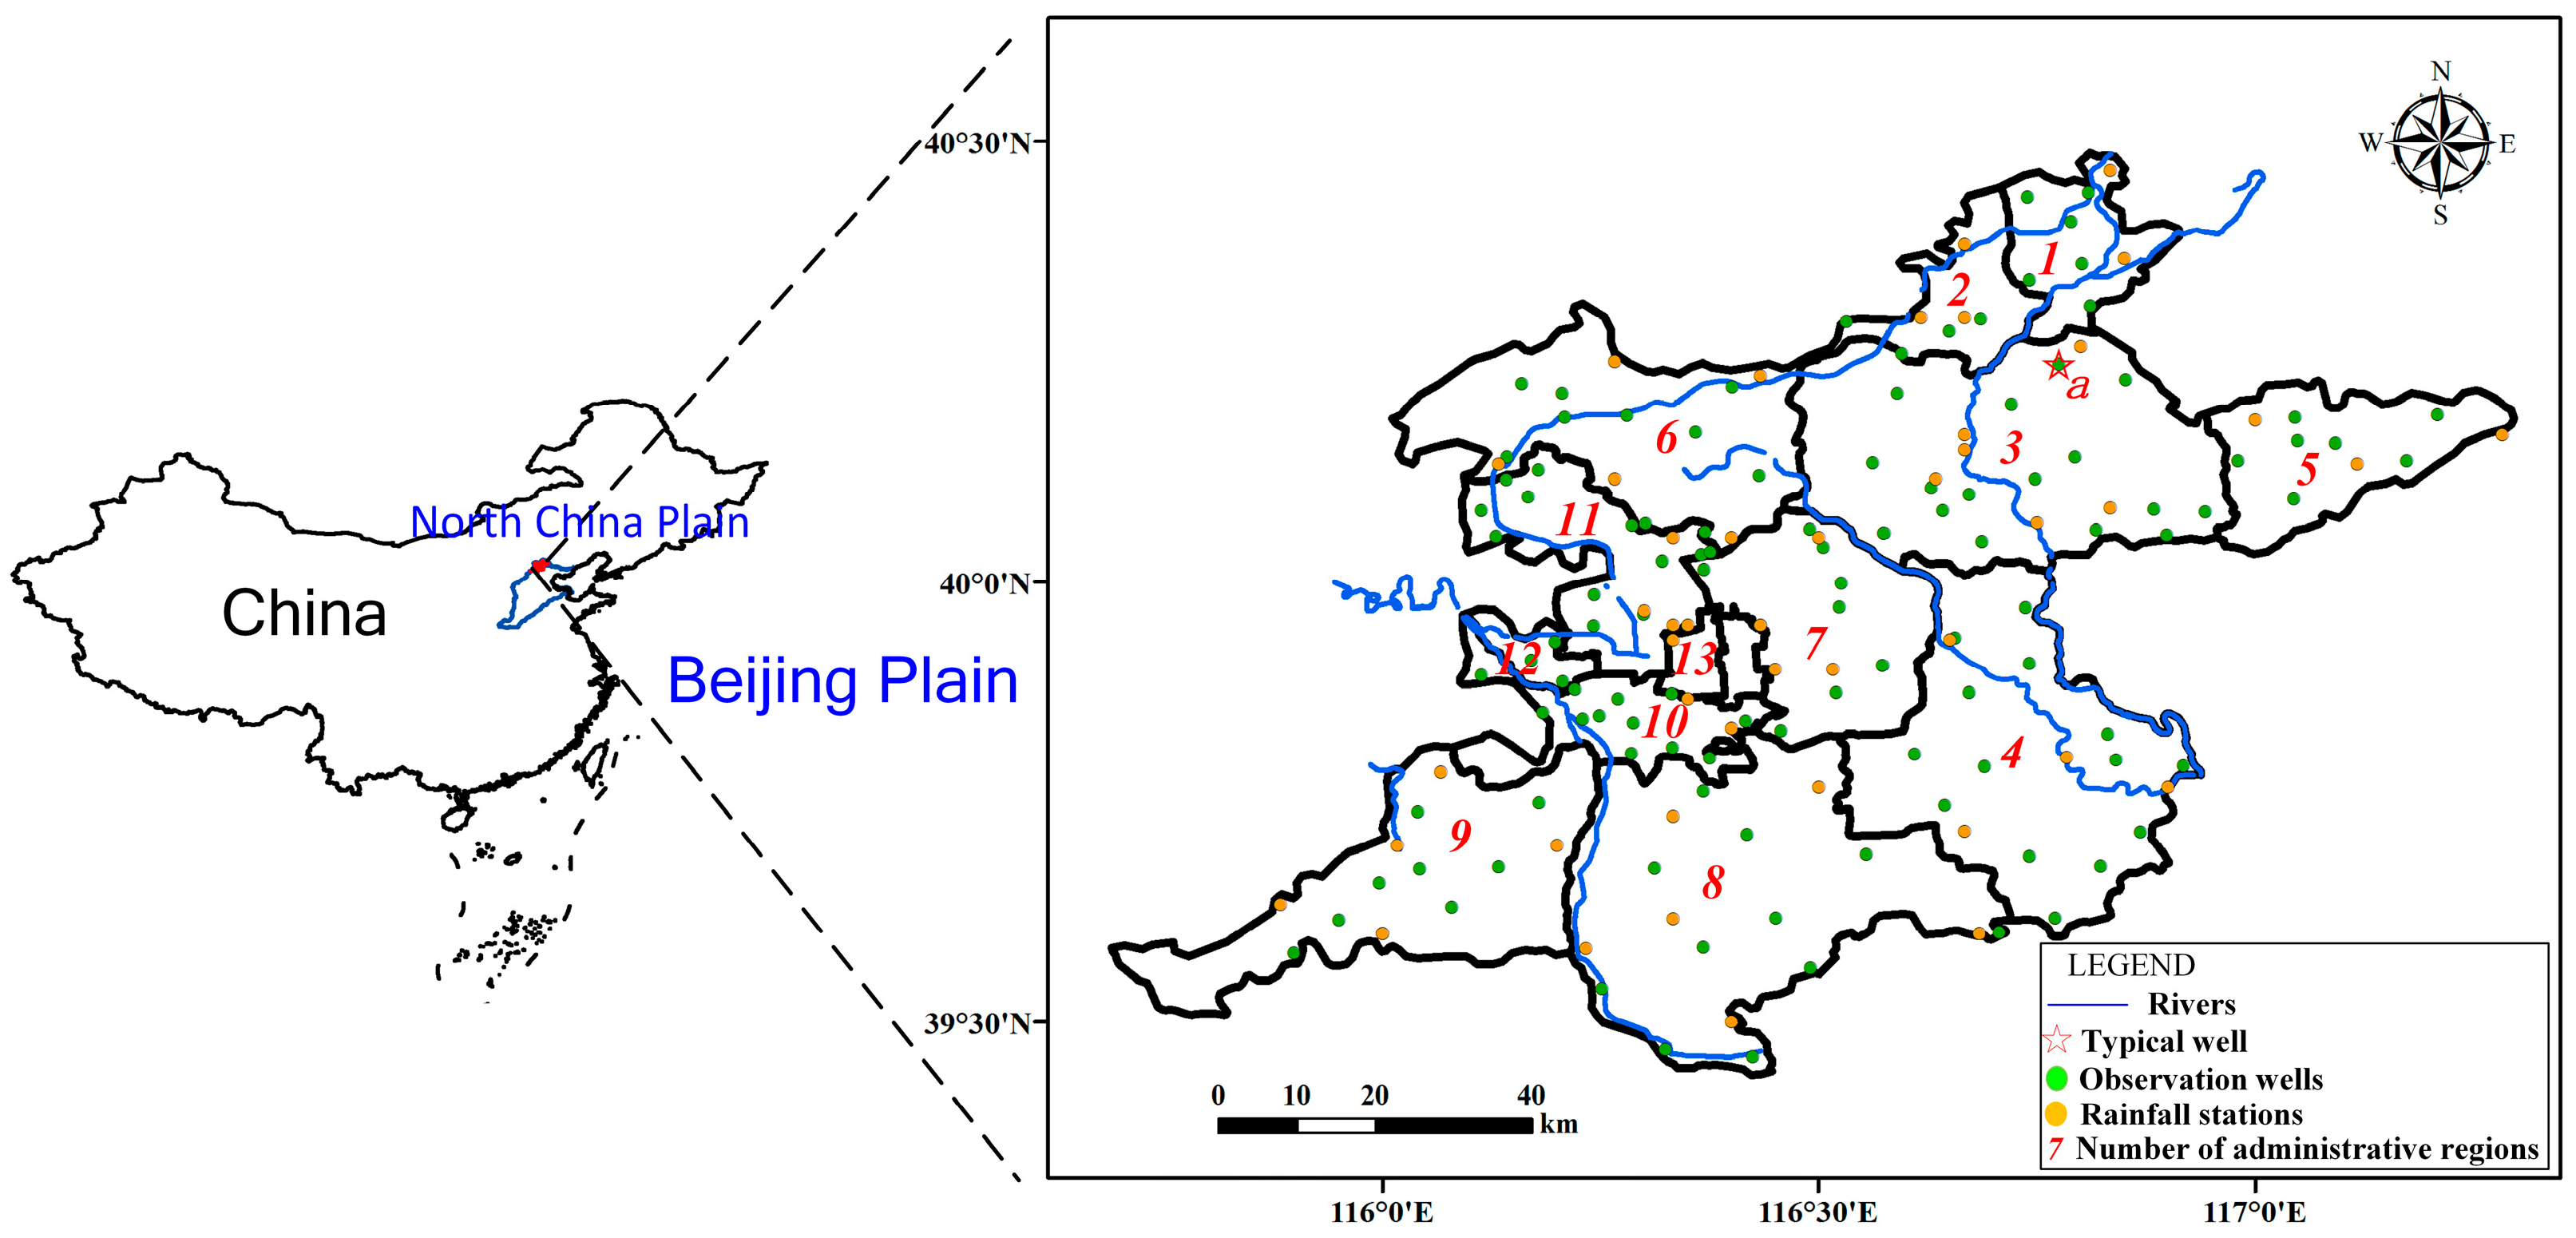
The study area is the Beijing Plain, located in the northwest region of the North China Plain (NCP) at longitude 115°25′~117°30′ E and latitude 39°28′~41°05′ N. The study area covers an area of approximately 6400 km2. The Beijing Plain consists of 15 districts that are shown in Figure 4. Beijing belongs to typical warm, semi-humid continental monsoonal climate zone with distinguishing seasons that have dry, cold winters and rainy, high temperature summers [27]. According to meteorological data, districts 1, 2, 5 and 9 have the largest amount of precipitation, where annual precipitation is generally greater than 600 mm. In general, the precipitation reduces gradually from east to west and from northwest to southeast in Beijing. The annual potential evaporation is approximately 1800 mm. Observation wells are generally uniformly distributed in this area.
3.1. Hydrogeology Conditions
In the study area, the aquifer systems can be divided into porous aquifers, which are the main sources for groundwater use and the focus of this paper; karst aquifers; and fissure aquifers. Porous aquifers are mainly distributed in the sedimentary strata formed by fluvial processes. The sedimentary characteristics of alluvial and flood fans are basically uniformed in the whole plain. The transmissivity is relatively higher at the top of the alluvial fan, and the transmissivity can reach more than 10,000 m2/day in districts 1, 2, 5, 12 and 13. The transmissivity is lower at the center of the plain, which is less than 500 m2/day southeast of districts 4 and 8.
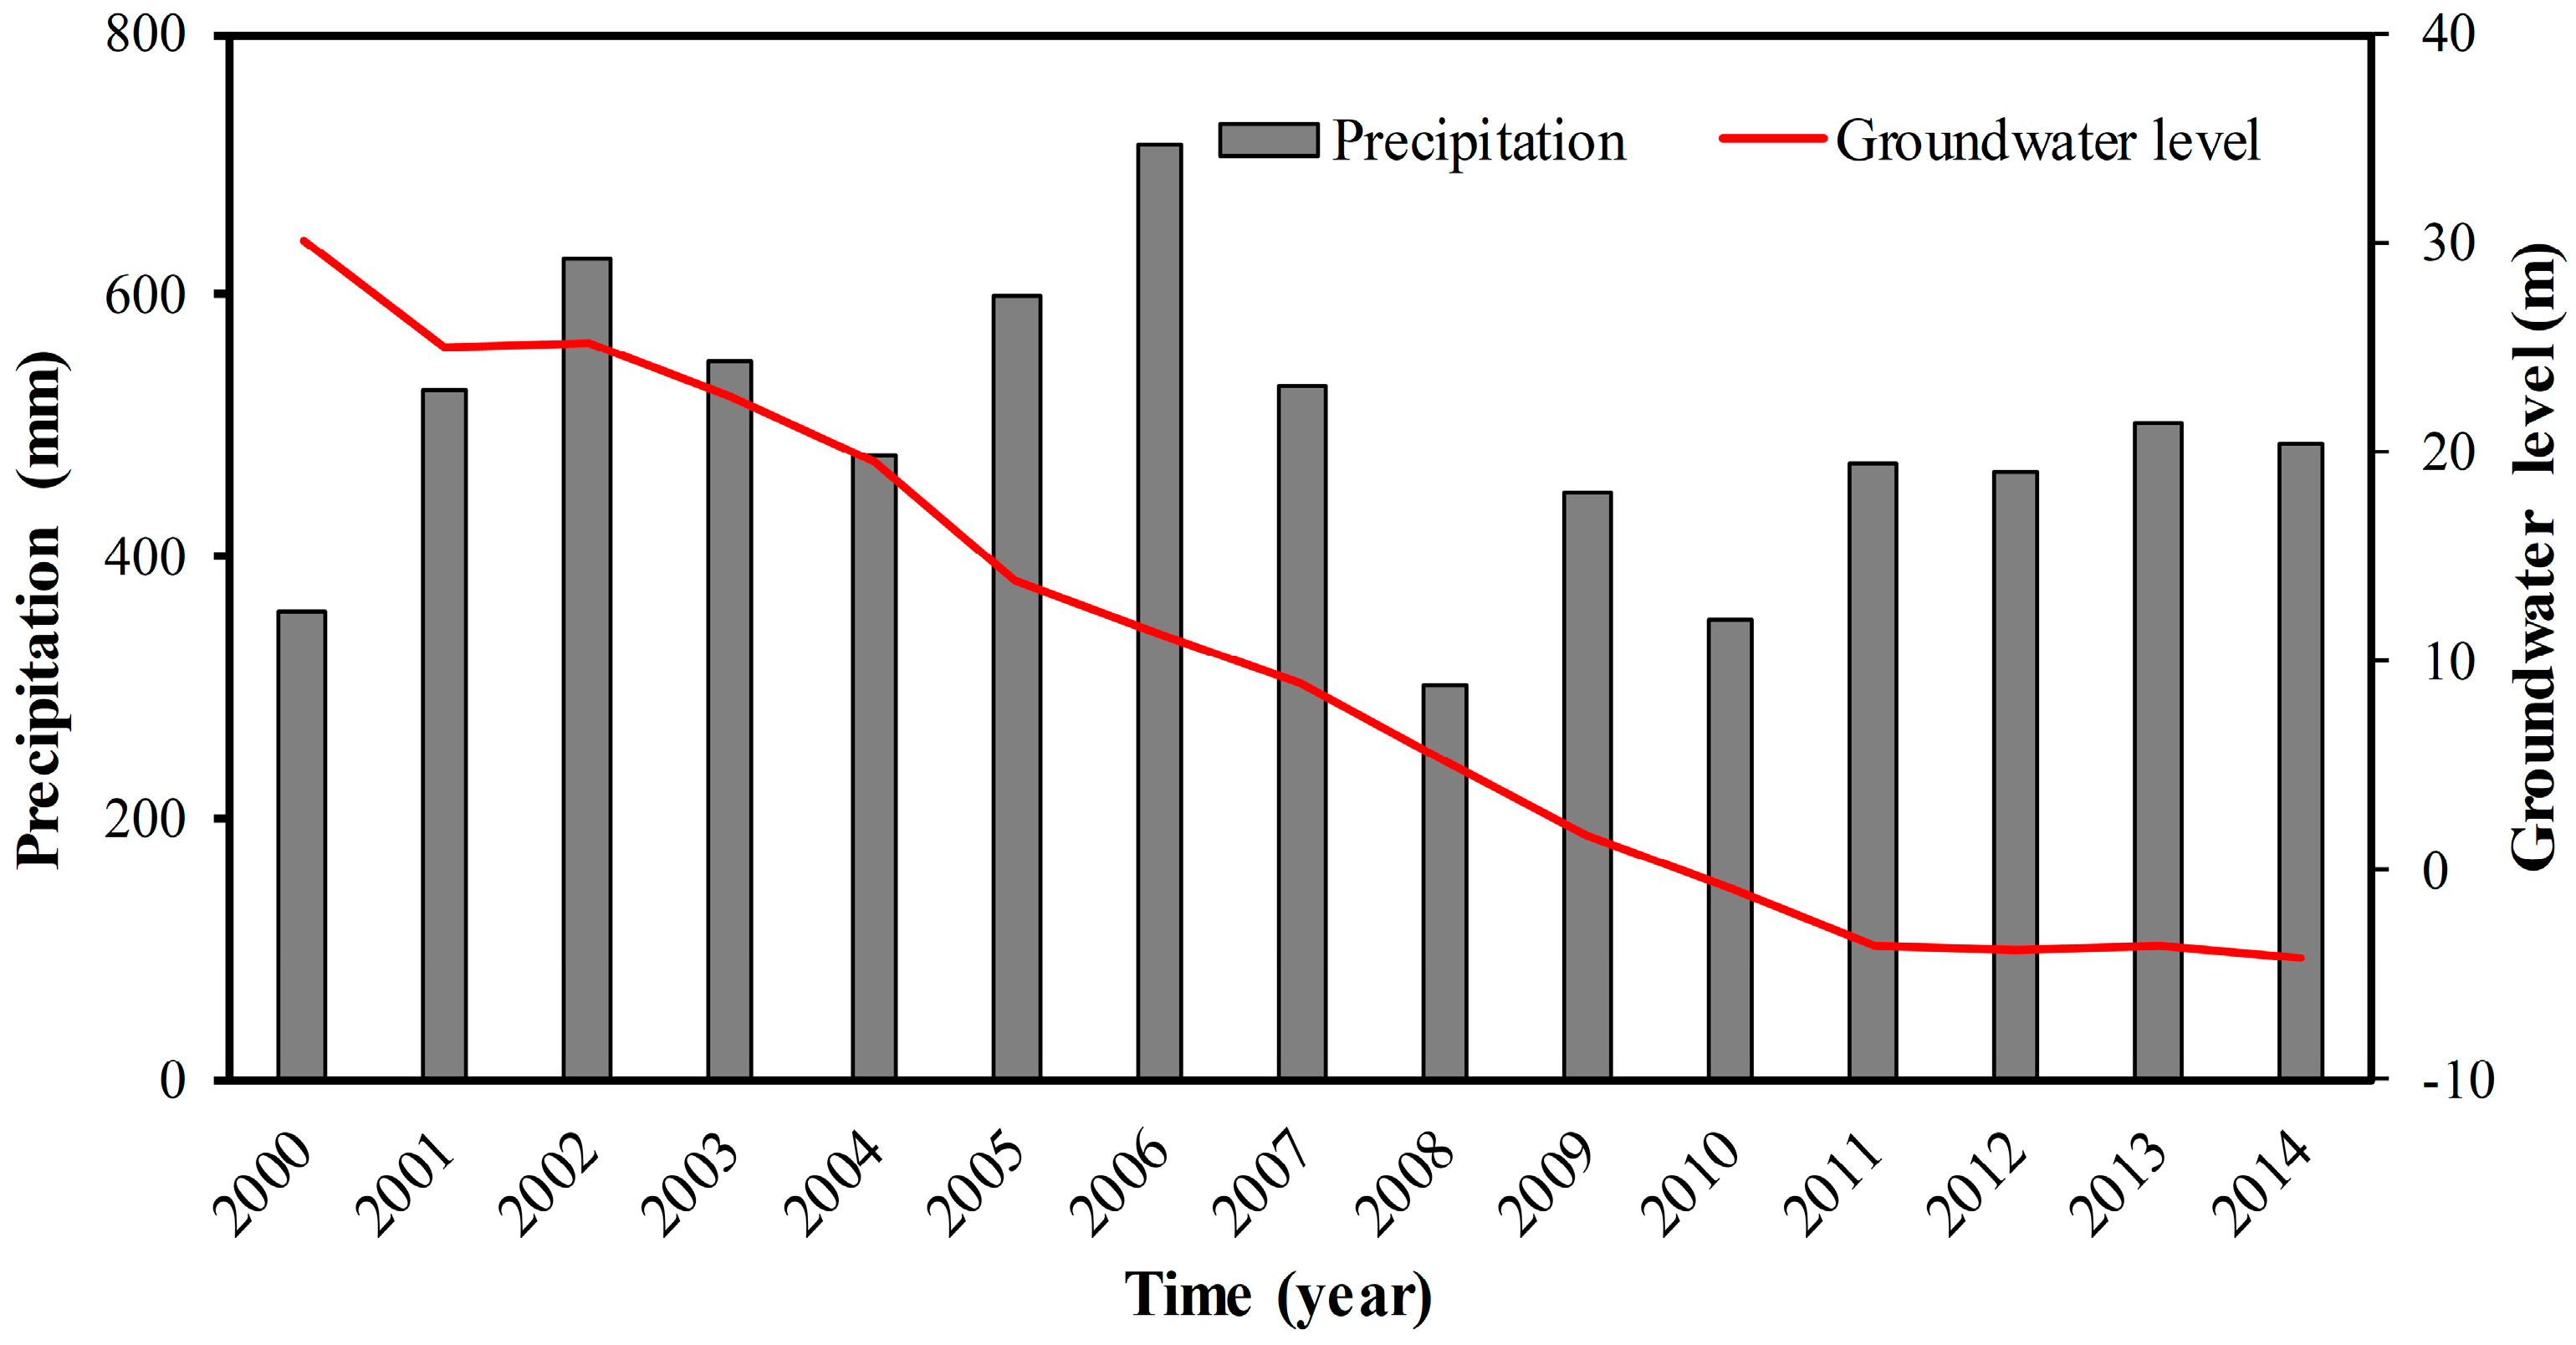
Precipitation is the main source of groundwater recharge and accounts for approximately 50% of the total recharge. The average annual precipitation was approximately 585 mm in the Beijing Plain from 1956 to 2000 [26]. However, Beijing suffered the longest drought in its history during 1999–2011 [39]. Figure 5 shows the average annual precipitation and groundwater use in the Beijing Plain during 2000–2014 according to the observations offered by the central hydrological station of Beijing. As the map shows, the average annual rainfall was greater than 585 mm only in 2008, 2011 and 2012. Persistent drought and increasing area of hardening road have caused and intensified the decrease in precipitation infiltration. The discharge consists of natural discharge and artificial extraction, which is the main discharge outflow. To meet the water supply demand in Beijing, several emergency water sources were developed in the plain [40]. During the continuous drought period since 1999, the demand for groundwater in the plain area has been intensely increased compared to before. Because of the continuous excessive groundwater use, the GWD is increasing, which makes the phreatic water evaporation and groundwater overflow decrease gradually.
The variations in the GWL and flow field in the Beijing Plain have a close relation with the changes in groundwater recharge and water use. Due to the reduced groundwater recharge caused by continuous drought and an increasing water supply demand for sharply expanded population [26], the groundwater use has been increased in each district in last ten years. The use of emergency water sources has been routinized in districts 2, 5 and 6. Thus, the GWL has declined significantly in most areas in recent years. The rate of fall is largest at the top of the alluvial fan and the GWL has been rapidly declining around the emergency water sources. Figure 6 describes the dynamic changes in the GWL at location “a” (see Figure 4) in district 3 during 2000–2014.
3.2. Cones of Depression
The overall trend of groundwater flow is from the northwestern alluvial fan to the top southeastern front into the plain area in the Beijing Plain. According to the official Water Resources Bulletin of Beijing (http://zfxxgk.beijing.gov.cn/110030/), the cone of depression was mainly located at districts 3 and 7, and the total area of all cones in the whole Beijing Plain was approximately 796 km2, and the area, where the average GWD was usually greater than 10 m, was approximately 2292.5 km2 in 2000. In 2014, the two cones of depression in districts 3 and 7 were connected, and at the same time, a large cone of depression was produced in district 4. The total area of all cones was increased to 1058 km2, during the period from 2000 to 2014. And the area, where the GWD was greater than 10 m, was increased to 5470.0 km2 at the end of 2014.
3.3. Data Sources Preparation
The available data of observation wells is a period of 15 years, from 2000 to 2014, in 13 districts of the Beijing Plain. For each district, the data from the first fourteen years (2000–2013) were used for model calibration (or training), and the data from 2014 were used for model testing. Table 1 shows the data sources of precipitation, groundwater use and depth to groundwater. The monthly records of rainfall amount for several locations within the study area for the 15-year period (2000–2014) were obtained from 14 rainfall stations in each district of the study area. Figure 4 presents the locations of the rainfall stations and observation wells in the Beijing Plain. Groundwater use data were obtained from the hydrologic station and office for water conservation in each district of the Beijing Plain. To calculate the average depth to groundwater in each district, monthly observed depth to groundwater data from 2000 to 2014 were obtained from the central hydrological station of Beijing.
4. Results and Analysis
In this study, both MLR and BP-ANN are employed to develop monthly dynamic models for quantifying the relation of depth to groundwater (GWD) and groundwater quantity (GWQ) based on GWD, groundwater use and precipitation of each district, respectively.
4.1. MLR Model
Taking the average GWD of the administrative area as the output variable, the groundwater use and rainfall of each month, as well as the GWD, groundwater use and rainfall of the previous month are used as input variables. Taking one month as a time unit of all these variables, the correlation among GWD, rainfall and groundwater use during the years from 2000 to 2013 is analyzed and the regression coefficients between the variables are determined. Then, the statistical regression equation is established. Thus, the comparison of predicted and observed GWD in each district can be obtained. The developed models can then be used to predict the regional average GWD of 2014 according to the estimation of precipitation and the plan of groundwater use. Finally, by comparing the predicted GWD and observed GWD, the reliability of the models can be tested and verified.
4.2. BP-ANN Model
Taking the average GWD of each administrative region as the output variable, the precipitation, and groundwater use in each district and its adjacent districts are regarded as the input variable. Each variable is based on the monthly time series from 2000 to 2014. Each district has 168 records of training data, and the number of input variables is determined by the number of neighboring districts. In this study, the BP-ANN model is constructed based on the C++ program. Based on many experiments and experiences, the number of hidden layers is set as 5. After training 50,000,000 times, the comparison of GWD between calculated and observed data in each district can be obtained. Then, using the data of 2014, we can predict the average GWD of each district in 2014 by the developed model. By comparing the predicted GWD with the observed data, the accuracy of the models can be tested.
4.3. Comparison of Results from Two Models
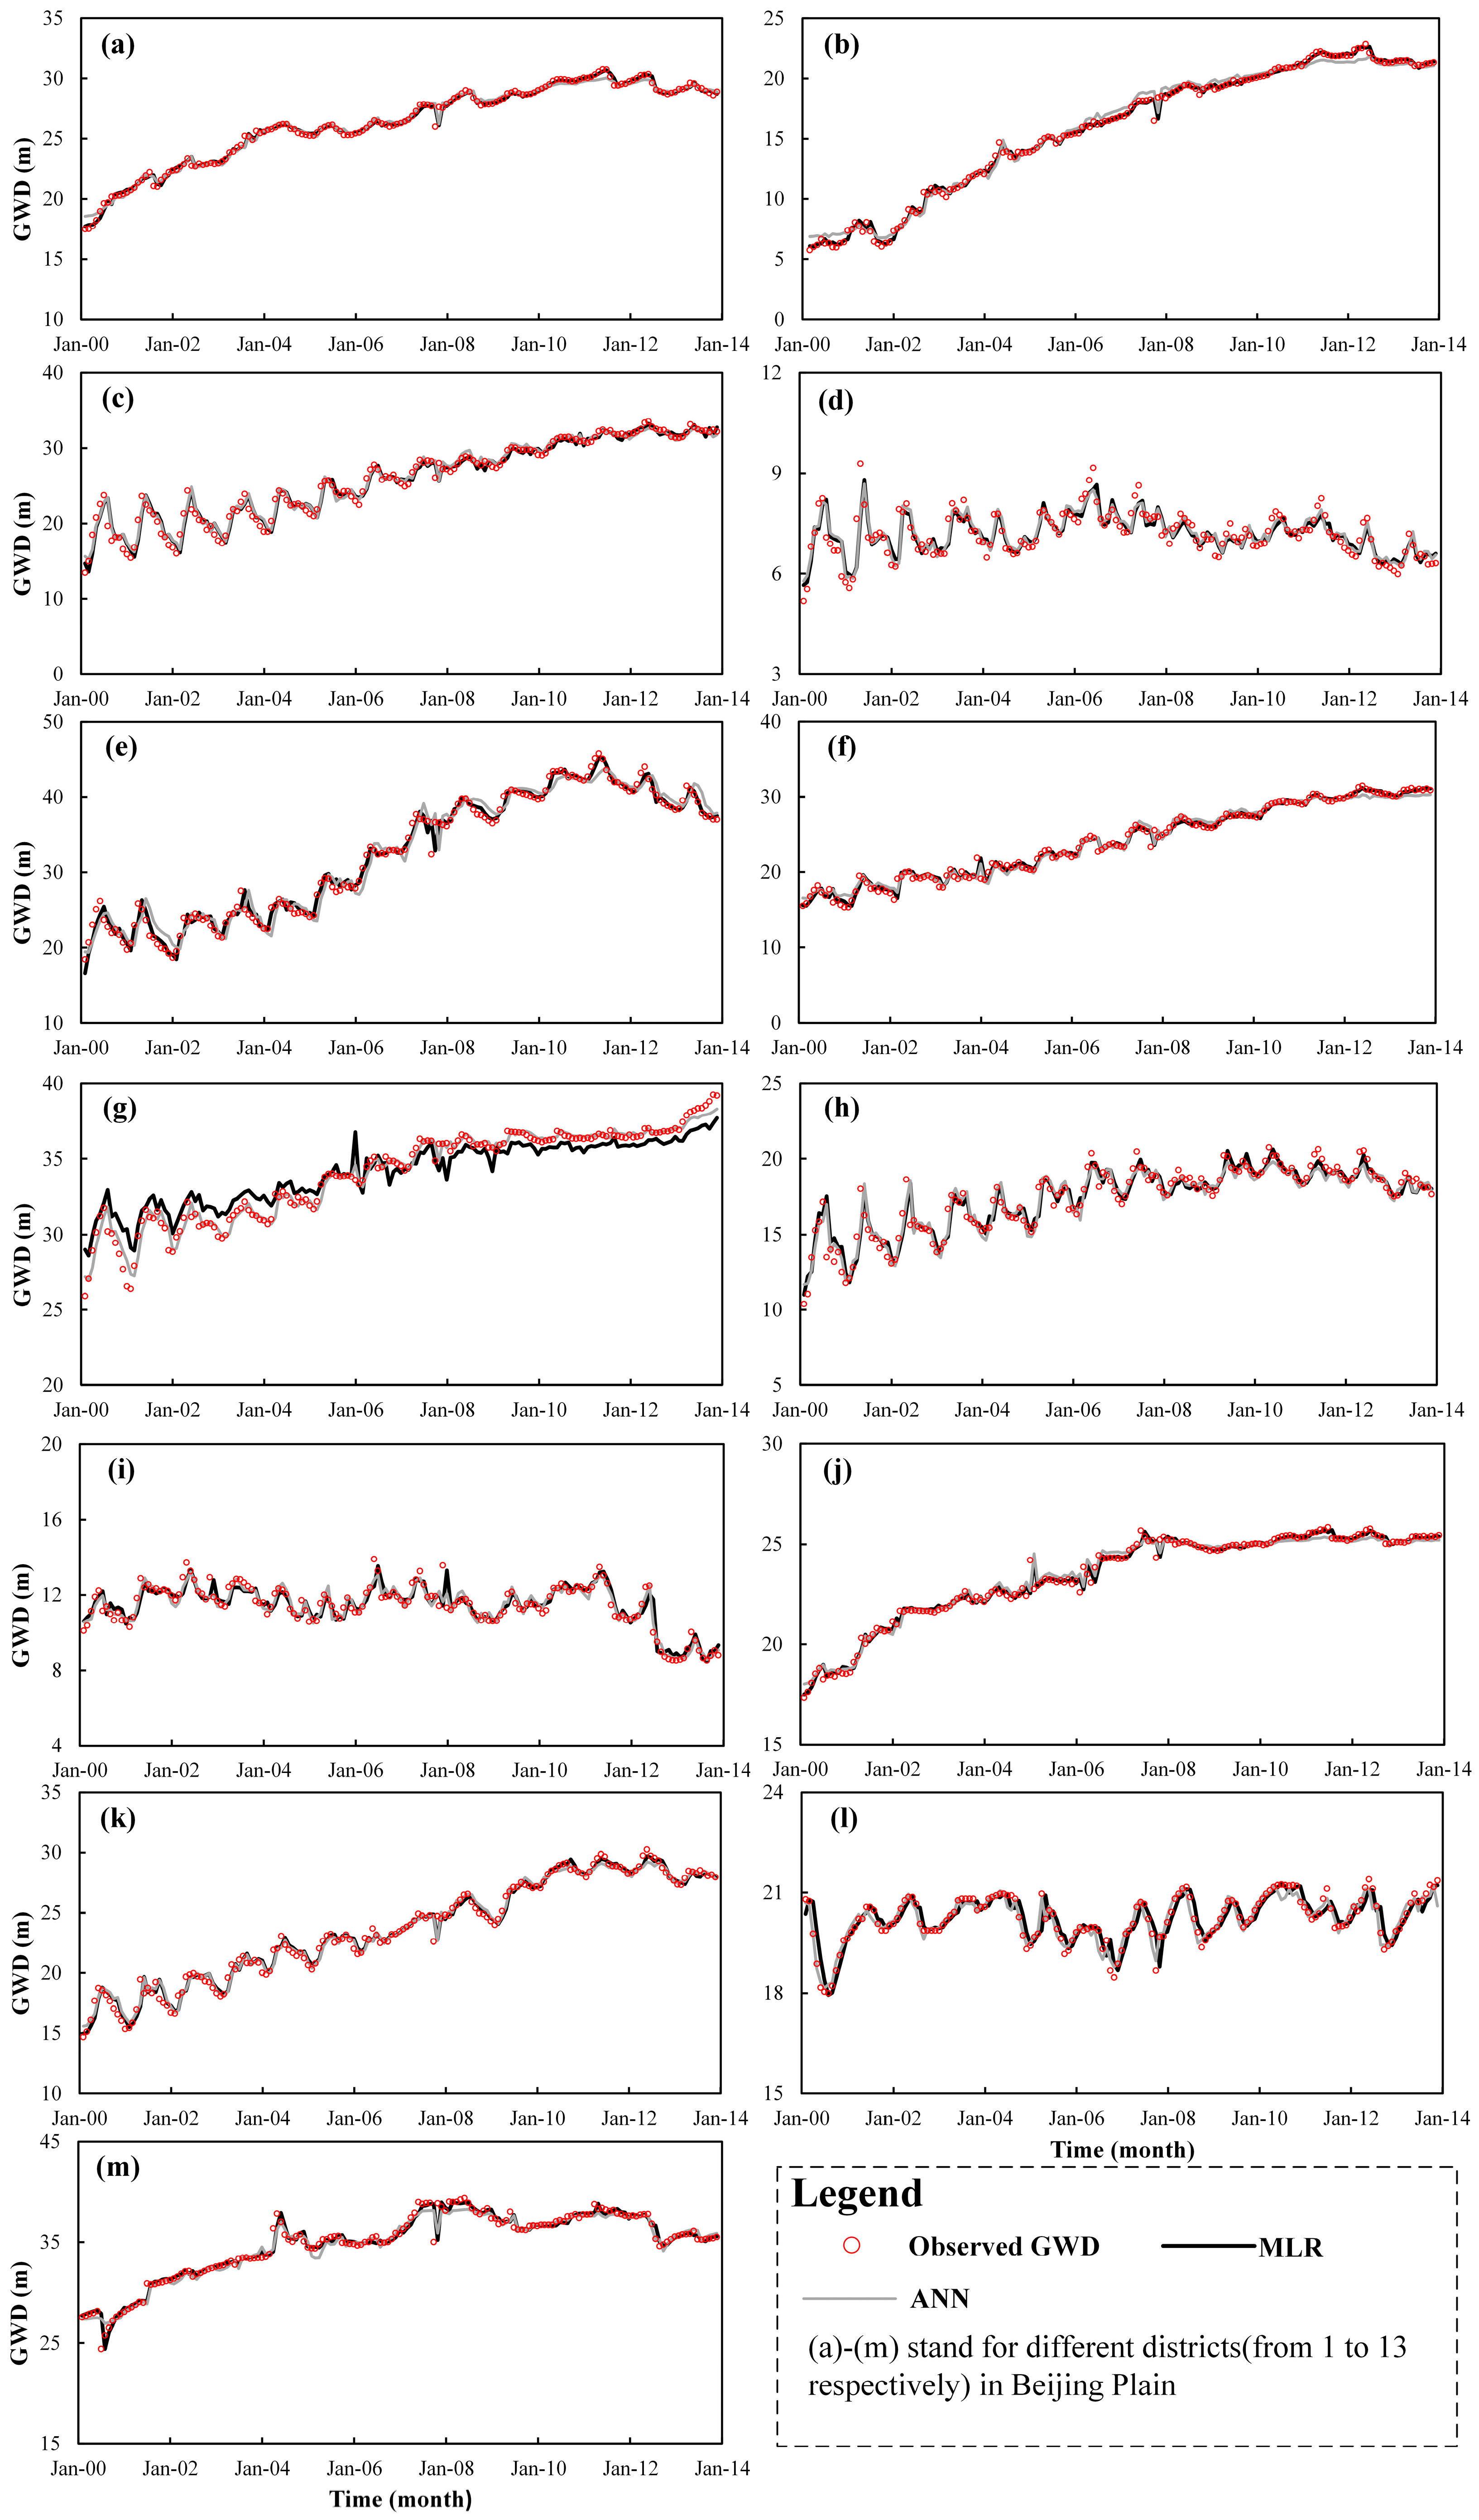
To demonstrate the applicability and effectiveness of the developed surrogate models, the comparisons of predicted and observed GWDs from developed models in the typical districts are shown in Figure 7. Comparing the predicted GWD by MLR models with observed GWD, it is evident that the predicted results effectively captured the trends in the inter-monthly variability of observed GWD, and both the curves dynamically increased from Jan 2000 to Dec 2013. By and large, the predicted GWD has a perfect match with the observed data in most of the districts. Likewise, comparing the predicted GWD to the ANN models with the observed GWD, the predicted results captured the trends in the inter-monthly variability of the observed GWD quite effectively, and both curves dynamically increased from January 2000 to December 2013. Thus, the predicted GWD is a perfect match with the observed data in nearly all districts. Overall, both of the models have nearly the same well behavior for GWD prediction in each district of the Beijing Plain.
4.4. Evaluation of Model Efficiency
To provide information about the overall match between the observed and simulated depths to groundwater in the typical districts, the Nash–Sutcliffe efficiency (NSE) coefficient, which is calculated using Equation (3) and which is used to evaluate the model efficiency, is used.
Table 2 summarizes the results of the model efficiency evaluation. The NSE coefficients for both the MLR and ANN models are almost over 0.96. In addition, the correlation coefficient, usually denoted as R, provides a measure of how well-observed outcomes are replicated by the model. The performance of most MLR and ANN models yielded an R value of over 0.97. These coefficients demonstrate that the simulations of monthly GWD using two methods match the curve of the observed data very well. Although the model efficiency is not very satisfactory in district 4, the model efficiency of these two models on the monthly GWD meets the requirement for groundwater management in most districts.
To further validate the efficiency of the results predicted by the developed models, the comparison between the observed and predicted GWDs in each district of the Beijing Plain is listed in Table 3. The absolute errors between the predicted and observed annual average GWD are generally less than 0.23 m, and the relative errors are approximately less than 0.23% for MLR models. The absolute errors are basically less than 1.38 m, and the relative errors are approximately less than 0.05% for ANN models. The simulated GWD and the measured GWD are lower than 4.65% in all districts. The better fitting and validation indicate that both the developed models are feasible and reliable.
Comparing BP-ANN models with MLR models, the results are consistent with the observed results. The fitting from the BP-ANN model is better than that from the MLR, while the predicted GWD of 2014 is worse, especially in districts 2 and 3. Generally, the better the fitting is, the more accurate the predicted GWD. From Table 3, the more coefficients there are, the less the relative deviations predicted by the MLR are in most districts, except districts 4 and 7. However, the prediction of the BP-ANN does not observe this. For example, the observed GWD and predicted GWD do not match very well in districts 3, 10 and 11, where NSEs are 0.96, 0.99, 0.99, respectively, and R values are 0.98, 0.99, 0.99, respectively, while its relative deviations of prediction are nearly 0.90 m, 1.12 m and 0.96 m, respectively. Therefore, the MLR models are more appropriate and available as surrogate models for predictions of the Beijing Plain. Due to the good fitting of the prediction using the MLR models with the observed GWD in the test phase and the low deviation between the predicted and measured GWDs, the developed models can be used as surrogate models of regular and complex numerical simulation models for GWD prediction of the Beijing Plain. Using the weights of the developed models after training, the average GWD of each district can be predicted by precipitation, groundwater use and the historical GWD of each district, which is more convenient for groundwater management. Moreover, we can compare the predicted annual average GWD by the reliable surrogate model, namely, the MLR model, with the measured annual average GWD of 2014 in each district of Beijing by the rainfall, groundwater use and GWD before 2014. Thus, the grade of groundwater of each district can be evaluated, and the corresponding management strategies can be made.
5. Model Application and Discussion
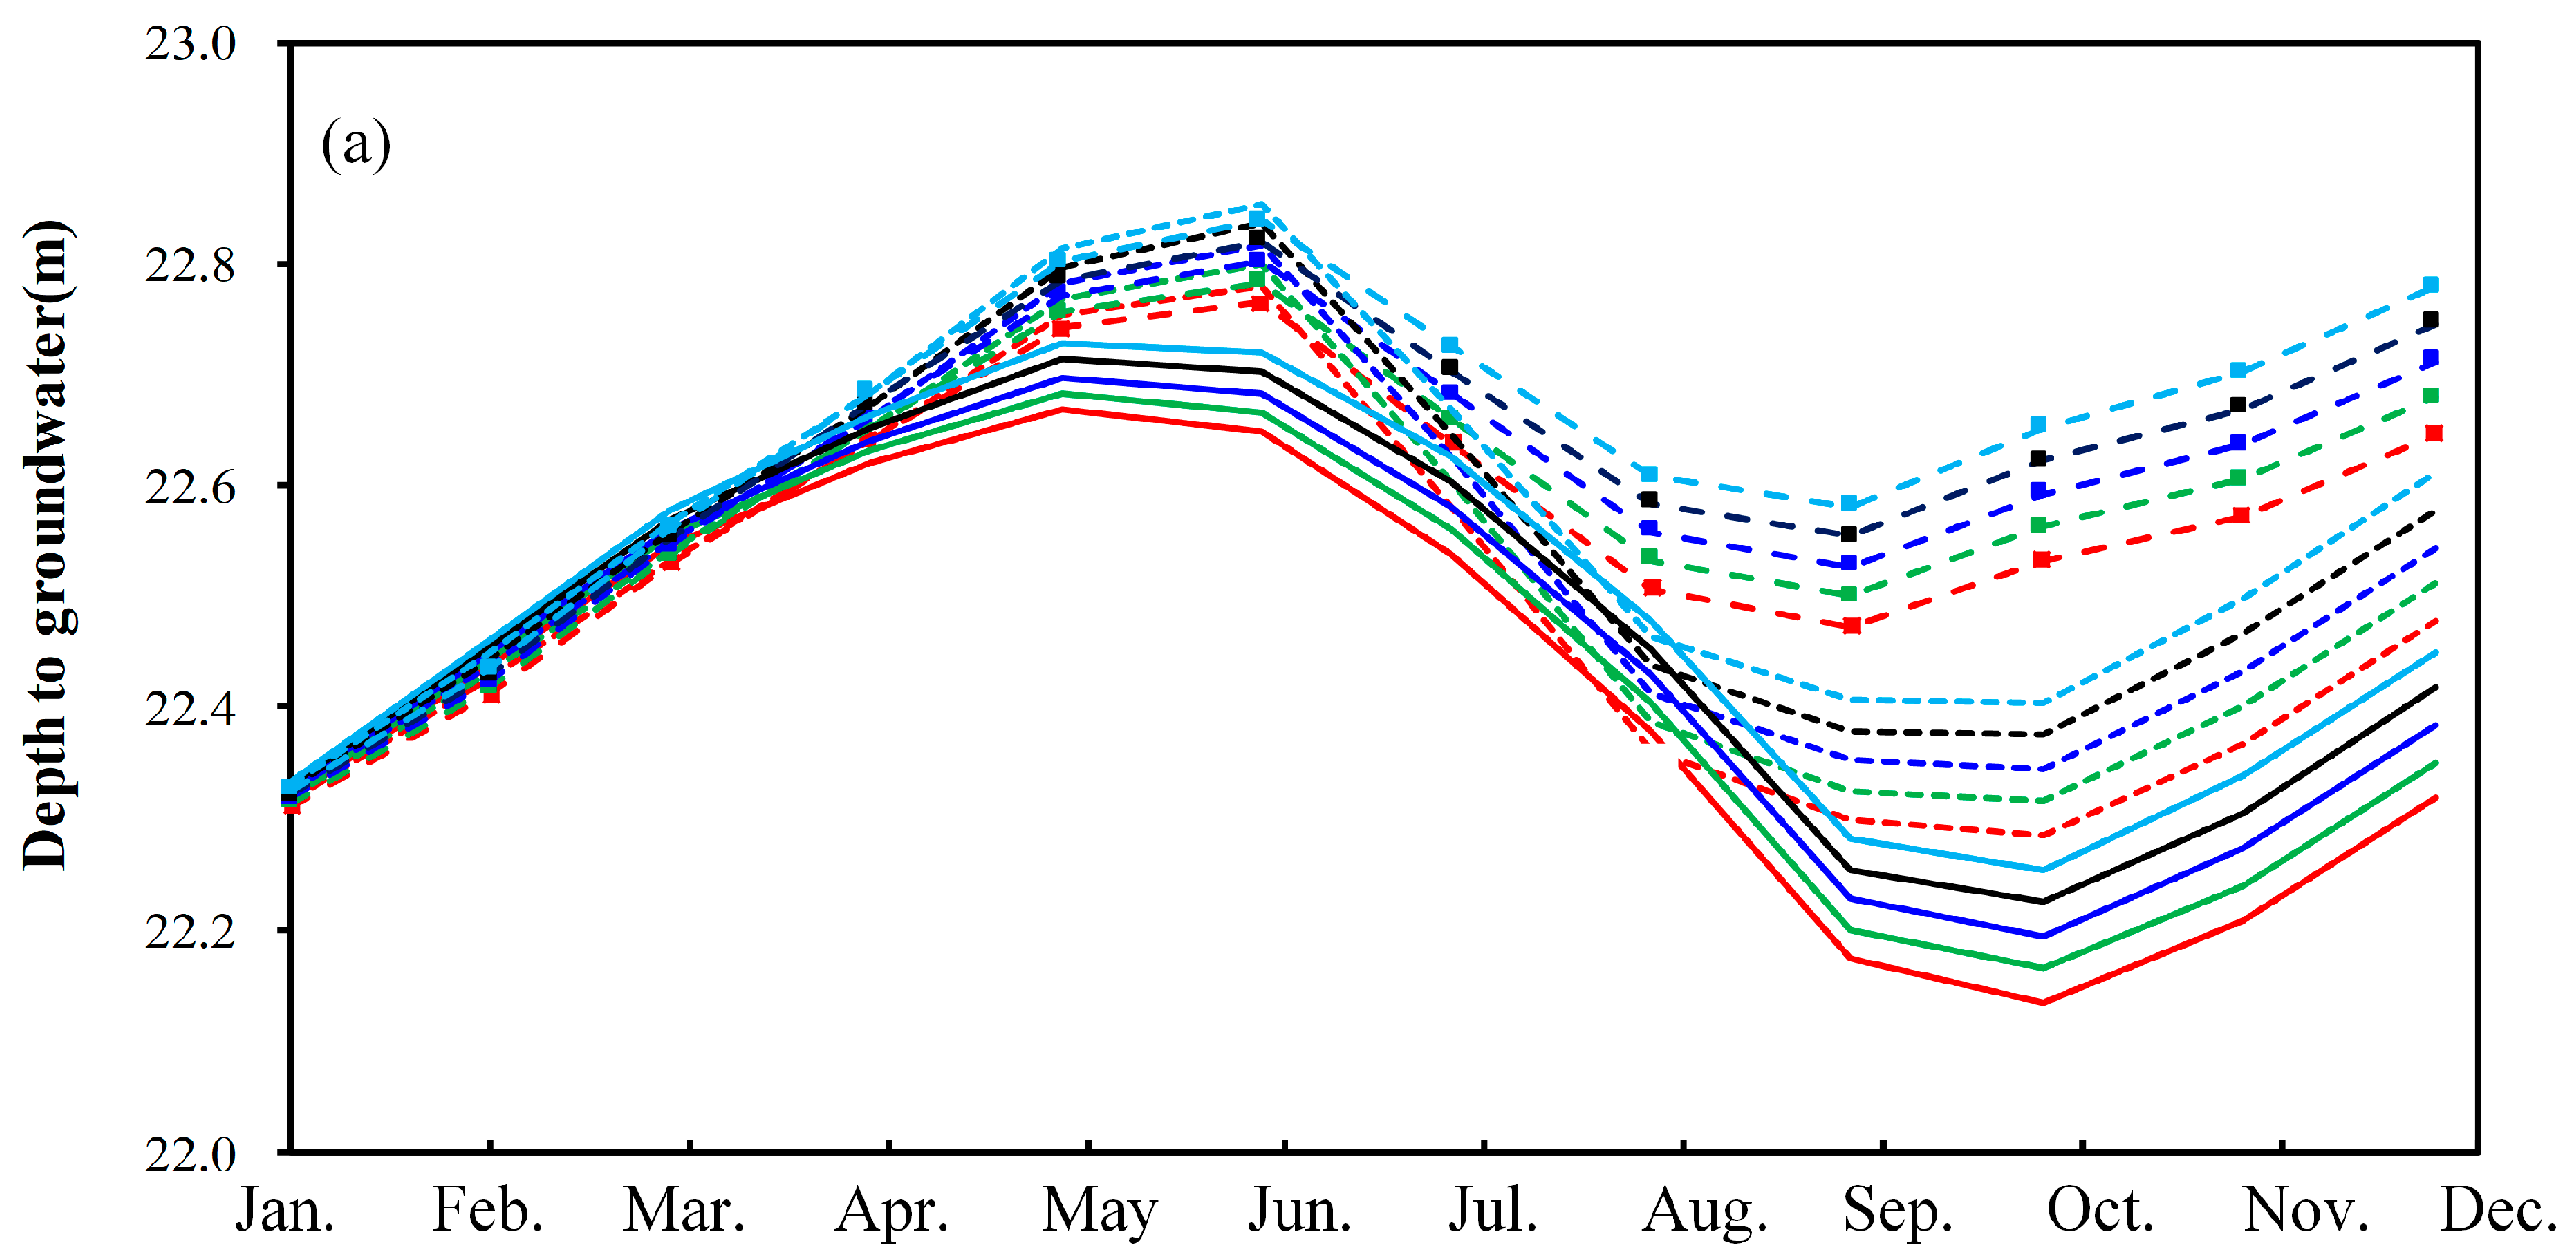
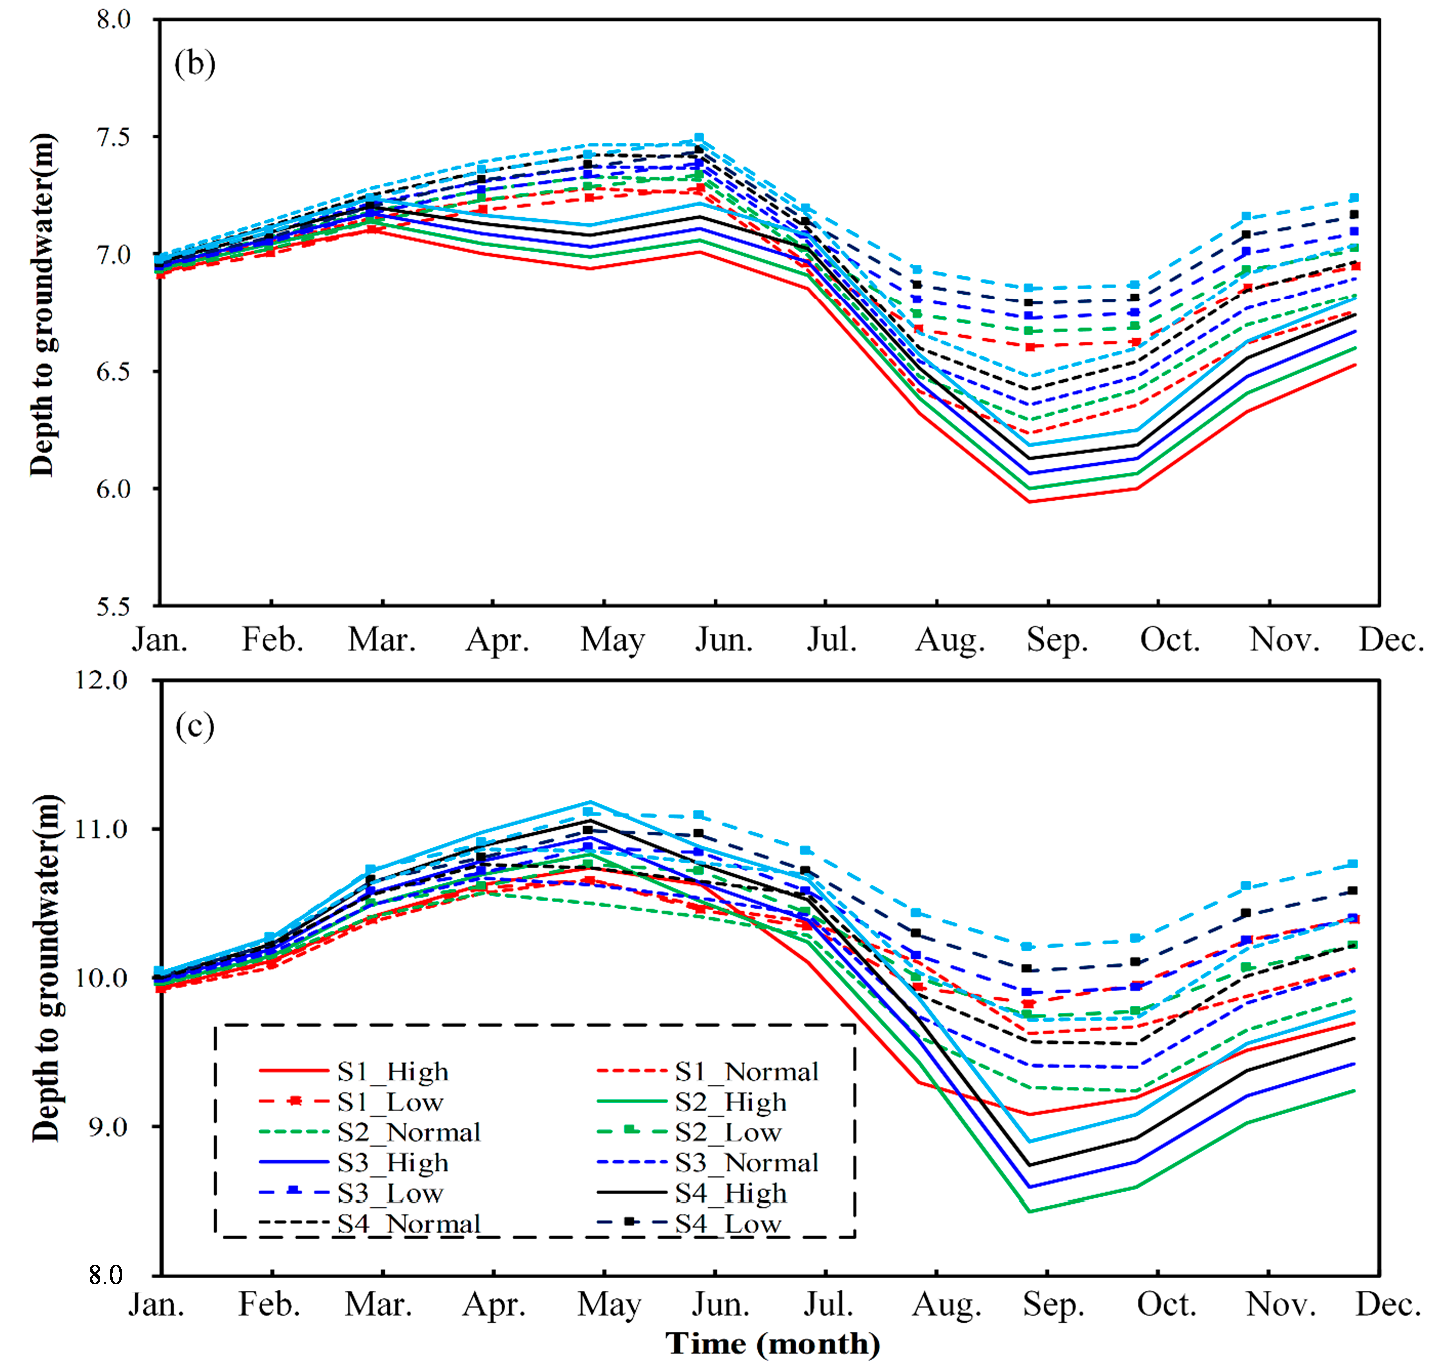
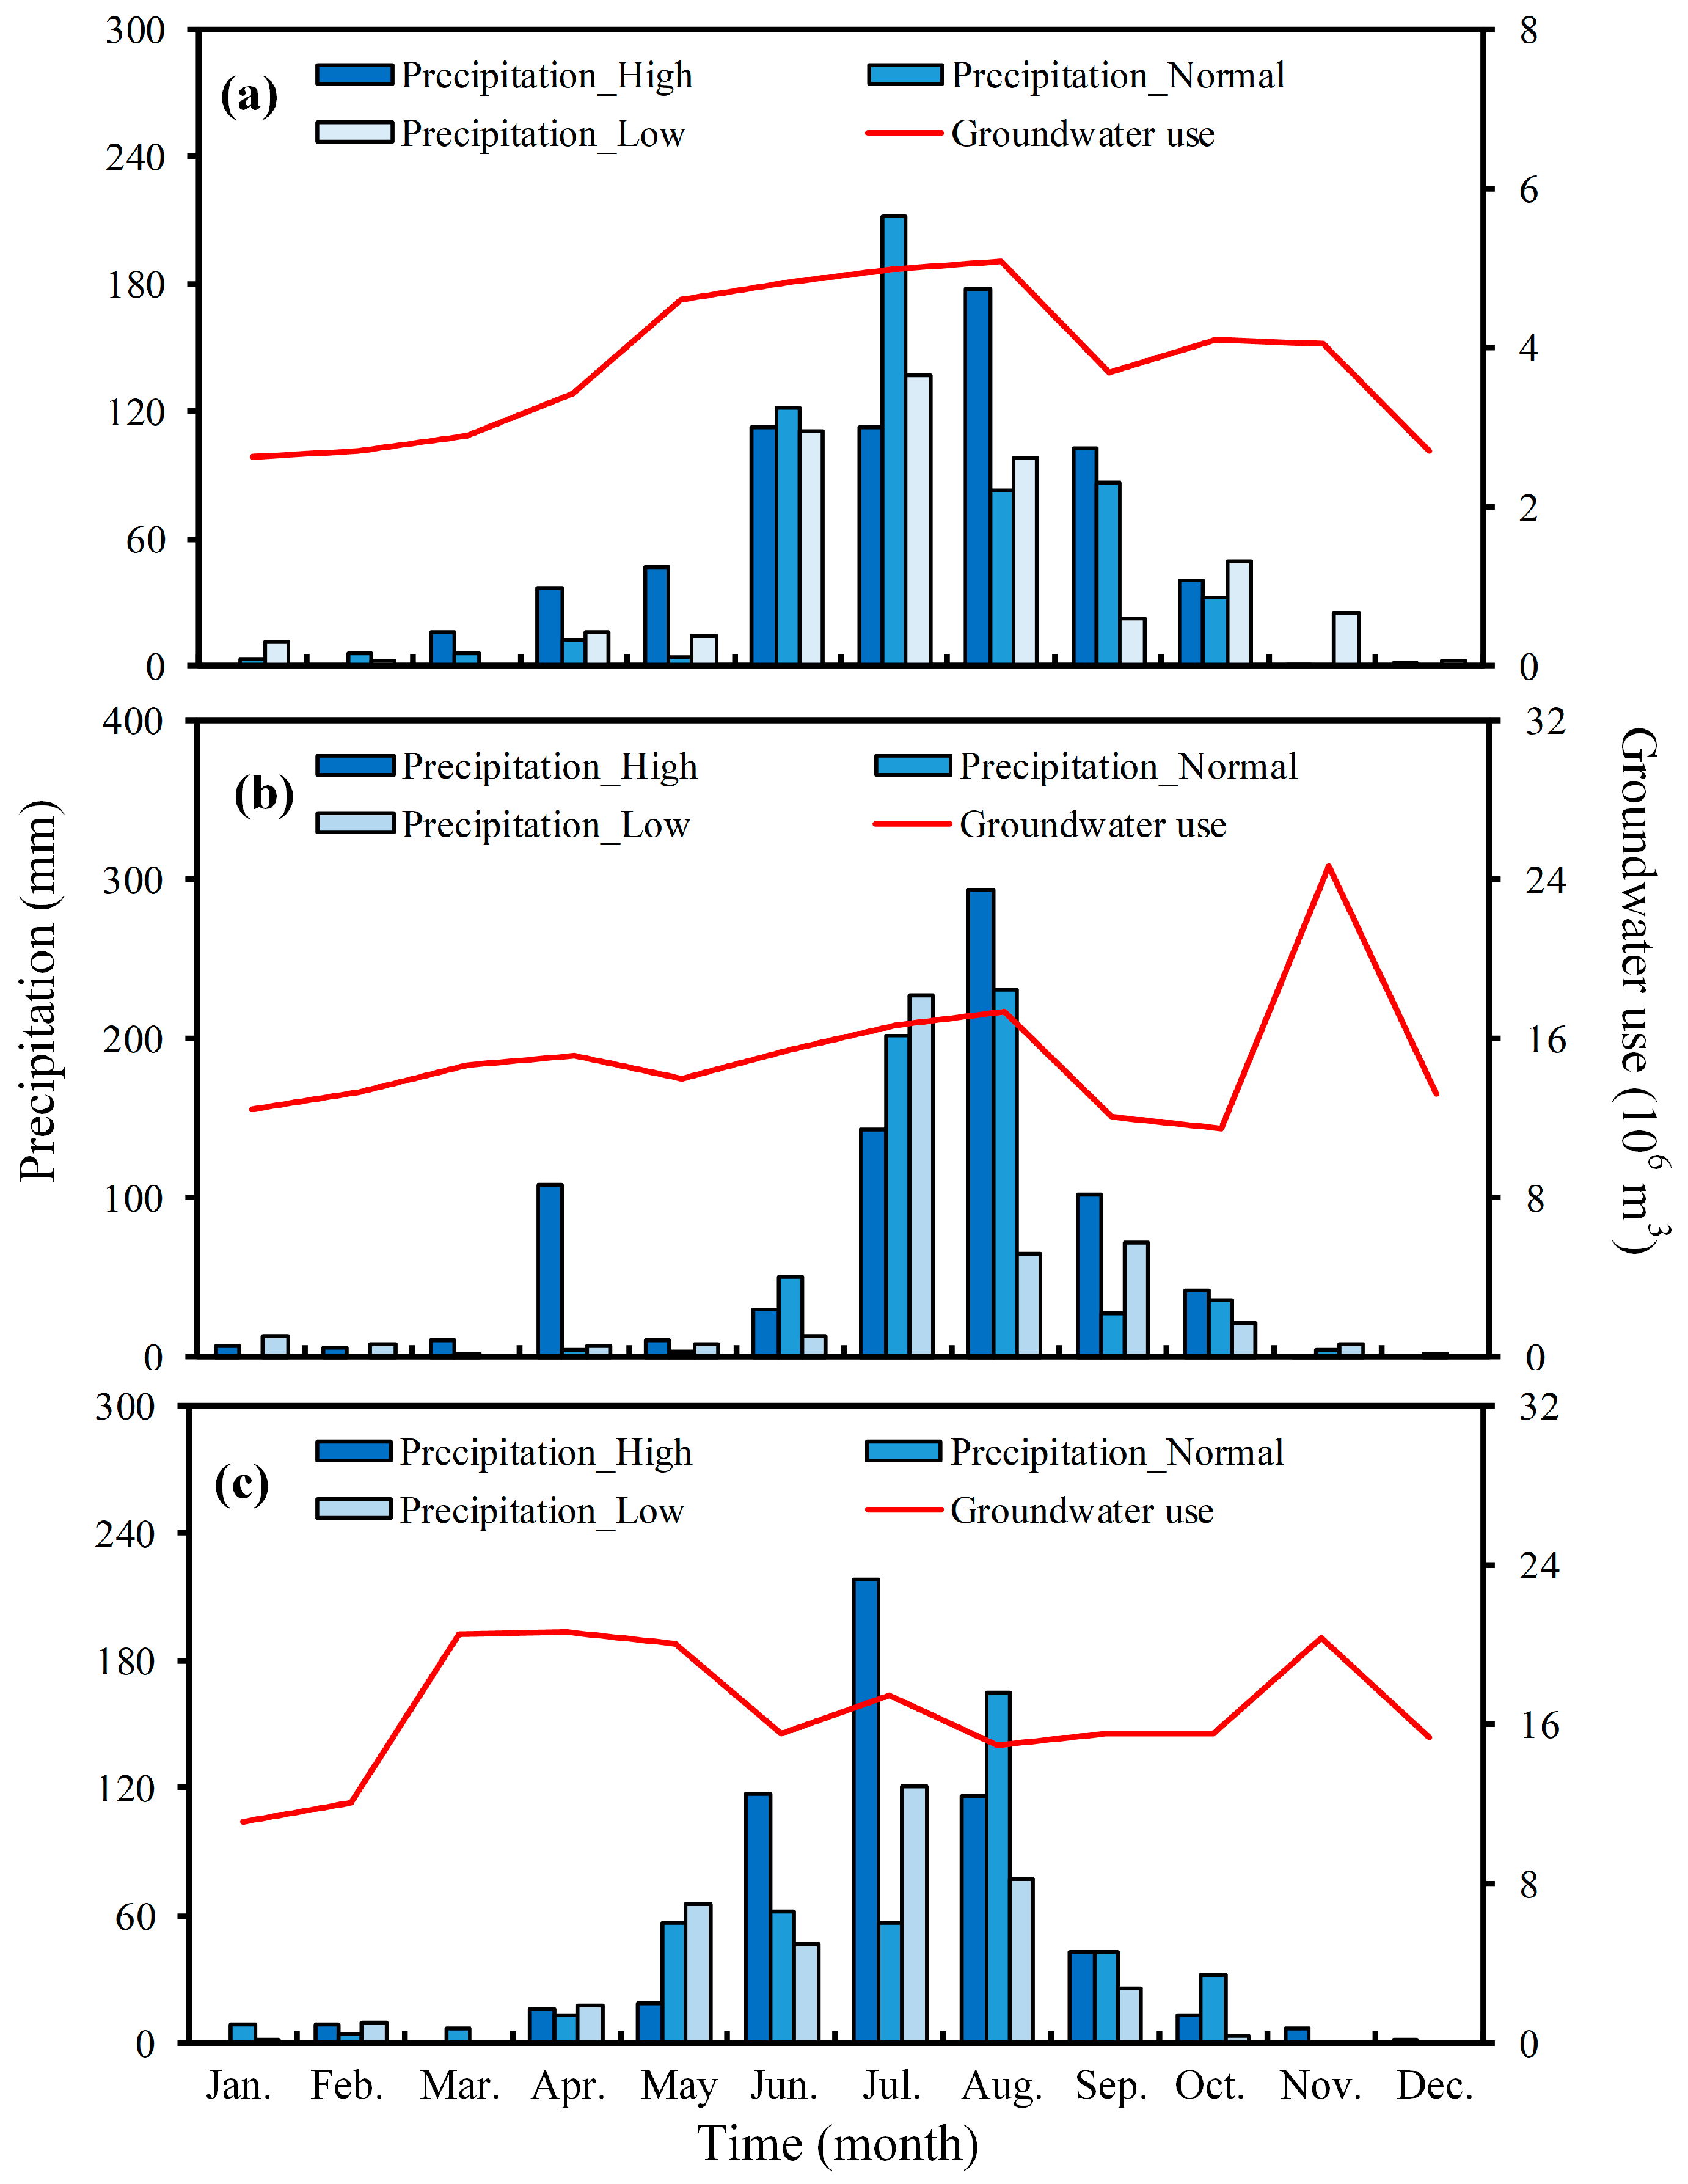
To test the applicability of the developed surrogate models in groundwater management, different scenarios of groundwater use are set to discuss groundwater management. Five groundwater use scenarios of groundwater consist of 80%, 90%, 100%, 110%, and 120% compared to that of 2014. Three scenarios of precipitation are set by the dry, normal and wet seasons. Precipitation of the three scenarios and the groundwater use in 2014 are shown in Figure 8, and based on this figure, we set fifteen scenarios of groundwater management for five kinds of groundwater use and three precipitation conditions in three typical districts. Taking 2014 as the evaluation year, we use the developed MLR models to predict the yearly average GWD of the next year to analyze the changes in the groundwater level under different scenarios. To achieve the groundwater assessment for management, combining the above method as shown in Figure 3, we also show the monthly precipitation of wet, normal and dry seasons, respectively in Figure 8. Thus, the monthly regional GWD can be predicted one by one under different water periods. The predicted results in three typical districts are shown in Figure 9. From Figure 9, we can see that the predicted monthly GWDs in three typical districts have the same patterns. Usually, the low peak of GWD will emerge in June and December, while there is a high peak of GWD in September and October. Variations in groundwater level changes are less than approximately 0.7 m, 1.0 m and 2.0 m for three precipitation scenarios, respectively, which is conformed with the observed data in this year. Therefore, these predictions can offer a reference for groundwater management.
Taking district 2 as an example, the amplitude of GWD ranges from 0.19~0 m, −0.13~−0.5 m and −0.02~−1.0 m, under wet, normal and dry seasons, respectively. Then, at the end of 2015, the measured amplitude in district 2 can be obtained by subtracting the GWD at the end of 2014 from the GWD at the end of 2015. If the measured amplitude is equal to 0.11 m and the actual precipitation is a wet season in 2015 by comparing the predicted amplitude with the measured amplitude, the grading level of groundwater management in 2015 is good in district 2. However, if the measured amplitude is equal to −0.1 m, the grading level of groundwater management is bad. Based on the management grade, corresponding management strategies would be determined, and the reasonable water level and mining schemes can be strengthened in the next year. It is worthwhile to note that the developed surrogate models need to be calibrated anew using actual related data at the end of each year for better prediction and management.
6. Conclusions
China faces a considerable challenge in groundwater management due to the shortage of groundwater resources, especially in North China. Efficient management of groundwater resources is conducive to solving these groundwater problems. With the deterioration of the groundwater situation, the Chinese government has strengthened groundwater regulations. Groundwater management legislation has been issued, which puts GWLs into the assessment system for related managers. The GWL is an important indicator to judge whether a potential environmental problem exists. Compared with groundwater use, GWL is more appropriate as an indicator for groundwater resource management. Therefore, it is significant and necessary to predict the GWL accurately. Compared with numerical models, surrogate models are much easier to operate and more efficient for quick groundwater resource management. The multiple linear regression and back propagation artificial neural network models have been used as the most common approaches for GWL prediction.
For the convenience of water administrative management, the Beijing Plain can be divided into 13 different sub-regions by administrative boundaries. Using two frequently used methods, MLR and BP-ANN, we developed surrogate models in each district. Groundwater use data for 180 months, including precipitation and average depth to groundwater from 2000 to 2014 of the Beijing Plain was used for training (2000–2013) and testing (2014) the models. The results of the developed models showed that the performance of the MLR models is better than that of the BP-ANN models and that the MLR models are a better choice for the surrogate models than the BP-ANN models. Fifteen scenarios under different groundwater use and precipitation conditions are set to show the applicability of the developed model in groundwater management. The monthly predictions show the changes of groundwater level under different scenarios match well with the observed results. Finally, the established surrogate models are used for groundwater management in the sub-regions, and then, the grade of groundwater management can be made.
The surrogate models can provide effective, timely, and scientifically based decision support that can be used by decision-makers for the management of water resources in Beijing, as well as offer some reference and demonstration for other Chinese cities and regions. This presented study mainly talks about how the surrogate can be used for groundwater management, but the relationship between the total groundwater quantity and groundwater level is important and ongoing work and not discussed in detail. The model can be used for prediction and management of the groundwater level in any region to be interested. For the purpose of actual requirements of local governments in China, the study only discusses the change of groundwater level in different districts. However, since this model relies heavily on the availability of related data, especially the groundwater observations, the prediction depends on the accuracy and locations of input variables. Uncertainty of the model prediction is caused by the quality of observed GWL. Effective improvement on the groundwater monitoring network used for groundwater management of each region will need to be enhanced in the future.
Acknowledgments
This research was supported by the Beijing Natural Science Foundation (J150002) and the National Nature Science Foundation of China (Grant number: 41572220). The authors thank the Beijing Hydrological Center for the data provided, and constructive comments and suggestions from two anonymous reviewers.
Author Contributions
Menglin Zhang wrote the paper and calculated the developed models. Litang Hu developed the MLR and BP-ANN codes and was the technical advisor for the studies discussed in the paper. Lili Yao collected and analyzed the related data. Wenjie Yin tested the programs and manipulated most of the related figures.
Conflicts of Interest
The authors declare no conflict of interest.
References
- Feng, W.; Zhong, M.; Lemoine, J.-M.; Biancale, R.; Hsu, H.-T.; Xia, J. Evaluation of groundwater depletion in North China using the gravity recovery and climate experiment (grace) data and ground-based measurements. Water Resour. Res. 2013, 49, 2110–2118. [Google Scholar] [CrossRef]
- Villholth, K. Groundwater assessment and management: Implications and opportunities of globalization. Hydrogeol. J. 2006, 14, 330–339. [Google Scholar] [CrossRef]
- Iqbal, N.; Hossain, F.; Lee, H.; Akhter, G. Integrated groundwater resource management in indus basin using satellite gravimetry and physical modeling tools. Environ. Monit. Assess. 2017, 189, 128. [Google Scholar] [CrossRef] [PubMed]
- Famiglietti, J.S.; Lo, M.; Ho, S.L.; Bethune, J.; Anderson, K.J.; Syed, T.H.; Swenson, S.C.; de Linage, C.R.; Rodell, M. Satellites measure recent rates of groundwater depletion in California’s central valley. Geophys. Res. Lett. 2011, 38, L03403. [Google Scholar] [CrossRef]
- Qiu, J. China faces up to groundwater crisis. Nature 2010, 466, 308. [Google Scholar] [CrossRef] [PubMed]
- Sen, Z.; As-Sefry, S.; Al-Harithy, S. Strategic management of groundwater resources in the Arabian Peninsula: Wadi Na’man case. Arab. J. Geosci. 2017, 10, 50. [Google Scholar] [CrossRef]
- Dogrul, E.C.; Brush, C.F.; Kadir, T.N. Groundwater modeling in support of water resources management and planning under complex climate, regulatory, and economic stresses. Water 2016, 8, 592. [Google Scholar] [CrossRef]
- Chang, F.-J.; Huang, C.-W.; Cheng, S.-T.; Chang, L.-C. Conservation of groundwater from over-exploitation-scientific analyses for groundwater resources management. Sci. Total Environ. 2017, 598, 828–838. [Google Scholar] [CrossRef] [PubMed]
- Hasanuzzaman, M.; Song, X.F.; Han, D.M.; Zhang, Y.H.; Hussain, S. Prediction of groundwater dynamics for sustainable water resource management in bogra district, Northwest Bangladesh. Water 2017, 9, 17. [Google Scholar] [CrossRef]
- Toews, M.W.; Daughney, C.J.; Cornaton, F.J.; Morgenstern, U.; Evison, R.D.; Jackson, B.M.; Petrus, K.; Mzila, D. Numerical simulation of transient groundwater age distributions assisting land and water management in the middle wairarapa valley, New Zealand. Water Resour. Res. 2016, 52, 9430–9451. [Google Scholar] [CrossRef]
- Shen, D. Groundwater management in China. Water Policy 2015, 17, 61–82. [Google Scholar] [CrossRef]
- Nelson, R.; Perrone, D. The role of permitting regimes in Western United States groundwater management. Ground Water 2016, 54, 761–764. [Google Scholar] [CrossRef] [PubMed]
- Guilfoos, T.; Khanna, N.; Peterson, J.M. Efficiency of viable groundwater management policies. Land Econ. 2016, 92, 618–640. [Google Scholar] [CrossRef]
- Gill, B.; Webb, J.; Stott, M.; Cheng, X.; Wilkinson, R.; Cossens, B. Economic, social and resource management factors influencing groundwater trade: Evidence from Victoria, Australia. J. Hydrol. 2017, 550, 253–267. [Google Scholar] [CrossRef]
- Acreman, M. Towards the Sustainable Management of Groundwater-fed Catchments in Europe. In Regional Management of Water Resources; Schumann, A.H., Acreman, M.C., Davis, R., Marino, M.A., Rosbjerg, D., Jun, X., Eds.; IAHS: London, UK, 2001; pp. 123–130. [Google Scholar]
- Wilko, S.; Chen, Y.; Schnug, E. Opportunities of Knowledge and Technology Exchange between China and Europe to Solve Common Groundwater Management Problems Related to Agriculture. In Proceedings of the 2nd International Conference on Asian-European Environmental Technology and Knowledge Transfer, Hefei University, Hefei, China, 5–6 June 2008; pp. 31–42. [Google Scholar]
- Sophocleous, M. Review: Groundwater management practices, challenges, and innovations in the high plains aquifer, USA-lessons and recommended actions. Hydrogeol. J. 2010, 18, 559–575. [Google Scholar] [CrossRef]
- Nan, T.; Shao, J.; Cao, X.; Zhang, Q.; Cui, Y. Design of an index system for deep groundwater management efficiency evaluation: A case study in Tianjin City, China. Chin. Geogr. Sci. 2016, 26, 325–338. [Google Scholar] [CrossRef]
- Feng, S.; Huo, Z.; Kang, S.; Tang, Z.; Wang, F. Groundwater simulation using a numerical model under different water resources management scenarios in an arid region of china. Environ. Earth Sci. 2011, 62, 961–971. [Google Scholar] [CrossRef]
- Palma, H.C.; Bentley, L.R. A regional-scale groundwater flow model for the Leon-Chinandega aquifer, Nicaragua. Hydrogeol. J. 2007, 15, 1457–1472. [Google Scholar] [CrossRef]
- Wu, J.; Shi, X.; Ye, S.; Xue, Y.; Zhang, Y.; Yu, J. Numerical simulation of land subsidence induced by groundwater overexploitation in Su-Xi-Chang area, China. Environ. Geol. 2009, 57, 1409–1421. [Google Scholar] [CrossRef]
- Tian, J.; Li, C.; Liu, J.; Yu, F.; Cheng, S.; Zhao, N.; Wan, W.J. Groundwater depth prediction using data-driven models with the assistance of gamma test. Sustainability 2016, 8, 1076. [Google Scholar] [CrossRef]
- Gong, Y.; Zhang, Y.; Lan, S.; Wang, H. A comparative study of artificial neural networks, support vector machines and adaptive neuro fuzzy inference system for forecasting groundwater levels near lake Okeechobee, Florida. Water Resour. Manag. 2016, 30, 375–391. [Google Scholar] [CrossRef]
- Asefa, T.; Kemblowski, M.; Urroz, G.; Mckee, M. Support vector machines (svms) for monitoring network design. Ground Water 2005, 43, 413–422. [Google Scholar] [CrossRef] [PubMed]
- Xu, T.; Valocchi, A.J.; Choi, J.; Amir, E. Use of machine learning methods to reduce predictive error of groundwater models. Ground Water 2014, 52, 448–460. [Google Scholar] [CrossRef] [PubMed]
- Pan, Y.; Gong, H.; Sun, Y.; Wang, X.; Ding, F. Distributed estimation and analysis of precipitation recharge coefficient in strongly-exploited Beijing plain area, China. Chin. Geogr. Sci. 2017, 27, 88–96. [Google Scholar] [CrossRef]
- Yang, Y.; Li, G.-M.; Dong, Y.-H.; Li, M.; Yang, J.-Q.; Zhou, D.; Yang, Z.-S.; Zheng, F.-D. Influence of south to north water transfer on groundwater dynamic change in Beijing plain. Environ. Earth Sci. 2012, 65, 1323–1331. [Google Scholar] [CrossRef]
- Huang, M.; Tian, Y. Prediction of groundwater level for sustainable water management in an arid basin using datadriven models. In Proceedings of the 2015 International Conference on Sustainable Energy and Environmental Engineering; Shaw, P., Ed.; Atlantis Press: Amsterdam, The Netherlands, 2015; Volume 14, pp. 134–137. [Google Scholar]
- Gunawardhana, L.N.; Kazama, S. Statistical and numerical analyses of the influence of climate variability on aquifer water levels and groundwater temperatures: The impacts of climate change on aquifer thermal regimes. Glob. Planet. Chang. 2012, 86–87, 66–78. [Google Scholar] [CrossRef]
- Ebrahimi, H.; Rajaee, T. Simulation of groundwater level variations using wavelet combined with neural network, linear regression and support vector machine. Glob. Planet. Chang. 2017, 148, 181–191. [Google Scholar] [CrossRef]
- Guzman, S.M.; Paz, J.O.; Tagert, M.L.M. The use of narx neural networks to forecast daily groundwater levels. Water Resour. Manag. 2017, 31, 1591–1603. [Google Scholar] [CrossRef]
- Khalil, B.; Broda, S.; Adamowski, J.; Ozga-Zielinski, B.; Donohoe, A. Short-term forecasting of groundwater levels under conditions of mine-tailings recharge using wavelet ensemble neural network models. Hydrogeol. J. 2015, 23, 121–141. [Google Scholar] [CrossRef]
- Pandian, R.S.; Nair, I.S.; Lakshmanan, E. Finite element modelling of a heavily exploited coastal aquifer for assessing the response of groundwater level to the changes in pumping and rainfall variation due to climate change. Hydrol. Res. 2016, 47, 42–60. [Google Scholar]
- Zhang, H.; Wu, P.; Yin, A.; Yang, X.; Zhang, M.; Gao, C. Prediction of soil organic carbon in an intensively managed reclamation zone of Eastern China: A comparison of multiple linear regressions and the random forest model. Sci. Total Environ. 2017, 592, 704–713. [Google Scholar] [CrossRef] [PubMed]
- Coulibaly, P.; Anctil, F.; Aravena, R.; Bobee, B. Artificial neural network modeling of water table depth fluctuations. Water Resour. Res. 2001, 37, 885–896. [Google Scholar] [CrossRef]
- Yang, C.-C.; Chen, C.-S. Application of integrated back-propagation network and self organizing map for flood forecasting. Hydrol. Process. 2009, 23, 1313–1323. [Google Scholar] [CrossRef]
- Banerjee, P.; Prasad, R.K.; Singh, V.S. Forecasting of groundwater level in hard rock region using artificial neural network. Environ. Geol. 2009, 58, 1239–1246. [Google Scholar] [CrossRef]
- Haykin, S. Neural networks: A comprehensive foundation; Prentice Hall PTR: Upper Saddle River, NJ, USA, 1994; pp. 287–292. [Google Scholar]
- Wang, L.; Guo, H. Effects of continuous drought on groundwater in Beijing plain. Hydrogeol. Eng. Geol. 2015, 42, 1–6. (In Chinese) [Google Scholar]
- Wang, J.; Shang, Y.; Wang, H.; Zhao, Y.; Yin, Y. Beijing’s water resources: Challenges and solutions. J. Am. Water Resour. Assoc. 2015, 51, 614–623. [Google Scholar] [CrossRef]
Figure 1.
Schematic figures of water level control (a) and the relation between groundwater quality (GWQ) and groundwater level (GWL) (b).
Figure 1.
Schematic figures of water level control (a) and the relation between groundwater quality (GWQ) and groundwater level (GWL) (b).

Figure 2.
Schematic figures of the back propagation artificial neural network (BP-ANN) method.

Figure 3.
The process of groundwater management in the Beijing Plain.

Figure 4.
Schematic figures of the study area.
Figure 5.
Changes in precipitation and groundwater use in the Beijing Plain.
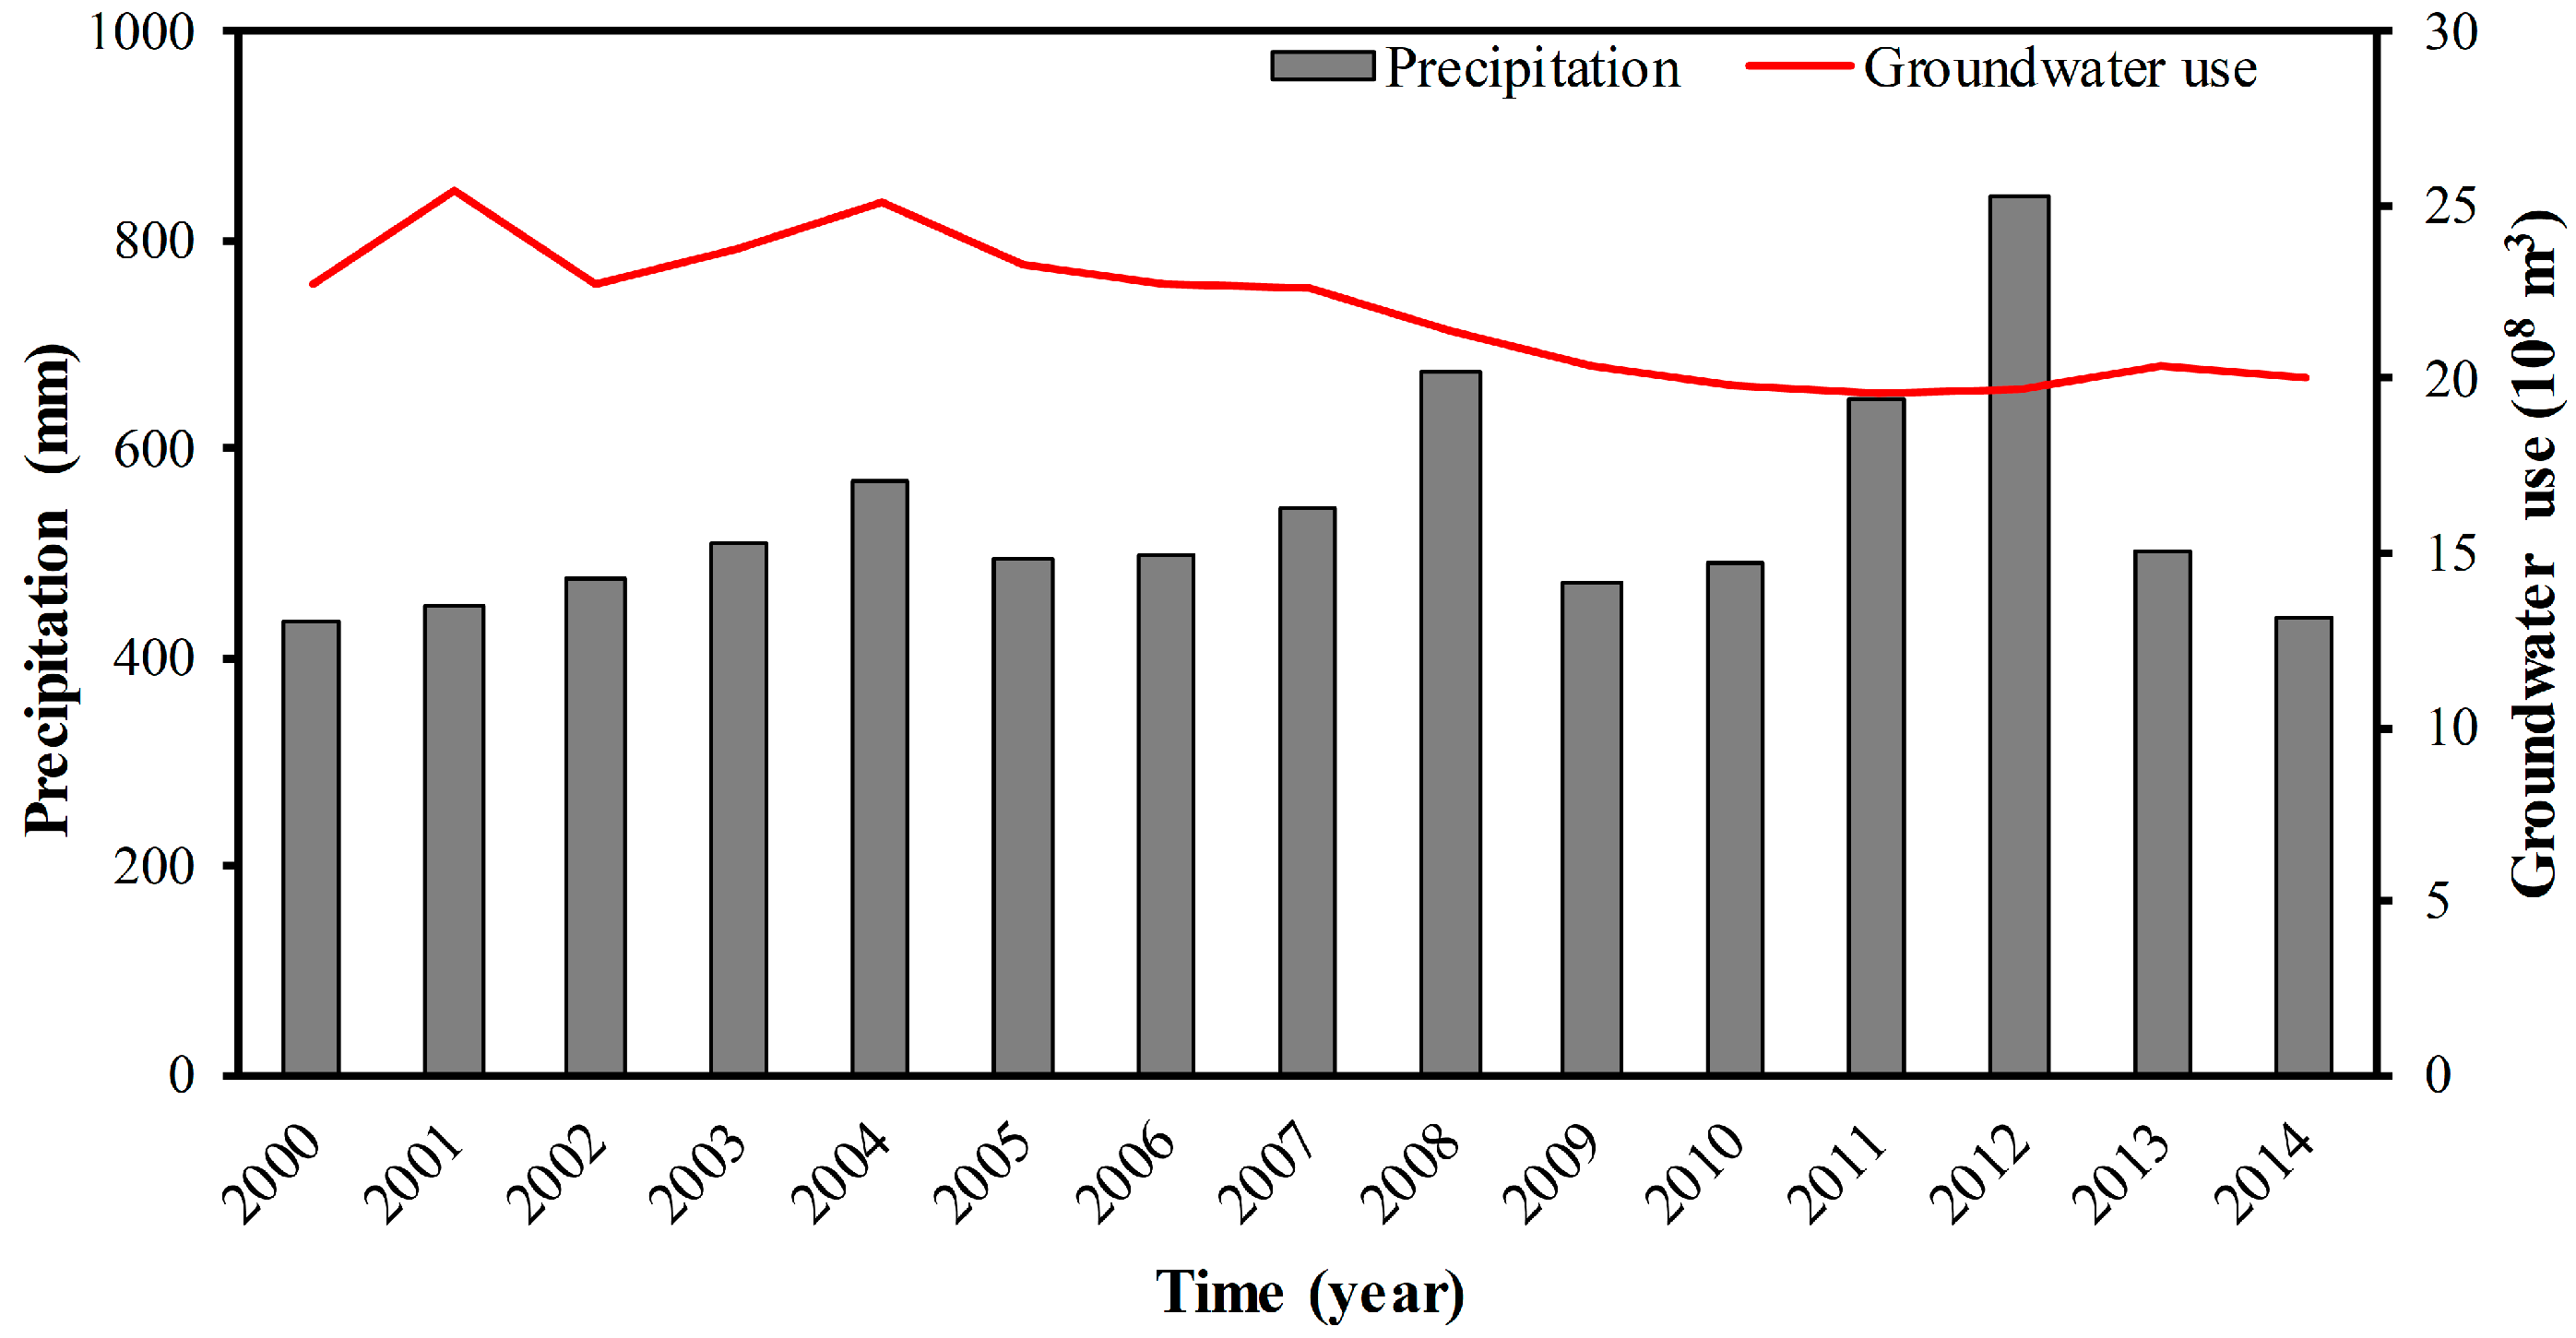
Figure 6.
Changes in precipitation and mean groundwater levels in district 3.

Figure 7.
Comparison of observed and predicted groundwater depth (GWD) by multiple linear regression (MLR) and ANN models.
Figure 7.
Comparison of observed and predicted groundwater depth (GWD) by multiple linear regression (MLR) and ANN models.

Figure 8.
The precipitation under three seasons and groundwater use in 2014 in three typical districts.
Figure 8.
The precipitation under three seasons and groundwater use in 2014 in three typical districts.

Figure 9.
Monthly predicted GWD in 2015 determined by MLR models of five scenarios ((a–c) represent the results of districts 2, 4 and 9, respectively).
Figure 9.
Monthly predicted GWD in 2015 determined by MLR models of five scenarios ((a–c) represent the results of districts 2, 4 and 9, respectively).

Table 1.
List of data sources used in this study.
| Data Types | Time Series | Time Scale | Data Sources |
|---|---|---|---|
| Precipitation | 2000–2014 | Monthly | Meteorological stations |
| Groundwater use | 2000–2014 | Monthly | Hydrological station and office for water conservation |
| Observation well data | 2000–2014 | Monthly | Central hydrological station of Beijing |
Table 2.
Model efficiency evaluation of each district.
| District ID | 1 | 2 | 3 | 4 | 5 | 6 | 7 | 8 | 9 | 10 | 11 | 12 | 13 |
|---|---|---|---|---|---|---|---|---|---|---|---|---|---|
| NSE-MLR | 0.96 | 0.99 | 0.96 | 0.63 | 0.98 | 0.99 | 0.90 | 0.99 | 0.99 | 0.99 | 0.99 | 0.99 | 0.97 |
| NSE-BP-ANN | 0.99 | 0.99 | 0.97 | 0.71 | 0.98 | 0.99 | 0.98 | 0.99 | 0.99 | 0.99 | 0.99 | 0.99 | 0.97 |
| R-MLR | 0.99 | 0.99 | 0.98 | 0.83 | 0.91 | 0.99 | 0.97 | 0.93 | 0.91 | 0.99 | 0.99 | 0.89 | 0.98 |
| R-BP-ANN | 0.99 | 0.99 | 0.98 | 0.85 | 0.99 | 0.99 | 0.98 | 0.94 | 0.94 | 0.99 | 0.99 | 0.91 | 0.98 |
Table 3.
Results of the predicted yearly average GWD from the developed models in 2014.
| District ID | Measured Value (m) | MLR | BP-ANN | ||||
|---|---|---|---|---|---|---|---|
| Predicted Value (m) | Relative Deviation (m) | Relative Error (%) | Predicted Value (m) | Relative Deviation (m) | Relative Error (%) | ||
| 1 | 29.59 | 29.50 | 0.09 | 0.29 | 29.45 | 0.14 | 0.46 |
| 2 | 21.76 | 21.75 | 0.02 | 0.08 | 21.30 | 0.46 | 2.17 |
| 3 | 33.22 | 33.19 | 0.04 | 0.11 | 32.32 | 0.90 | 2.78 |
| 4 | 6.94 | 6.92 | 0.02 | 0.31 | 6.93 | 0.01 | 0.08 |
| 5 | 39.85 | 39.32 | 0.53 | 1.35 | 39.86 | −0.02 | −0.04 |
| 6 | 31.18 | 31.15 | 0.03 | 0.11 | 30.35 | 0.84 | 2.75 |
| 7 | 39.82 | 38.05 | 1.77 | 4.65 | 38.44 | 1.38 | 3.59 |
| 8 | 18.83 | 18.66 | 0.17 | 0.91 | 18.65 | 0.18 | 0.98 |
| 9 | 9.42 | 9.52 | −0.10 | −1.06 | 9.27 | 0.15 | 1.60 |
| 10 | 25.43 | 25.42 | 0.01 | 0.04 | 24.31 | 1.12 | 4.61 |
| 11 | 29.81 | 29.53 | 0.28 | 0.94 | 28.85 | 0.96 | 3.33 |
| 12 | 22.01 | 21.78 | 0.23 | 1.05 | 21.18 | 0.84 | 3.95 |
| 13 | 36.98 | 36.75 | 0.23 | 0.62 | 36.90 | 0.08 | 0.22 |
© 2017 by the authors. Licensee MDPI, Basel, Switzerland. This article is an open access article distributed under the terms and conditions of the Creative Commons Attribution (CC BY) license (http://creativecommons.org/licenses/by/4.0/).
Share and Cite
MDPI and ACS Style
Zhang, M.; Hu, L.; Yao, L.; Yin, W. Surrogate Models for Sub-Region Groundwater Management in the Beijing Plain, China. Water 2017, 9, 766. https://doi.org/10.3390/w9100766
AMA Style
Zhang M, Hu L, Yao L, Yin W. Surrogate Models for Sub-Region Groundwater Management in the Beijing Plain, China. Water. 2017; 9(10):766. https://doi.org/10.3390/w9100766
Chicago/Turabian StyleZhang, Menglin, Litang Hu, Lili Yao, and Wenjie Yin. 2017. "Surrogate Models for Sub-Region Groundwater Management in the Beijing Plain, China" Water 9, no. 10: 766. https://doi.org/10.3390/w9100766
Note that from the first issue of 2016, this journal uses article numbers instead of page numbers. See further details here.