Article

Water Budget Analysis in Arid Regions, Application to the United Arab Emirates

by
Rocio Gonzalez
1,
Taha B. M. J. Ouarda
1,2,*,
Prashanth R. Marpu
1,
Mariam M. Allam
3,
Elfatih A. B. Eltahir
3 and
Simon Pearson
4
1
Institute Center for Water and Environment (iWATER), Masdar Institute of Science and Technology, P.O. Box 54224, Abu Dhabi, UAE
2
INRS-ETE, National Institute of Scientific Research, Quebec City, QC G1K9A9, Canada
3
Department of Civil and Environmental Engineering, Massachusetts Institute of Technology, Cambridge, MA 02139, USA
4
Environment Agency—Abu Dhabi, P.O. Box 45553, Abu Dhabi, UAE
*
Author to whom correspondence should be addressed.
Water 2016, 8(9), 415; https://doi.org/10.3390/w8090415
Submission received: 23 June 2016 / Revised: 29 August 2016 / Accepted: 8 September 2016 / Published: 21 September 2016

Abstract

:
Population growth and economic development have impacted the capacity of water resources to meet demands in a number of arid countries. This study focuses on the United Arab Emirates (UAE) where low rainfall, high rate of growth and agricultural development are resulting in a dramatic depletion of groundwater resources and an increased dependence on desalination. A water budget for the region was developed. It represents the variations in groundwater storage as a balance of total precipitation, desalinated water and evapotranspiration. The components of the water budget are obtained from ground observations, documented information, models and remote sensing data, using Gravity Recovery and Climate Experiment (GRACE) satellites to estimate changes in groundwater storage and Tropical Rainfall Measuring Mission (TRMM) satellites and Global Land Data Assimilation System (GLDAS) data to obtain precipitation and soil moisture respectively. Results show a negative trend of 0.5 cm/year in groundwater levels corresponding to an average decrease of 0.86 km3/year during the study period (2003 to 2012). This negative trend indicates that the aquifers are not being recharged fast enough to compensate for human withdrawals. Most of the precipitation was found to be lost through evapotranspiration. A discussion of the current water budget components is presented and propositions are made for a sustainable use of water resources in the UAE, including a more efficient use of recycled water. This analysis is applicable to other Gulf countries and it can help to determine the optimal allocation of water resources to optimize agricultural productivity.

1. Introduction

Water scarcity in arid regions like the Middle East represents a serious issue. Understanding and predicting the possible impacts of climate change, economic development, population growth and land management is crucial to find the appropriate adaptation strategies to achieve water security in these regions [1].
Gulf Cooperation Council (GCC) countries, located in one of the most water-scarce areas, have undergone significant demographic and economic growth in the last 50 years thanks to the emergence of the oil industry. The combination of these factors has dramatically contributed to increasing the pressure on the region’s water resources, challenging governments to find more efficient ways to supply water and manage natural resources that can aid in sustainable development and improved water security [2]. Groundwater is being depleted dramatically in some of these areas, compromising future water supplies in several countries [3]. Despite this fact, very few studies have been conducted in the region to assess water resources. Voss et al. [4] revealed a decreasing trend in the water storage in the north-central Middle East using Gravity Recovery and Climate Experiment (GRACE) satellite data, groundwater depletion being the major contribution to this. On the other hand, human withdrawals have been identified as an important factor in groundwater depletion in some of these areas [5].
This study is focused on the United Arab Emirates (UAE; Figure 1), where current conditions of population growth and rapid economic development are resulting in a dramatic depletion of its groundwater resources and a high dependence on desalination [6]. These factors, in combination with the development of agriculture are the main drivers of water demand in the UAE. Currently, the water supply is obtained from three different sources: groundwater, desalinated water and recycled water. Groundwater accounts for 51% of the total supplies and is mostly used for irrigation purposes (agriculture, forestry, and landscaping). Desalinated water represents 37% of the total water supply, and is mainly used for domestic consumption (96%). The remaining 12% is recycled water and is entirely used for landscaping irrigation [6].
In a country where groundwater is being heavily extracted and precipitation is scarce, it is not possible to rely on the natural recharge of the aquifers to sustainably meet the demand for water. Only 3% of the existing groundwater in the country is fresh, located in some areas in the south and in the region near the border with Oman. From the remaining 97% of the total groundwater available, 33% is slightly brackish (salinity range 1500–5000 ppm of TDS (total dissolved solids) that can be used selectively on a moderately restricted range of plants), 25% is brackish (salinity range 5001–10,000 ppm of TDS usable on a very restricted range of plants) and 39% is saline (above 10,000 ppm of TDS only usable via desalination) [6]. Most of this fresh and brackish groundwater is being used for irrigation, raising the question of the sustainability of agriculture based on the depletion of groundwater resources. Therefore, with 64% of the groundwater being brackish or saline, an increasing population, and with one of the highest water consumption rates per capita in the world (500 L/day according to the Federal Electricity and Water Authority (FEWA)), the UAE became strongly dependent on desalination. However, the main challenges of desalination are its high cost, its important contribution to greenhouse gases and other air pollutant emissions and the environmental impact of the brine in the Gulf marine ecosystems [7]. According to the water conservation strategy of the UAE Ministry of Environment and Water [6], the UAE has more than 70 desalination plants with a total desalination capacity of 1700 Mm3 per year. Most of these plants are distributed along the coast of the country or on islands to access seawater. However some of them are also located inland to access brackish groundwater. The production rate of desalinated water has been increasing since 1990 following a similar trend to electricity generation caused by the combined cycle plants used for electricity and water production. Due to the increase in population and to economic development, an increase in desalinated water production of 93% has been observed between 2003 and 2008, two thirds of the total amount of water produced being in the Emirate of Abu Dhabi [6].
Long term planning of water related activities requires a good understanding of the various components of the water budget. However, data access is severely limited in some areas of the country and observational data is not always available. Therefore, developing a water budget becomes challenging. In these cases, remote sensing is a particularly useful technique to estimate some of the components of the water balance.
Groundwater storage change is estimated using the measurements of terrestrial water storage provided by Gravity Recovery and Climate Experiment (GRACE) satellites. GRACE has been widely used to estimate water storage and there has been a special interest in determining its resolution and accuracy. A substantial number of studies have aimed to address the problem for a long time [8,9,10,11,12,13,14,15], analyzing and comparing GRACE measurements with different models and observations. Conclusions to date indicate that resolution depends on the size of the region, performing well on areas ≥200,000 km2, and on the magnitude of the variations in the storage that need to be of at least a few millimeters [9,10]. More recently, new algorithms and post-processing methods have been developed. Landerer and Swenson [16], provided gridded fields of scaled GRACE measurements and errors allowing hydrologists to easily estimate the associated uncertainty depending on the size of the study region. These scaled measurements and gridded errors have been used in the current study.
Additionally, a number of studies have been conducted using the water budget and remote sensing data to estimate different hydrologic components. Rodell et al. [17], used the water budget to compare the results of evapotranspiration obtained using GRACE data for the terrestrial water storage with the results using two other land-surface models. They concluded that evapotranspiration with GRACE compares favorably with the results from the other two methods. Yeh et al. [18], Yeh et al. [19], and Rodell et al. [20], also applied this method with reasonable success over Illinois and the Mississippi river basin using in situ observations, GRACE and Global Land Data Assimilation System (GLDAS) data to estimate the different components of the water budget. GRACE data in combination with GLDAS and ground observations, has also been useful to detect and quantify major droughts in Brazil [21] demonstrating that large-scale extreme droughts can be detected by GRACE.
A water budget approach was also used in [22] in combination with GLDAS to calculate the water storage change in the Upper Reach of the Yellow River. These results have been compared with GRACE data showing similarities in the long term trend and seasonal peaks, but more differences in the inter-annual variations. Crowley et al. [23], combined GRACE and precipitation data sets to explore the relative contributions of the source term to the seasonal hydrological balance within the Congo Basin. On the other hand, a number of studies which focused on analyzing the balance of the water budget, reported difficulties to close the budget equation due to uncertainties in the variables. Wang et al. [24] compared the monthly total water storage change obtained from GRACE and from the water budget equation for 16 drainage basins in Canada. A monthly water imbalance of 5.4 mm/month to 21 mm/month was found. Uncertainties in all variables of the water budget equation seemed to contribute to this imbalance, especially precipitation [24,25]. A similar study was conducted in Sheffield et al. [26] comparing the remote sensing data of the water budget variables with observations and models, and on the other hand, the streamflow obtained from the water budget equation and ground measurements. The results showed a water imbalance where the total uncertainty of the streamflow was larger than the measured values.
The objectives of this study are to establish a water budget for the UAE and analyze each component of the water budget and their interactions. Due to the lack of extraction data in the region, special focus will be put on estimating the groundwater storage which helps to assess the impacts of groundwater extractions and irrigation practices.

2. Materials and Methods
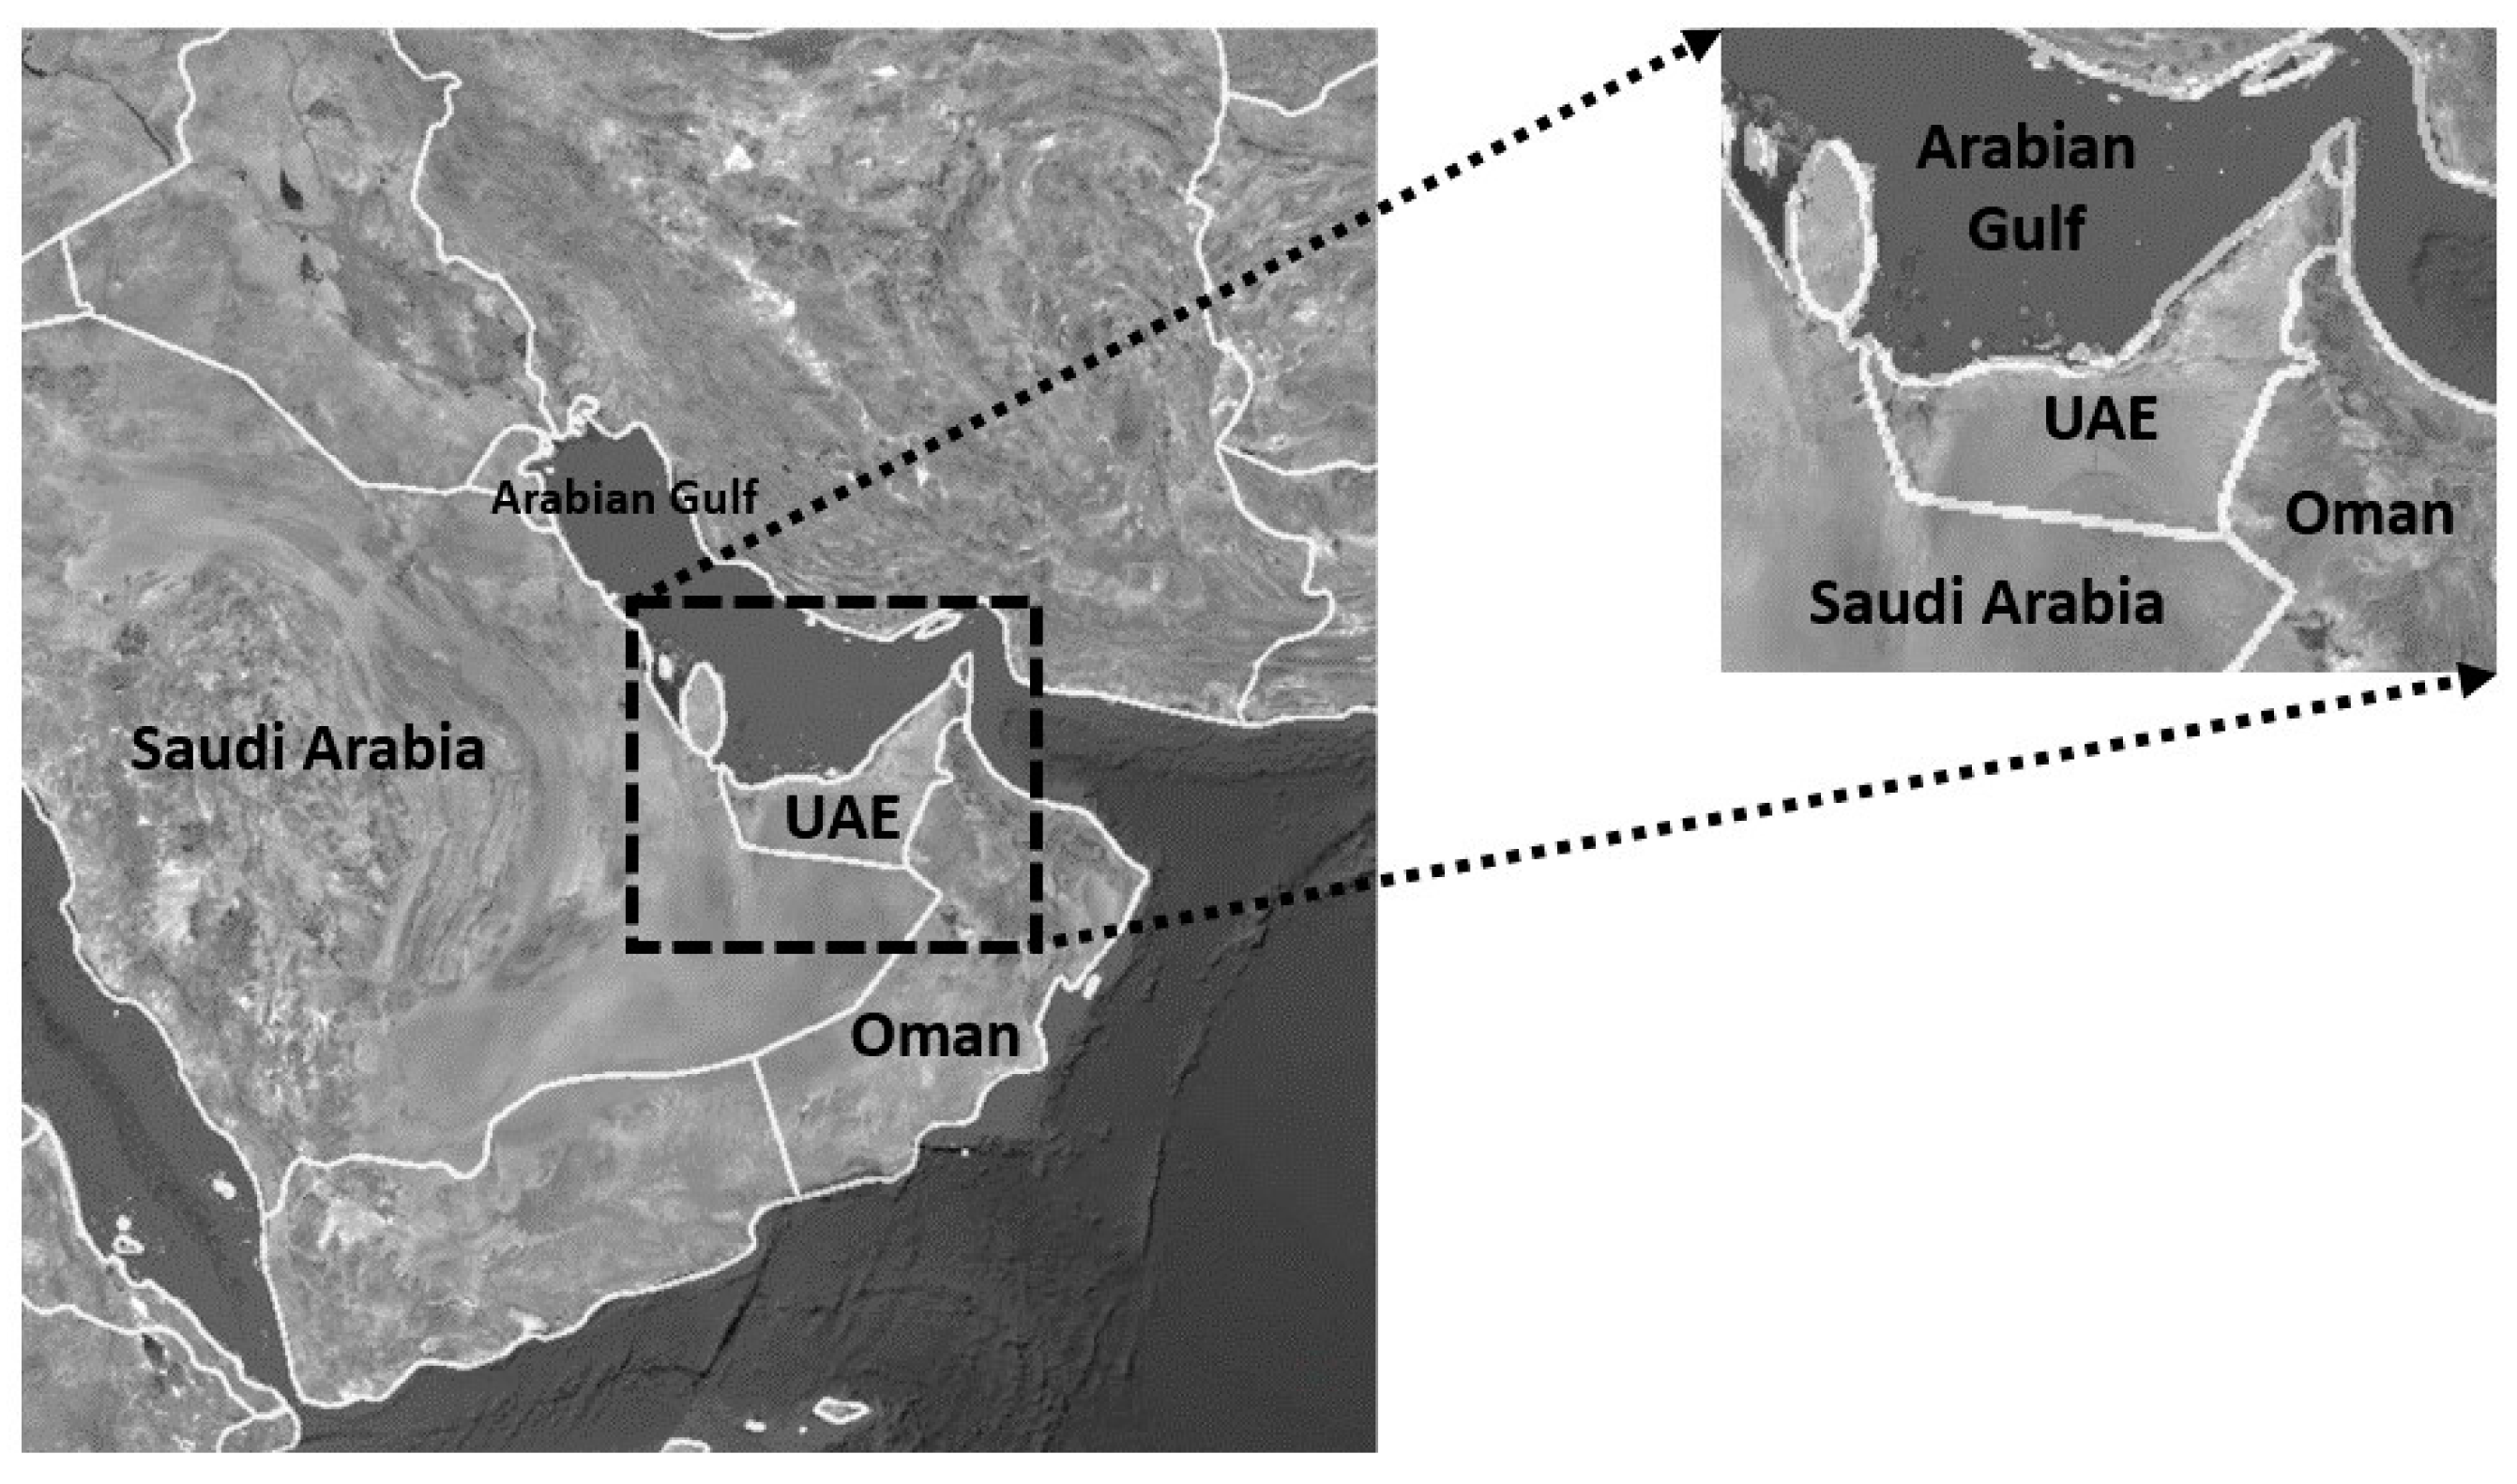
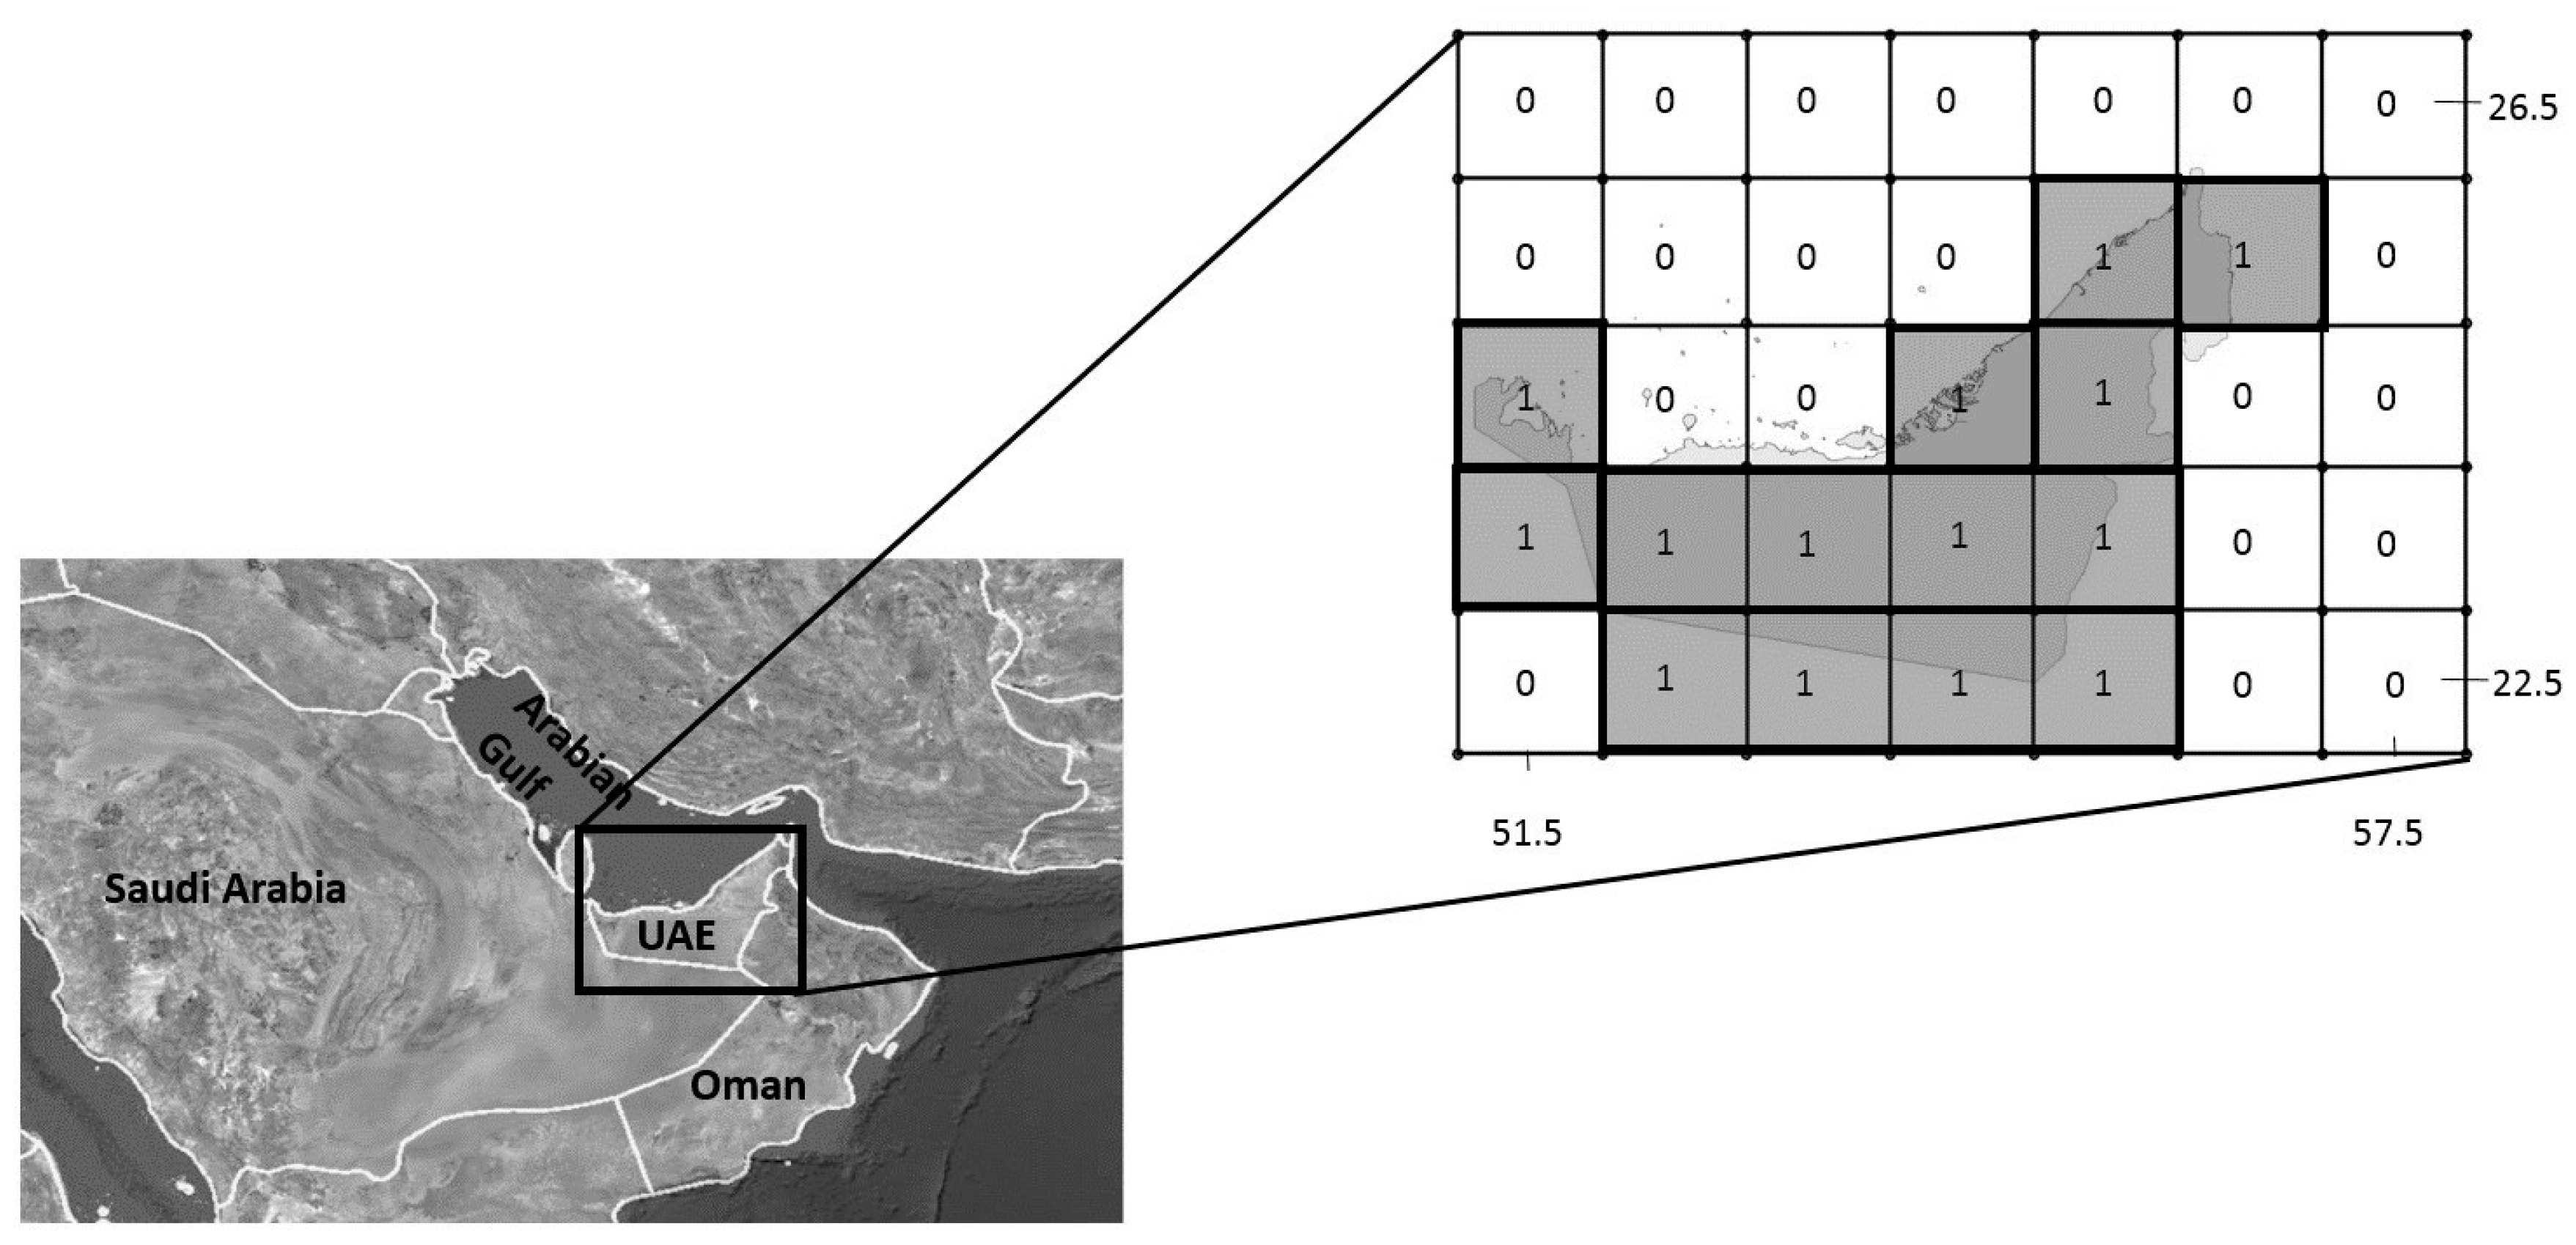
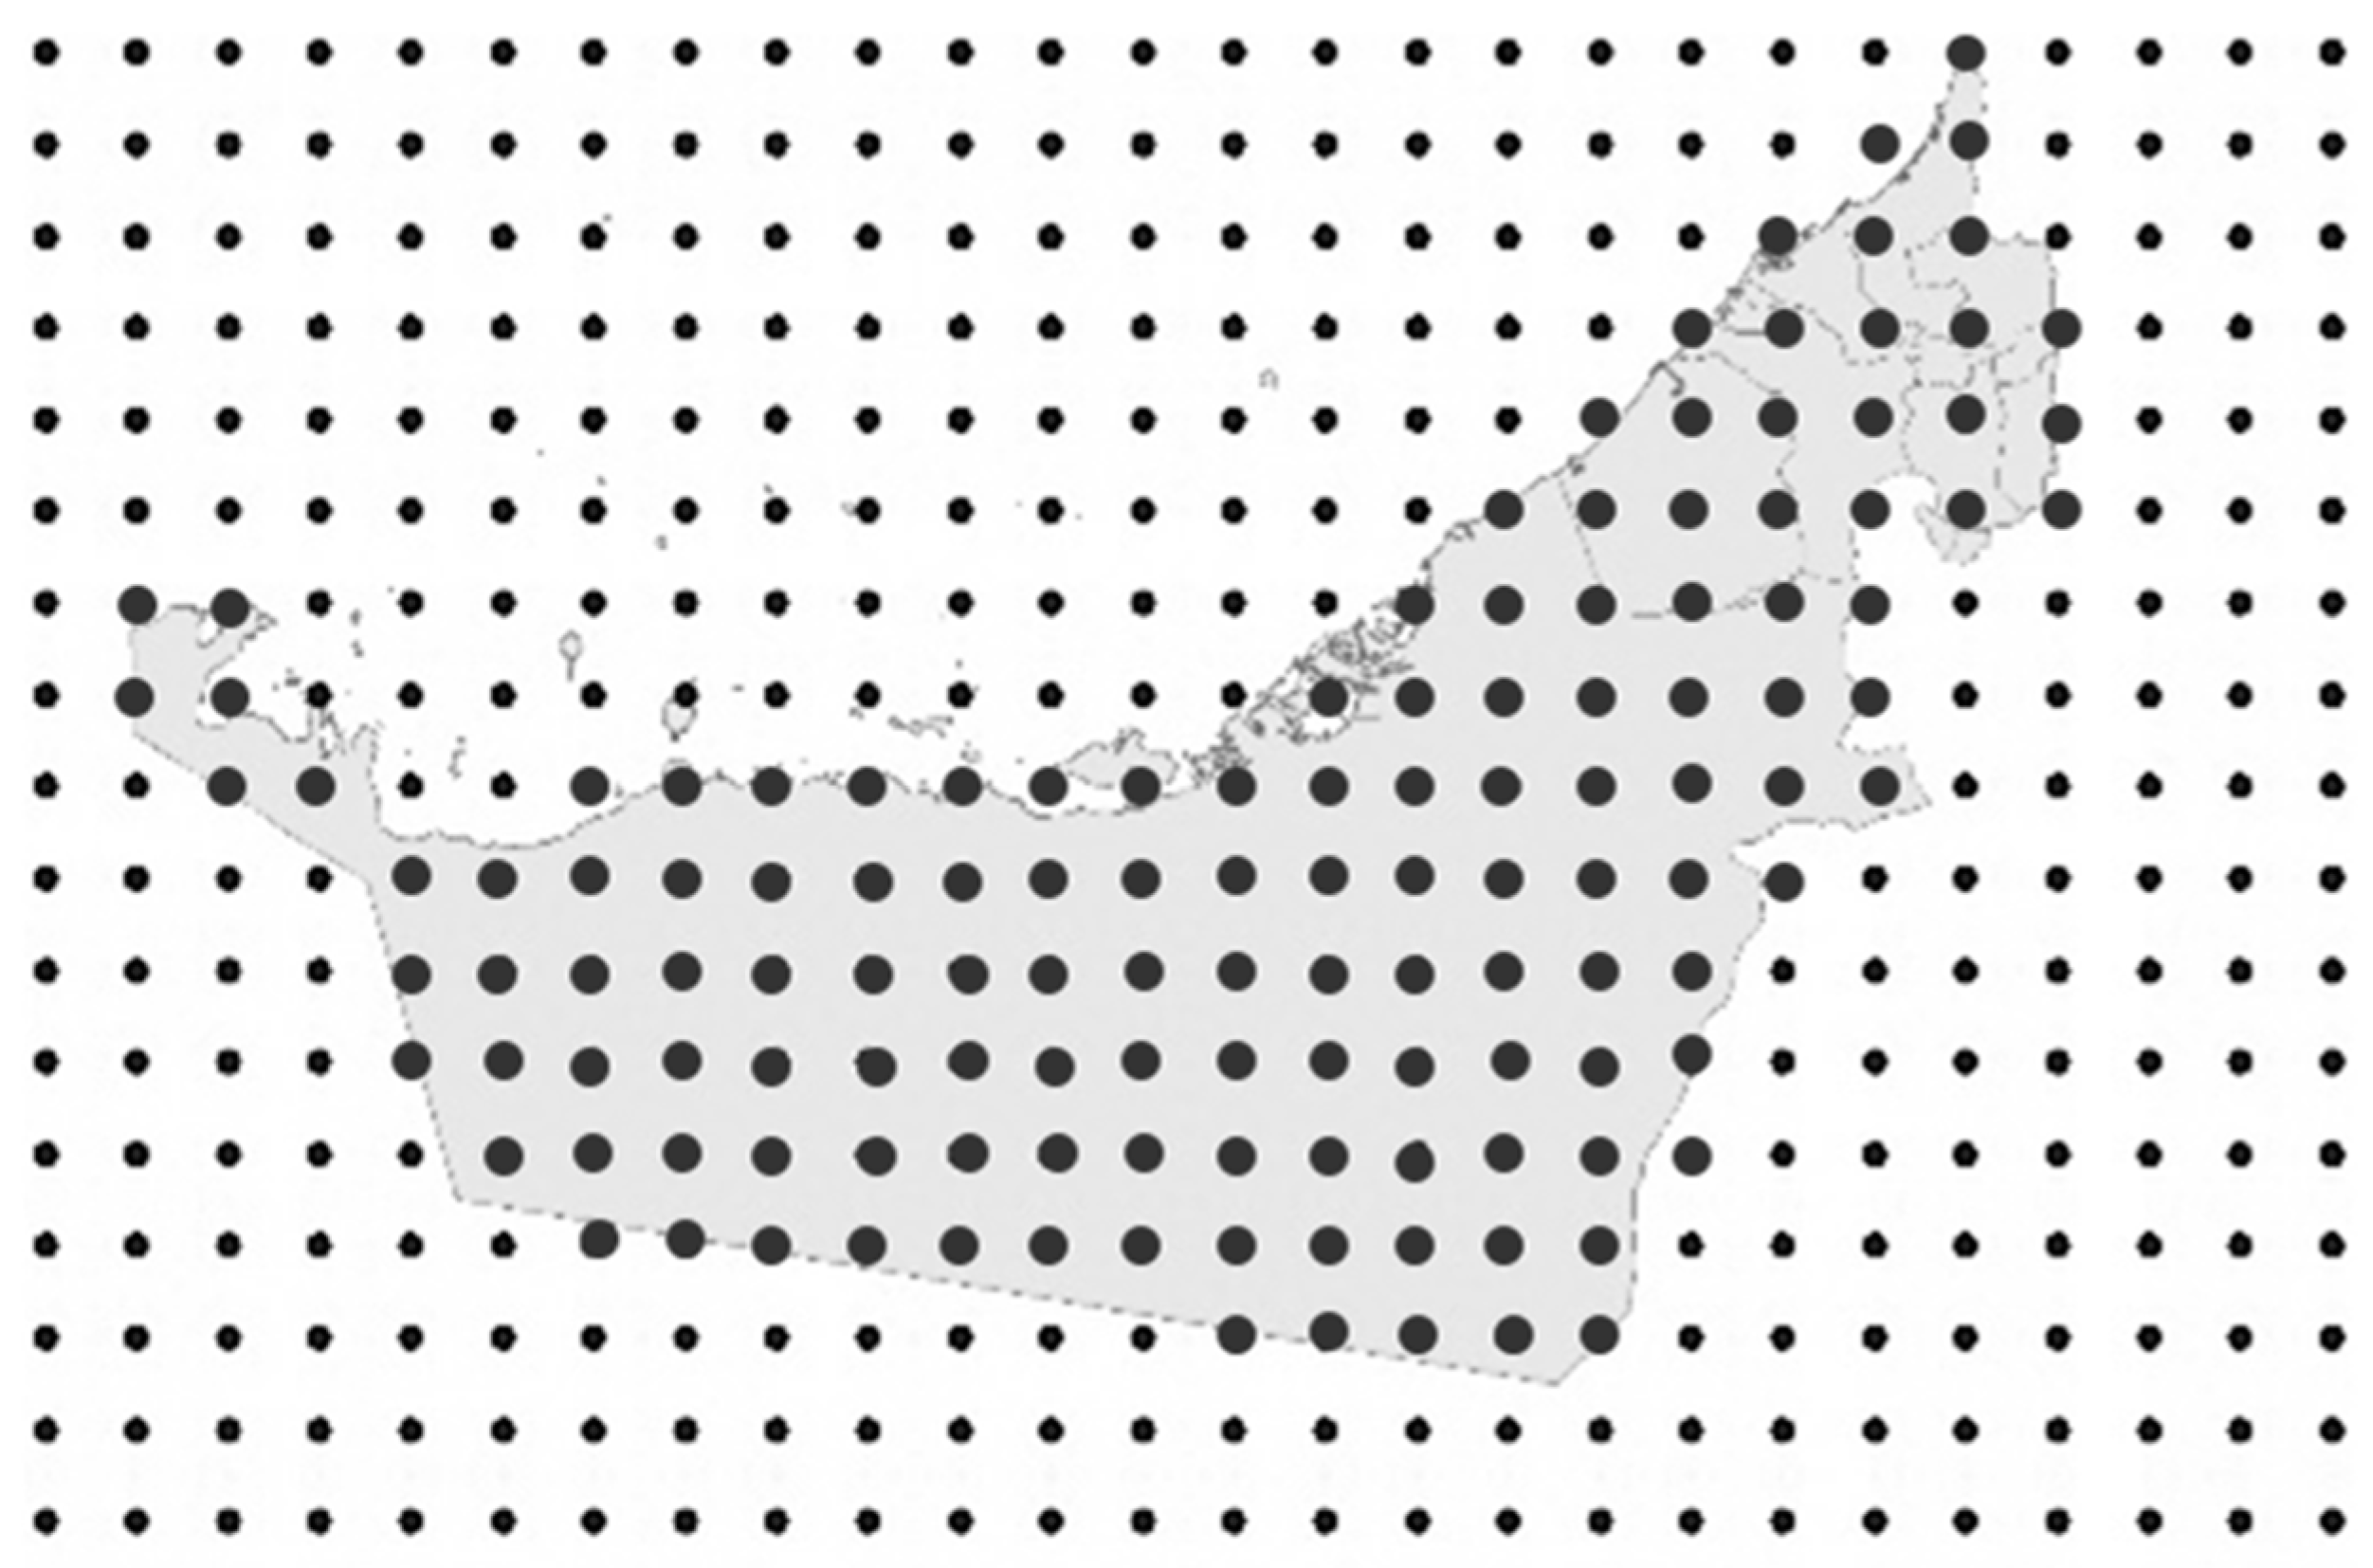
2.1. Study Region

The study region covers the area of the UAE located between 51°30′00′′ E to 57°30′00′′ E and 22°30′00′′ N to 26°30′00′′ N (Figure 1). Masks were applied to the data to cover only the land part of the country resulting in a total area of 172,494 km2. The UAE is located in the eastern corner of the Arabian Peninsula surrounded by the Arabian Gulf in the north, the dessert of Saudi Arabia in the south and the mountains on the border with Oman in the East.
The climate in the UAE is arid, characterized by low rainfall (mean annual rainfall of 78 mm) and very high temperatures especially during the summer. The coastal temperature reaches 46° with 100% humidity during the summer while during the winter the temperature ranges between 14° and 23°. The climate of the interior regions is more extreme with temperatures reaching 50° during the summer and 4° during the winter [27].
Arid and semiarid climates are characterized by a strongly intermittent hydrologic regime. The high variability in precipitation and temperature over the UAE in relation to large-scale forcings were studied by [28,29,30]. Ouarda et al. [31], studied the historic evolution of the rainfall in the UAE, finding an overall decreasing trend in the annual and monthly time series. A good understanding for how precipitation will evolve in the future is important in the development of sustainable water resources management plans in the country. Ghouse et al. [32], performed a forecasting study of the evolution of temperature and precipitation in the next 30 years. The predictions indicated a significant increase in temperature and an overall decrease in precipitation patterns over the UAE.

2.2. Methodology

The lack of a well-structured groundwater monitoring network in the UAE requires the use of other techniques to assess the evolution of groundwater resources. The same applies to precipitation, where only a few ground stations, not uniformly distributed, are available for rainfall measurements. Satellite based measurements provide means to estimate variables that would be difficult to obtain by other methods such as direct observations.
A water budget approach integrating remote sensing data, models and observational data is useful to study the interactions of the different water components in the UAE. The first step in this process is to determine groundwater variations obtained from the total water change. Groundwater and soil moisture are the main contributors to the water storage in the UAE. Therefore, to estimate groundwater variations, the soil moisture contribution should be subtracted, as in:
∆GW = ∆Sw − ∆SM
where GW represents groundwater, Sw water storage and SM soil moisture. The increments (∆) represent the difference between the measurements of two consecutive months.
The water storage term is estimated using GRACE satellite data which provides measurements of the water thickness as a result of changes in Earth’s gravity field [33]. However, in countries with significant extractions of oil like the UAE, this contribution should be subtracted from GRACE measurements to retain the contribution of changes in water only from the gravity field.
A slightly different approach that serves the study objectives better has been selected to substitute Equation (1). The terms of this equation will be expressed as anomalies of the different components instead of increments. These anomalies are calculated as the deviations for each month relative to a baseline average over January 2004 to December 2009 to be uniform with how GRACE data is provided. All variables are spatially averaged over the area of the UAE.
Therefore, from Equation (1) expressed as anomalies (*):
GW* = TWS − So* − SM*
where GW represents groundwater storage, TWS is the terrestrial water storage obtained from GRACE, So is the oil-water equivalent extractions from observational data and SM is the soil moisture obtained from GLDAS-NOAH (Global Land Data Assimilation System—National Centers for Environmental Prediction/Oregon State University/Air Force/Hydrologic Research Lab). The term TWS − So* represents the water storage anomalies from GRACE after removing the oil contribution.
After estimating the groundwater component, the second step focuses on the water budget equation itself. All water inputs are introduced in the equation and the evapotranspiration is estimated from it. The water budget equation is expressed as:
P + D − ET = ∆Sw
where P is precipitation derived from Tropical Rainfall Measuring Mission (TRMM) data, D is desalinated water obtained from observational data, ET is evapotranspiration and ∆Sw is the increment of water storage.
All main wadis in the UAE are dammed. The objectives of these dams are to protect against floods and harvest precipitation to assist the recharge of groundwater [34]. The number of dams in the year 2005 was 114 with a total capacity of 114 million m3 [35], and in 2015 the number of dams was 130 with a total capacity of 120 million m3 [36]. Surface runoff and groundwater flow have not been considered in the water budget equation since cross-border surface runoff and groundwater flow with Oman are marginal, while they are null with Saudi Arabia [6].
The increment of water storage (∆Sw) is the difference between two consecutive months and is expressed as:
∆Sw = TWSC − ∆So
All terms in Equation (4) are expressed as the difference between measurements of two consecutive months; TWSC (terrestrial water storage change from GRACE) between two TWS measurements and ∆So (increment in oil-water equivalent) between two oil-water equivalent measurements.

2.3. Data

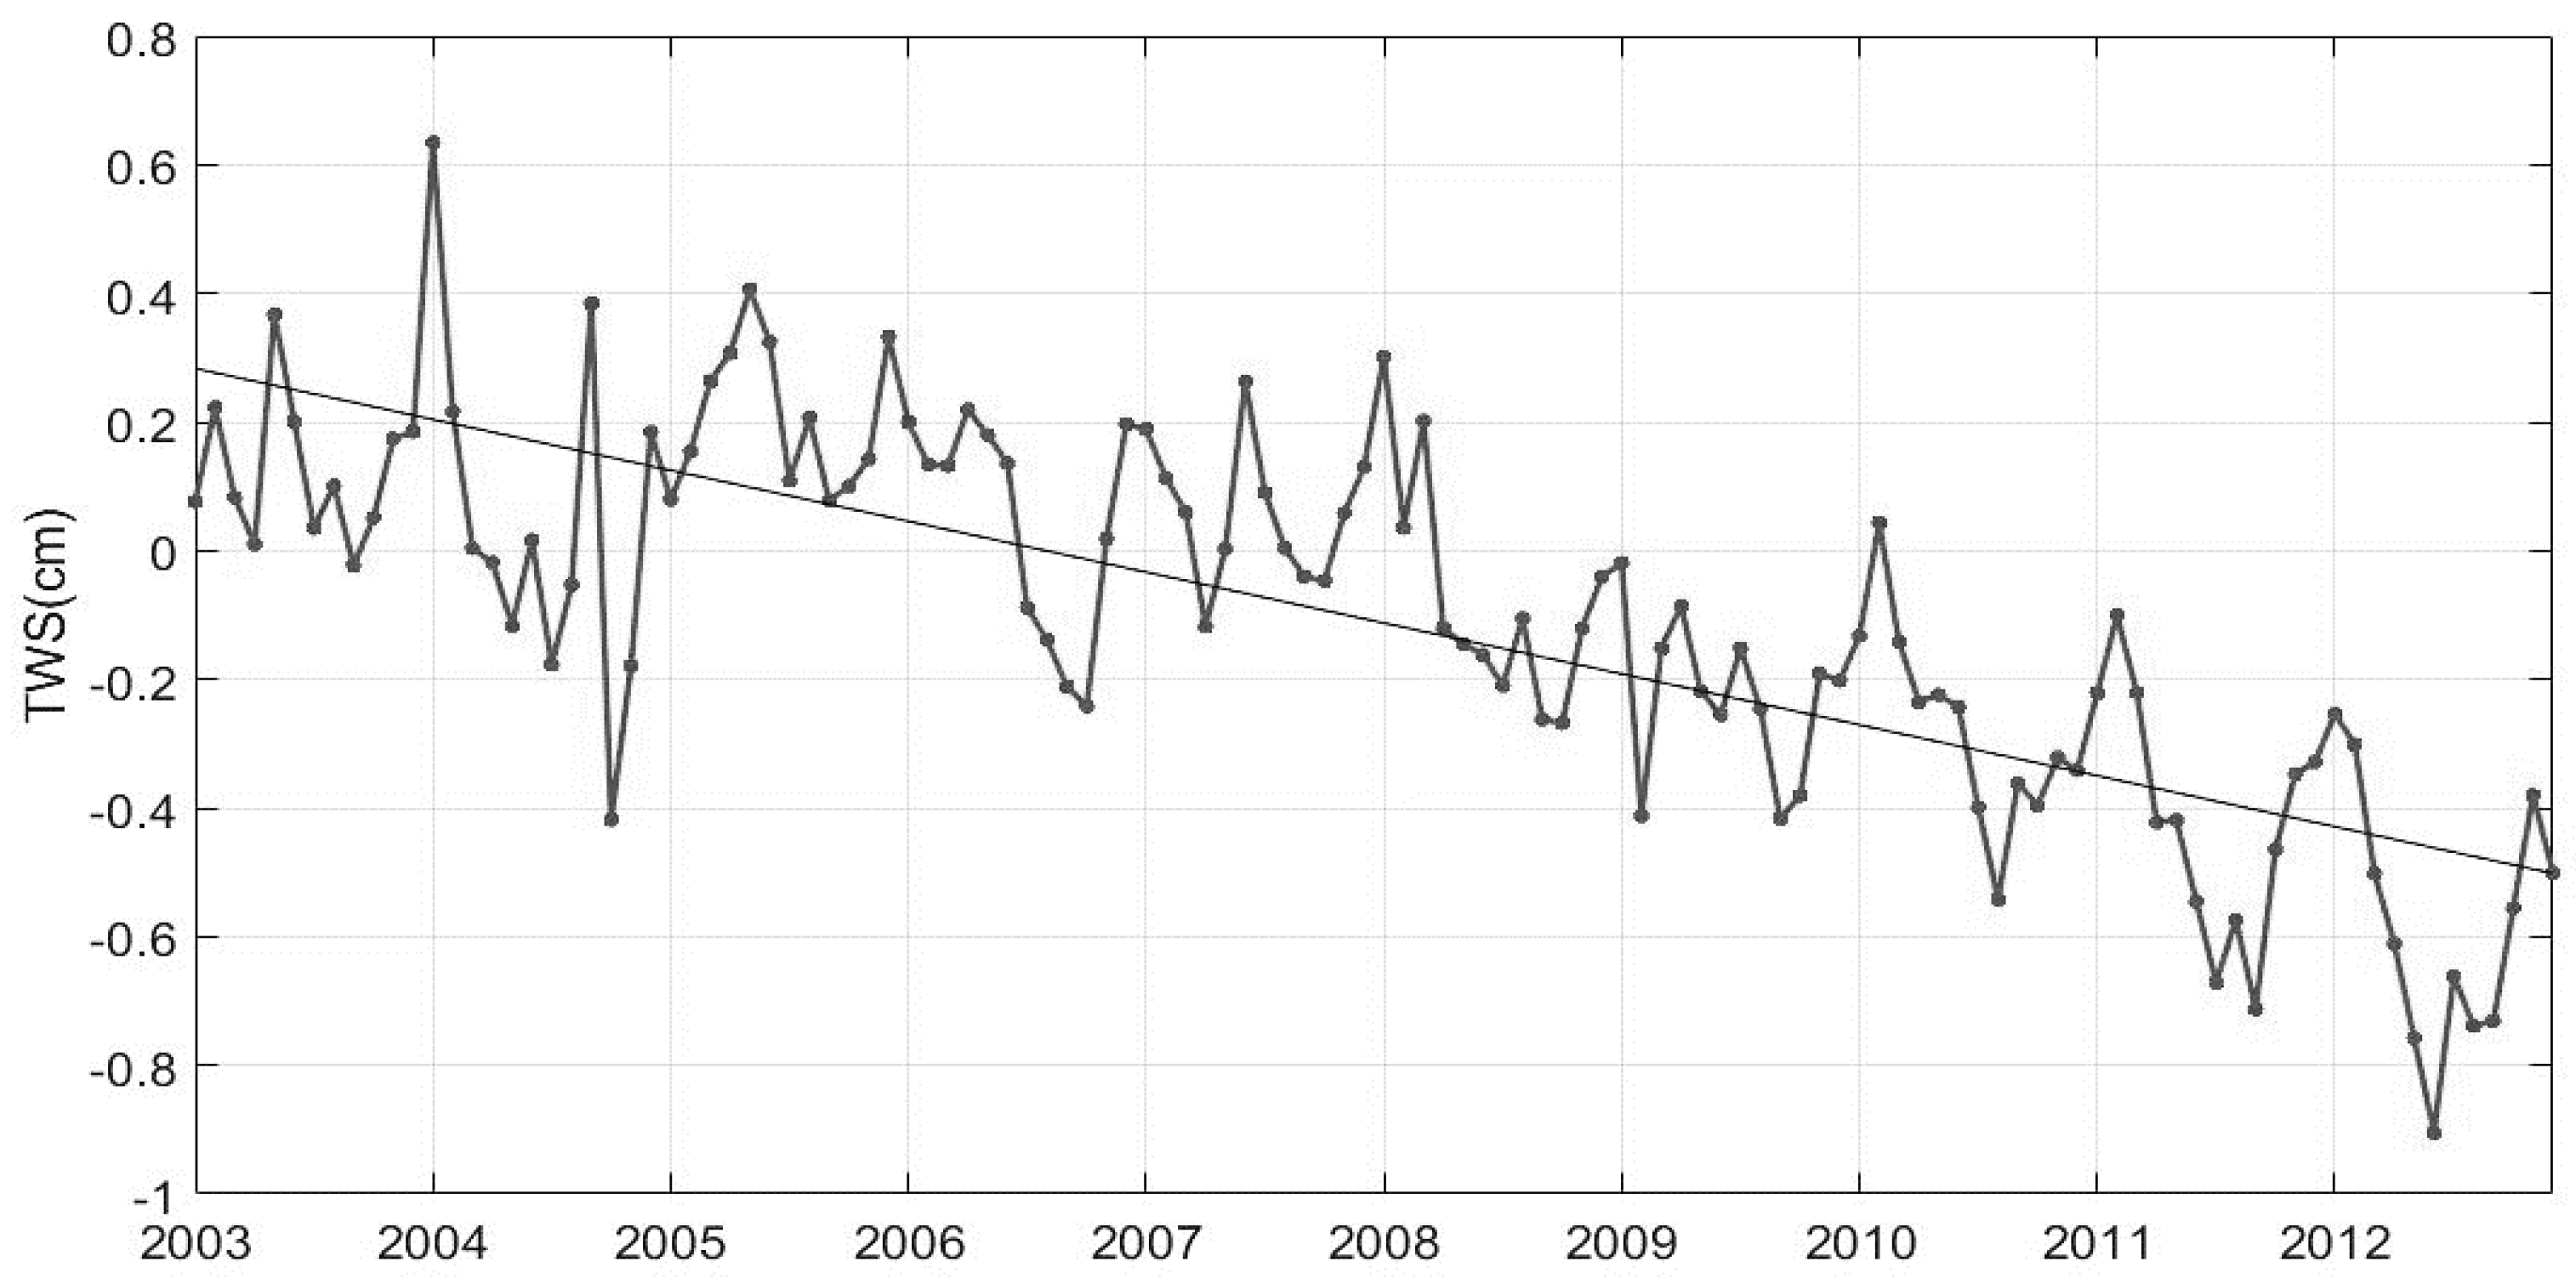
2.3.1. Terrestrial Water Storage

The Gravity Recovery and Climate Experiment (GRACE) satellites were launched in March 2002 as a result of the collaboration between the US National Aeronautics and Space Administration (NASA) and the German Aerospace Center (Deutsches Zentrum für Luft und Raumfahrt, DLR). The mission consists of two twin satellites following identical circular polar orbits around the Earth of 500 km of altitude and a separation of 220 km between them. The variations in the earth’s gravity field, caused by the different distribution of mass on the earth’s surface, induce small perturbations in the distance between both satellites. These perturbations are measured using a GPS and a microwave sensing system providing spatial-temporal Earth’s gravity field maps. Earth’s mass variations, reflected as changes in the gravity field, are mainly caused by changes in water [37]. However, as mentioned before, in cases where oil extractions are significant, this effect should also be taken into account in the interpretations of GRACE gravity measurements.
GRACE data is processed by three different centers, the Geoforschungs Zentrum Potsdam (GFZ), the Center for Space Research at University of Texas (CSR) and the Jet Propulsion Laboratory (JPL) providing three different products to the final users (Jet Propulsion Laboratory, 2014b). The three solutions are very similar and the difference lies within the errors of GRACE. However, in this study, the mean of the three solutions has been used based on a previous study [38] that showed that the mean reduces the noise of the signals significantly.
Different data levels are provided by GRACE processing centers. In this study, the data used (GRACETellus (RL05.DSTvSCS1409) for GFZ and CSR; (RL05.DSTvSCS1411) for JPL [39]) is level 3 data that provides monthly measurements of equivalent water height (“TWS”) in a gridded format of 1° × 1° from 2002 to 2014. GRACE data does not provide absolute values but the deviations for each month relative to a time-mean baseline over January 2004 to December 2009 [40].
GRACE observations require a post-processing [16,41]. Atmospheric and oceanic effects are first removed from the satellite signal and a filtering process is applied subsequently to obtain the final values of TWS. This filtering process improves the signal degradation produced by the measurement errors and noise. However, these filters also affect the signal itself producing a signal loss and leakage errors. Two filters were applied to the GRACE data in this study [16]. The first one is a Gaussian averaging filter applied to minimize the random errors related to the increasing spectral degrees of the spherical harmonics in the signal. This filter produces a smoothening effect but reduces the spatial resolution of GRACE measurements. The second filter applied is designed to remove the systematic errors produced by correlations between certain spherical harmonics [41]. The attenuation and leakage produced by the filters is quantified by comparing with a synthetic TWS dataset extracted from GLDAS NOAH after applying both filters. With these inputs, gain factors are calculated and applied to the gridded TWS to restore part of the signal lost and decrease the leakage error [16,40]. The gain factors (or scale factors) are expressed as a 1° × 1° grid of coefficients that will be multiplied by the TWS grid to obtain the true TWS values. These scale factors are provided along with GRACE level 3 data.
A 1° × 1° mask was applied to cover only the area of interest resulting in a grid of 14 pixels of 1° × 1° (Figure 2).

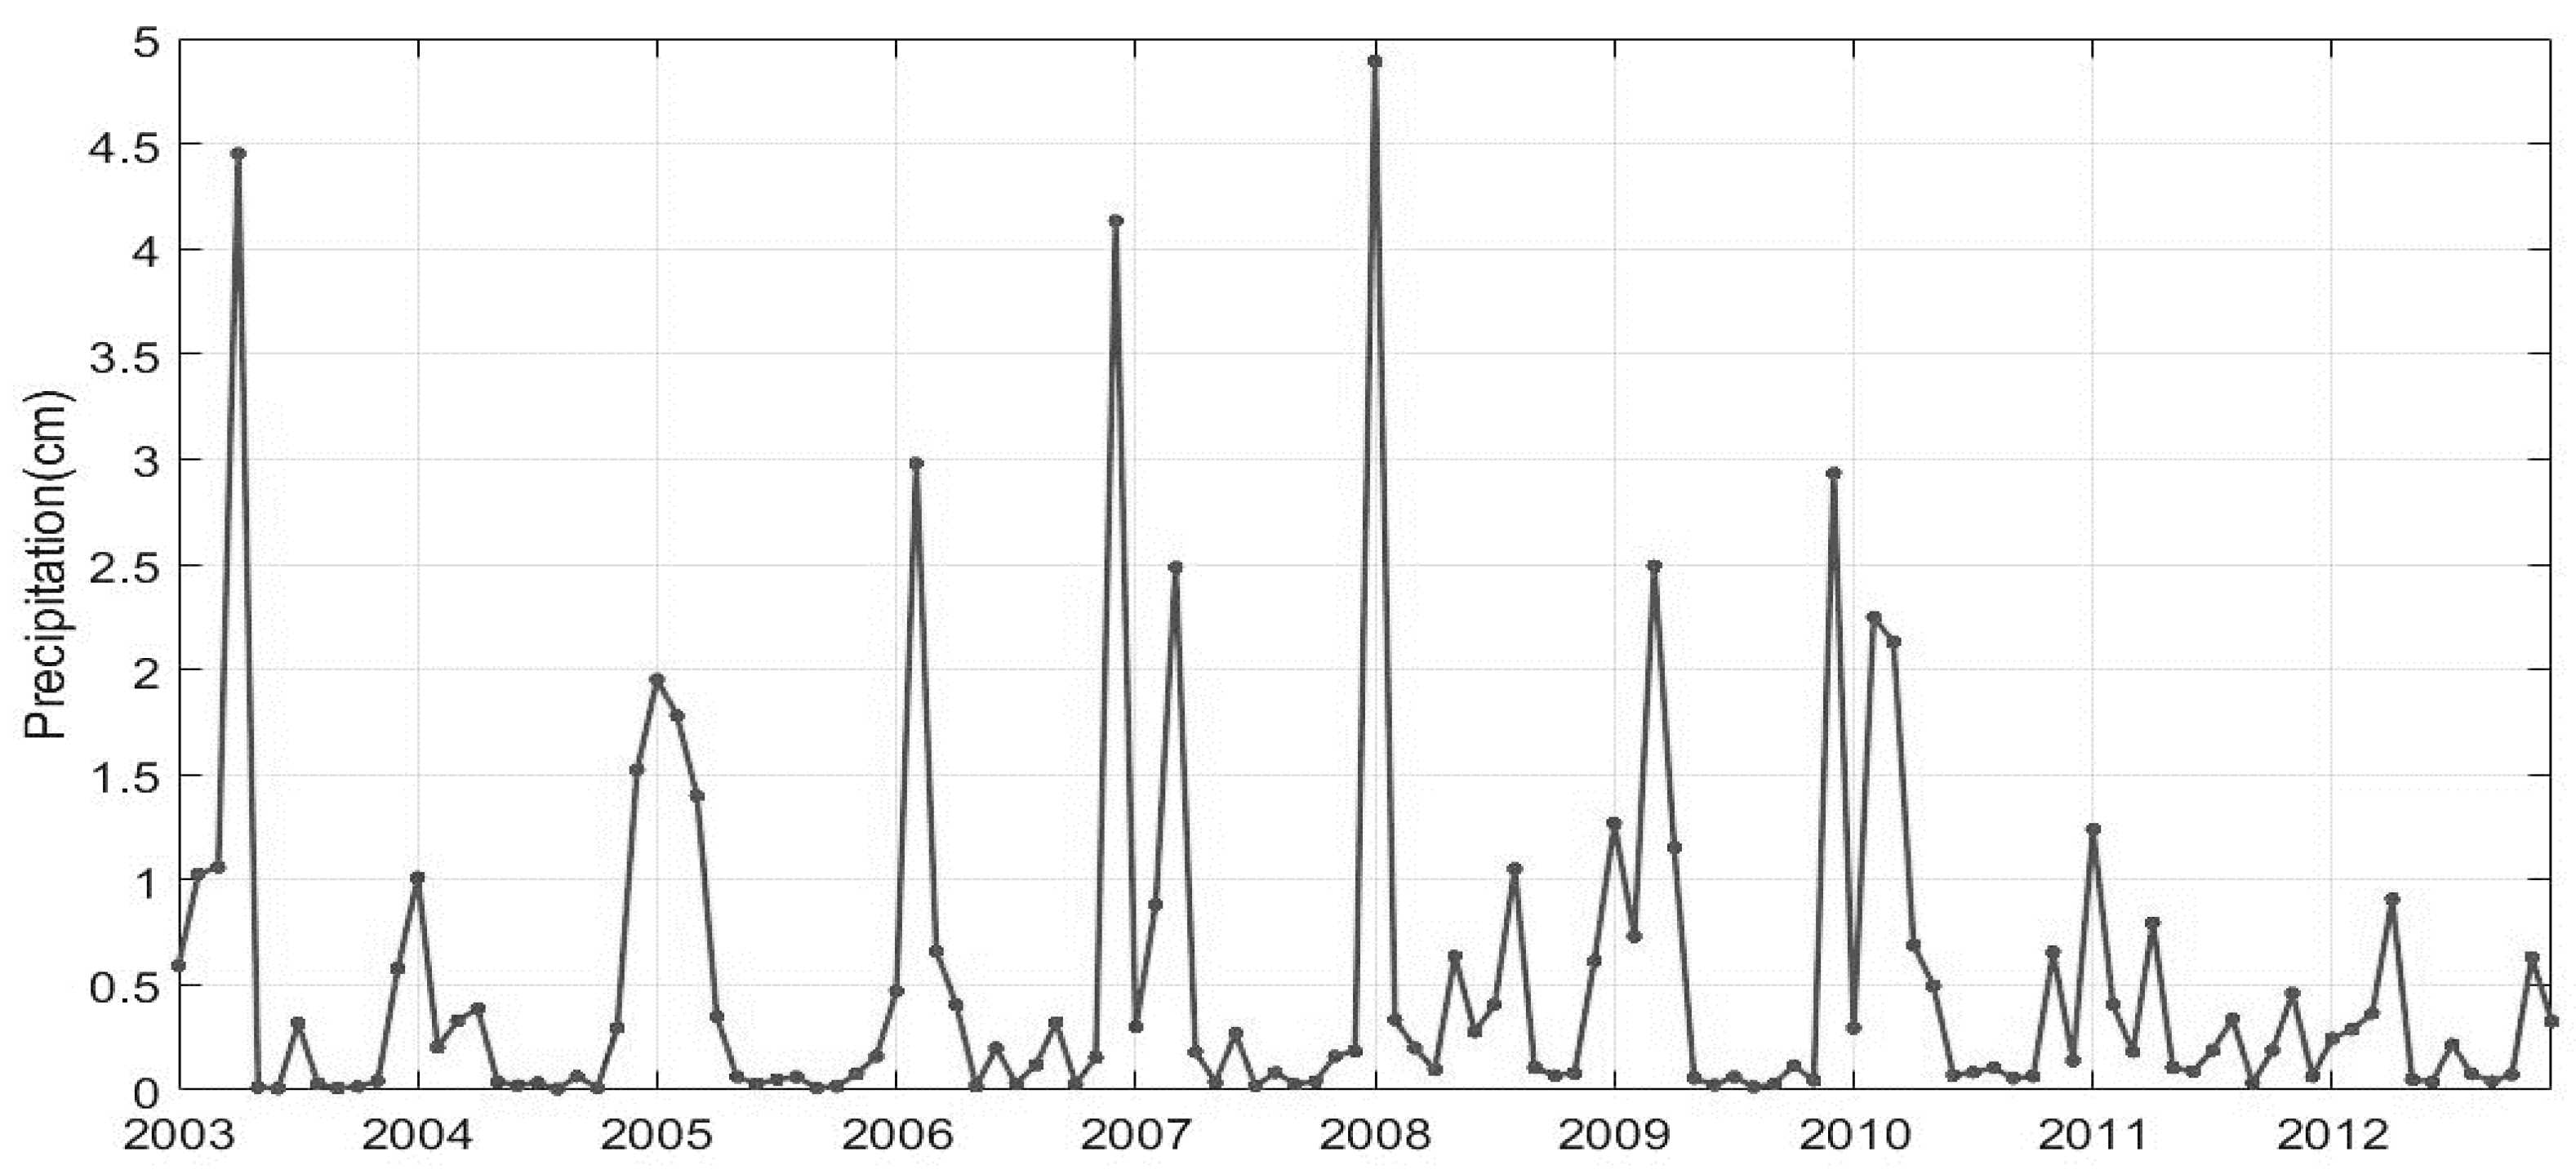
2.3.2. Precipitation

Due to the lack of a dense network of meteorological stations in the UAE (information is available for only six stations located in the northern part of the country), the Tropical Rainfall Measuring Mission (TRMM) was selected for precipitation data. TRMM is a joint space mission between NASA and the Japan Aerospace Exploration Agency (JAXA) designed to monitor and study tropical rainfall [42].
TRMM has been widely and successfully used to obtain precipitation measurements and missing values in gauged locations. Gu et al. [43] compared TRMM rainfall estimates with precipitation gauge observations in the Yangtze River basin showing good agreement at daily and monthly time scales reflecting also the seasonal variability over the river basin. A similar comparison study has been performed in Collischonn et al. [44] proving the suitability of TRMM data to identify damaged rain gauges or as a good alternative to interpolation of gauge data.
The data used in this study is the 3B42 derived dataset from version 7 of TRMM [45] that provides daily values of rainfall from January 1998 to August 2013 with a near-global (50° S–50° N) coverage and a spatial resolution of 0.25° × 0.25°. A 0.25° × 0.25° mask was added, as it was done with GRACE data, to cover the area of interest only (Figure 3).

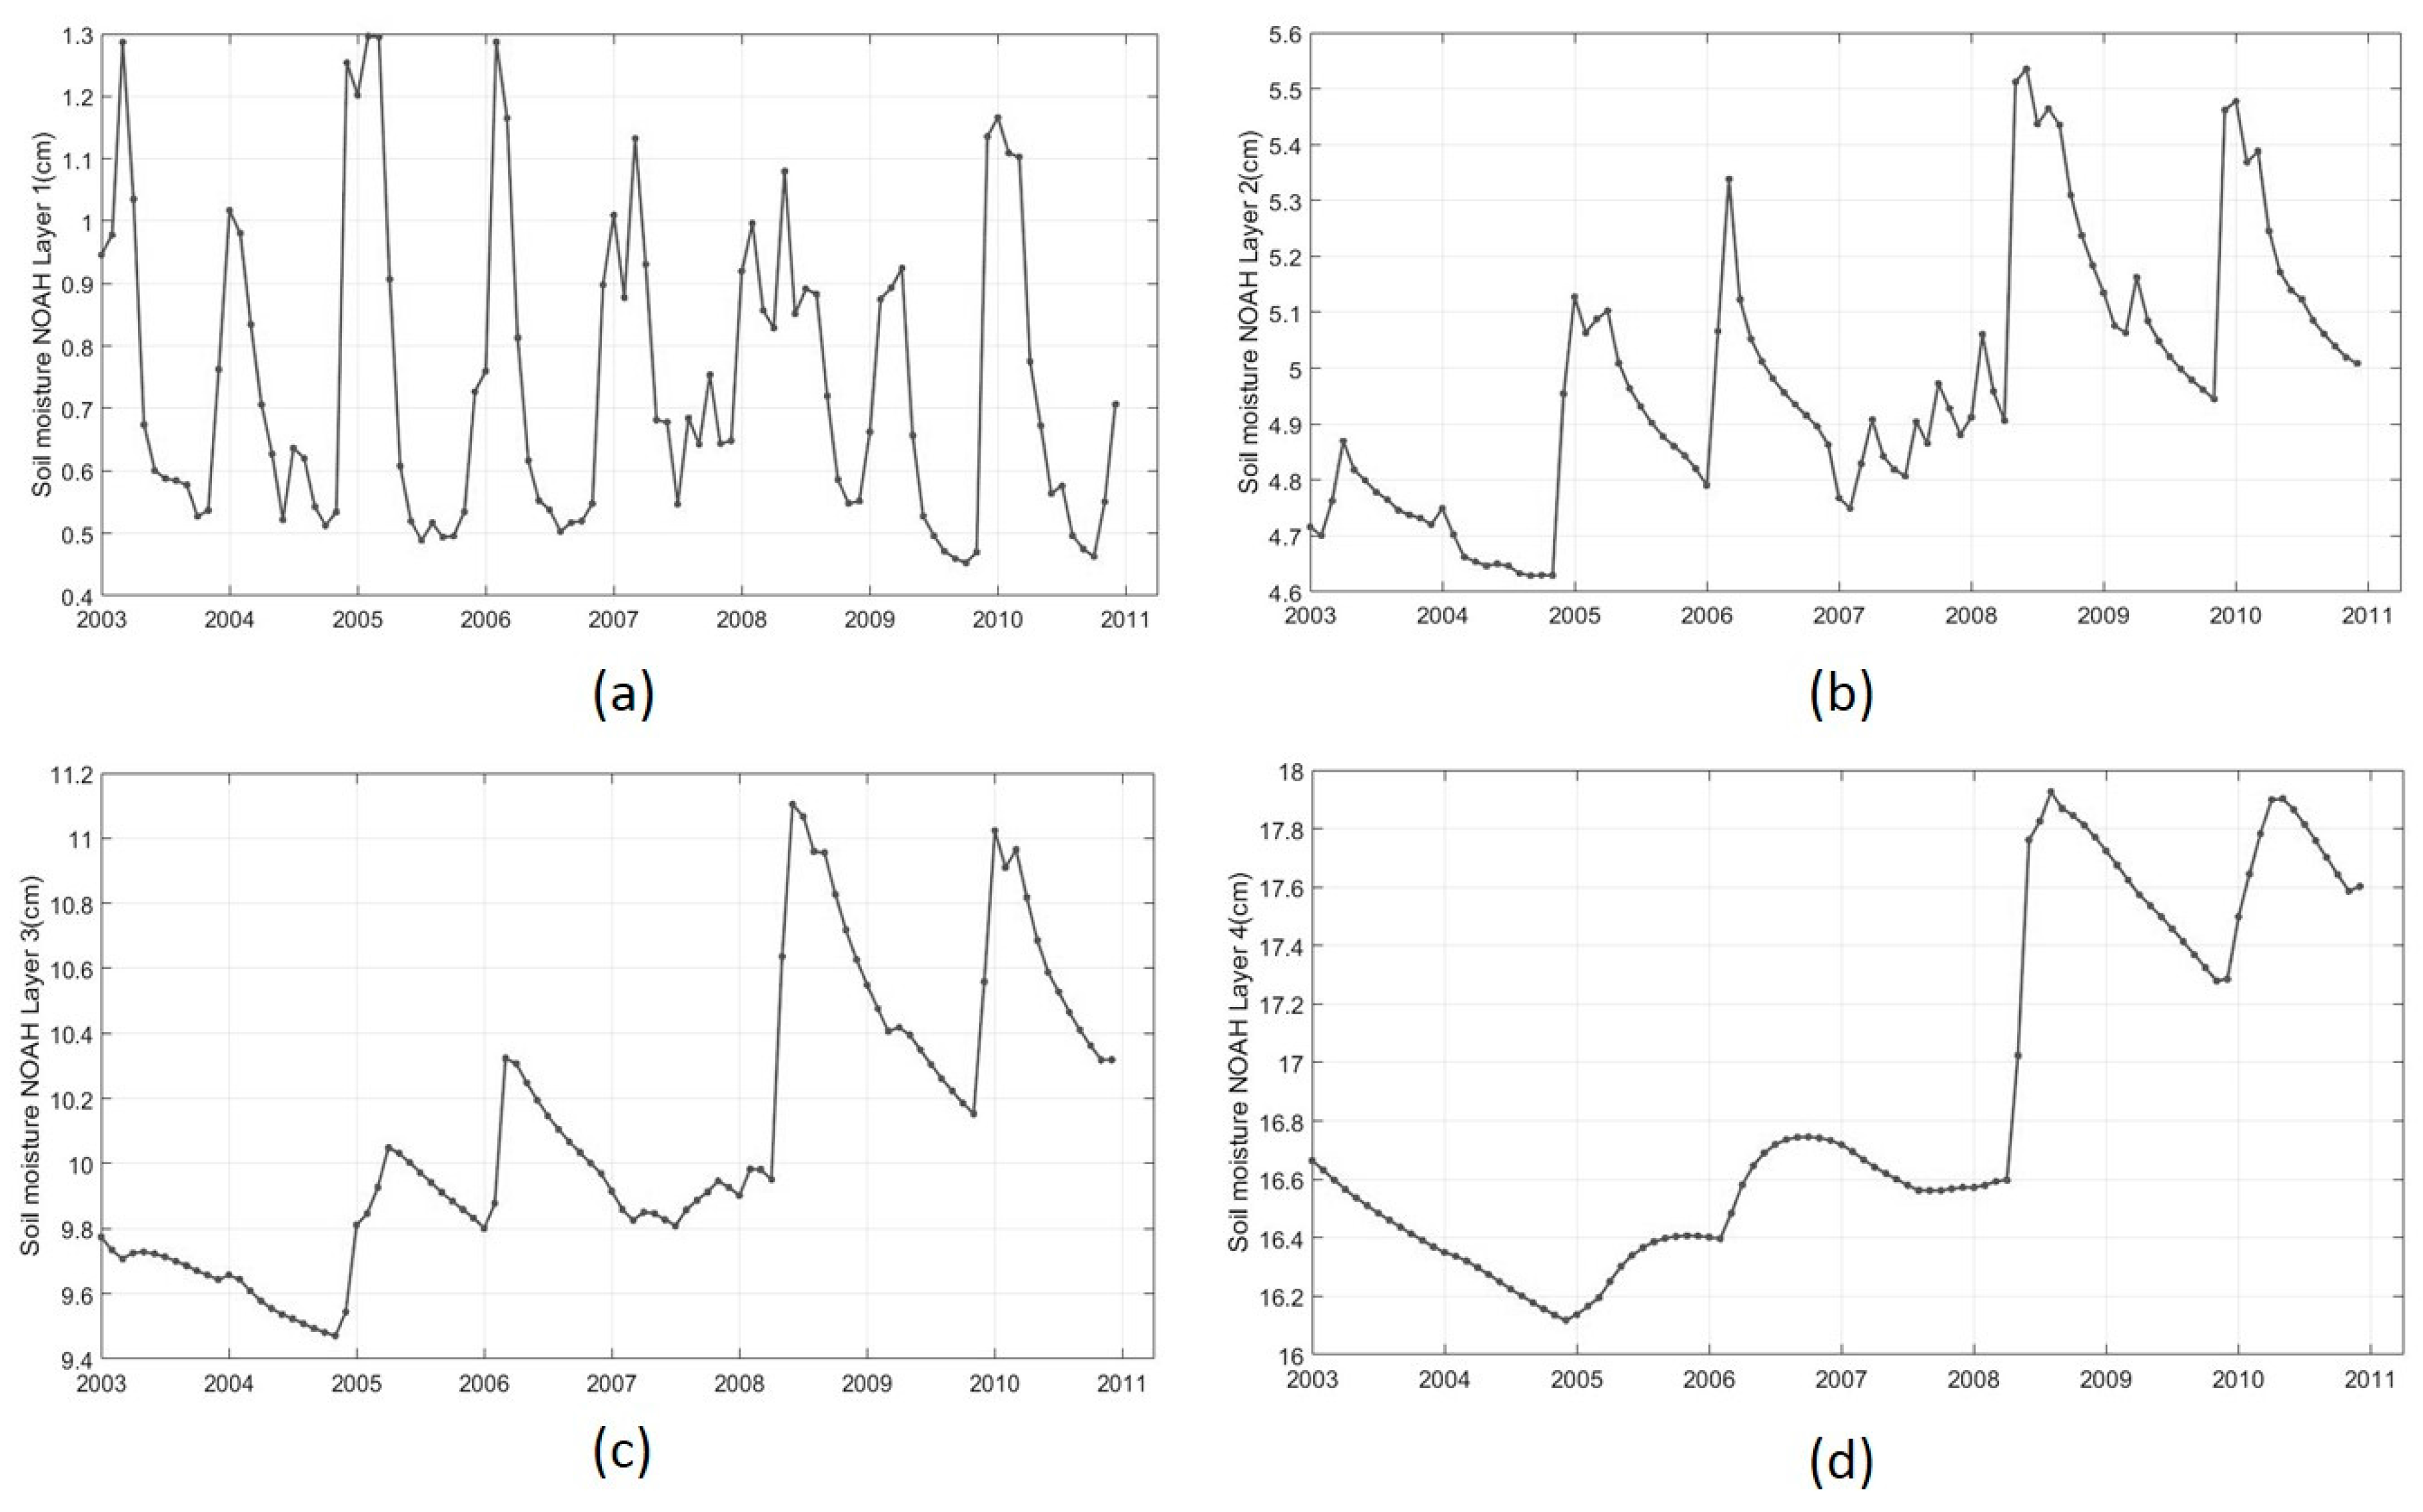
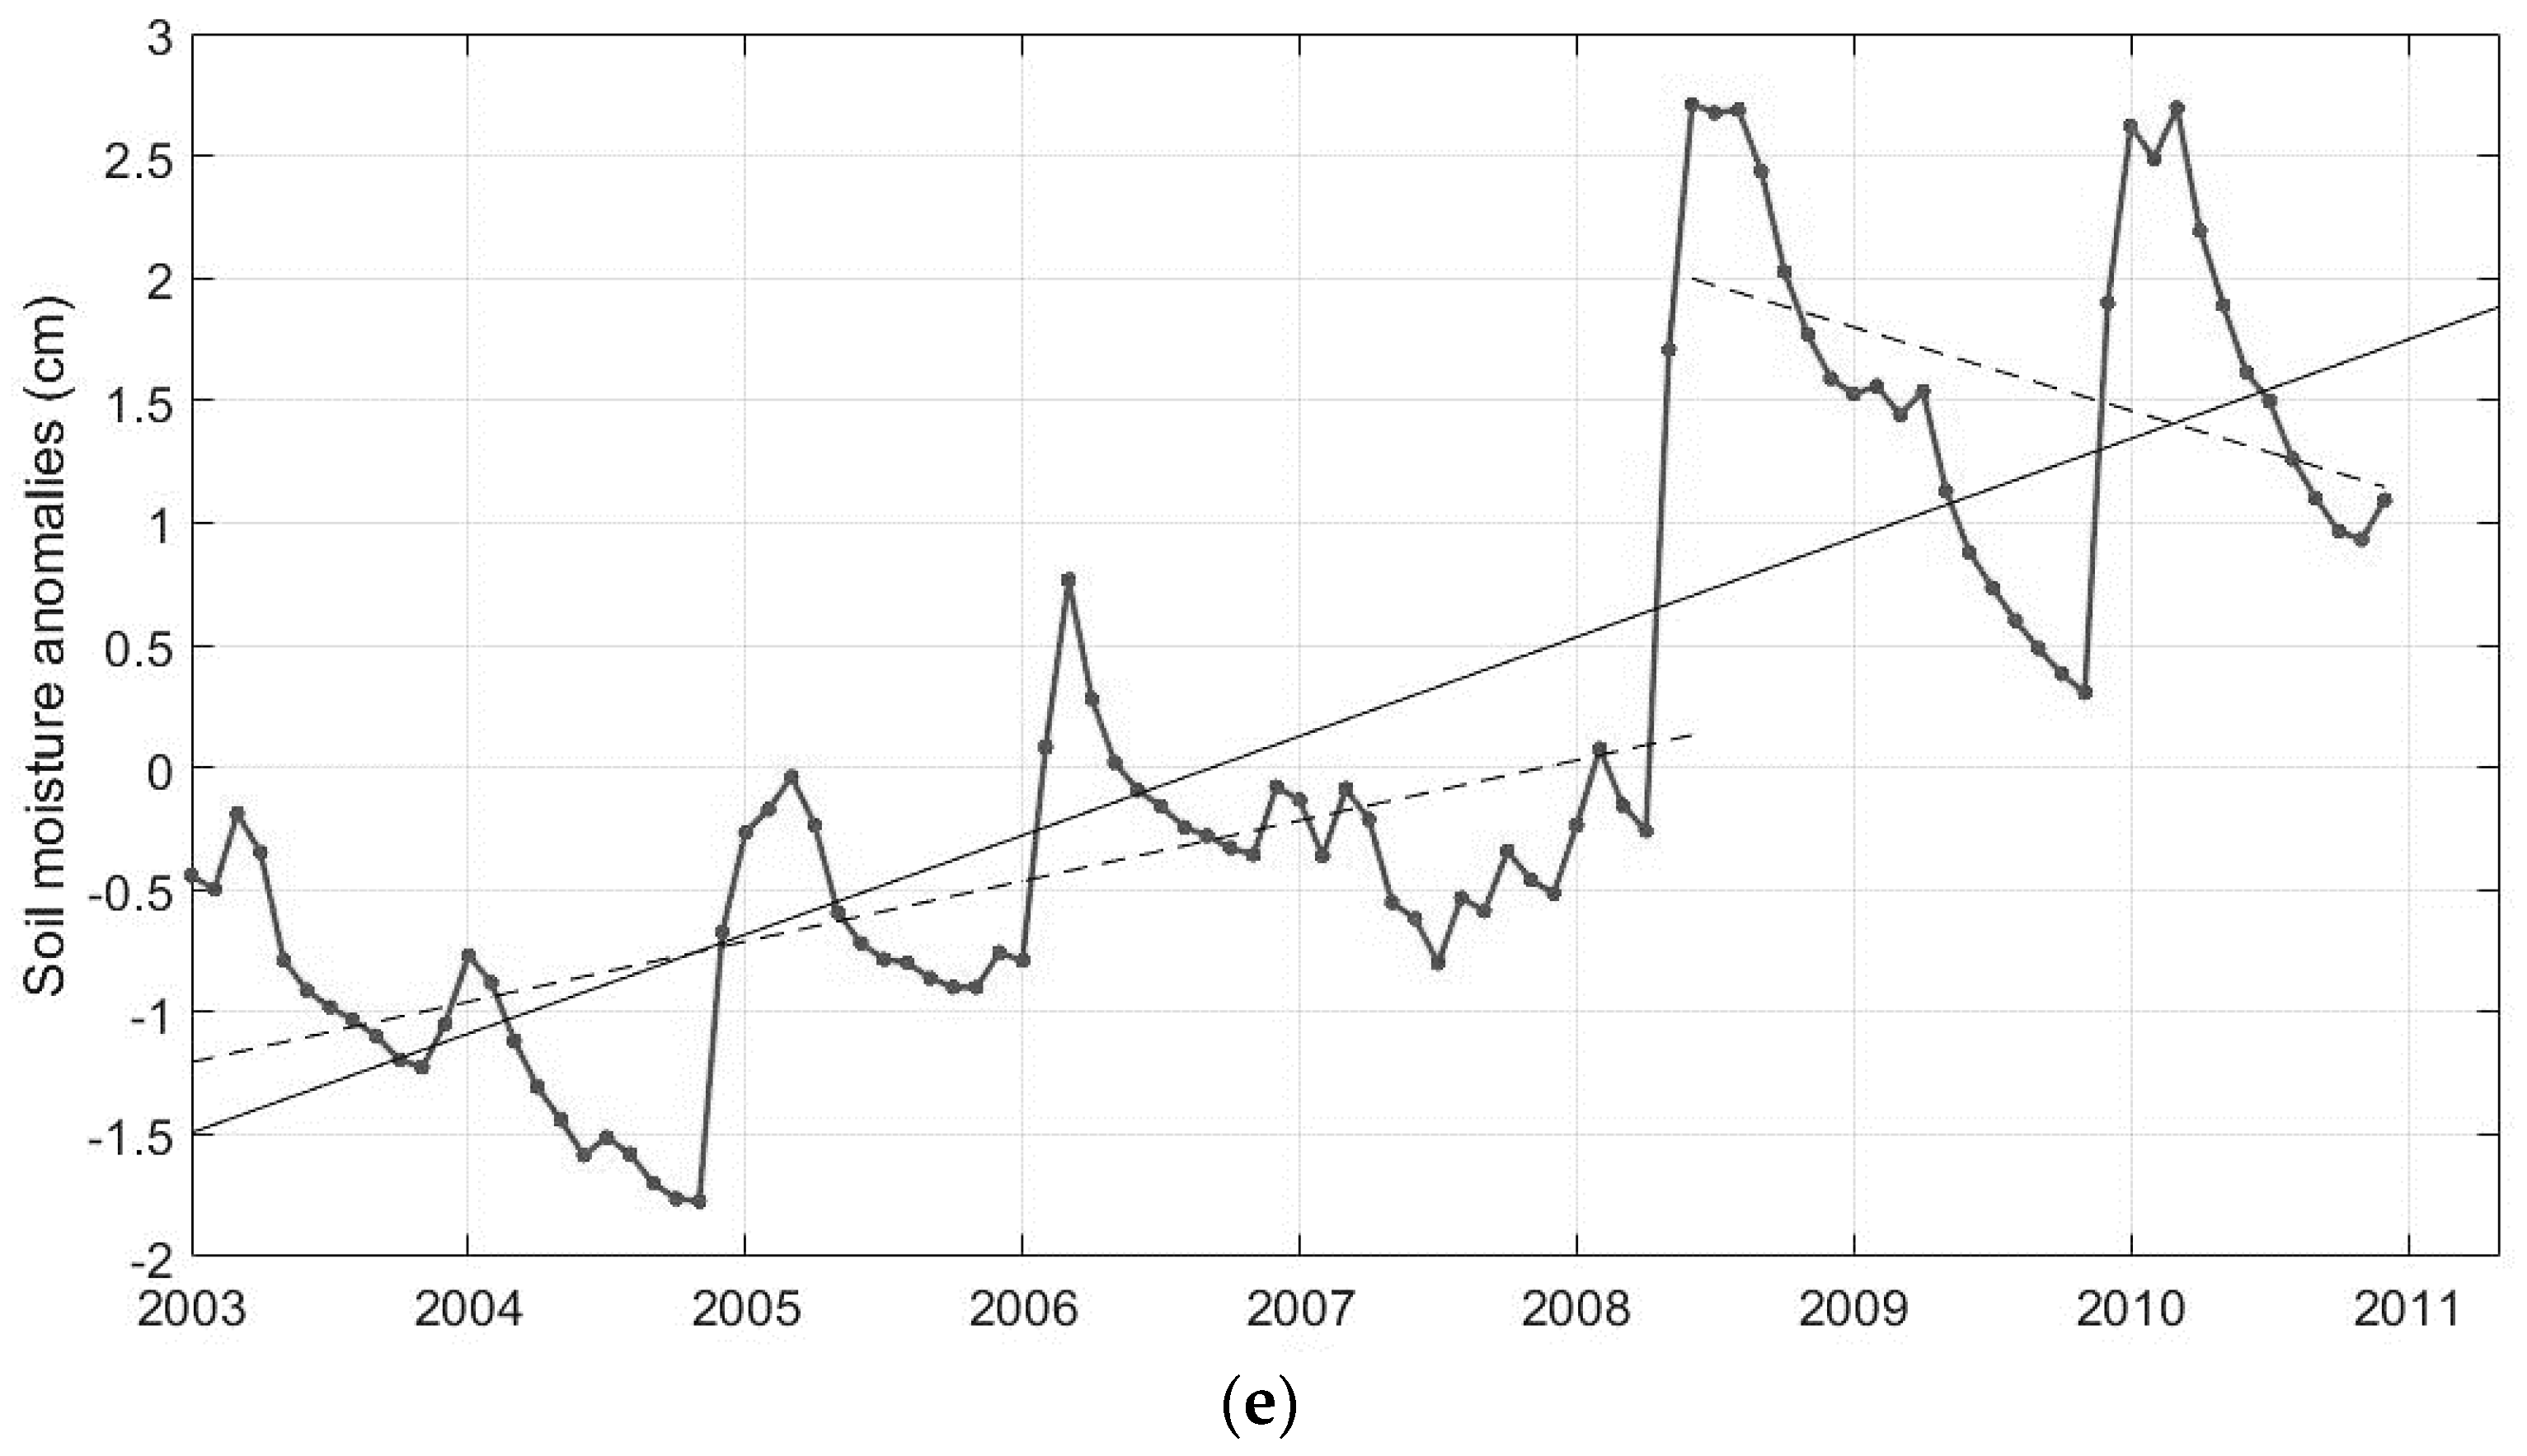
2.3.3. Soil Moisture

Global Land Data Assimilation System (GLDAS) is a global, offline and high resolution terrestrial modeling system that integrates observation based data from different sources to produce optimal fields of land surface states and fluxes in real time. GLDAS has been developed jointly by NASA and the National Oceanic and Atmospheric Administration (NOAA) and it uses a new generation of ground based and satellite observations to constrain the land surface states obtained by different models. Observations can be very accurate in discrete points but they have disadvantages such as instrument failures, measurement interruptions, spatial resolution etc. On the other hand, models present limits due to oversimplifications or not correct representation of some mechanisms of the real world. However, they integrate all the knowledge existing of physical processes and are able to perform as many calculations as necessary. Data assimilation combines measurements with models maximizing the spatial and temporal resolution and improving the consistency and accuracy [46].
During the last 20 years, several land surface models have been developed. Currently, GLDAS drives four models: Community Land Model (CLM), Mosaic, Noah and Variable Infiltration Capacity model (VIC). The forcing data set used in the models combines multiple data sets from January 1979 to the present; these include atmospheric forcing and land surface datasets from many different sources [47]. GLDAS executes globally at 1° and 0.25° spatial resolutions and 3-hourly temporal resolution. However, monthly products are also available from temporal averages of the 3-hourly products [48]. The same mask as the one applied to GRACE data is applied to GLDAS data.
The model selected for this study is the monthly 1° × 1° NOAH dataset [45]. This dataset includes monthly data from 1998 to 2010 and provides four layers of soil moisture: 0–0.1 m, 0.1–0.4 m, 0.4–1.0 m and 1.0–2.0 m.

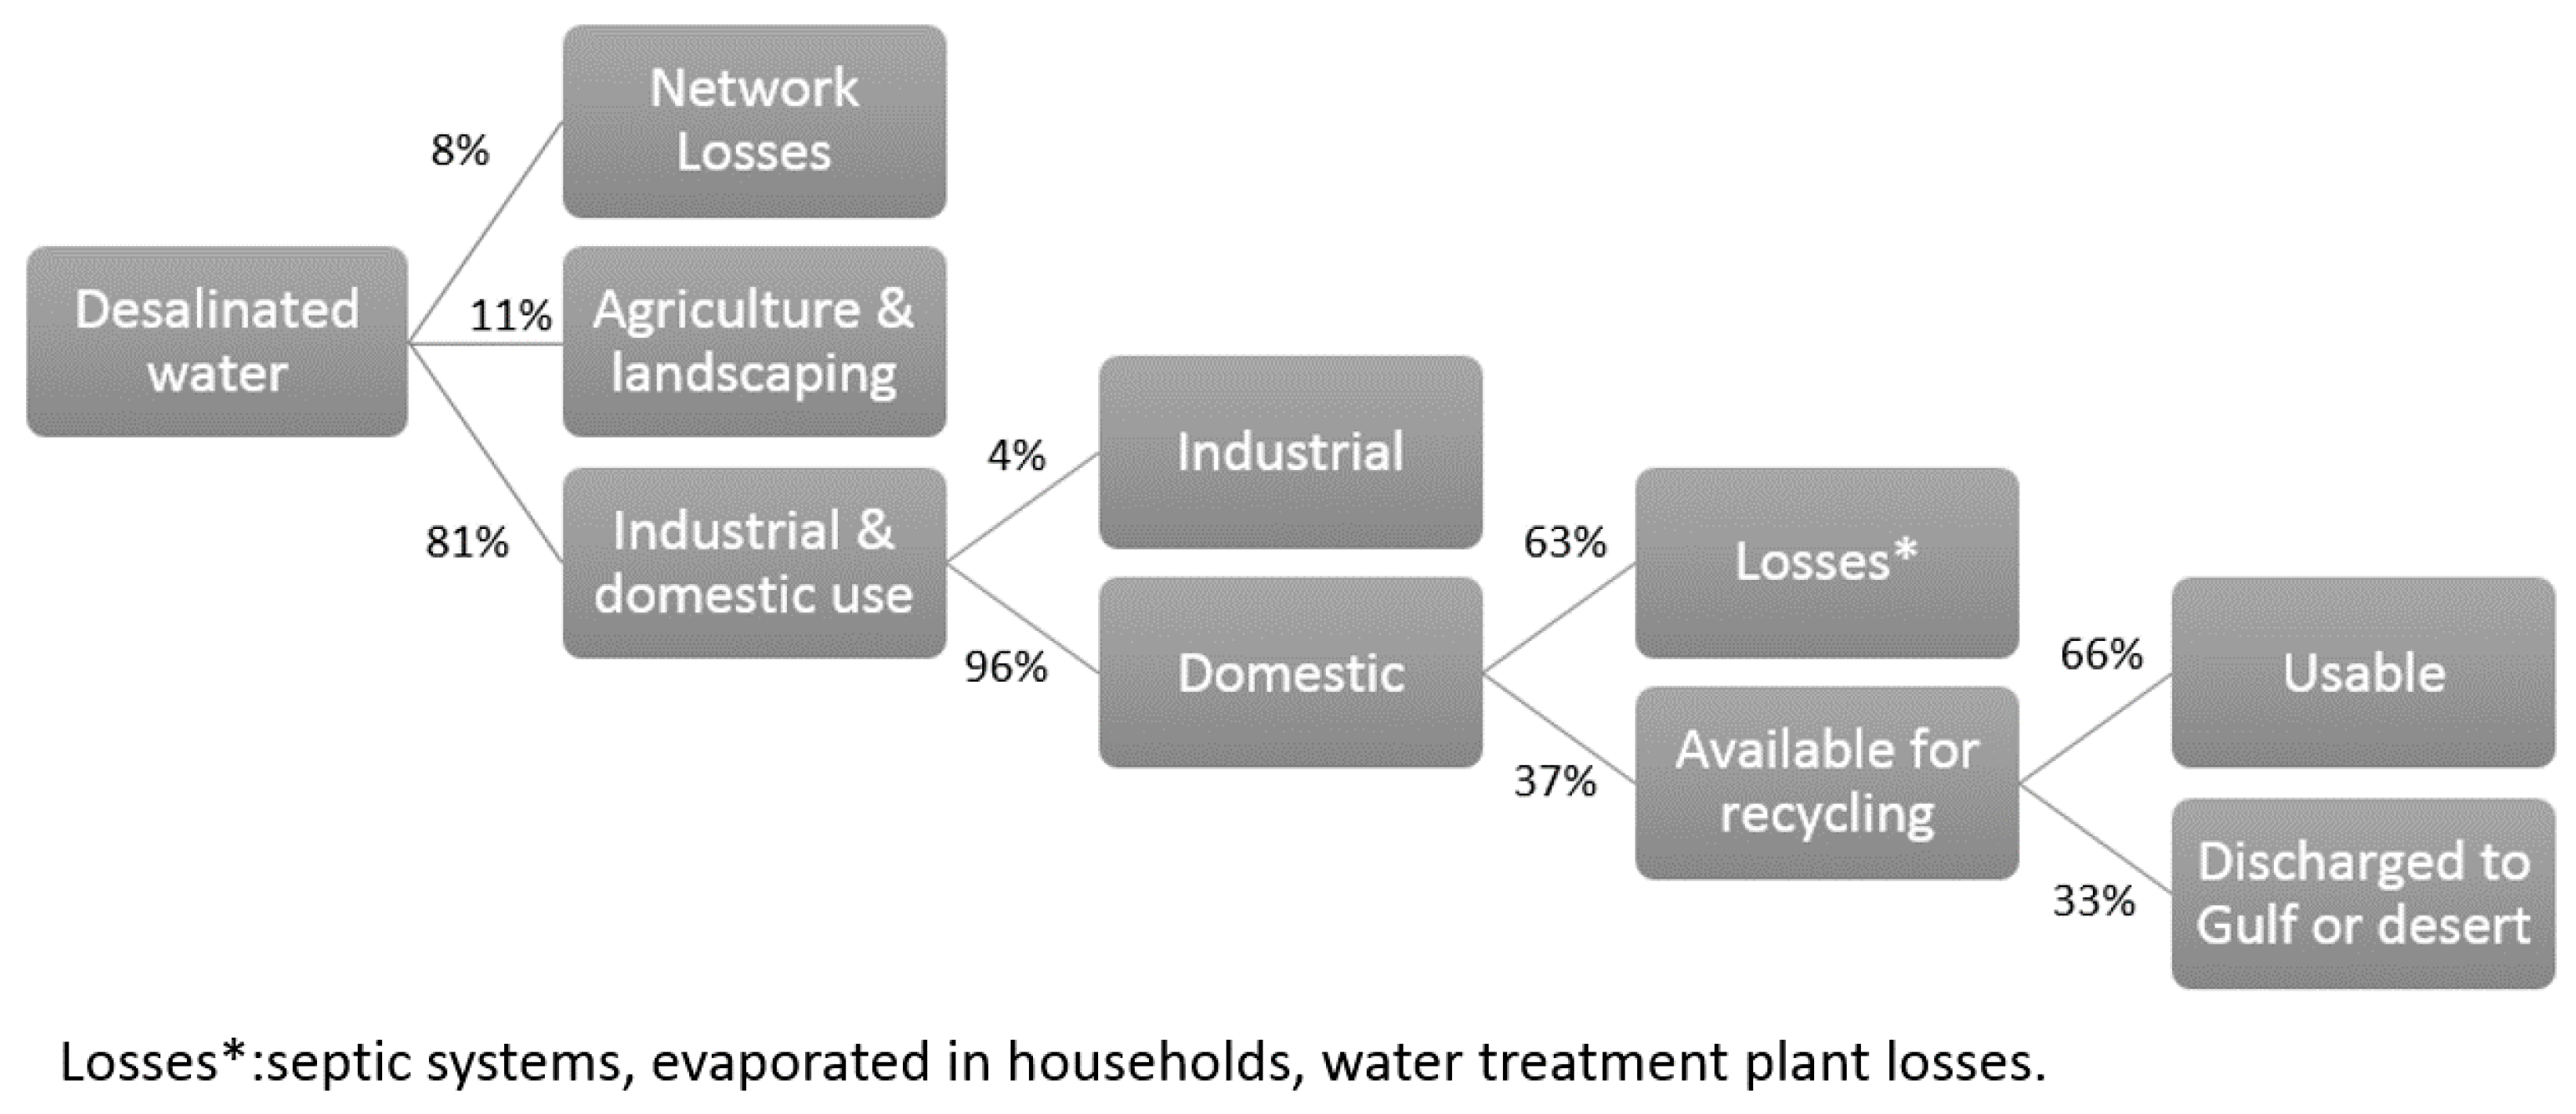
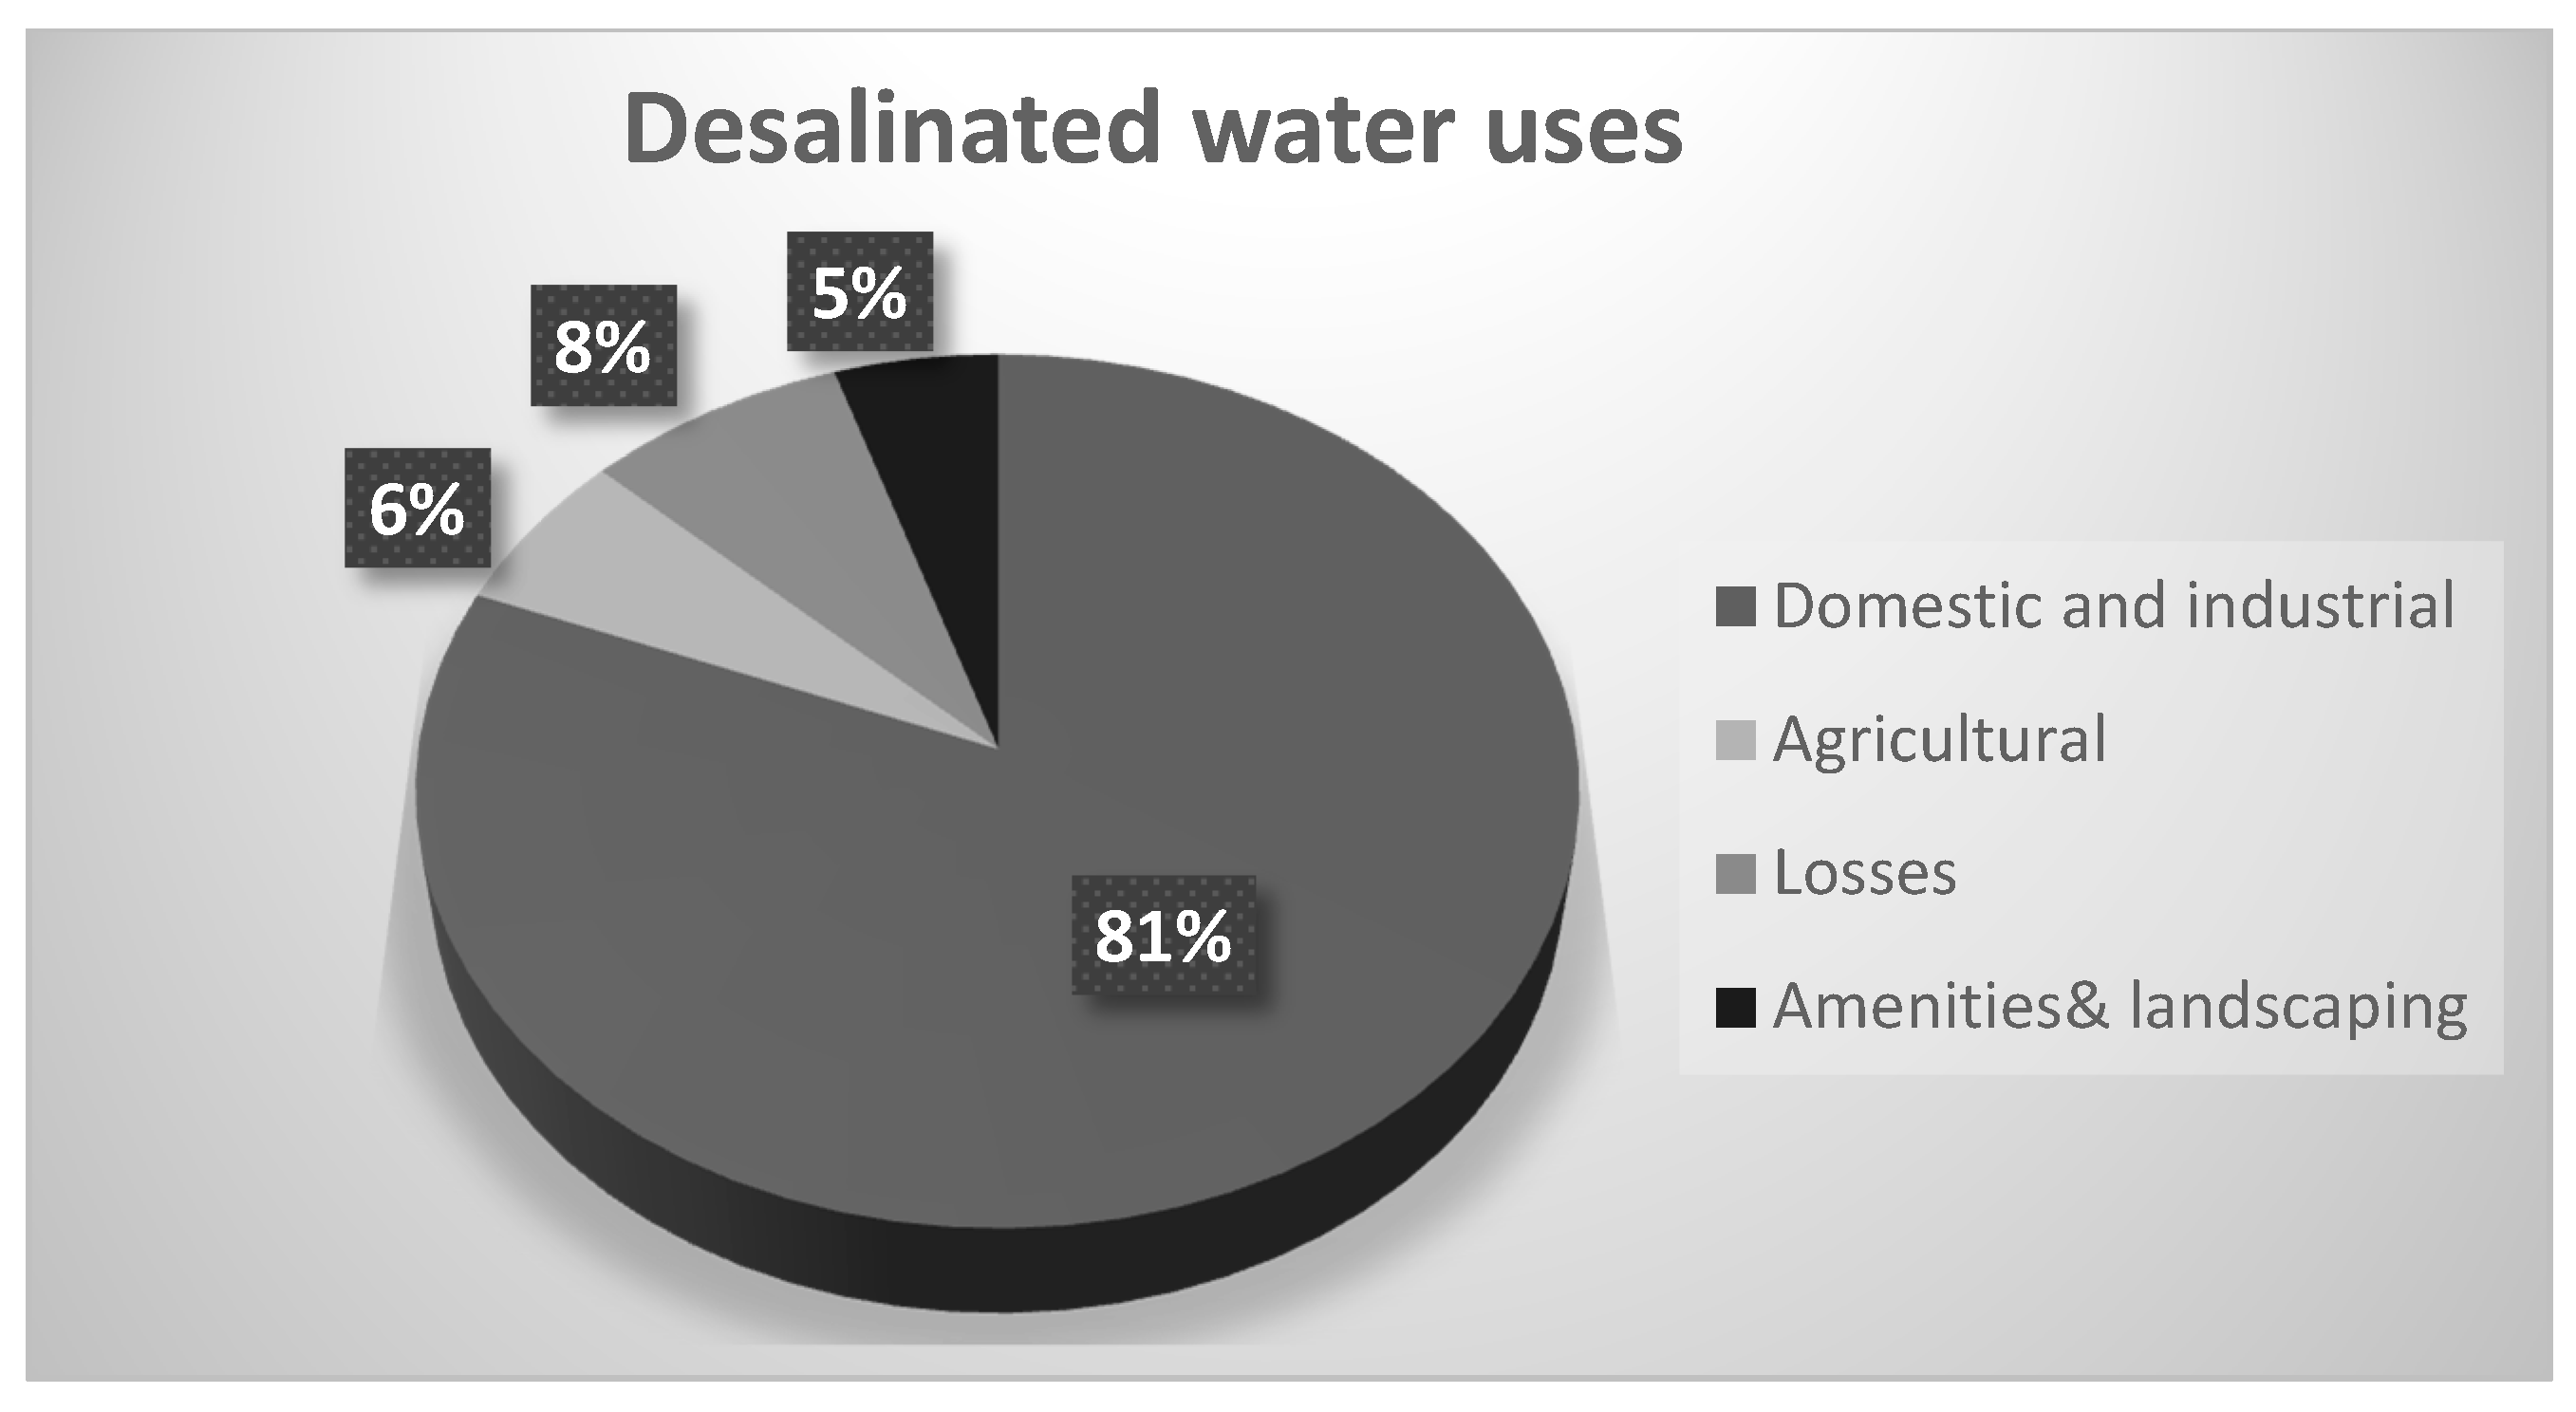
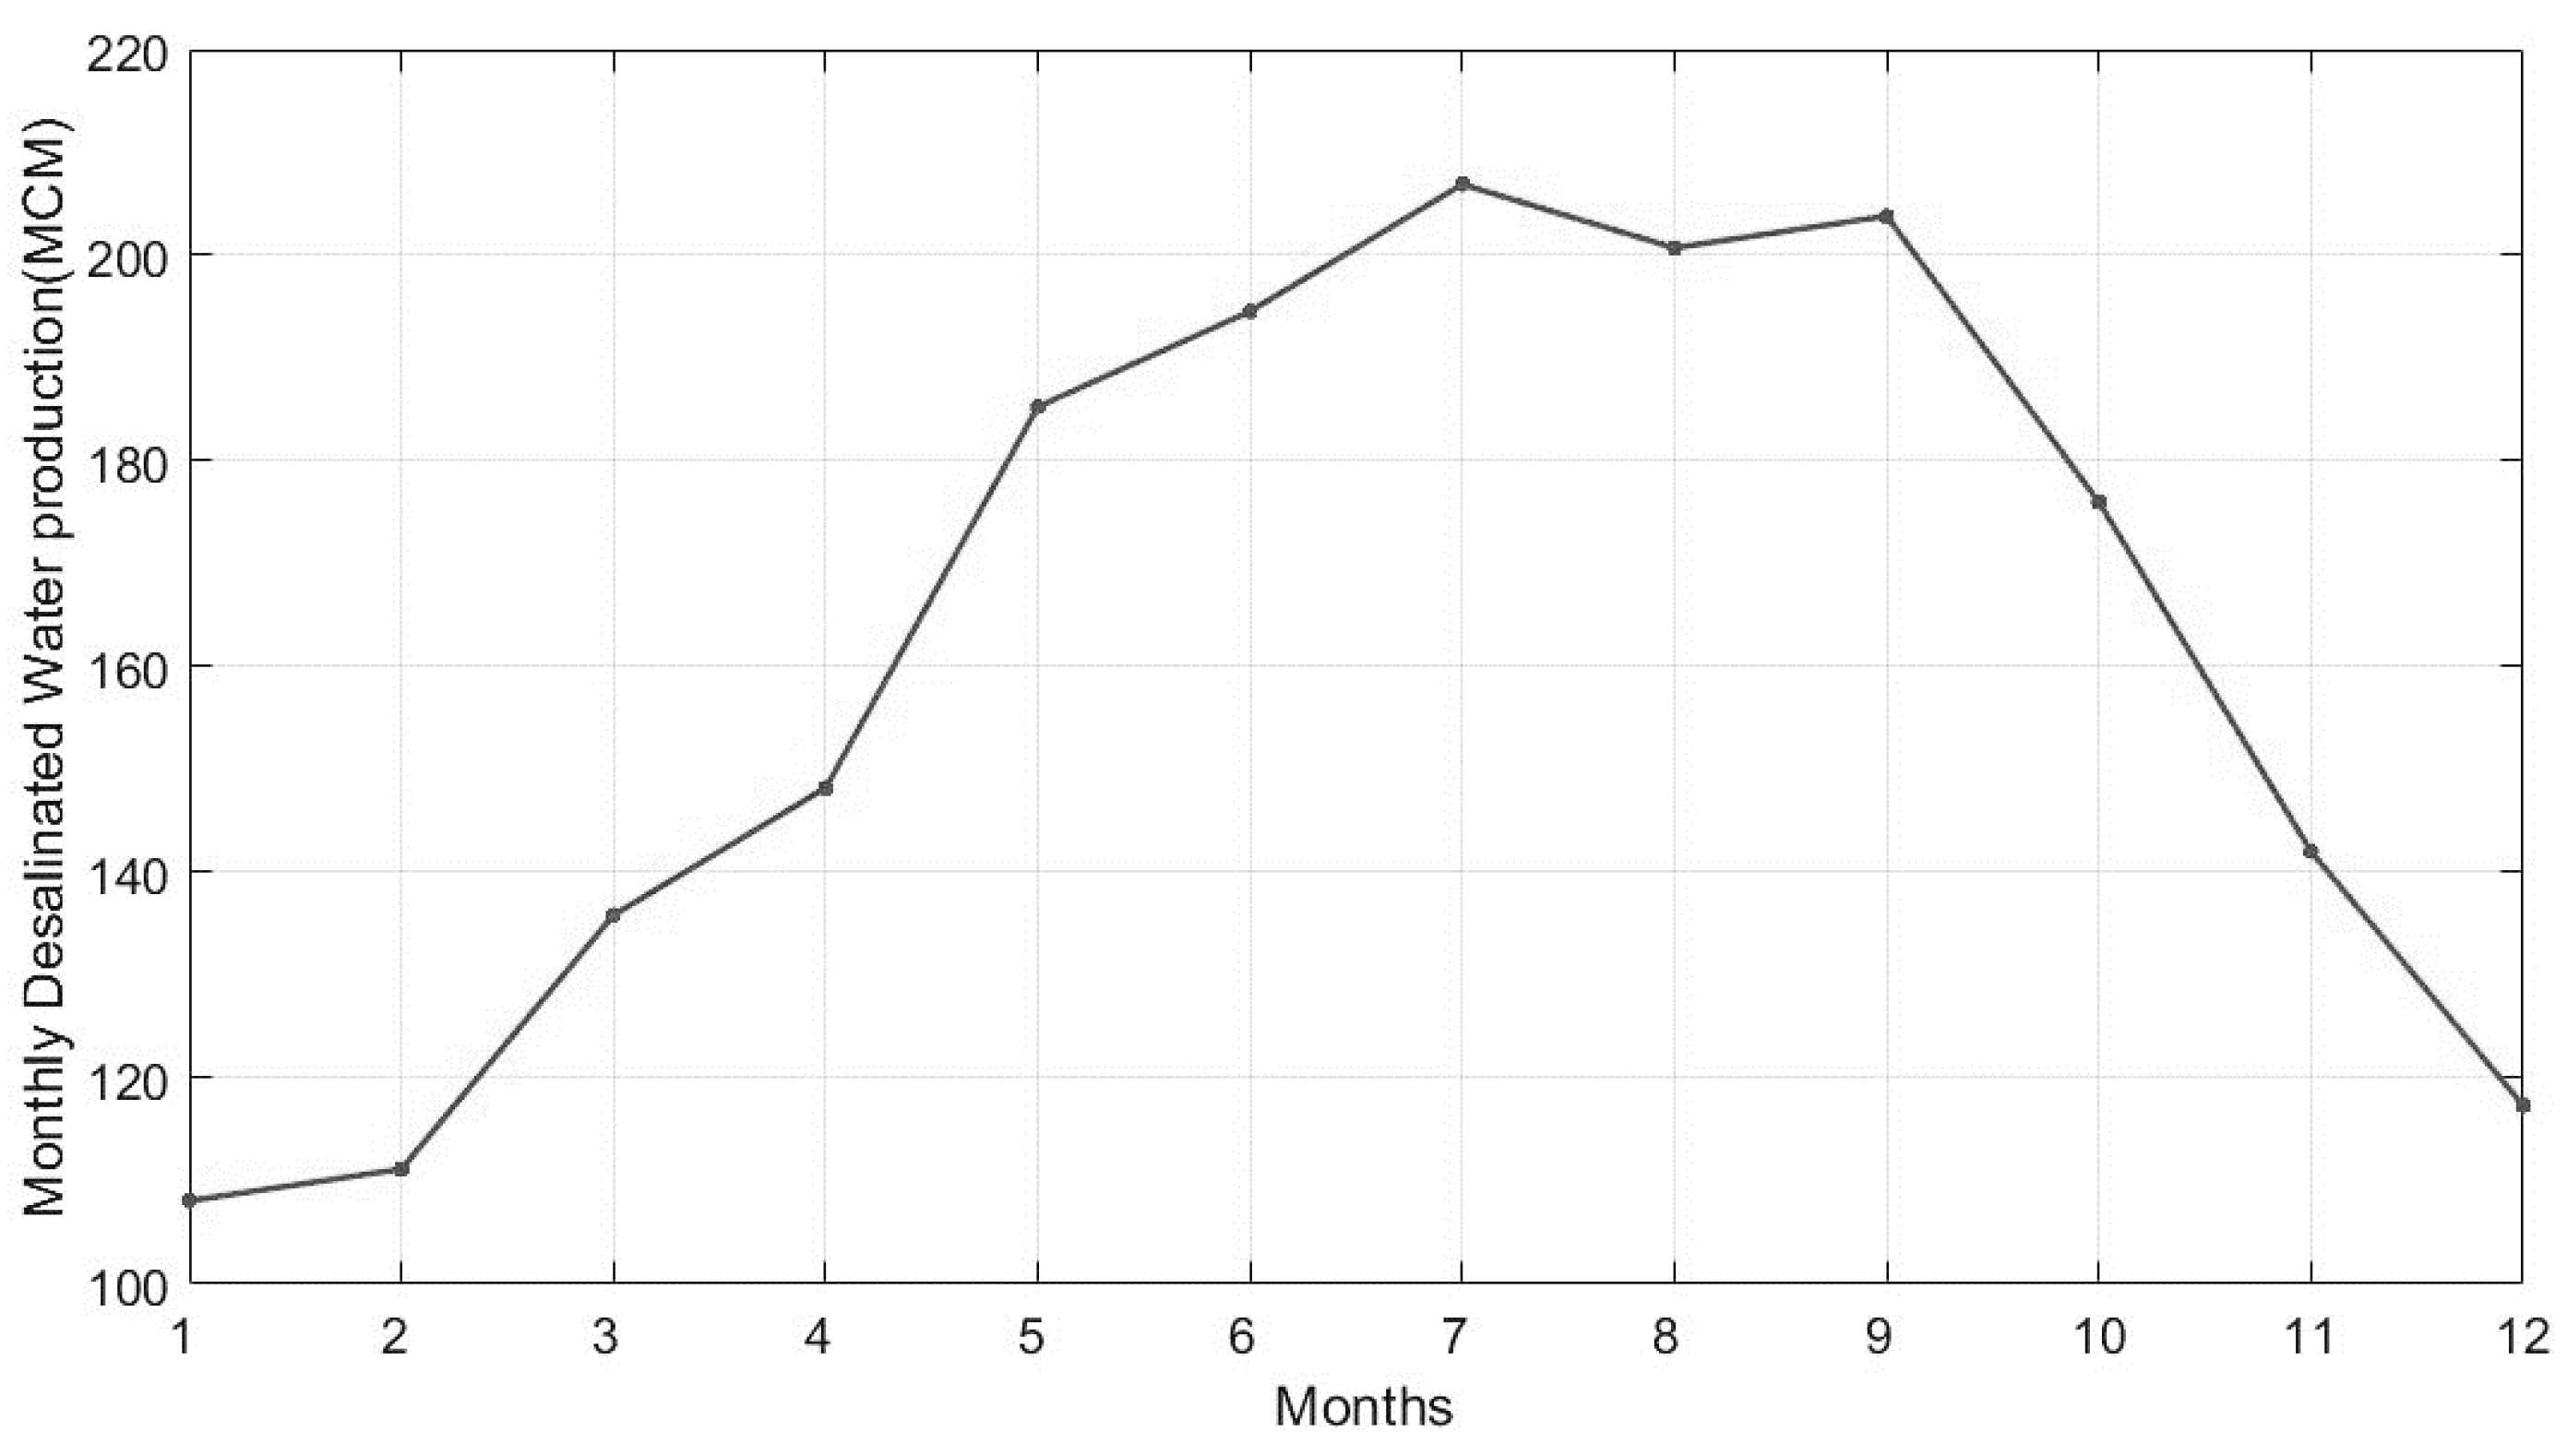
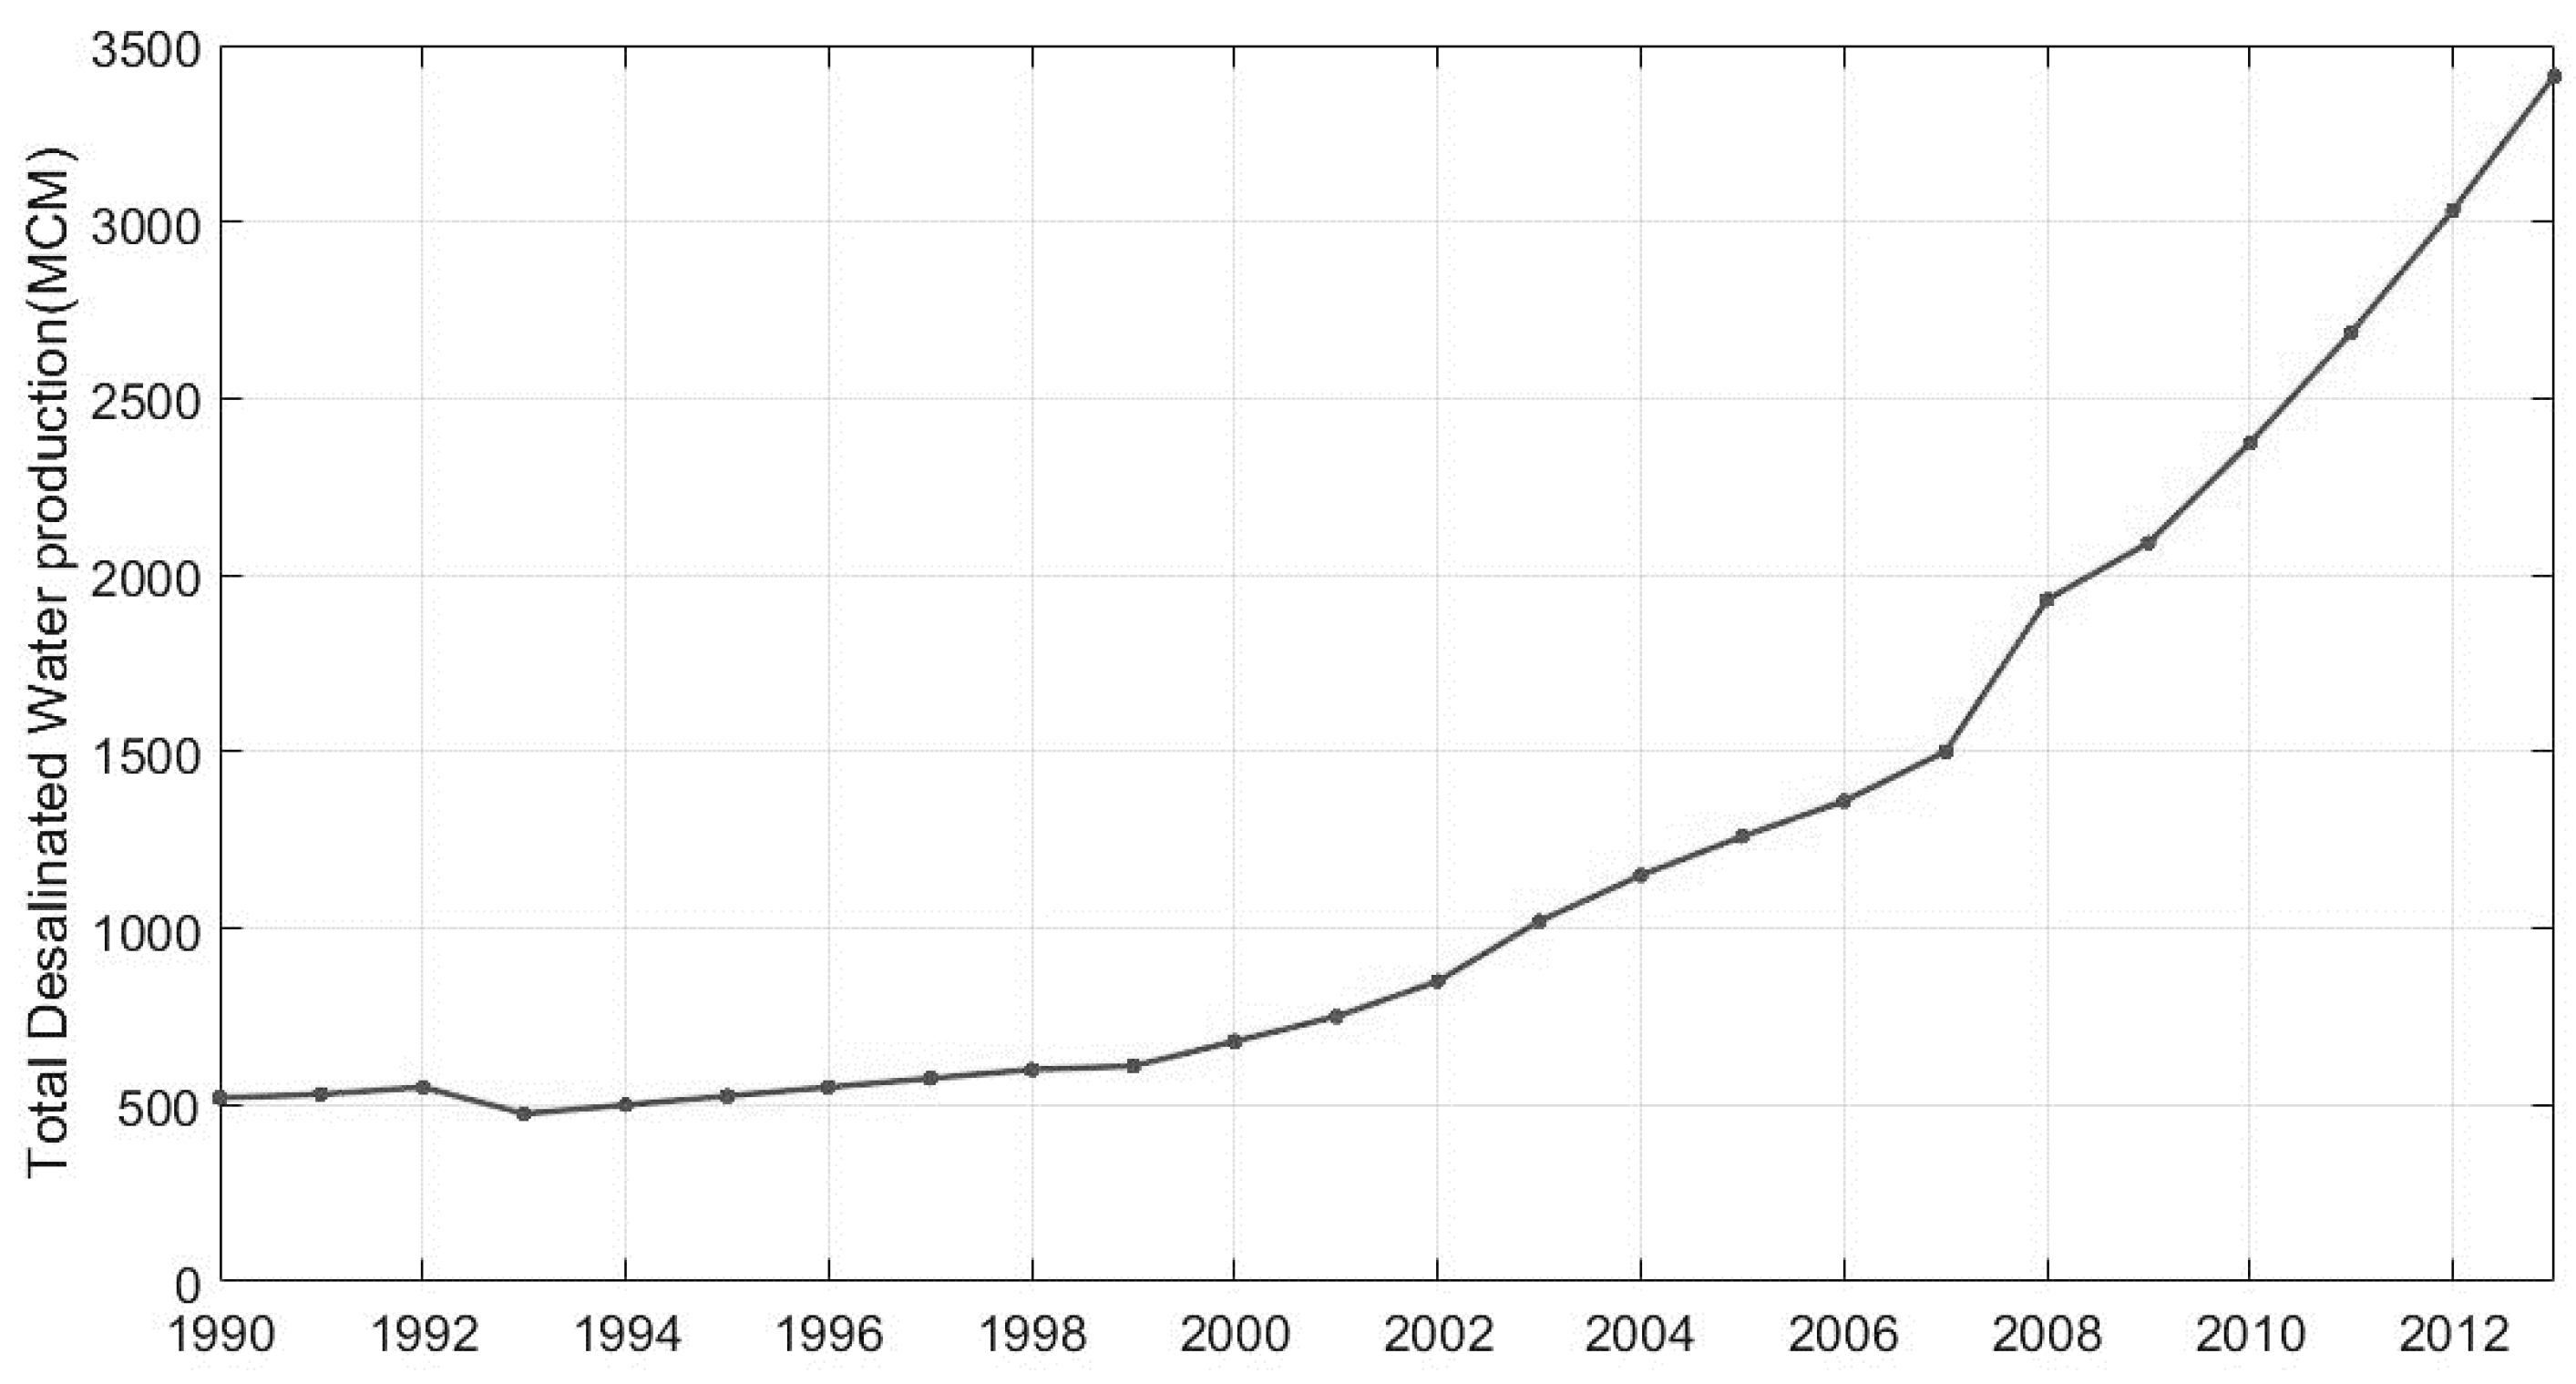
2.3.4. Desalinated and Recycled Water
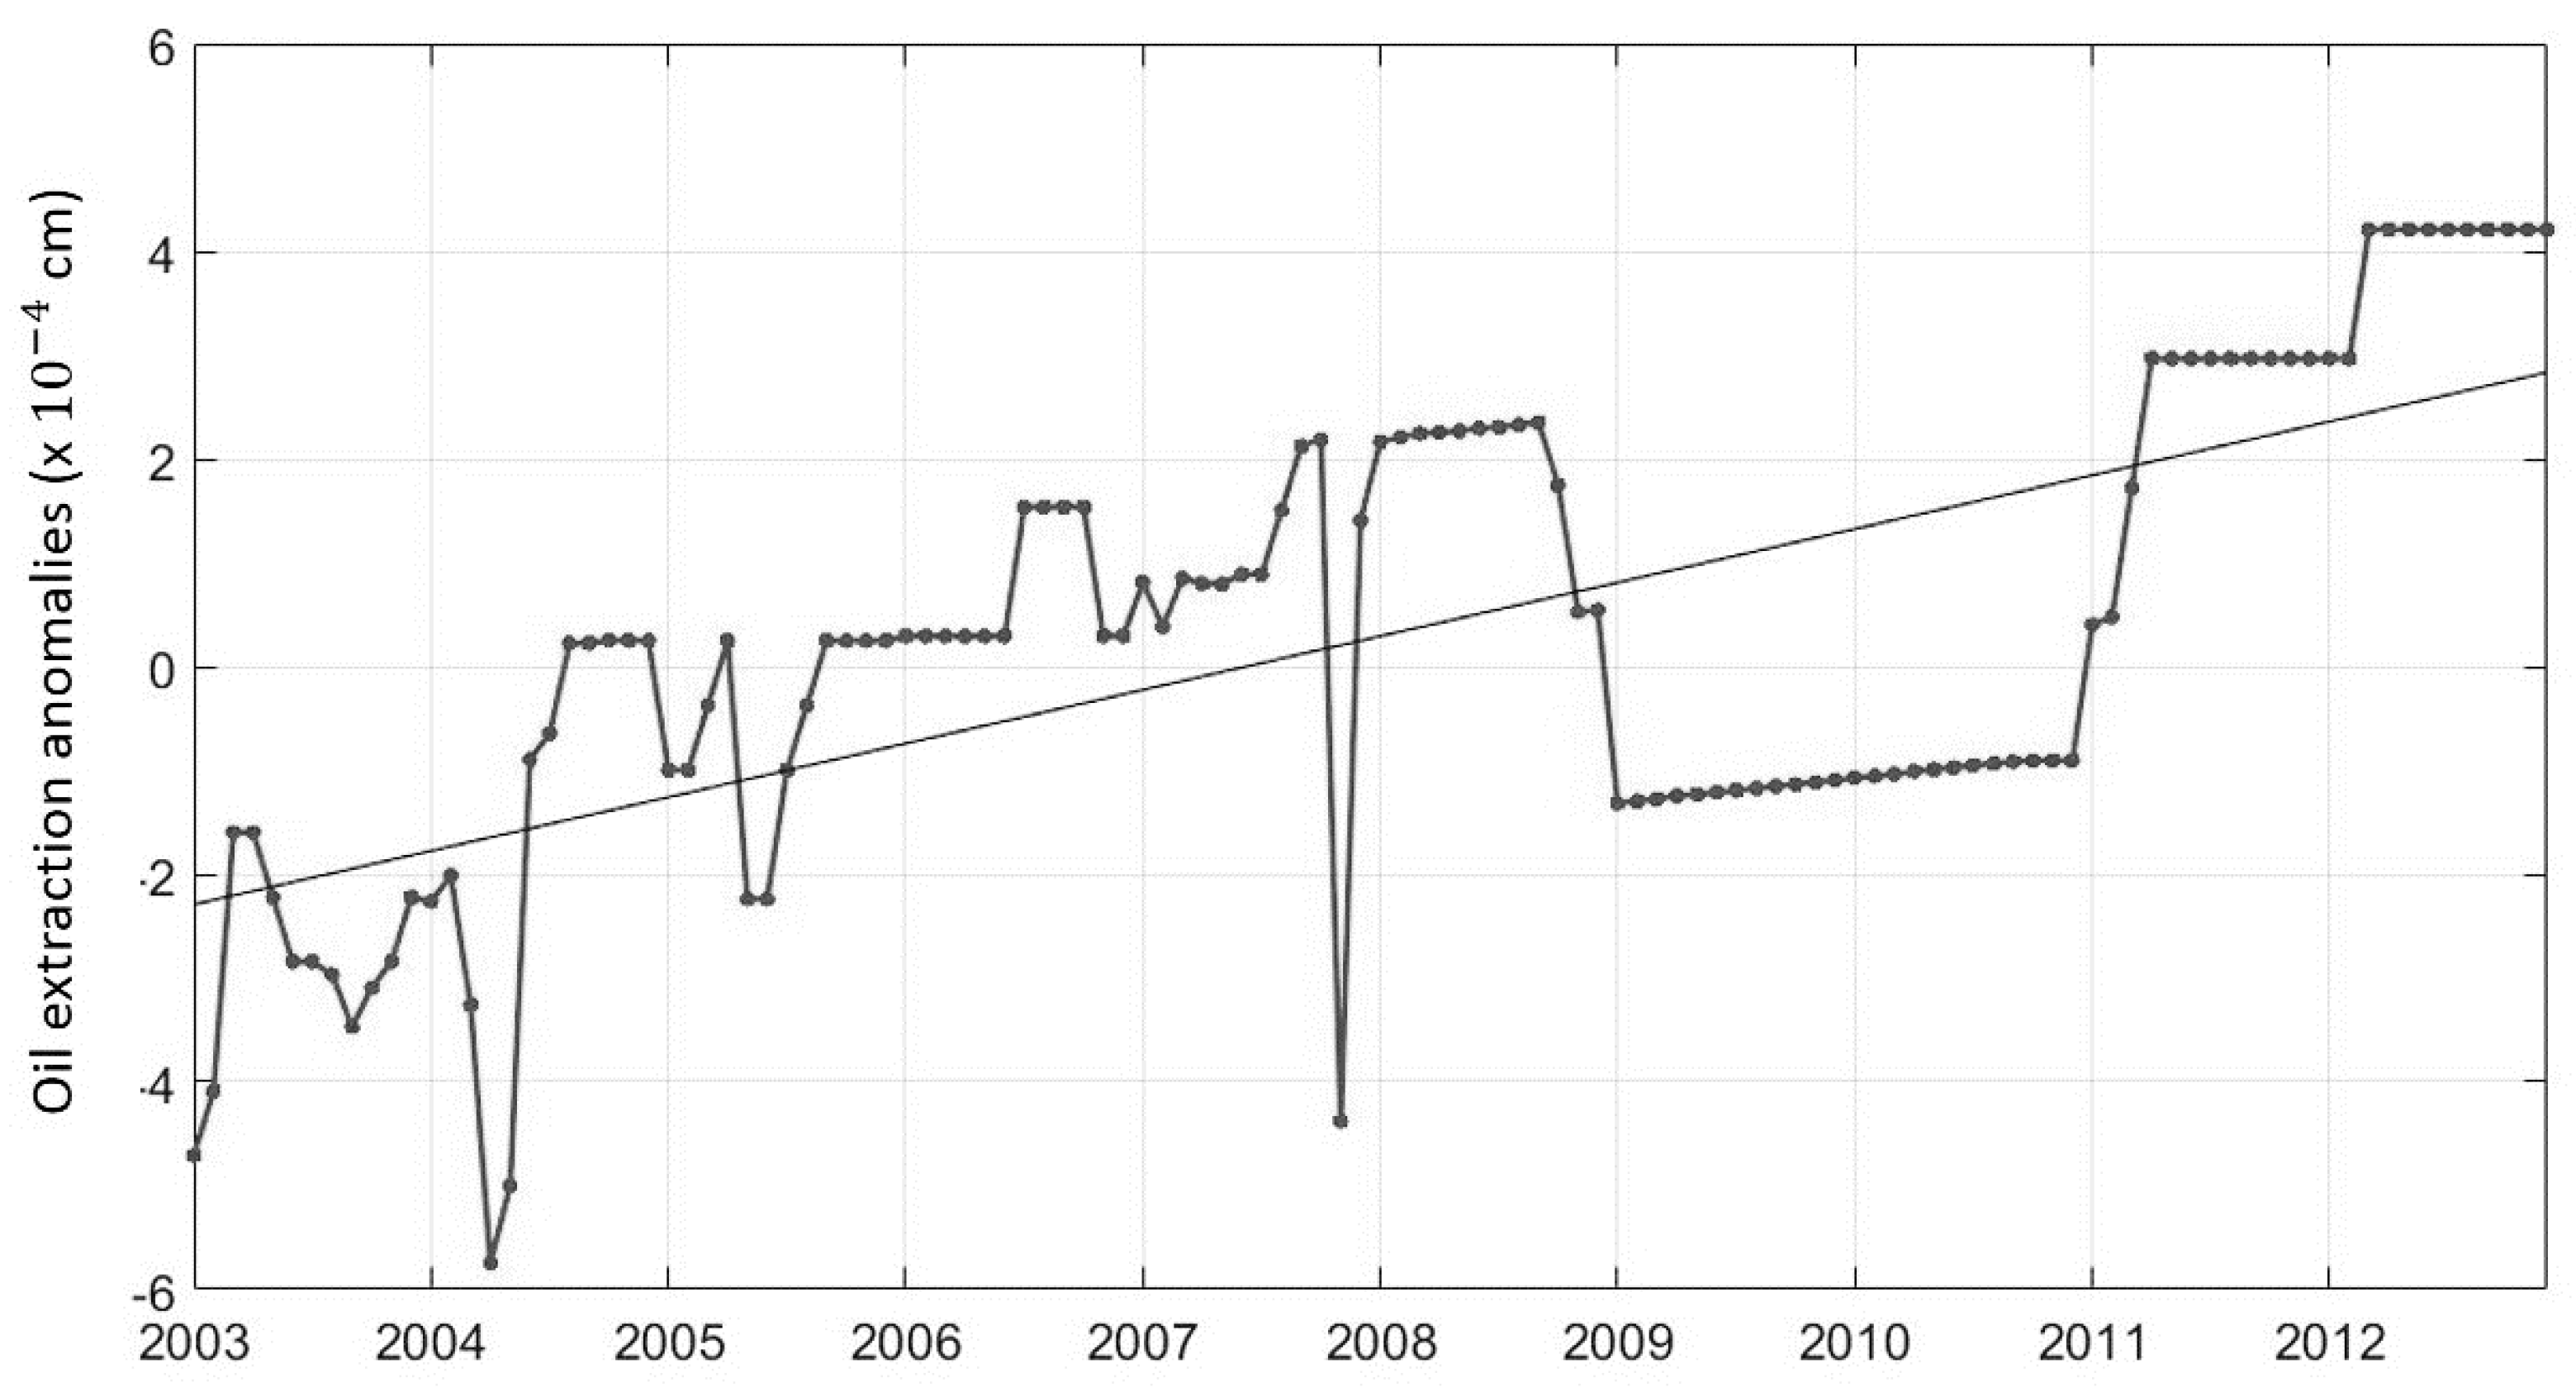
Desalinated water is the principal source of potable water in the country, mainly used for domestic and industrial purposes (81%), while other uses like agriculture (6%) or amenities and landscaping (5%) account for the rest, leaving the remaining 8% as losses in the network [6] (Figure 4). The yearly amount of desalinated water produced was obtained from the UAE Ministry of Environment and Water. Figure 5 and Figure 6 show the monthly and yearly desalinated water production in the UAE.
Recycled water is only used in amenities and landscaping and is produced from the wastewater derived from industries and households. It is difficult to account for the wastewater proceeding from the industries since many times it does not return to the sewer being processed inside and reused for cooling or other secondary purposes. Currently, it is considered that most of the wastewater collected for recycling (94%) comes from households. However, not all the wastewater produced by households returns to the sewer system since not all is actually used for domestic purposes. A big amount of water is used in gardens, landscaping or washing cars, which is eventually lost by evaporation. On top of this, it needs to be considered that villas and apartment blocks consume different amount of water and that currently 77% of the population is served by a centralized wastewater collection system.
There is an important lack of data concerning the precise amount of water obtained by recycling and many aspects need to be considered. After accounting for all the facts mentioned previously and taking into account the water treatment plant losses, it has been estimated that 37% of the water used in households is actually available for recycling. A last point to be considered is that not all the recycled water is actually used; one third is disposed in the desert or into the Gulf leaving the final percentage of recycled water used in landscaping as 20% of the total desalinated water. Figure 7 shows the breakdown of desalinated and recycled water. It is difficult to isolate the contribution of desalinated water that rigorously enters the study area. However, it is possible to say that the amount of water that, in one way or another does not end in the land points, such as drinking water lost by transpiration or recycled water discharged in the gulf, is relatively small compared to the other components. Therefore, in this study, all the desalinated water produced is considered as input in the water budget.

2.3.5. Oil

Oil production in the UAE has experienced a general increase since 1984 [49], becoming one of the major oil producers and exporters in the world. The majority of oil (approximately 95%) is produced in Abu Dhabi, both onshore and offshore. For this study, oil production data was obtained from the US Energy Information administration [50] and from the Abu Dhabi Company for Onshore Oil Operations (ADCO) which represents 50% of the UAE’s crude oil production. Offshore production does not occur in the cells (land areas) of our region of interest, therefore it is not taken into account in the mass change. To be consistent with the other terms of the equation, oil extractions are transformed to equivalent water before being introduced in the water budget. The anomalies are calculated in the same way as it was done for the rest of the components.
Gas extractions have not been taken into account in this study. The UAE is a major consumer of natural gas, 80% of the country’s power is generated from gas used to feed power and desalination plants, while the rest comes from oil. However, the majority of the gas produced in the UAE is used for reinjection into oilfields to maintain wellhead pressure [51]. The natural gas extracted and re-injected does not produce any change in the mass in the study area, and therefore, is not taken into account as a contributor to the gravity anomalies of GRACE.

3. Results

The first objective of this study was to determine the change in groundwater storage using Equation (2).
The time series in Figure 8 shows the monthly measurements of the spatially averaged TWS obtained from GRACE during the period 2003 to 2012. The data has been fitted by a linear trend line that shows a clear decrease in the area of study caused by the combined effect of mass change in oil and water. These results compare favorably with the negative trends in TWS from a similar study performed over western Iran and eastern Iraq [5].
The four layers of soil moisture provided by GLDAS NOAH are depicted in Figure 9 along with the combined graph of the four layers. The effect of precipitation is clearly reflected in the first layer and a net positive trend in the combination of the layers is observed.
The oil extractions time series expressed as anomalies of equivalent water height is shown in Figure 10. A general increasing trend is observed, however, the values obtained are relatively small compared with the other components in Equation (2).
Terrestrial water storage from GRACE, soil moisture from GLDAS and oil extractions from observational data are introduced in Equation (2) to obtain the groundwater anomalies shown in Figure 11. Oil anomalies and TWS include 10 years of data from 2003 to 2012. However, due to the limitation imposed by the soil moisture data, the groundwater time series includes only 8 years, from 2003 to 2010. As seen in Figure 10, the oil effect is very small compared to the change in water not affecting significantly in the estimation of groundwater. After subtracting the soil moisture component, the groundwater time series shows a decreasing trend of 0.5 cm/year with a deviation around the mean of 0.63 cm/year for the study region. This decrease corresponds to an average extraction of 0.86 km3/year and a deviation of 1.09 km3/year for the 8 years of the study period, with some years showing a steeper decrease than others. Figure 12 illustrates the yearly groundwater anomalies for the UAE. This result can be explained as a consequence of the withdrawals of water from aquifers mainly used for irrigation.
After estimating groundwater changes, the rest of the components of the water budget equation were estimated and used to estimate the evapotranspiration from Equation (3).
Figure 13 shows the distribution of desalinated water during the period of study expressed as water height. A clear seasonality can be observed as a consequence of the use of combined cycle plants for electricity and water production. The peaks appearing during the summer season being the most demanding in terms of electricity consumption for air conditioning.
Figure 14 depicts the ten years’ time series of precipitation obtained from TRMM. The peaks appear clearly during the rainy season, starting in November and finishing in March. Soil moisture, as shown in Figure 9 appears to follow a similar trend as precipitation; there is a net increase in the period considered from 2003 to 2008/2009 followed by a decreasing trend from 2008/2009 to 2011.
A preliminary correlation analysis between TRMM data and six ground stations in the UAE was performed to test the accuracy of TRMM in the UAE assuming ground stations as truth data.
A fairly good correlation is obtained in most of the stations (Figure 15). Therefore, the result is considered good enough to use TRMM data in the water budget.
The last component of the inputs in the water budget equation is the increment of water storage (∆Sw) shown in Figure 16 obtained from Equation (4). There is no significant trend in the resulting graph which may indicate that the decrease in TWS has been relatively constant during the study period.
Finally, Figure 17 shows the time series of evapotranspiration obtained from Equation (3). The pattern observed follows the precipitation fairly well, suggesting that most of the rain water is lost through evapotranspiration and just a small amount of it is actually recharging the aquifers.
The contribution of desalinated water is very small compared to precipitation. However, the data shows that the precipitation has been decreasing in the past few years. Although the time is not long enough to draw conclusions, if we continue observing a decrease in precipitation and an increasing trend in the production of desalinated water, the amount of desalinated water produced may equal the amount received by precipitation at one point in the future. This would make the UAE even more dependent on desalination and it can be especially noticeable if in the future, groundwater is replaced by desalinated water for agriculture.

4. Discussion

The purpose of the current study was to assess the components of the water budget and gain a better understanding of the availability of water resources in the UAE. Groundwater storage change was estimated from GRACE data by subtracting the oil as water equivalent and soil moisture contributions. On the one hand, it was found that oil extractions represent a very small fraction of the mass change reflected in GRACE gravity anomalies, with most of the water storage change as a combination of groundwater and soil moisture. On the other hand, groundwater storage showed a clear decreasing trend indicating that the aquifers are not being recharged fast enough to compensate for the human withdrawals for agriculture, causing the depletion of groundwater resources.
The water budget equation was used to estimate evapotranspiration. Precipitation, desalinated water and increment of water storage represent the inputs of the water balance. Precipitation is scarce in the region and the results reveal similarities with the pattern followed by evapotranspiration. These findings suggest that most of the rain water in the UAE is lost through evapotranspiration, also supporting the fact that the aquifers are not being significantly recharged by rainfall. The depletion of groundwater resources caused by irrigation will require new policies to decrease the amount of water pumped out from the aquifers.
It has been observed that desalination has been increasing every year, yet, up to now, the amount of desalinated water is smaller than the water received from rainfall in the country. However, if the current increasing trend continues in the future, the results obtained show that desalination may become equally important in terms of amount of water or even more significant than precipitation. Furthermore, if desalinated water is increasingly used in irrigation, we presume that desalination will increase, becoming the most important water source in the country. In that case, besides the increase in the already extremely high cost of desalination, special efforts will be needed from the government to mitigate the negative impacts of the brine disposed in the gulf on the ecosystems. An increase in desalination may also result in more oil consumption unless other energy options such as nuclear or renewables are developed to cover the extra energy demand. An alternative option would be investing less in agriculture and increasing imports, although this would raise concerns about food security which would need to be addressed accordingly.
Recycled water is currently used for landscaping and municipal purposes only. On top of this, one third of this resource is disposed in the desert or the gulf due to the lack of storage infrastructure. Recycled water should be used more efficiently and new efforts should be put in expanding its use to agriculture irrigation for instance.
This study has provided an enhanced understanding of the water budget components in the UAE and may serve as a base for future studies in the region. However, it has also raised a few questions in need of further investigation.
Groundwater in the UAE represents 51% of the total water used and a decrease in the groundwater levels has been continuously reported by the agricultural sector. However there has not been scientific evidence to support this fact until now. At first glance, the decrease in groundwater does not seem to be in accordance in terms of magnitude with the intensive withdrawals of groundwater for agriculture. However, it should be pointed out that most of the withdrawals are made in the fresh and slightly brackish water aquifers that represent only around 30% of the total existing groundwater [6]. These aquifers are located in certain areas in the mountainous region at the border with Oman and Liwa in the south. Due to the spatially averaged nature of GRACE measurements used in this study, the water storage decrease is distributed in the whole area of the UAE while the actual withdrawals appear to only take place in small regions. Therefore, it can be presumed that the groundwater depletion rate would be much higher if we focused our study in these areas. However, GRACE presents limitations in terms of accuracy depending on the extension of the area of study, implying that the analysis in these small regions would not likely provide accurate results. GRACE can provide a first estimation of the depletion of the groundwater resources; however, further studies using other techniques should be performed in targeted areas of the aquifers to obtain a better estimation of the groundwater depletion.
Secondly, in this study, only the land area has been taken into account. Nevertheless, groundwater exchange from the ocean towards inland or vice versa may happen. This may be especially relevant in the UAE where a big part of the water in the aquifers is saline or slightly saline [6]. A similar case can be observed in the mountainous region in the border with Oman where precipitation is expected to be higher and some water transfers may happen between the two countries. Further research might investigate new ways of modeling these water inputs and outputs and how to account them in the water budget.
Another point that would need to be further assessed is the effect of the scale factors in GRACE measurements in the region. The scale factors are calculated based on the signal attenuation obtained from the comparison with GLDAS-NOAH model. However, some processes such as the ones produced by human interactions (e.g., groundwater extractions) are not represented by the model [16]. In the case of the UAE, groundwater extractions are the main driver of groundwater variations, therefore, in such cases, a further analysis would be required regarding the possible signal loss. The current research was not intended to cover an evaluation of the accuracy of GRACE gain factors, however, more specific studies could focus on obtaining a better approximation of the gain factors for the UAE or other desert regions where groundwater extractions are significant.
In this study, oil contribution has been removed from GRACE mass changes. However, the current research was limited by the public availability of data regarding natural gas extractions and its uses. Although a first approximation indicates that gas extractions in the UAE do not represent an important contribution to GRACE measurements, further work could be done to establish more accurately if it actually represents a significant output of mass.

Acknowledgments

The authors would like to acknowledge all the sources of the data used in the present work (cited in the manuscript). GRACE land data [39], supported by the NASA MEaSUREs Program. GLDAS data [45], acquired as part of the mission of NASA’s Earth Science Division and archived and distributed by the Goddard Earth Sciences (GES) Data and Information Services Center (DISC). TRMM 3B42 derived dataset version 7 [45], acquired as part of the Tropical Rainfall Measuring Mission (TRMM) sponsored by the Japan National Space Development Agency (NASDA) and the US National Aeronautics and Space Administration (NASA). The authors wish to express their appreciation to Nina Yang, Assistant Editor, to all the members of the Water Editorial Office, and to the three anonymous reviewers for their invaluable comments and suggestions which helped considerably improve the quality of the paper.

Author Contributions

Taha B. M. J. Ouarda, Prashanth R. Marpu, Rocio Gonzalez and Elfatih A. B. Eltahir conceived the study; Rocio Gonzalez, Taha B. M. J. Ouarda and Prashanth R. Marpu analyzed the data and adjusted the study. Rocio Gonzalez conducted the research work under the supervision of Taha B. M. J. Ouarda and Prashanth R. Marpu, Rocio Gonzalez, Taha B. M. J. Ouarda and Prashanth R. Marpu analyzed and discussed the results. Elfatih A. B. Eltahir, Mariam M. Allam and Simon Pearson contributed to the discussion of the results. Rocio Gonzalez wrote the first draft of the paper. Taha B. M. J. Ouarda and Prashanth R. Marpu corrected the first draft of the paper. All co-authors revised and commented the final draft of the paper.

Conflicts of Interest

The authors declare no conflict of interest.

References

  1. Trondalen, J.M. Climate Change, Water Security, and Possible Remedies for the Middle East; The United Nations World Water Assessment Programs; 2009; Available online: http://www.unwater.org/downloads/181886E.pdf (accessed on 2 December 2013).
  2. Saif, O.; Mezher, T.; Arafat, H. Water security in the GCC countries: Challenges and opportunities. J. Environ. Stud. Sci. 2014, 4, 329–346. [Google Scholar] [CrossRef]
  3. United Nations Development Programme (UNDP). Water Governance in the Arab Region. Managing Scarcity and Securing the Future; UNDP: New York, NY, USA, 2013. [Google Scholar]
  4. Voss, K.A.; Famiglietti, J.S.; Lo, M.; de Linage, C.; Rodell, M.; Swenson, S.C. Groundwater depletion in the Middle East from GRACE with implications for transboundary water management in the Tigris-Euphrates-Western Iran region. Water Resour. Res. 2013, 49, 904–914. [Google Scholar] [CrossRef] [PubMed]
  5. Joodaki, G.; Wahr, J.; Swenson, S. Estimating the human contribution to groundwater depletion in the Middle East, from GRACE data, land surface models, and well observations. Water Resour. Res. 2014, 50, 2679–2692. [Google Scholar] [CrossRef]
  6. Ministry of Environment and Water (MoEW). United Arab Emirates Water Conservation Strategy. 2010. Available online: http://faolex.fao.org/docs/pdf/uae147095.pdf (accessed on 17 December 2013). [Google Scholar]
  7. Mezher, T.; Fath, H.; Abbas, Z.; Khaled, A. Techno-economic assessment and environmental impacts of desalination technologies. Desalination 2011, 266, 263–273. [Google Scholar] [CrossRef]
  8. Wahr, J.; Molenaar, M.; Bryan, F. Time variability of the Earth’s gravity field: Hydrological and oceanic effects and their possible detection using GRACE. J. Geophys. Res. Solid Earth 1998, 103, 30205–30229. [Google Scholar] [CrossRef]
  9. Rodell, M.; Famiglietti, J.S. Detectability of variations in continental water storage from satellite observations of the time dependent gravity field. Water Resour. Res. 1999, 35, 2705–2723. [Google Scholar] [CrossRef]
  10. Rodell, M.; Famiglietti, J.S. An analysis of terrestrial water storage variations in Illinois with implications for the Gravity Recovery and Climate Experiment (GRACE). Water Resour. Res. 2001, 37, 1327–1339. [Google Scholar] [CrossRef]
  11. Rodell, M.; Famiglietti, J.S. The potential for satellite-based monitoring of groundwater storage changes using GRACE: The High Plains aquifer, Central US. J. Hydrol. 2002, 263, 245–256. [Google Scholar] [CrossRef]
  12. Wahr, J.; Swenson, S.; Zlotnicki, V.; Velicogna, I. Time-variable gravity from GRACE: First results. Geophys. Res. Lett. 2004, 31, L11501. [Google Scholar] [CrossRef]
  13. Wahr, J.; Swenson, S.; Velicogna, I. Accuracy of GRACE mass estimates. Geophys. Res. Lett. 2006, 33, L06401. [Google Scholar] [CrossRef]
  14. Syed, T.H.; Famiglietti, J.S.; Rodell, M.; Chen, J.; Wilson, C.R. Analysis of terrestrial water storage changes from GRACE and GLDAS. Water Resour. Res. 2008, 44, W02433. [Google Scholar] [CrossRef]
  15. Longuevergne, L.; Scanlon, B.R.; Wilson, C.R. GRACE Hydrological estimates for small basins: Evaluating processing approaches on the High Plains Aquifer, USA. Water Resour. Res. 2010, 46, W11517. [Google Scholar] [CrossRef]
  16. Landerer, F.W.; Swenson, S.C. Accuracy of scaled GRACE terrestrial water storage estimates. Water Resour. Res. 2012, 48, W04531. [Google Scholar] [CrossRef]
  17. Rodell, M.; Famiglietti, J.S.; Chen, J.; Seneviratne, S.I.; Viterbo, P.; Holl, S.; Wilson, C.R. Basin scale estimates of evapotranspiration using GRACE and other observations. Geophys. Res. Lett. 2004, 31, L20504. [Google Scholar] [CrossRef]
  18. Yeh, P.J.-F.; Irizarry, M.; Eltahir, E.A.B. Hydroclimatology of Illinois: A comparison of monthly evaporation estimates based on atmospheric water balance and soil water balance. J. Geophys. Res. Atmos. 1998, 103, 19823–19837. [Google Scholar] [CrossRef]
  19. Yeh, P.J.F.; Swenson, S.C.; Famiglietti, J.S.; Rodell, M. Remote sensing of groundwater storage changes in Illinois using the Gravity Recovery and Climate Experiment (GRACE). Water Resour. Res. 2006, 42, W12203. [Google Scholar] [CrossRef]
  20. Rodell, M.; Chen, J.; Kato, H.; Famiglietti, J.; Nigro, J.; Wilson, C. Estimating groundwater storage changes in the Mississippi River basin (USA) using GRACE. Hydrogeol. J. 2007, 15, 159–166. [Google Scholar] [CrossRef]
  21. Getirana, A. Extreme Water Deficit in Brazil Detected from Space. J. Hydrometeorol. 2016, 17, 591–599. [Google Scholar] [CrossRef]
  22. Haile, K.H. Estimation of Terrestrial Water Storage in the Upper Reach of Yellow River. Master’s Thesis, Retrieved from Faculty of Geo-Information Science and Earth Observation Library, University of Twente, Enschede, The Netherlands, 2011. [Google Scholar]
  23. Crowley, J.W.; Mitrovica, J.X.; Bailey, R.C.; Tamisiea, M.E.; Davis, J.L. Land water storage within the Congo Basin inferred from GRACE satellite gravity data. Geophys. Res. Lett. 2006, 33, L19402. [Google Scholar] [CrossRef]
  24. Wang, S.; Huang, J.; Li, J.; Rivera, A.; McKenney, D.W.; Sheffield, J. Assessment of water budget for sixteen large drainage basins in Canada. J. Hydrol. 2014, 512, 1–15. [Google Scholar] [CrossRef]
  25. Wang, S.; Huang, J.; Yang, D.; Pavlic, G.; Li, J. Long-term water budget imbalances and error sources for cold region drainage basins. Hydrol. Process. 2015, 29, 2125–2136. [Google Scholar] [CrossRef]
  26. Sheffield, J.; Ferguson, C.R.; Troy, T.J.; Wood, E.F.; McCabe, M.F. Closing the terrestrial water budget from satellite remote sensing. Geophys. Res. Lett. 2009, 36, L07403. [Google Scholar] [CrossRef]
  27. Food and Agriculture Organization (FAO). Irrigation in the Middle East Region in Figures—AQUASTAT Survey 2008. 2008. Available online: http://www.fao.org/nr/water/aquastat/countries_regions/are/ARE-CP_eng.pdf (accessed on 20 February 2014).
  28. Niranjan Kumar, K.; Ouarda, T.B.M.J. Precipitation variability over UAE and global SST teleconnections. J. Geophys. Res. Atmos. 2014, 119. [Google Scholar] [CrossRef]
  29. Niranjan Kumar, K.; Ouarda, T.B.M.J.; Sandeep, S.; Ajayamohan, R.S. Wintertime precipitation variability over the Arabian Peninsula and its relationship with ENSO in the CAM4 Simulations. Clim. Dyn. 2016, 1–12. [Google Scholar] [CrossRef]
  30. Chandran, A.; Basha, G.; Ouarda, T.B.M.J. Influence of Climate Oscillations on Temperature and Precipitation over the United Arab Emirates. Int. J. Climatol. 2015. [Google Scholar] [CrossRef]
  31. Ouarda, T.B.M.J.; Charron, C.; Niranjan Kumar, K.; Marpu, P.R.; Ghedira, H.; Molini, A.; Khayal, I. Evolution of the rainfall regime in the United Arab Emirates. J. Hydrol. 2014, 514, 258–270. [Google Scholar] [CrossRef]
  32. Ghouse, B.; Ouarda, T.B.M.J.; Marpu, P.R. Long-term projections of Temperature, Precipitation and Soil moisture using non-stationary oscillation processes over the UAE region. Int. J. Climatol. 2015. [Google Scholar] [CrossRef]
  33. Jet Propulsion Laboratory. GRACE Tellus: Gravity Recovery and Climate Experiment. 2014. Available online: http://grace.jpl.nasa.gov/mission/grace/ (accessed on 15 July 2014). [Google Scholar]
  34. Rizk, Z.S.; Al Sharhan, S.A. Water resources in the United Arab Emirates. Water Resour. Perspect. Eval. Manag. Policy 2003, 50, 245–264. [Google Scholar]
  35. Al-Nuaimi, H.S.; Murad, A.A. Changes in Water Resources Systems: Methodologies to Maintain Water Security and Ensure Integrated Management. In Proceedings of the Symposium HS3006 at IUGG 2007, Perugia, Italy, 2–13 July 2007.
  36. Ministry of Environment and Water (MoEW). UAE Dams and Storage Capacity; MoEW: Abu Dhabi, UAE, 2013.
  37. Jet Propulsion Laboratory. GRACE Tellus: Gravity Recovery and Climate Experiment. 2014. Available online: http://grace.jpl.nasa.gov/data/solutioncomparison (accessed on 13 July 2014). [Google Scholar]
  38. Sakumura, C.; Bettadpur, S.; Bruinsma, S. Ensemble prediction and intercomparison analysis of GRACE time-variable gravity field models. Geophys. Res. Lett. 2014, 41, 1389–1397. [Google Scholar] [CrossRef]
  39. Jet Propulsion Laboratory. GRACE Tellus Monthly Mass Grids-Land. Available online: http://grace.jpl.nasa.gov/data/get-data/monthly-mass-grids-land/ (accessed on 1 September 2016).
  40. Swenson, S.C. GRACE Monthly Land Water Mass Grids NETCDF RELEASE 5.0. Ver. 5.0. PO.DAAC, CA, USA. 2012. Available online: http://dx.doi.org/10.5067/TELND-NC005 (accessed on 27 April 2014).
  41. Swenson, S.; Wahr, J. Post-processing removal of correlated errors in GRACE data. Geophys. Res. Lett. 2006, 33, L08402. [Google Scholar] [CrossRef]
  42. NASA. Goddard Earth Sciences Data and Information Services Center. 2014. Available online: http://disc.sci.gsfc.nasa.gov/precipitation/additional/instruments/trmm_instr.shtml (accessed on 26 June 2014). [Google Scholar]
  43. Gu, H.-H.; Yu, Z.-B.; Yang, C.-G.; Ju, Q.; Lu, B.-H.; Liang, C. Hydrological assessment of TRMM rainfall data over Yangtze River Basin. Water Sci. Eng. 2010, 3, 418–430. [Google Scholar]
  44. Collischonn, B.; Collischonn, W.; Tucci, C.E.M. Daily hydrological modeling in the Amazon basin using TRMM rainfall estimates. J. Hydrol. 2008, 360, 207–216. [Google Scholar] [CrossRef]
  45. NASA. Goddard Earth Sciences Data and Information Services Center. Available online: http://mirador.gsfc.nasa.gov (accessed on 3 February 2014).
  46. Rodell, M.; Houser, P.R.; Jambor, U.; Gottschalck, J.; Mitchell, K.; Meng, C.J.; Arsenault, K.; Cosgrove, B.; Radakovich, J.; Bosilovich, M.; et al. The Global Land Data Assimilation System. Bull. Am. Meteorol. Soc. 2004, 85, 381–394. [Google Scholar] [CrossRef]
  47. NASA. LDAS Land Data Assimilation Systems. 2014. Available online: http://ldas.gsfc.nasa.gov/gldas/GLDASforcing.php (accessed on 18 August 2014). [Google Scholar]
  48. Fang, H.; Beaudoing, H.K.; Rodell, M.; Teng, W.L.; Vollmer, B.E. Global Land Data Assimilation System (GLDAS) products, services and application from NASA Hydrology Data and Information Services Center (HDISC). In Proceedings of the ASPRS 2009 Annual Conference, Baltimore, MD, USA, 8–13 March 2009.
  49. U.S. Energy Information Administration (EIA). Country Analysis Brief: United Arab Emirates. Available online: http://www.eia.gov/countries/analysisbriefs/UAE/uae.pdf (accessed on 4 June 2014).
  50. U.S. Energy Information Administration (EIA). United Arab Emirates. Available online: https://www.eia.gov/beta/international/analysis.cfm?iso=ARE (accessed on 4 June 2014).
  51. Dargin, J. Addressing the UAE Natural Gas Crisis: Strategies for a Rational Energy Policy; Policy Brief, Dubai Initiative; Belfer Center for Science and International Affairs, Harvard Kennedy School: Cambridge, MA, USA, 2010. [Google Scholar]
Figure 1. Location of the study region (United Arab Emirates).
Water 08 00415 g001
Figure 2. Study area overlaid with The Gravity Recovery and Climate Experiment (GRACE) grid.
Water 08 00415 g002
Figure 3. Study area overlaid with the Tropical Rainfall Measuring Mission (TRMM) grid.
Water 08 00415 g003
Figure 4. Desalinated water uses.
Water 08 00415 g004
Figure 5. Monthly desalinated water production for the year 2008.
Water 08 00415 g005
Figure 6. Total desalinated water production in the UAE from 1990 to 2012.
Water 08 00415 g006
Figure 7. Desalinated water uses breakdown.
Water 08 00415 g007
Figure 8. Time series of GRACE terrestrial water storage TWS (cm) from 2003 to 2012.
Water 08 00415 g008
Figure 9. Soil moisture anomalies from GLDAS NOAH from 2003 to 2011. (a) First layer of soil moisture (0–10 cm); (b) Second layer of soil moisture (10–40 cm); (c) Third layer of soil moisture (40–100 cm); (d) Fourth layer of soil moisture (100–200 cm); (e) Combination of four layers of soil moisture (0–200 cm).
Water 08 00415 g009aWater 08 00415 g009b
Figure 10. Time series of the oil extractions anomalies as equivalent water thickness from 2003 to 2012.
Water 08 00415 g010
Figure 11. Time series of the groundwater anomalies obtained from GRACE after subtracting the oil and soil moisture contribution, years 2003 to 2011.
Water 08 00415 g011
Figure 12. Yearly groundwater anomalies for the UAE, from 2003 to 2010.
Water 08 00415 g012
Figure 13. Time series of desalinated water produced from 2003 to 2012.
Water 08 00415 g013
Figure 14. Precipitation time series obtained from TRMM from 2003 to 2013.
Water 08 00415 g014
Figure 15. Precipitation correlation analysis between ground stations data (horizontal axis) and TRMM measurements (vertical axis) in six ground stations in the UAE.
Water 08 00415 g015
Figure 16. Time series of increment of water storage (∆Sw) obtained from GRACE terrestrial water storage change after subtracting oil contribution.
Water 08 00415 g016
Figure 17. Evapotranspiration time series obtained from the water budget equation from 2003 to 2012.
Water 08 00415 g017

