
Water Footprint of Milk Produced and Processed in South Africa: Implications for Policy-Makers and Stakeholders along the Dairy Value Chain


Abstract
:1. Introduction
2. Methodology
2.1. Conceptual Framework and Empirical Models
2.2. Sustainability Assessment
2.3. Data Description
3. Results and Discussion
3.1. Water Usage in Feed Production for Dairy Cows
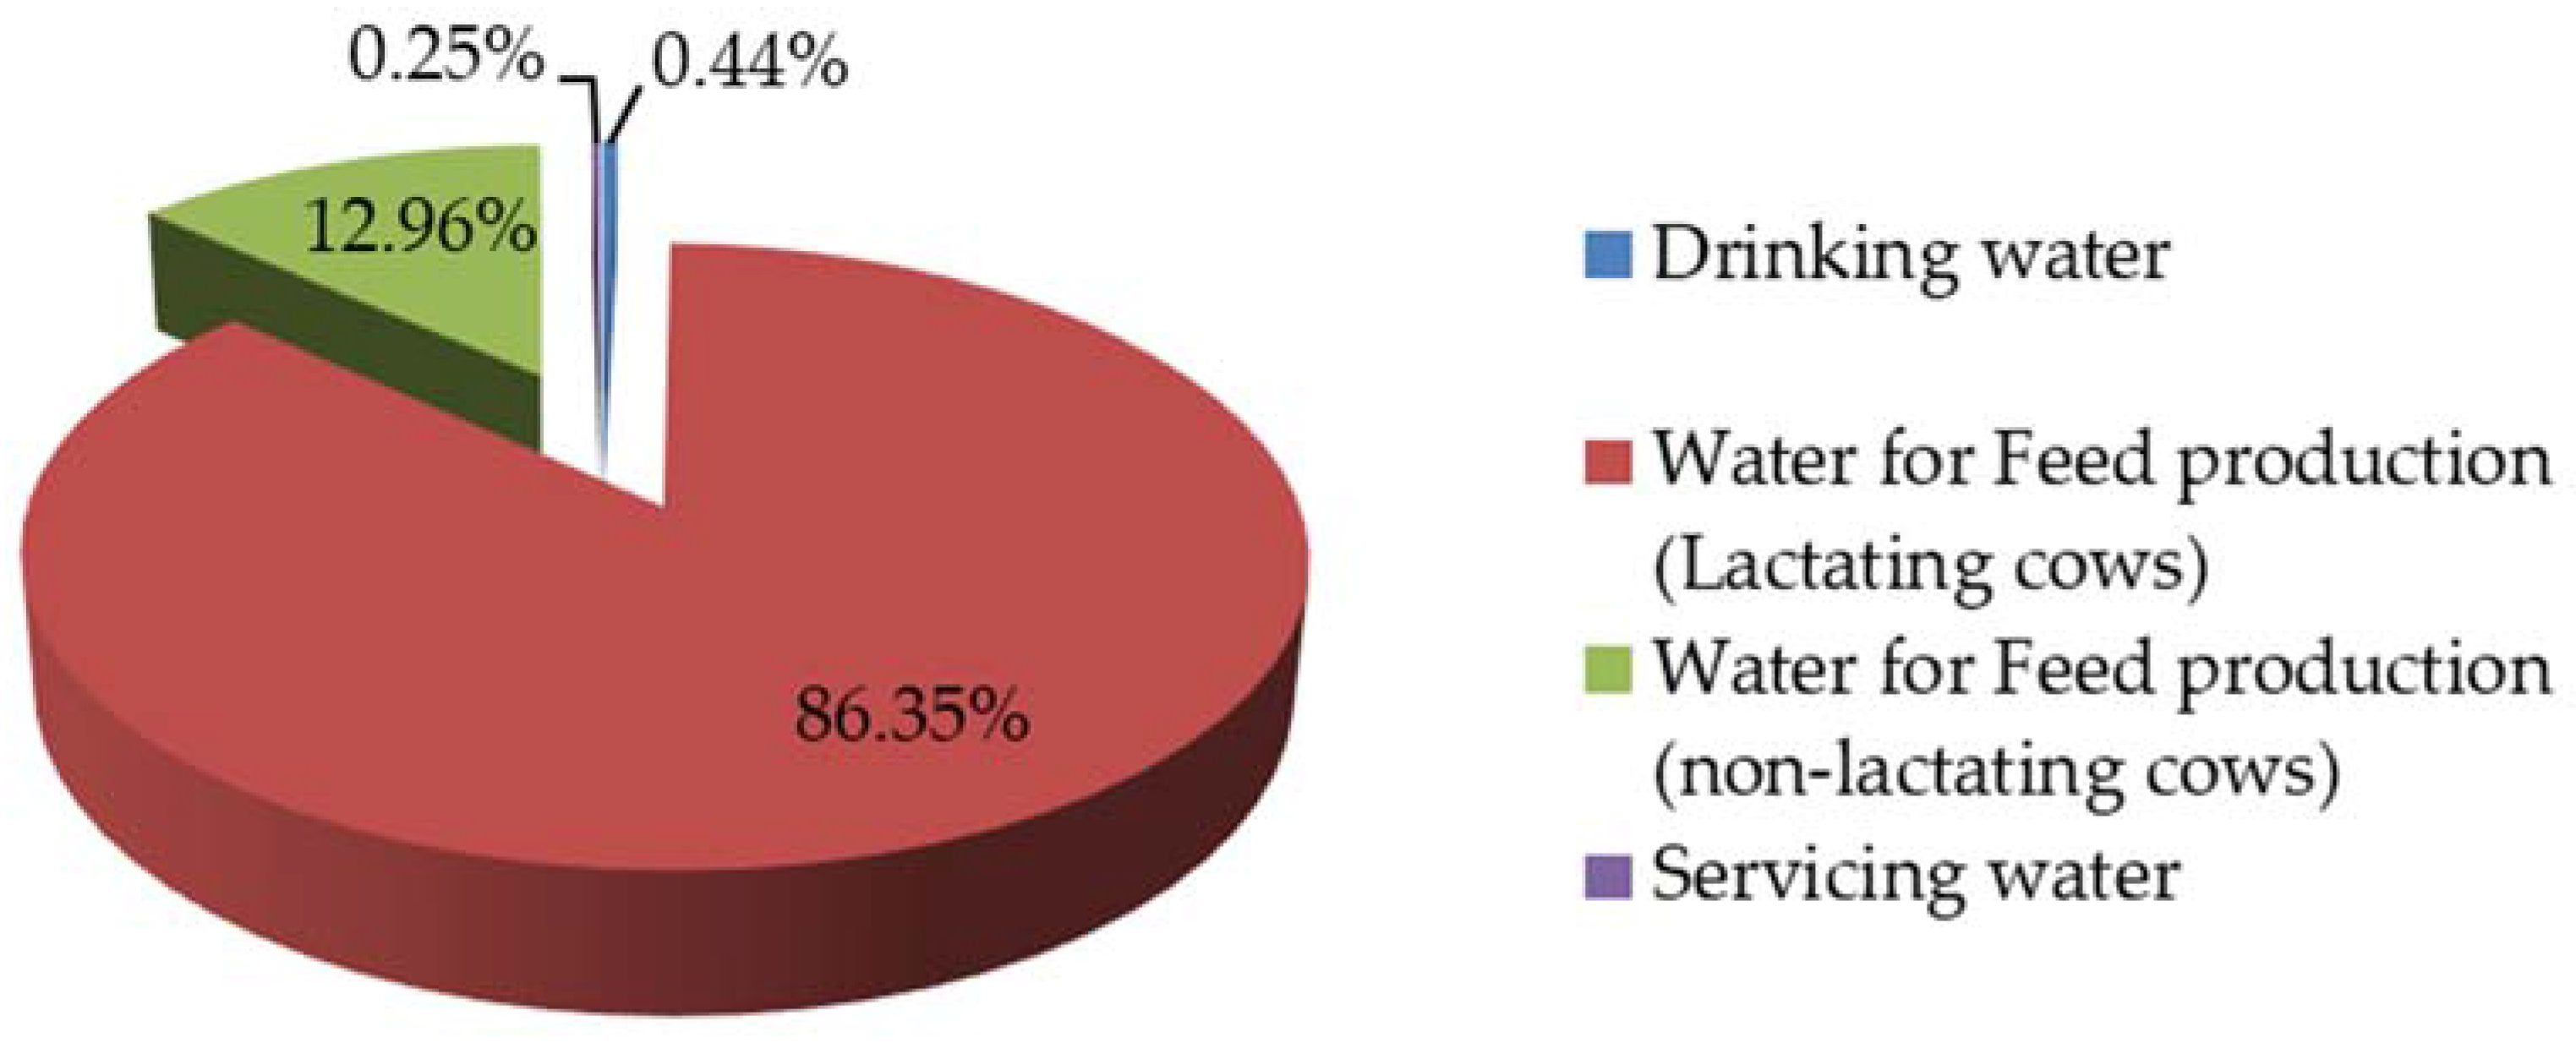
3.2. Water Intake by Cattle Herd and Service Water at the Processing Plants
3.3. Water Footprint of Milk
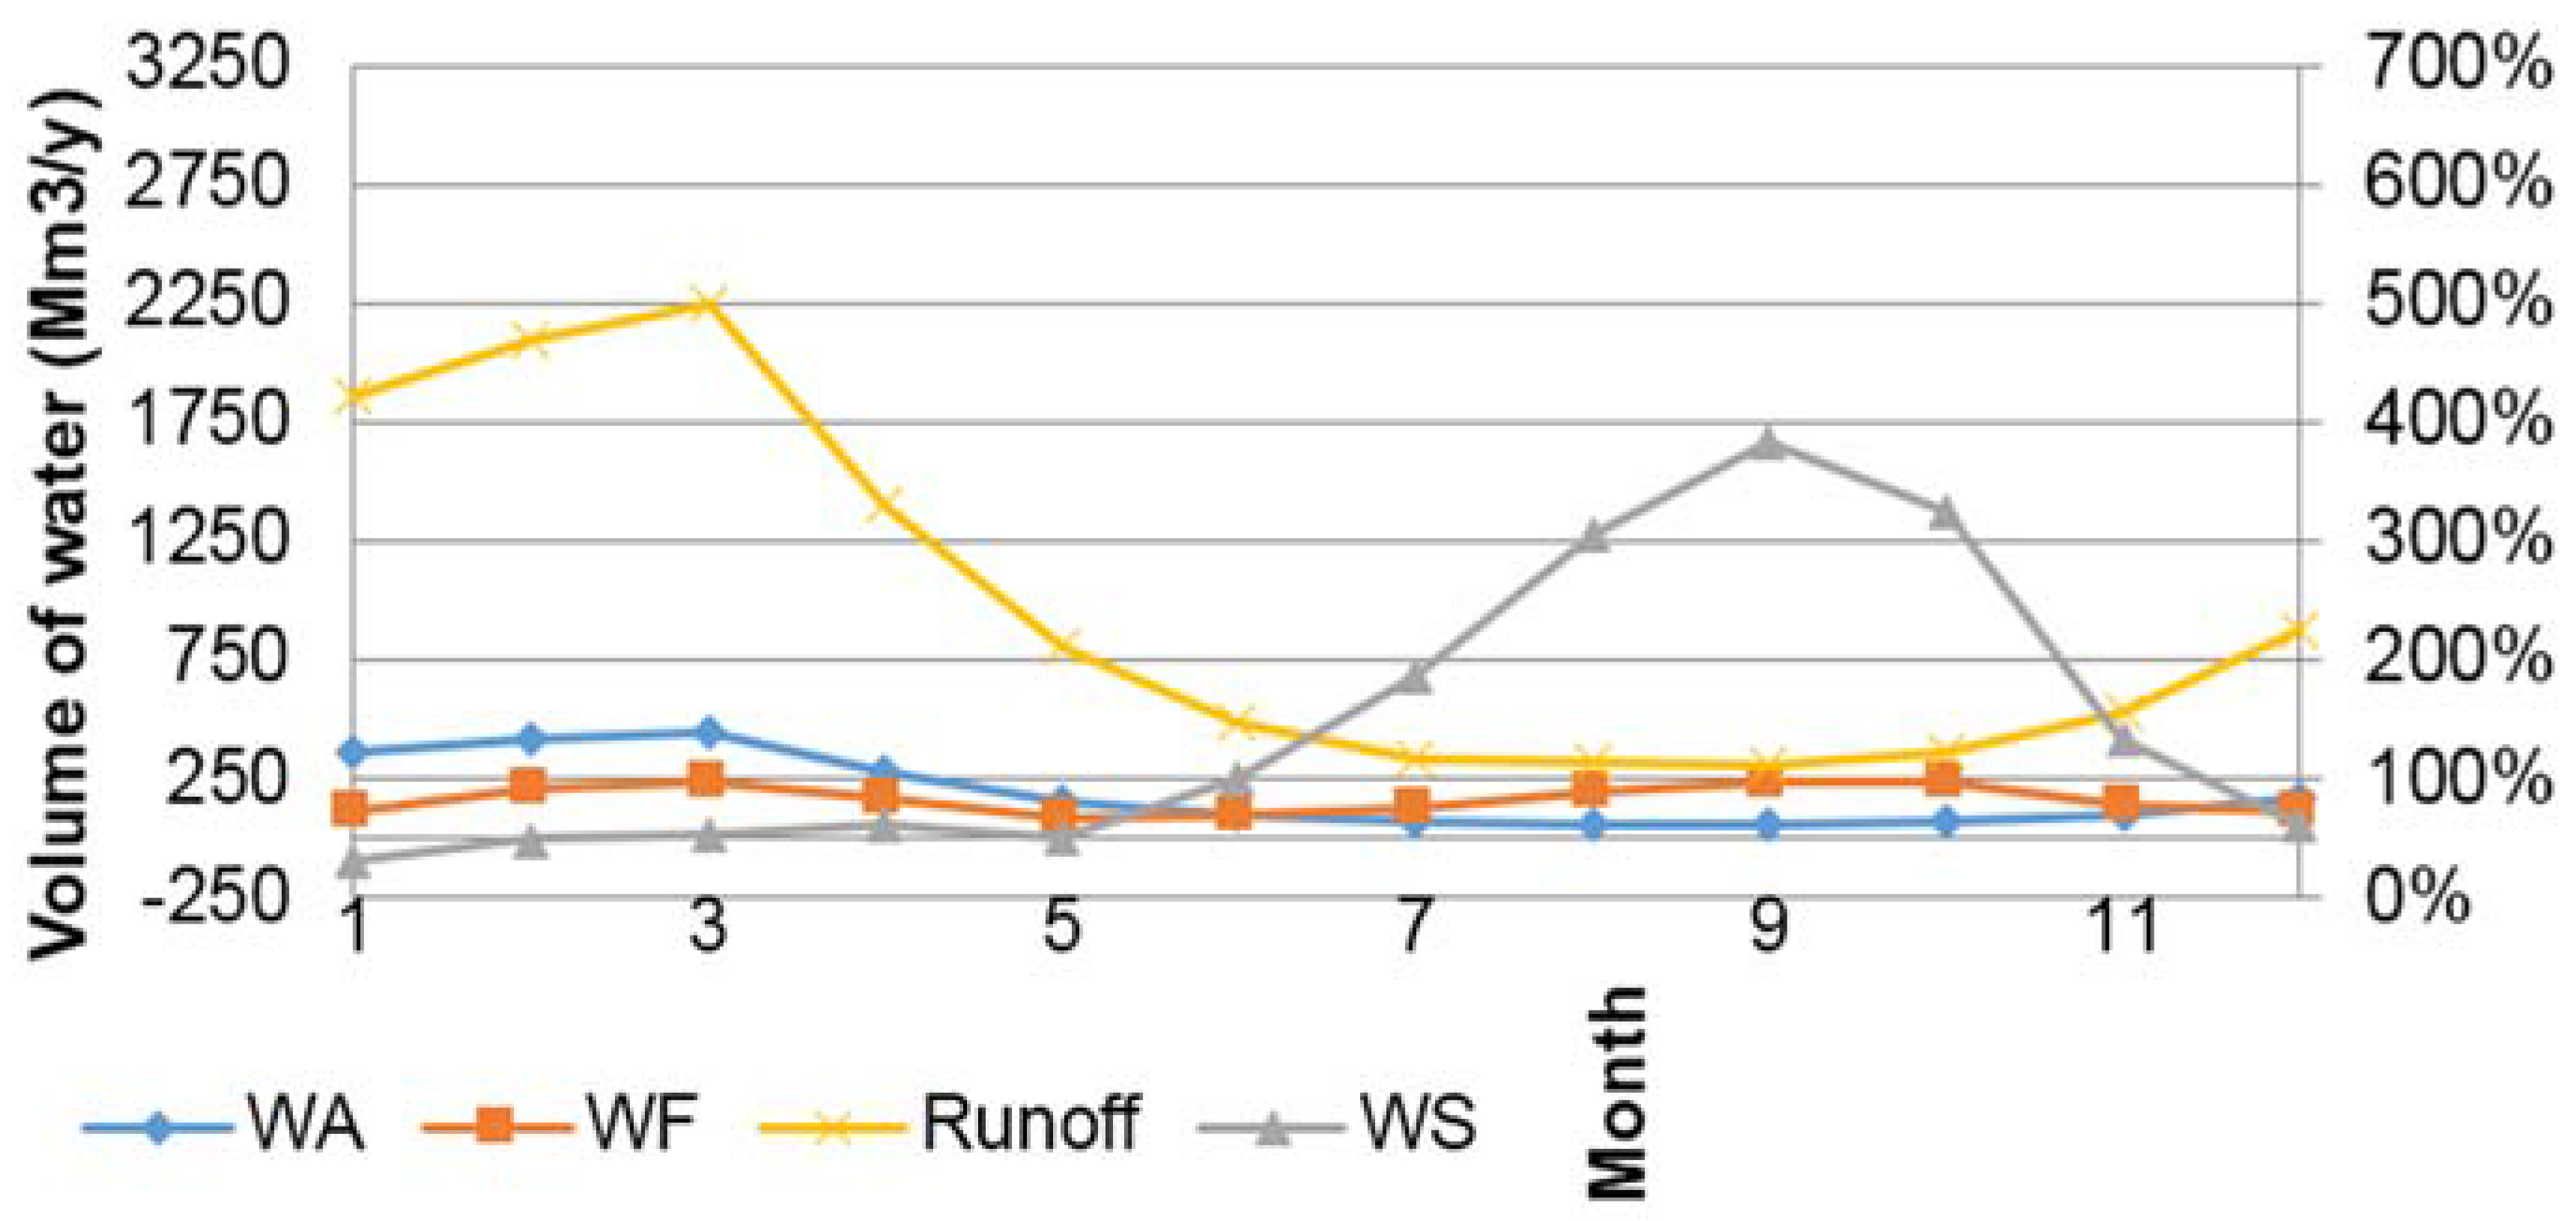
3.4. Sustainability Assessment
4. Conclusions
Acknowledgment
Author Contributions
Conflicts of Interest
References
- International Water Management Institute (IWMI). Water for Food, Water for Life: A Comprehensive Assessment of Water Management in Agriculture; International Water Management Institute Earthscan: London, UK, 2007. [Google Scholar]
- Ridoutt, B.G.; Page, G.; Opie, K.; Huang, J.; Bellotti, W. Carbon, water and land use footprints of beef cattle production systems in southern Australia. J. Clean. Prod. 2014, 73, 24–30. [Google Scholar] [CrossRef]
- Hoekstra, A.Y.; Chapagain, A.K.; Aldaya, M.M.; Mekonnen, M.M. The Water Footprint Assessment Manual: Setting the Global Standard; Earthscan: London, UK, 2011. [Google Scholar]
- Zonderland-Thomassen, M.A.; Lieffering, M.; Ledgar, S.F. Water footprint of beef cattle and sheep produced in New Zealand: Water scarcity and eutrophication impacts. J. Clean. Prod. 2014, 73, 253–262. [Google Scholar] [CrossRef]
- Godfray, H.C.J.; Beddington, J.R.; Crute, I.R.; Haddad, L.; Lawrence, D.; Muir, J.F.; Pretty, J.; Robinson, S.; Thomas, S.M.; Toulmin, C. Food security: The challenge of feeding 9 billion people. Science 2010, 327, 812–818. [Google Scholar] [CrossRef] [PubMed]
- Huang, J.; Xu, C.; Ridoutt, B.; Liu, J.; Zhang, H.; Chen, F.; Li, Y. Water availability footprint of milk and milk products from large scale dairy production systems in Northeast China. J. Clean. Prod. 2014, 79, 91–94. [Google Scholar] [CrossRef]
- Matlock, M.; Thoma, G.; Cummings, E.; Cothren, J.; Leh, M.; Wilson, J. Geospatial analysis of potential water use, water stress, and eutrophication impacts from US dairy production. Int. Dairy J. 2012, 31, 78–90. [Google Scholar] [CrossRef]
- Amarasinghe, U.; Smakhtin, V.; Sharma, B.; Eriyagama, N. Water Footprints of Milk Production: A case study in the Moga District of Punjab, India. 2010. Available online: https://cgspace.cgiar.org/handle/10568/39991 (accessed on 28 July 2016).
- Drastig, K.; Prochnow, A.; Kraatz, S.; Klauss, H.; Plochl, M. Water footprint analysis for the assessment of milk production in Brandenburg—Germany. Adv. GeoSci. 2010, 27, 65–70. [Google Scholar] [CrossRef]
- DeBoer, I.; Hoving, I.; Vellinga, T.; VandeVen, G.; Leffelaar, P.; Gerber, P. Assessing environmental impacts associated with freshwater consumption along the life cycle of animal products: The case of Dutch milk production in Noord-Brabant. Int. J. Life Cycle Assess. 2013, 18, 193–203. [Google Scholar] [CrossRef]
- Manazza, J.F.; Iglesias, D.H. Water footprint in milk agrifood chain in the sub-humid and semi-arid central region of Argentina. In Proceedings of the International Association of Agricultural Economists (IAAE) Triennial Conference, Foz do Iguaçu, Brazil, 18–24 August 2012.
- Bosire, C.K.; Ogutu, J.O.; Said, M.Y.; Krol, M.S.; de Leeuw, J.; Hoekstra, A.Y. Trends and spatial variation in water and land footprints of meat and milk production systems in Kenya. Agric. Ecosyst. Environ. 2015, 205, 36–47. [Google Scholar] [CrossRef]
- Mekonnen, M.M.; Hoekstra, A.Y. A global assessment of the water footprint of farm animal products. Ecosystems 2012, 15, 401–415. [Google Scholar] [CrossRef]
- Hoekstra, A.Y. The hidden water resource use behind meat and dairy. J. Abbr. 2012, 2, 2008–2013. [Google Scholar] [CrossRef]
- Mekonnen, M.M.; Hoekstra, A.Y. The Green, Blue and Grey Water Footprint of Farm Animals and Animal Products Volume 2: Appendices; Value of Water Research Report Series No. 48; UNESCO-IHE: Delft, The Netherlands, 2010; Available online: http://www.waterfootprint.org/Reports/Report-48-WaterFootprint-AnimalProducts-Vol2.pdf (accessed on 19 February 2016).
- Scheepers, M.E.; Jordaan, H. Assessing the blue and green water footprint of lucerne for milk production in South Africa. Sustainability 2016, 8, 49. [Google Scholar] [CrossRef]
- Department of Water Affairs. Strategic Overview of the Water Sector in South Africa, Pretoria: Department of Water Affairs. Available online: http://nepadwatercoe.org/wp-content/uploads/Strategic-Overview-of-the-Water-Sector-in-South-Africa-2013.pdf (accessed on 4 January 2016).
- Backeberg, G.R.; Reinders, F. Institutional Reform and Modernisation of Irrigation Systems in South Africa. Available online: http://saili.co.za/sites/default/files/Backeberg%20-%20Institutional%20reform%20and% 20modernisation.pdf (accessed on 4 January 2016).
- Department of Agriculture Forestry and Fisheries (DAFF). Abstract of Agricultural Statistics; Department of Water Affairs: Pretoria, South Africa, 2014; Available online: http://www.nda.agric.za/docs/statsinfo/Ab2012.pdf (accessed on 4 January 2016).
- Chapagain, A.K.; Hoekstra, A.Y. Water Footprints of Nations; Value of Water Research Report Series No. 16; UNESCO-IHE: Delft, The Netherlands, 2004. [Google Scholar]
- Mekonnen, M.M.; Hoekstra, A.Y. The Green, Blue and Grey Water Footprint of Farm Animals and Animal Products Volume 1: Main Report; Value of Water Research Report Series No. 50; UNESCO-IHE: Delft, The Netherlands, 2010; Available online: http://www.waterfootprint.org/Reports/Report50-NationalWaterFootprints-Vol1.pdf (accessed on 19 February 2016).
- Mekonnen, M.M.; Hoekstra, A.Y. The Green, Blue and Grey Water Footprint of Crops and Derived Crop Products Volume 1: Main Report; Value of Water Research Report Series No. 47; UNESCO-IHE: Delft, The Netherlands, 2010; Available online: http://www.waterfootprint.org/Reports/Report47-WaterFootprintCrops-Vol1.pdf (accessed on 16 February 2015).
- Berger, M.; Finkbeiner, M. Water footprinting: How to address water use in Life Cycle Assessment? Sustainability 2010, 2, 919–944. [Google Scholar] [CrossRef]
- Chapagain, A.K.; Hoekstra, A.Y. Virtual Water Flows between Nations in Relation to Trade in Livestock and Livestock Products; Value of Water Research Report Series No. 13; UNESCO-IHE: Delft, The Netherlands, 2003; Available online: www.waterfootprint.org/Reports/Report13.pdf (accessed on 16 February 2015).
- Hoekstra, A.Y.; Mekonnen, M.M.; Chapagain, A.K.; Mathews, R.E.; Richter, B.D. Global monthly water scarcity: Blue water footprints versus blue water availability. PLoS ONE 2012, 7, e32688. [Google Scholar] [CrossRef] [PubMed]
- Van Rensburg, L.; Barnard, J.H.; Bennie, A.T.P.; Sparrow, J.B.; du Preez, C.C. Managing Salinity Associated with Irrigation at Orange-Riet at Vaalharts Irrigation Schemes; Water Research Commission (WRC): Pretoria, South Africa, 2012. [Google Scholar]
- Milk, S.A. The Milk SA Guide to Dairy Farming in South Africa, 2nd ed.; Agri Connect (Pty) Ltd.: Brooklyn Square, South Africa, 2014; Available online: http://www.milksa.co.za/sites/default/files/The Milk SA guide to dairy farming in South Africa-2nd edition.pdf (accessed on 1 December 2014).
- Stalker, L.; Meyer, T.; Volesky, J.; Adams, D.; Funston, R.; Klopfenstein, T.; Schacht, W. Technical Note: Estimating beef-cattle forage demand: Evaluating the animal unit concept. Prof. Anim. Sci. 2012, 28, 664–669. [Google Scholar]
- Bowling, G.A.; Putnam, D.N. Growth studies with Ayrshire cattle. I. Normal body weights and heights at shoulders for Ayrshire cattle. J. Dairy Sci. 1943, 26, 47–52. [Google Scholar] [CrossRef]
- Ensminger, M.; Heinemann, W.; Oldfield, J. Feeds & Nutrition, 2nd ed.; The Ensminger Publishing Company: Clovis, CA, USA, 1990. [Google Scholar]
- Little, W.; Shaw, S. A note on the individuality of the intake of drinking water by dairy cows. Anim. Prod. 1978, 26, 225–227. [Google Scholar] [CrossRef]
- Hutjens, M.F. Practical approaches to feed efficiency and applications on the farm. In Proceedings of the Penn State Dairy Nutrition Workshop, Penn State University, College Station, TX, USA, 13–14 November 2007; Available online: http://articles.extension.org/pages/26134/practical-approaches-to-feed-efficiency-and-applications-on-the-farm (accessed on 20 January 2016).
- Hoekstra, A.Y.; Mekonnen, M.M. Global Monthly Water Scarcity: Blue Water Footprints Versus Blue Water Availability for the World’s Major River Basins; UNESCO-IHE: Delft, The Netherlands, 2011. [Google Scholar]
- Cosentino, C.; Adduci, F.; Musto, M.; Paolino, R.; Freschi, P.; Pecora, G.; D’Adamo, C.; Valentini, V. Low vs. high “water footprint assessment” diet in milk production: A comparison between triticale and corn silage based diets. Emir. J. Food Agric. 2015, 27, 312–317. [Google Scholar] [CrossRef]

| Product | Kg DM | % | Herd Total | Tonne | m3/Tonne | Blue m3/year | Green m3/year | Grey m3/year | Total WF m3/year |
|---|---|---|---|---|---|---|---|---|---|
| Lucerne | 1533 | 17.3 | 1,264,725 | 1265 | 459 | 217,942 | 263,165 | 99,682 | 580,789 |
| Oats Silage | 402 | 4.6 | 331,650 | 332 | 412 | 103,587 | 23,397 | 9965 | 136,949 |
| Sorghum Silage | 949 | 10.7 | 782,925 | 783 | 317 | 122,421 | 107,529 | 18,031 | 247,981 |
| Maize Silage | 1424 | 16.1 | 1,174,800 | 1175 | 338 | 188,961 | 179,215 | 28,872 | 397,048 |
| Maize meal | 2738 | 31.0 | 2,258,850 | 2259 | 1086 | 0 | 2,256,175 | 195,969 | 2,452,144 |
| HPC | 1789 | 20.3 | 1,475,925 | 1476 | 1785 | 74,643 | 2,512,770 | 47,560 | 2,634,973 |
| Soy oilcake | – | – | – | – | – | 53,400 | 1,662,502 | 8797 | 1,724,699 |
| Sun flower oilcake | – | – | – | – | 21,207 | 850,268 | 38,800 | 910,275 | |
| Total | 8833 | 100 | 7,288,875 | 7290 | 4397 | 782,161 | 7,855,021 | 447,676 | 9,084,858 |
| Parameters | Number of Animals | Live Weight (Kg) | DMI | m3/year | |||
|---|---|---|---|---|---|---|---|
| % of BW | Kg | Total | Tonne | 385 m3/tonne | |||
| Dry cows | 399 | 544.31 | 2.37% | 12.90 | 5147.10 | 5.15 | 723,704 |
| Heifers | 886 | – | – | – | – | – | – |
| 0–6 months | 220 | 62.14 | 1.50% | 0.93 | 204.60 | 0.20 | 28,105 |
| 6–12 months | 206 | 171.38 | 2.10% | 3.60 | 741.6 | 0.74 | 103,989 |
| 12–18 months | 238 | 259.68 | 2.15% | 5.58 | 1328.04 | 1.33 | 186,898 |
| 18–24 months | 156 | 332.48 | 2.20% | 7.31 | 1140.36 | 1.14 | 160,199 |
| 24+ months | 66 | 479.38 | 2.30% | 11.03 | 727.98 | 0.73 | 102,583 |
| Bulls | 23 | 589.67 | 3.00% | 17.69 | 406.87 | 0.41 | 57,615 |
| Total | 1308 | 2439.04 | – | 59.04 | 9696.55 | 9.70 | 1,363,093 |
| Parameters | Water Intake | Service Water | |||
|---|---|---|---|---|---|
| Number of Animals | m3/animal/year | Total (m3/year) | Cleaning and Sanitation | m3/year | |
| Total herd size | 2133 | – | – | Inline Pasturators | 2190 |
| Lactating cows | 825 | 38 | 31,350 | Cream Tank | 584 |
| Dry cows | 399 | 16 | 6384 | Milk Tanks | 10,950 |
| Heifers | 886 | – | – | Intake | 730 |
| 0–6 months | 220 | 5 | 1100 | Fillers | 2190 |
| 6–12 months | 206 | 8 | 1648 | Floors | 2190 |
| 12–18 months | 238 | 11 | 2618 | Milking Apparatus | 3650 |
| 18–24 months | 156 | 14 | 2184 | Other uses | 3650 |
| 24+ months | 66 | 15 | 990 | – | – |
| Bulls | 23 | 18 | 414 | – | – |
| Total | 2133 | – | 46,688 | – | 26,134 |
| Average yearly production per cow (tonne) | 9.426 | – | |||
| Parameters | Yield (tonne/year) | Blue (m3/year) | Green (m3/year) | Grey (m3/year) | Total (m3/year) |
|---|---|---|---|---|---|
| Drinking Water | |||||
| Lactating cows | – | 31,350 | – | – | 31,350 |
| Non-lactating animals | – | 15,338 | – | – | 15,338 |
| Feed Production Water | |||||
| Lactating cows | – | 782,161 | 7,855,021 | 447,676 | 9,084,858 |
| Non-lactating animals | – | – | 1,363,093 | – | 1,363,093 |
| Total yearly Water Usage | 828,849 | 9,218,114 | 447,676 | 10,494,639 | |
| Yearly Milk Production | 7776.45 | – | – | – | – |
| Total yearly Production Water | 107 m3/tonne | 1185 m3/tonne | 58 m3/tonne | 1350 m3/tonne | |
| Service Water | |||||
| Service | – | – | – | 26,134 | 26,134 |
| Yearly Milk Processed | 13,196.58 | – | – | – | – |
| Total Yearly Servicing Water | 0 m3/tonne | 0 m3/tonne | 2 m3/tonne | 2 m3/tonne | |
| Milk Water Footprint (m3/tonne) | 107 m3/tonne | 1185 m3/tonne | 60 m3/tonne | 1352 m3/tonne | |
© 2016 by the authors; licensee MDPI, Basel, Switzerland. This article is an open access article distributed under the terms and conditions of the Creative Commons Attribution (CC-BY) license (http://creativecommons.org/licenses/by/4.0/).
Share and Cite
Owusu-Sekyere, E.; Scheepers, M.E.; Jordaan, H. Water Footprint of Milk Produced and Processed in South Africa: Implications for Policy-Makers and Stakeholders along the Dairy Value Chain. Water 2016, 8, 322. https://doi.org/10.3390/w8080322
Owusu-Sekyere E, Scheepers ME, Jordaan H. Water Footprint of Milk Produced and Processed in South Africa: Implications for Policy-Makers and Stakeholders along the Dairy Value Chain. Water. 2016; 8(8):322. https://doi.org/10.3390/w8080322
Chicago/Turabian StyleOwusu-Sekyere, Enoch, Morné Erwin Scheepers, and Henry Jordaan. 2016. "Water Footprint of Milk Produced and Processed in South Africa: Implications for Policy-Makers and Stakeholders along the Dairy Value Chain" Water 8, no. 8: 322. https://doi.org/10.3390/w8080322