Abstract
The dissolved salt ions that are not absorbed during irrigation of greenhouse crops are gradually accumulated in the nutrient solution resulting in levels of salinity high enough to damage the crops. This water salinity presents operational and environmental challenges as the nutrient-rich greenhouse effluent should be discharged to the environment when deemed unsuited for irrigation. In this pilot-scale study, the potential of passive salt reduction (phytodesalination) in gravel and wood-chip flow-through reactors was evaluated using seven plant species including Schoenoplectus tabernaemontani, Andropogon gerardii, Typha angustifolia, Elymus canadensis, Panicum virgatum, Spartina pectinata and Distichlis spicata along with an unplanted control reactor. While the unplanted system outperformed the planted units with gravel media, the wood-chip bioreactors with S. tabernaemontani and S. pectinata improved the greenhouse effluent reducing the solution conductivity (EC) by a maximum of 15% (average = 7%). S. tabernaemontani and D. spicata showed higher accumulated contents of Na+ and Cl− in comparison with T. angustifolia and S. pectinata. Overall, S. tabernaemontani was selected as the most capable species in the wood-chip bioreactors for its better salt management via EC reduction and salt accumulation. It was however concluded that further treatment would be required for the greenhouse effluent to meet the stringent irrigation water quality guidelines in order not to pose any adverse effects on sensitive crops. Finally, the present hydraulic residence time (HRT = 3.7 days) and the solution salinity concentration were identified as the potential factors that may be limiting the efficiency of plant salt uptake, emphasizing the need for conducting more research on the optimization and enhancement of passive desalination systems for the greenhouse effluent.
1. Introduction
The crop production in greenhouses is recognized as an efficient and year-around farming practice, mainly for its crop productivity and controlled use of resources. However, the gradual accumulation of major salt ions in the closed-system greenhouses degrades the quality of the irrigation water. Salinity is known as an environmental stress that leads to structural and ultrastructural effects in salt sensitive species, and limits their growth and development [1]. For instance, high concentrations of specific ions such as Na+, Cl− and SO42− as well as high activities of Na+ compared to Mg2+ and Ca2+ can result in growth reduction or injury in many crops due to various responses induced in the plants [2]. Therefore, the detrimental effects of the increased salinity on the recirculated irrigation water causes this otherwise sustainable farming practice to become undesirable and less efficient. Moreover, the risk of introducing salts and consequently reducing the water availability to sensitive vegetables may persuade the growers to simply discharge their greenhouse effluent to the environment, releasing high loads of nutrients to the nearby waters. It is therefore greatly beneficial to investigate effective salinity reduction systems which can facilitate reusing the greenhouse effluent and protect the surrounding water resources.
Due to the large energy investments required in existing advanced water desalination technologies [3], these methods are not economically viable for many smaller and private greenhouse operators. As such, the use of specifically designed energy-efficient technologies such as constructed wetlands (CWs) and ecological bioreactors are more appealing to the greenhouse industry, as these treatment methods offer lower capital and maintenance costs.
Halophytes are classified as plants that are adapted to live in a saline environment such as seawater, a salt-water marsh or a salt desert by means of mechanisms such as osmotic adjustment and ion compartmentalization in their vacuoles [4]. While the high tolerance of halophytes to salinity is recognized as the common characteristic of these species, there is no universally-agreed definition for these plants [5,6]. Although some authors base their definition on the plants ability to complete the life cycle in a rather high salinity level of about 11.7 g NaCl L−1 (200 mM NaCl) [6], a recent database presents a broader list of halophytes by including the species that can tolerate a minimum salinity of 4.7 g NaCl L−1 (80 mM NaCl) [7].
In regard to the passive desalination techniques, the application of halophytes for phytoremediation of the saline soils and successful accumulation of salt ions in the plant tissue have previously been reported [8,9,10]. However, available publications on the assessment of the salt-accumulating plants, specifically focused on application in water desalination are scarce. In the limited studies available, the use of halophytic species in CWs was reported as a novel strategy to reduce salinity by Na+ uptake [11]. In addition, several halophytic species have demonstrated the capability of accumulating Na+ and Cl− in their tissue when the species were exposed to the simulated greenhouse effluent [12].
While there exist publications that encourage phytodesalination, the salt reduction performance of passive systems for treatment of the greenhouse effluent is not conclusive, and the research in this area is still ongoing. It is of particular interest to evaluate the quality of the post treatment greenhouse effluent in order to gauge the potential of water recycle for repeated irrigation.
The objective of this study was to investigate the treatment capacity of hybrid reactors intended to promote phytodesalination to improve the greenhouse effluent quality. The plant species and the media substrate were the two design factors, the effects of which were evaluated on the quality of the treated greenhouse effluent. It was hypothesized that the treatment performance of hybrid reactors in reducing salinity from the greenhouse effluent would differ between the units with particular species or fill substrate. Moreover, the evaluation of these potential differences would provide the information needed to optimize the treatment system for a more efficient design.
2. Materials and Methods
The first pilot-scale experiment was conducted at the Centre for Alternative Wastewater Treatment (CAWT) located in Lindsay, ON, Canada. The objective of this study was to compare the performance of five plant species in order to identify the ones with potential capability in enhancing the quality of the greenhouse effluent. At this preliminary stage, the biological influence of the reactors fill material on the overall performance of the system was minimized by selecting a relatively inert substrate (gravel) as the main media.
The second component of this study was conducted at the laboratory of the Department of Civil Engineering at Queen’s University located in Kingston, ON, Canada. The scope of this research phase was to measure the performance of wood-chip bioreactors designed to incorporate phytotechnology in a pilot-scale experiment, and to compare these results to those from the gravel reactors.
2.1. Plant Selection: Gravel Reactors
Five different plant species were selected including softstem bulrush (Schoenoplectus tabernaemontani C.C. Gmel. Palla), big bluestem (Andropogon gerardii Vitman), narrowleaf cattail (Typha angustifolia L.), Canada wildrye (Elymus canadensis L.) and switchgrass (Panicum virgatum L.). The criteria for this selection comprised the information in the literature regarding plants salt tolerance, native status to most parts of North America and particularly eastern Canada, local availability and non-invasiveness according to local regulations. The ease of access to the selected plants for greenhouse operators in the region was an important criterion as well. It should be noted that the regional climate conditions of the season did not allow to choose other promising species. The plants were acquired in the form of young seedlings (30 to 120 cm in height depending on the plant) from local nurseries located in Ontario.
2.2. Plant Selection: Wood-Chip Bioreactors
During the Phase 1 operation of the wood-chip bioreactors, the same type of plant species listed in Section 2.1, with the exception of A. gerardii, were sourced and planted in the wood-chip bioreactors. A. gerardii was excluded due to its unsatisfactory performance and short survival period during the previous gravel reactor testing. Upon further monitoring of the plants and their performance, E. canadensis and P. virgatum were replaced in Phase 2 by prairie cordgrass (Spartina pectinata Bosc ex Link) and saltgrass (Distichlis spicata L. Greene) respectively. The other 2 species, namely S. tabernaemontani and T. angustifolia were continuously in use as the operation transitioned from Phase 1 into Phase 2. A list of the plants in operation and the timeline of each experiment phase are displayed in Table 1.

Table 1.
Experimental timeline for gravel and wood-chip reactors and active species in each period.
2.3. Gravel Reactors Setup
The plants were tested in 220 L barrels (56 cm in diameter, 90 cm in height). Six reactors were operated in parallel including five units planted with five different species and one unplanted unit used as control. All the reactors were filled with 3/8 in (9.5 mm) gravel with no fines or sand to a height of 80 cm. The number of the individual plants for each species implanted in each barrel was visually estimated as such to allow equal cover density on the surface of all the units (7 to 8 plants per barrel, approximate density: 30 plants m−2). Figure 1 displays a schematic of one planted reactor. Each unit was fed with synthetic greenhouse effluent (hereafter referred to as the influent) distributed on the surface by means of a perforated PVC grid. The collection grid, identical to the distribution grid, was positioned at the bottom of the barrel. Water level was maintained at the surface of the gravel media by connecting the outlet pipe to the collection grid, which provided a saturated hydraulic condition with low levels of dissolved oxygen within the reactor. The solution traveling in a vertical down-flow direction was collected from the bottom of the reactor and discharged through the outlet pipe. The samples for water quality analysis were collected from this discharged solution.
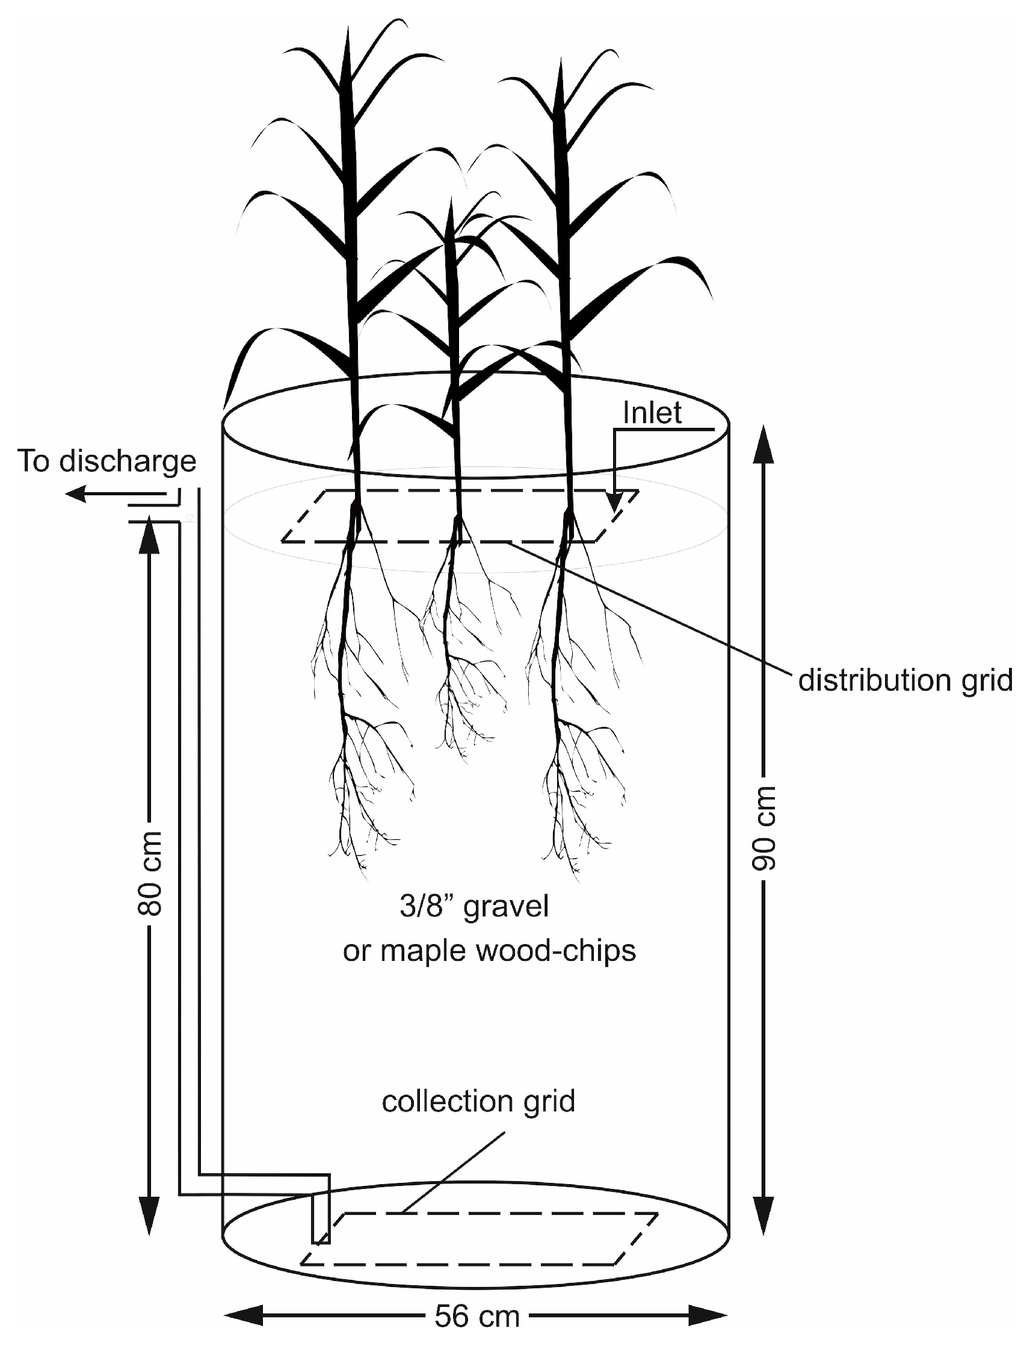
Figure 1.
One planted reactor with gravel (Section 2.3) or wood-chip (Section 2.4) media.
The simulated influent was prepared by dissolving commercial fertilizer (®Plant-Prod 18-6-20 Poinsettia Plus), NaCl and Na2SO4 compounds in tap water. The solution was stored in a 1000 L tank which served as the experiment’s influent reservoir. Dechlorination was found unnecessary as the residual Cl2 concentration in tap water was estimated as 0.5 mg·L−1, and the natural dechlorination in the feed reservoir minimized the potential risk of free Cl2 to the plants.
The actual measured concentrations of some of the key parameters in the influent are shown in Table 2. The concentration values were designed to simulate the characteristics of the greenhouse effluent found in the literature and existing operations, accounting for the variations observed in the generated greenhouse effluent according to various sources. The experiment was set up in a greenhouse where natural sunlight was supplied through glass roof and windows (temperature range: 15–25 °C, average insolation incident on a horizontal surface: 4.8 kWh·m−2·day−1 [NASA Power: power.larc.nasa.gov]). A continuous flow rate of 30 L·day−1 was selected based on the estimates determined from the hydraulic loading rates employed in designing field-scale CWs [13] (personal communication, Rozema, L., 2013) to provide an approximate hydraulic residence time (HRT) of about 3.3 days assuming a porosity of 0.5 for the media (see Section 2.6 for HRT equation).
Table 2.
Average measured concentrations of main parameters in the synthetic influent: mean (± SD), and the typical range of the average concentrations in the greenhouse (GH) effluent. 1 Low (top row) and high (bottom row) average values of typical greenhouse effluent; numbers without reference were directly determined from the data for existing greenhouse operations.
2.4. Wood-Chip Bioreactors Setup
Similar to the gravel reactors, this experiment consisted of open top 220 L dock barrels. The general layout of each bioreactor was similar to the reactor shown in Figure 1, with wood-chips as the main substrate. The wood-chip grains ranged from square to rectangular chips with approximate size of 2–3 cm in longer dimension. The chips were made from hard-wood maple trees and were sourced from an agricultural farmland located in QC, Canada. The wood-chips were stored in open space and were exposed to the elements before delivery to the laboratory.
A total of 5 reactors were tested in parallel. Of the total 5 units, 4 different species were planted in 4 barrels, and one non-vegetated unit was used as the control. A small amount of the native soil attached to the plants roots was kept at the time of planting the reactors in order to reduce the disturbance and shock to the roots. Other operational factors including the distribution of the synthetic influent, the hydraulic flow rate, media depth, vertical (top-bottom) flow direction, plant density and drainage were designed according to the specifications outlined in Section 2.3.
As for the influent, commercial fertilizer (®Plant-Prod 12-2-14 Optimum), NaCl and Na2SO4 compounds were dissolved in deionized water, and the solution was stored in two 500-L tanks which served as the experiment’s influent reservoirs. Table 2 shows the average measured values of the key parameters in the feed solution made as per typical range of the greenhouse effluent characteristics. The small difference between the influents made for the gravel and wood-chip experiments was due to the type of the fertilizer used, and it reflected the variability of the concentrations found in the real greenhouse effluent. The nutrient matrix in the fertilizer used in this experiment provided a yet better representation of the real greenhouse effluent due to its lower ammonium to total nitrogen ratio.
The light for photosynthesis and plant growth was provided by a 1000 W metal halide (MH) lamp operated at 75% ballast power and set to a continuous 16/8 h on/off cycle per 24 h. The average photosynthetic photon flux density (PPFD) at 12.7 cm above the surface of the four planted reactors was recorded as 37.5 μmol·m−2·s−1 using a Quantum Integral Sensor handheld meter, model MQ-100 (Apogee Instruments, Inc., Logan, UT, USA).
A replicate wood-chip bioreactor (ET unit, schematic not displayed) planted with multiple species was employed to determine the overall influence of evapotranspiration, as well as drainable porosity and hydraulic conductivity. The reactor was equipped with a closed-circulation flow system, in which the drained solution was directed back to the influent tank by gravity. The tank was carefully sealed around the connections in order to minimize any water loss from the reservoir due to evaporation. This reactor was also equipped with a bottom valve for draining the barrel for porosity calculations. Moreover, two flexible tubing arrays were used as manometers, one attached through the reactor’s wall just below the water level, and the other connected to the outlet pipe with a vertical spacing of 74 cm between the two tubes. The difference in the water level in the manometers was used to calculate hydraulic conductivity of the wood-chip media.
2.5. Data Collection and Analysis: Gravel Reactors
Weekly and bi-weekly samplings (n, number of samples per reactor = 1) were performed between 12 March 2014 and 2 July 2014 (Table 1), after which the water constituents were analyzed in the CAWT laboratory using standard methods [16]. The data collected from the first sampling event (day 0) was not included in data analysis due to their unusually low values, and thus were considered as outliers. The first 7 days of the operation were therefore interpreted as the acclimation period for the plants. Throughout the experiment, the plants were visually assessed to monitor their growth and compare their survival status with the other species. The change in concentration was calculated according to Equation (1):
where R is the concentration change of the target constituent (%), is the concentration of the constituent in the sample collected at the point of discharge (mg·L−1) and is the concentration of the same constituent in the sample from the influent prior to entering the reactor (mg·L−1). A negative concentration change (R) represented a reduction in the respective parameter while a reported positive value was interpreted as an overall zero treatment in the system due to the occurrence of evapotranspiration or other contributing factors.
A mass balance for a target constituent inside the reactor can be used to define the change of mass with time according to Equation (2):
where is the mass removal rate of the target constituent (mg·day−1), is the incoming flow rate (L·day−1), is the outgoing flow rate (L·day−1) and and are concentrations of the constituent as defined in Equation (1).
On the assumption that evapotranspiration is negligible and hence the incoming and outgoing flow rates are equal ( = = Q), the rate of the constituent’s mass removed over time can be simplified as:
Sodium adsorption ratio (SAR) was defined as:
where , and are concentrations of each element in the water solution in meq·L−1.
One-way ANOVA was used for statistical analysis in order to identify significant differences between the performances of the reactors. In conjunction with this ANOVA test, the Tukey and Dunnett methods were performed to compare the data between the reactors and with respect to the control unit. Difference was reported significant at the 95% level of confidence (p-value < 0.05) when ANOVA, Tukey’s and Dunnett’s analyses were performed using XLStat statistical software (©Addinsoft).
2.6. Data Collection and Analysis: Wood-Chip Bioreactors
Samples were collected on a bi-weekly and monthly basis (n = 2). The collected samples were transferred to an external laboratory (Ottawa, ON, Canada), where samples were analyzed using approved methods. Conductivity (EC) and pH values were determined by Model 30 handheld Salinity, Conductivity and Temperature instrument (YSI Inc., Yellow Springs, OH, USA), and accumet® Model 15 pH meter (Fisher Scientific™, Pittsburgh, PA, USA) at the Department of Civil Engineering at Queen’s University. The visual assessment, rate of concentration change, mass removal and data analysis were defined and calculated as described in Section 2.5.
The total operation time of the wood-chip bioreactors was from 1 October 2014 to 23 October 2015 for 55 weeks (Table 1). The total operation time was divided into 2 phases as 2 of the plant species were substituted (see Section 2.2 for details). The water quality sampling for Phase 1 (27 weeks) commenced on 10 December 2014 to allow for 70 days of acclimation period.
In the second phase (19 weeks), the reactors were provided with 27 days of acclimation period before the first sample collection was conducted on 9 July 2015. The shorter acclimation period in Phase 2 was due to the fact that the reactors had already been in operation before the beginning of this phase. During the transition period from Phase 1 to Phase 2 (8 April 2015 to 11 June 2015, 9 weeks), all the units continued the operation with 2 active species including S. tabernaemontani, T. angustifolia and the control reactor.
Drainable porosity (effective porosity, ), was defined as the volume of water per unit volume of porous material [17] as indicated in Equation (5):
where is the drainable porosity (dimensionless), is the volume (L) of the water drained from the bottom of a saturated bioreactor, and is the volume (L) of the portion of the bioreactor filled with wood-chip media.
The HRT in the bioreactor was calculated according to Equation (6):
where is the hydraulic residence time of the reactor (day), is the drainable porosity (dimensionless), is the volume (L) of the portion of the bioreactor filled with wood-chip media and is the flow rate (L·day−1) of the influent distributed over the reactor’s surface area.
The effect of evapotranspiration was calculated according to Equation (7):
where is the rate of water loss due to evapotranspiration (L·day−1·m−2), is the change of water volume in the reservoir (L) over the period of (day), and A is the reactor’s surface area (m2). In the event when ET is not negligible, causing a considerable reduction in the outgoing flow rate compared to that of the incoming, the water balance can be defined as follows:
where is the outgoing flow rate (L·day−1) reduced by evapotranspiration, and is the incoming flow rate (L·day−1).
Assuming that evapotranspiration is considered as the only process that would cause concentration change in each reactor, there will be no mass change in the system, and hence the general mass balance presented in Equation (2) will be as follows:
where is the incoming flow rate (L·day−1), is the concentration of the constituent in the influent, is the reduced outgoing flow rate due to evapotranspiration (L·day−1), and is the increased concentration of the constituent in outflow due to evapotranspiration.
The rate at which a constituent’s concentration is increased due to evapotranspiration can be defined as:
where is the change of the constituent’s concentration due to evapotranspiration (%). Finally, the equation used for concentration change as a result of evapotranspiration can be derived by combining Equations (8) to (10):
where is the change rate of the constituent’s concentration due to evapotranspiration (%), is the rate of water loss due to evapotranspiration (L·day−1) and is the incoming flow rate (L·day−1).
Hydraulic conductivity (K) was calculated using Darcy’s equation:
where is the incoming flow rate through the reactor (cm3·s−1), K is the hydraulic conductivity (cm·s−1), I is the hydraulic gradient, and A is the cross sectional area of the reactor (cm2) [18,19].
Sampling for the analysis of inorganic elements in the plant tissue, as an indication of salt accumulation, was performed on two occasions on 25 June 2015 (n, number of samples per species = 1) and 16 October 2015 (n = 2). A portion of the above-ground plant biomass (1 to 3 g dry weight) including the leaves and the stems were collected from the mature plants in the reactors. The same method was employed to determine the background content values by sampling the young plant biomass prior to use in the experiment. The shoot samples were removed and chopped into small pieces using a blade before being dried in 70 °C until a constant weight could be reached after about 24 h. The dried samples were then ground in a steel mill to a fine powder, transferred to air-tight sterile plastic tubes and stored in the freezer at a temperature range of −16 °C and −22 °C before analysis at the laboratory of the Analytical Services Unit (ASU) in Kingston, ON, Canada.
The cation analysis was performed by transferring 0.5 g of the ground biomass into a glass crucible and dry ashing in a muffle furnace for 20 min at 150 °C, 1 h at 250 °C and 3 h at 500 °C. The ashed samples were then digested with HNO3 and HCl for 4 h. H2O2 was then added and samples were diluted by deionized water before being filtered and consequently analyzed by Varian, Vista PRO, Axial ICP-OES. For analysis of anions, deionized water was added to 1.0 g of ground plant samples. The samples were then shaken on a horizontal shaker for 1 h at 200 rpm and filtered before being analyzed by IC using Dionex HPLC system (ICS 3000). Plant tissue content was reported based on the plant dry matter weight (g) for all the elements. The accumulated content for each species was determined by subtracting the constituent’s average content found in the young plant tissue from that of the mature plant and was reported as mg·g−1 of dry matter.
3. Results
3.1. Planted Gravel Reactors
The average temperature of the collected samples from the gravel reactors was recorded as 20.6 °C. The performance of the reactors is displayed in Figure 2, Figure 3, Figure 4, Figure 5, Figure 6, Figure 7 and Figure 8. Table 3 and Table 4 summarize the average values of salt ion concentrations over the period of the experiment and their change rate in comparison with the composition of the influent solution.
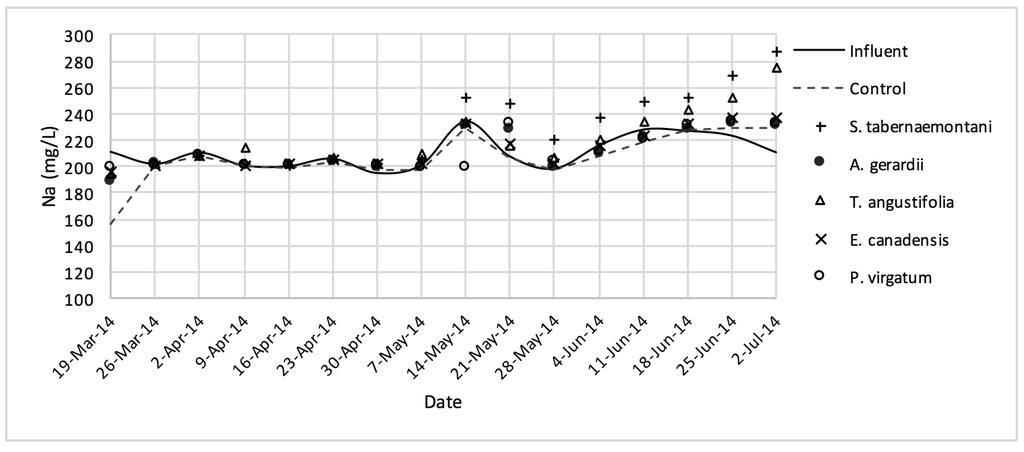
Figure 2.
Na+ concentrations measured over the operation time of the gravel reactors.
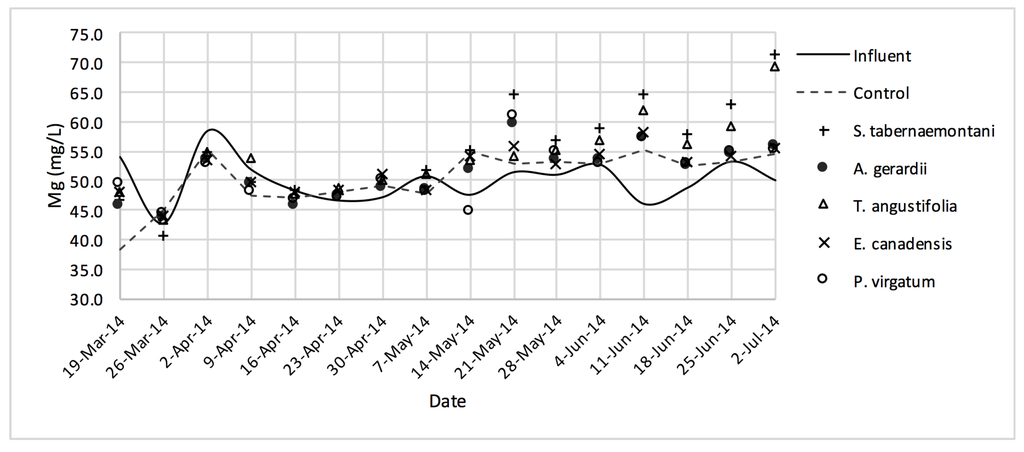
Figure 3.
Mg2+ concentrations measured over the operation time of the gravel reactors.
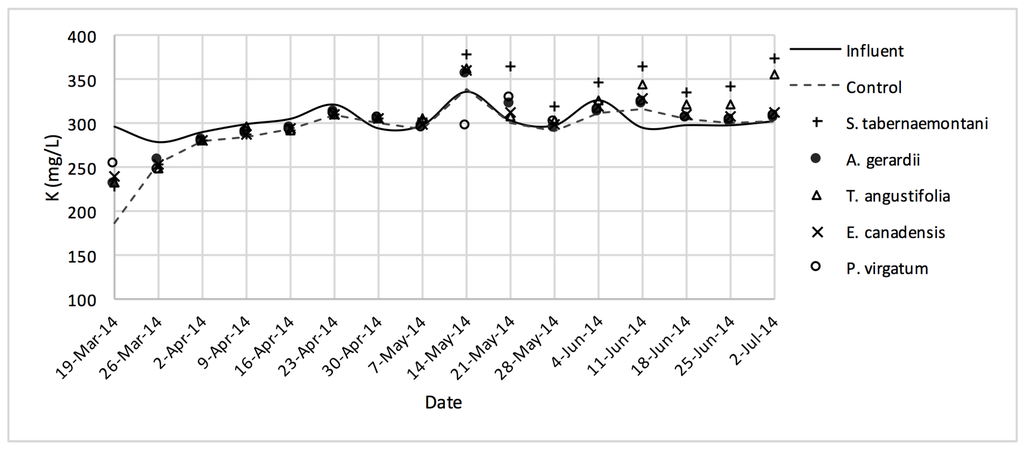
Figure 4.
K+ concentrations measured over the operation time of the gravel reactors.
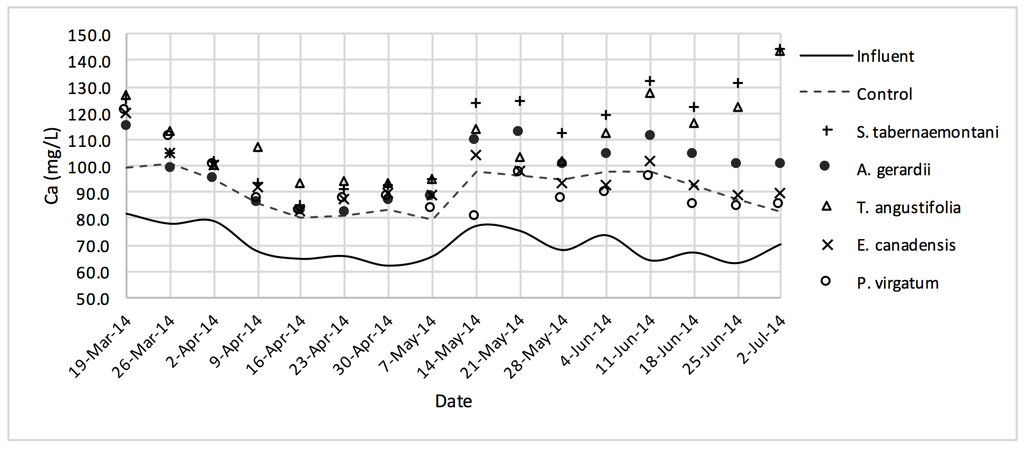
Figure 5.
Ca2+ concentrations measured over the operation time of the gravel reactors.
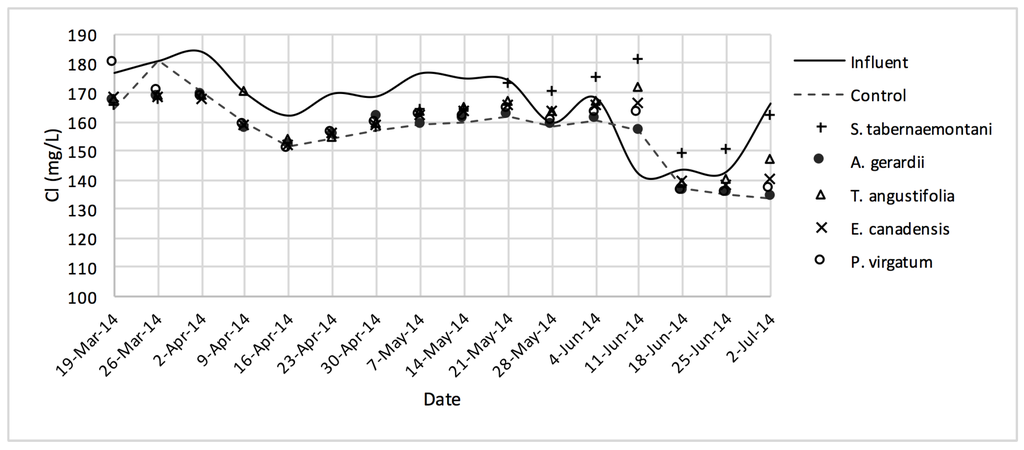
Figure 6.
Cl− concentrations measured over the operation time of the gravel reactors.
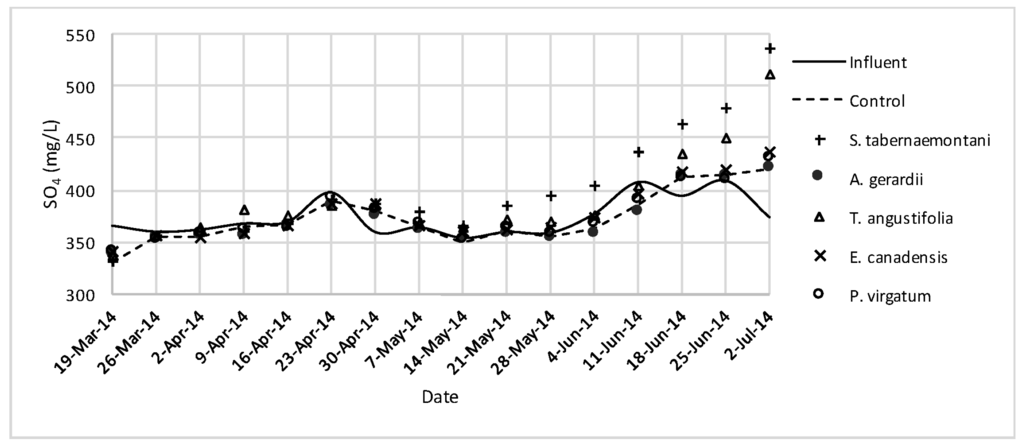
Figure 7.
SO42− concentrations measured over the operation time of the gravel reactors.
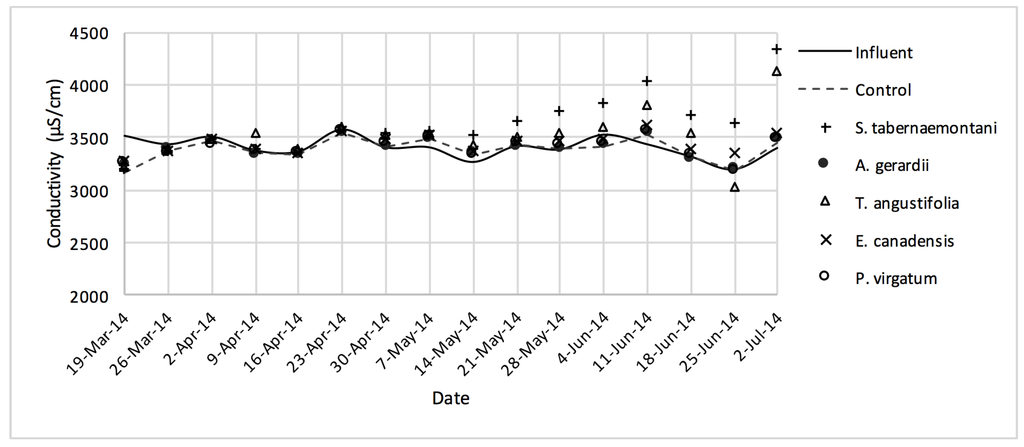
Figure 8.
EC values measured over the operation time of the gravel reactors.
Table 3.
Gravel reactors: average salt ion concentrations, their average change and mass removal rate for each reactor. A plus sign (+) denotes an increase, while a minus (−) demonstrates a reduction in concentration with respect to the influent. Mass removal rate is not reported for the increased concentrations. Asterisk (*) marks the data with significant statistical difference compared to the unplanted (control) reactor (p-value < 0.05).
Table 4.
Gravel reactors: average salinity parameters, their average change and mass removal rate for each reactor. A plus sign (+) denotes an increase, while a minus (−) demonstrates a reduction in concentration with respect to the influent. Mass removal rate is not reported for the increased parameters. Asterisk (*) marks the data with significant statistical difference compared to the unplanted (control) reactor (p-value < 0.05).
The average outflow Na+ concentration in the reactor planted with S. tabernaemontani was the highest among all reactors with a 7.4% increase over the inflow and showing significantly different performance compared to the unplanted reactor (p-value < 0.05), which showed a 2.1% decrease (Table 3). T. angustifolia demonstrated a 4.1% increase in Na+ concentration while the change rates in the other reactors remained small. The mass removal of Na+ was highest in the unplanted unit with a rate of 132 mg Na+day−1. The increase in Mg2+ concentrations was similarly highest in the S. tabernaemontani and T. angustifolia reactors with an average increase of 10.0% and 7.8% respectively. As for K+ concentrations, S. tabernaemontani demonstrated a 5.2% increase in the outflow samples. Similar to Na+, the unplanted reactor resulted in the highest mass removal rate of 294 mg K+day−1. The average Ca2+ content in the outflow samples were higher than that of the influent in all the reactors. With regard to Ca2+, S. tabernaemontani and T. angustifolia reactors resulted in statistically significant different results in comparison with the unplanted reactor containing only gravel (p-value < 0.001) with 60.7% and 57.7% higher average Ca2+ concentrations. While resulting in an increased Ca2+ concentration, the two species were grouped together (Figure 9) suggesting similar performance to one another.
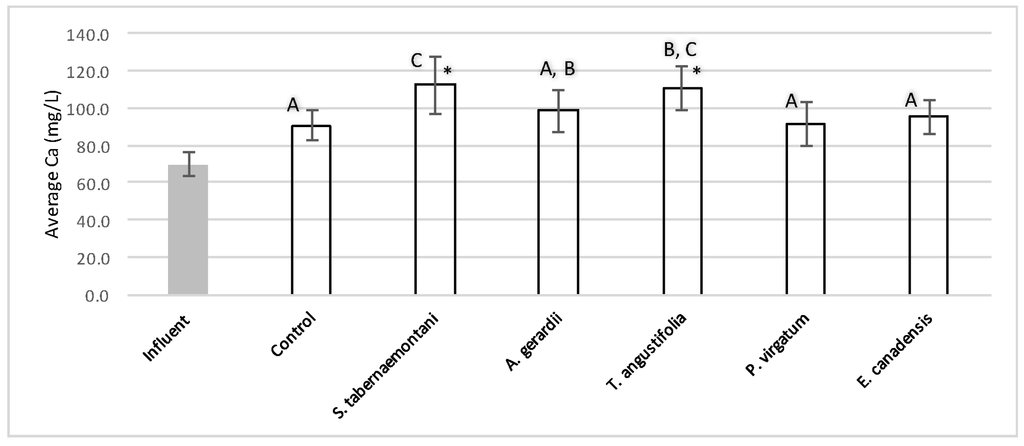
Figure 9.
Average Ca2+ concentrations during the operation of the gravel reactors. Error bars represent the standard deviation of each sample set. The reactors grouped with similar letters did not show significant statistical difference for Ca2+ concentrations. Asterisk (*) marks the data with significant statistical difference compared to the unplanted (control) reactor (p-values < 0.001).
The largest reductions of Cl− were observed in A. gerardii (5.9%, 294 mg Cl−day−1) and the unplanted reactor (5.8%) while all the units performed similarly with no significant difference with regard to Cl− change (Table 4). Concentrations of SO42− increased in all the reactors and S. tabernaemontani showed the highest increase of 7.3%.
The average increase of the EC from the reactor planted with S. tabernaemontani (6.2%) was highest among the other reactors and there was a significant difference in the plant’s outflow EC compared to the other units (p-value < 0.001).
3.2. Wood-Chip Bioreactors
3.2.1. Outflow Water Quality
The average daytime ambient temperature of the experiment was recorded as 23.8 °C. The temporal trends of the greenhouse solution’s salinity parameters for the wood-chip bioreactors are presented in Figure 10, Figure 11, Figure 12, Figure 13, Figure 14, Figure 15 and Figure 16. These figures include the data for all the six species plus the control unit tested according to the timetable given in Table 1. Moreover, Table 5 and Table 6 summarize the average values and the change rates of these parameters during each plant’s operation time.
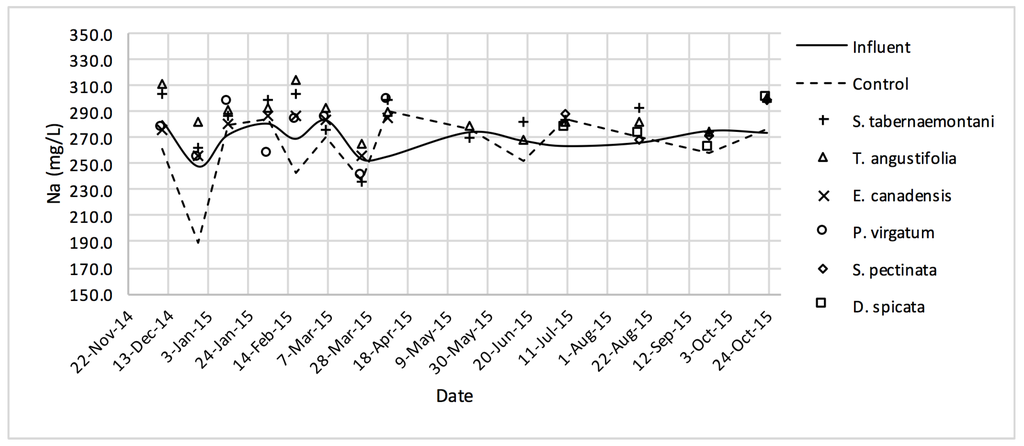
Figure 10.
Na+ concentrations measured over the operation time of the wood-chip bioreactors.
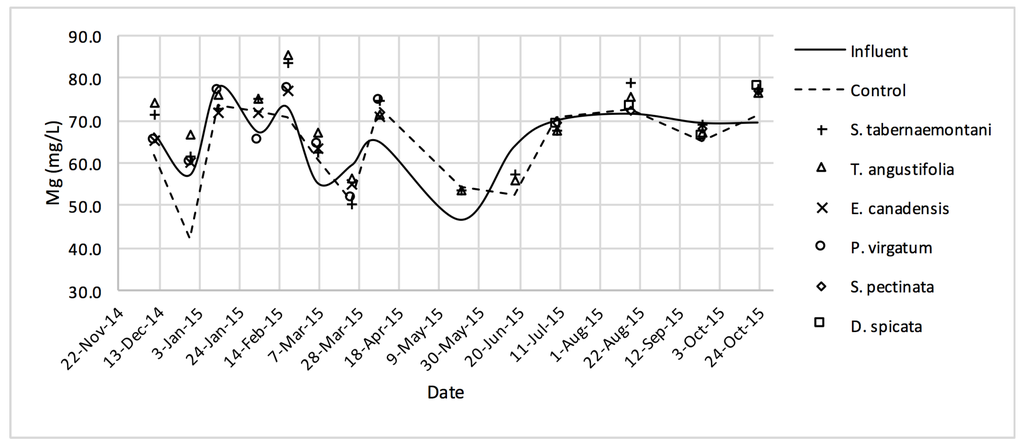
Figure 11.
Mg2+ concentrations measured over the operation time of the wood-chip bioreactors.
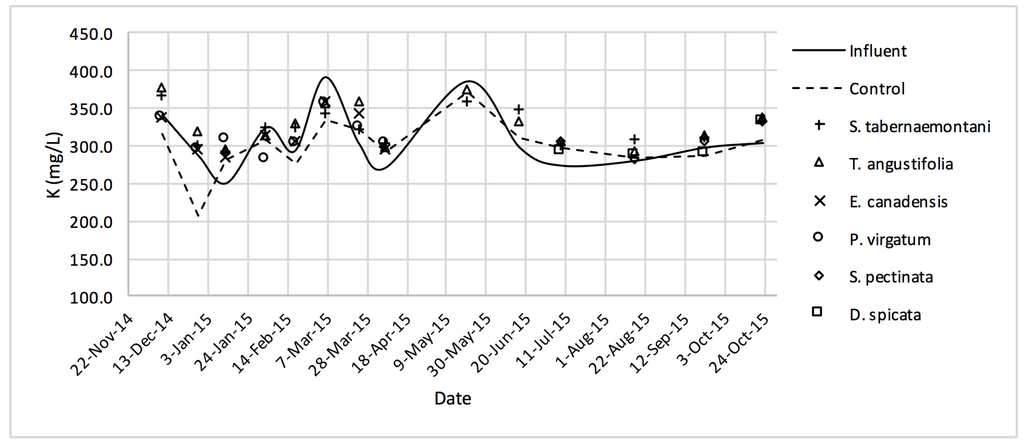
Figure 12.
K+ concentrations measured over the operation time of the wood-chip bioreactors.
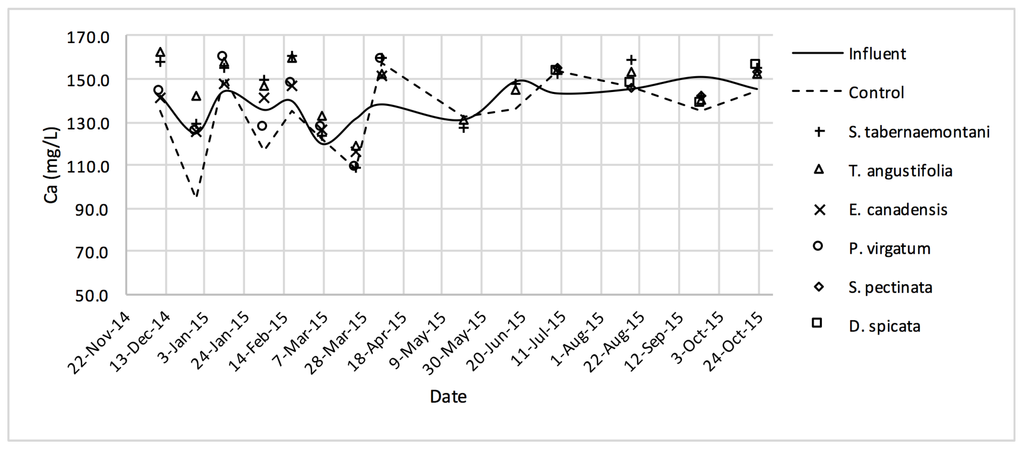
Figure 13.
Ca2+ concentrations measured over the operation time of the wood-chip bioreactors.
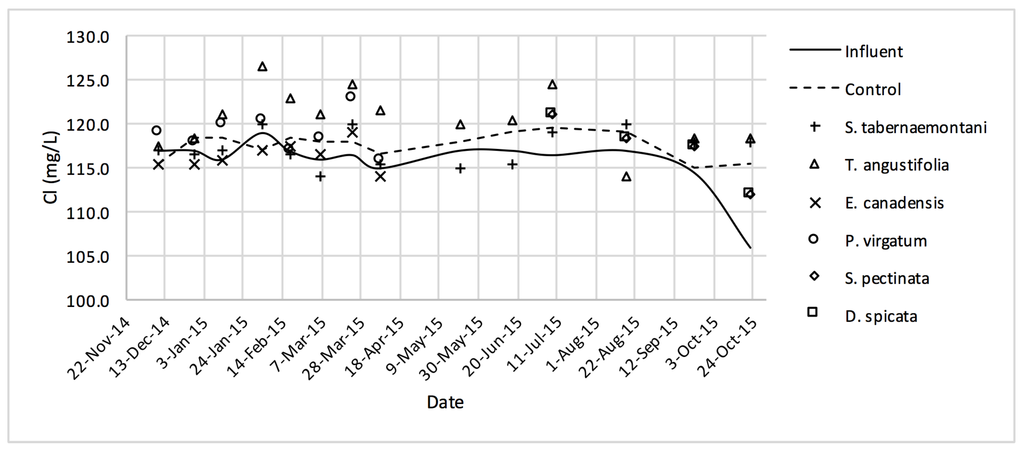
Figure 14.
Cl− concentrations measured over the operation time of the wood-chip bioreactors.
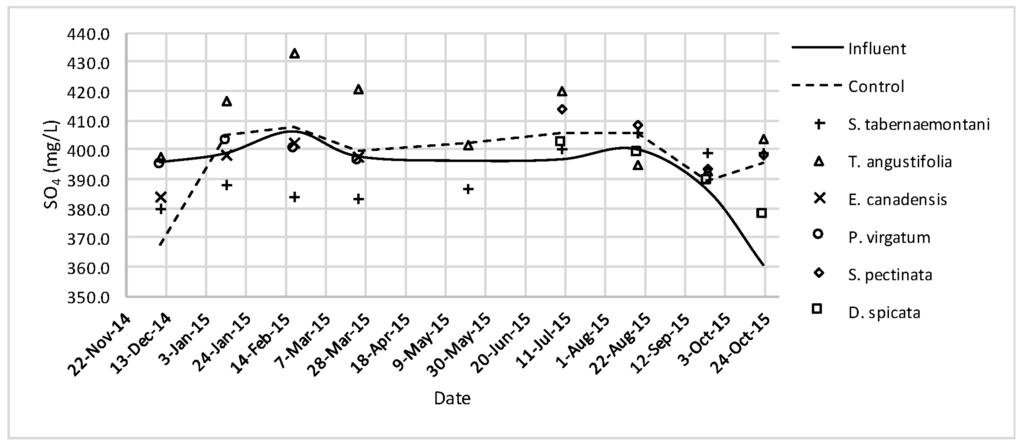
Figure 15.
SO42− concentrations measured over the operation time of the wood-chip bioreactors.
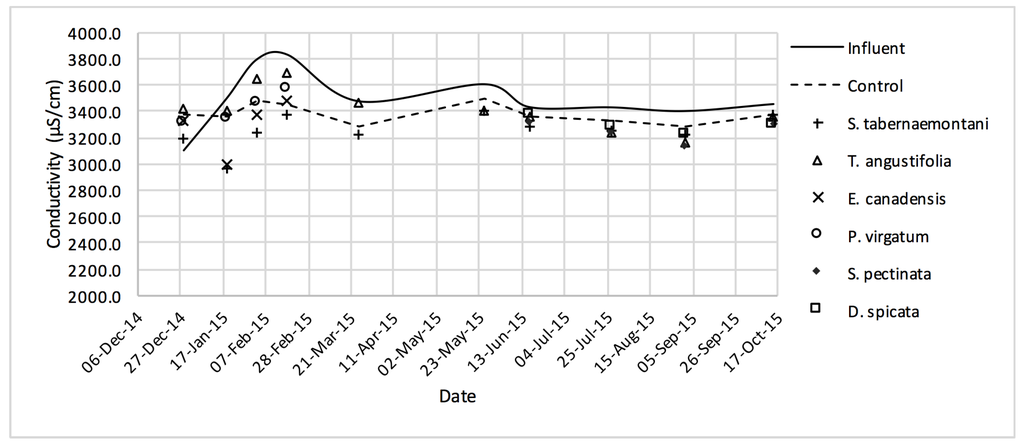
Figure 16.
EC values measured over the operation time of the wood-chip bioreactors.
Table 5.
Wood-chip bioreactors: average salt ion concentrations, their average change and mass removal rate for each bioreactor. A plus sign (+) denotes an increase, while a minus (−) demonstrates a reduction in concentration with respect to the influent. Mass removal rate is not reported for the increased concentrations. Asterisk (*) marks the data with significant concentration difference compared to the unplanted (control) reactor (p-value < 0.05).
Table 6.
Wood-chip bioreactors: average salinity parameters, their average change and mass removal rate for each bioreactor. A plus sign (+) denotes an increase, while a minus (−) demonstrates a reduction in concentration with respect to the influent. Mass removal rate is not reported for the increased parameters. Asterisk (*) marks the data with significant concentration difference compared to the unplanted (control) reactor (p-value < 0.05).
The average Na+ concentrations were higher in all the planted reactors, while the unplanted unit showed a decrease of 2.6% equating to 208 mg Na+ day−1 mass removal (Table 5). The increase rates in Na+ values in the bioreactors containing T. angustifolia and S. tabernaemontani were the highest (7.1% and 5.5% respectively) while these species displayed a significant difference in Na+ concentrations when compared with the control (p-values < 0.01). The highest concentration change for K+ values was in the T. angustifolia bioreactor (7.2%) while the control and D. spicata units resulted in small reductions of 2.3% and 2.1% respectively. As for Mg2+ and Ca2+ (Table 6), the unplanted reactor reduced the average concentrations by 2.3% (46 mg Mg2+ day−1) and 3.7% (153 mg Ca2+ day−1). All the planted bioreactors resulted in higher average Mg2+ values in the outflow samples, while S. pectinata and D. spicata showed the highest increase of 9.5% and 9.3%. The highest increase in Ca2+ concentrations was demonstrated by the same two species with 7.9% and 7.6% higher values in the outflow, whereas the unplanted bioreactor exhibited the highest reduction in the average Ca2+ concentrations.
No reduction was observed in the average Cl− concentrations whereas T. angustifolia showed an increase of 4.2%, marked as significantly different from the other units (p-value < 0.01). Similarly, the average SO42− concentration was increased the most in the bioreactor planted with T. angustifolia, while the reductions in the other reactors were small (⩽54 mg·day−1).
In comparison with the other species, S. tabernaemontani and S. pectinata showed the highest EC reduction of 7.0% (Table 6, Figure 17). Moreover, the reduction in the average SAR was limited to a maximum of 2.1%, observed in the control, T. angustifolia and D. spicata bioreactors.
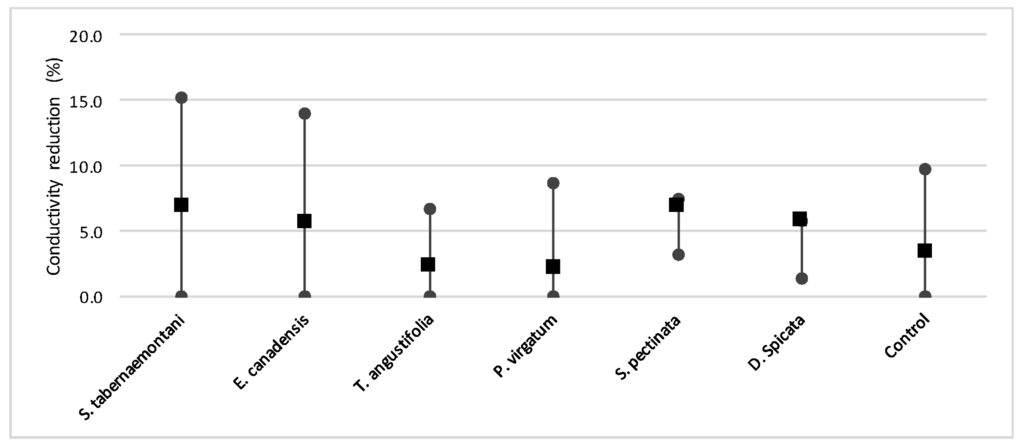
Figure 17.
The mean, maximum and minimum reductions in EC in the wood-chip bioreactors outlet samples.
Table 7 summarizes the inflow and outflow water quality compared with the guideline used to determine the irrigation water quality [20].
Table 7.
The quality of both the influent and the discharged greenhouse solution from the gravel and the wood-chip reactors compared with the guideline for water irrigation from [20]. EC and Cl− units: μS·cm−1 and mg·L−1.
3.2.2. Plant Tissue Analysis
The average salt ion contents in the mature plant tissue, and the accumulated mass per dry weight of the biomass are given in Table 8. The highest Na+ content was found in S. tabernaemontani (5.8 mg·g−1) and D. spicata showed the largest accumulation of Cl− (12.8 mg·g−1). S. pectinata and S. tabernaemontani had the highest contents of K+ (6.0 mg·g−1) and SO42− (4.1 mg·g−1) respectively.
Table 8.
The salt tissue contents in the mature species and the accumulated elements in the plant tissue (mg·g−1 per dry weight). SD values are in parenthesis and accumulated mass is estimated by subtracting the elemental mass content of the young shoots from that of the mature shoots.
3.2.3. Hydraulic Properties
The estimated hydraulic properties of the wood-chip bioreactor and the influence of evapotranspiration on the outflow concentrations are displayed in Table 9. K and in the wood-chip bioreactor were estimated as 0.10 cm·s−1 and 0.58. The K value in the present study is significantly smaller than those previously reported for denitrifier bioreactors containing 6 mm wood-chips (2.3 < reported K < 4.6 cm·s−1), while the porosity is in good agreement with the reported value of 0.56 [18]. K was estimated by measuring a hydraulic gradient of 0.0013 and assuming that Darcy’s law was applicable to the flow-through reactor. A recent study suggests that the assumption of laminar flow may not be valid for the flow patterns through wood-chips, and Forchheimer’s equation could predict better results for wood-chips in denitrifying beds [21]. However, the additional component of this equation that accounts for the inertial forces (neglected in Darcy’s law) is a function of specific discharge (q, defined as the flow rate divided by the reactor’s surface area), and considering the hydraulic properties of the current study (q = 12.2 cm·day−1), this component would result in negligible values reducing Forchheimer’s equation to Darcy’s equation.
Table 9.
Wood-chip bioreactors hydraulic properties and evapotranspiration effect.
4. Discussion
In the gravel experiment (fig:na-1fig:Cond-1), outflow concentrations of the salt ions (excluding Cl−), and EC values discharged from S. tabernaemontani and T. angustifolia reactors demonstrated an increasing trend when approaching the end of the experiment. The reason for these higher ion concentrations in time can potentially be associated with the gradual release of mineral ions from the dead below-ground biomass of these two species as they became better established and grew new shoots.
The visual assessment revealed good plant growth in all the units with the exception of A. gerardii, which was not able to survive entirely until the end of the experiment and most of the plugs were desiccated by the end of the operation.
The five plant species in the gravel reactors were generally outperformed by the control reactor in the outflow of these units, as most of the salt ion concentrations, as well as EC and SAR values were greater in the planted units, and the unplanted reactor’s performance generally resulted in smaller increases or greater decreases of these parameters (Table 3 and Table 4). The better performance of the control reactor, as compared to the planted reactors, was apparent even after an estimated period of about 2 months for establishment of the plants in the reactors. The elevated concentrations of Ca2+ (Figure 9) can be attributed to the gravel limestone media in the reactors including the control unit. Due to the high levels of Ca2+ in the discharged solution, the values of SAR were smaller after treatment. This reduction was as high as 8.5% for the control and A. gerardii without a significant difference between the six reactors.
SAR is typically used to determine the potential sodium hazard, which together with salt conentration of the irrigation water can also affect soil aggregate stability and permeability [22]. While SAR can be used to determine specific ion toxicity of Na+, its impact on soil infiltration should be estimated in conjunction with the irrigation water salinity. As indicated in Table 7, the overall quality of the outflow greenhouse solution from the reactors makes it unlikely to pose risks to soil infiltration, whereas the EC and specific ion toxicities are still problematic for sensitive crops. According to the guideline, the EC, SAR and Cl− concentration of the ideal irrigation water should be smaller than 700 μS·cm−1, 3.0 and 142 mg·L−1 respectively.
Similar to the gravel experiment, the wood-chip bioreactor with no plants showed better reduction performance for most of the salt element concentrations in the outflow (Table 5 and Table 6). Unlike the gravel reactors, however, the unplanted wood-chip bioreactor resulted in lower Ca2+ concentration on average (3.7% reduction), and the maximum increase of 7.9% was recorded for S. pectinata followed by 7.6% for D. spicata. The reduction of Na+, Mg2+, K+ and Ca2+ in the unplanted unit may be explained by the physiochemical precipitation, or more likely sorption of these ions due to the affinity of the wood-chip media to trap these elements in the micropores of its surface area. Further evaluation would however be required to confirm the processes responsible for these observed reductions. The increase of the salt elements in the planted reactors can be partially explained by the gradual dissolution of the mineral ions from the small amount of soil that was carried over at the time of planting. In addition, the increase may also have occurred due to the evapotranspiration and the consequent water loss from each reactor which resulted in higher concentrations. The evaluation of the evapotranspiration effect in the wood-chip bioreactors showed a potential average increase of 1.9% for any constituent in the outflow solution (Table 9). Therefore, the water loss from the surface of the reactors, as well as the transpiration of the plants are considered partially responsible for the increased salt ion concentrations. Since in reality, the mineral accumulation in the plants and evapotranspiration in the bioreactors occur concurrently, the increased ion concentrations in the discharged solution suggested that the latter had a more dominant effect. Moreover, since the mixed vegetation in the ET unit was not as dense as the other bioreactors enriched with single species, the real effect of evapotranspiration is expected to be higher than the measured of 2.19 L·day−1·m−2, hence a higher increase of concentration.
In a review of a number of CWs treating various types of wastewater, the reported Na+, K+, Ca2+ and Mg2+ contents in S. tabernaemontani above-ground tissue were up to 7.5, 60.2, 8.2, and 2.1 mg·g−1 respectively [23]. The accumulated Na+ observed in S. tabernaemontani in the current experiment (5.8 mg·g−1, Table 8), although smaller, is in agreement with the 5.9 mg Na+g−1 reported by [12] for their microcosm experiment in which various species were exposed to simulated greenhouse effluent. The accumulated Cl− by S. tabernaemontani in our experiment (4.5 mg·g−1) was however smaller than their reported maximum of 34.8 mg Cl−g−1 for this species. T. angustifolia in our reactors accumulated 1.7 mg Na+g−1 and negligible Cl− while the same species was reportedly able to accumulate up to 7.3 mg Na+g−1 and 30.5 mg Cl−g−1. With regard to the same study, D. spicata in our bioreactor demonstrated greater Na+ and Cl− accumulation (1.9 and 12.8 mg·g−1 respectively) compared to the values of 1.3 and 4.0 mg Na+g−1 and Cl−g−1 [12]. Moreover, a different plant from the cordgrass family (Spartina alterniflora), tested in the same setting, showed small contents of 2.2 mg Na+g−1 and 9.7 mg Cl−g−1 [12], which are relatively comparable with the smaller accumulated ion contents in S. pectinata in the present experiment (1.2 mg Na+g−1 and 1.5 mg Cl−g−1). The authors did not however report salinity parameters in the inflow and outflow solution samples and the treatment performance was determined based merely on the tissue contents.
It has been previously suggested that Distichlis and Spartina halophytes may be able to remove salts from the soil by placing the salts to the shoot surface without accumulation of the salts in the tissue [24]. In the bioreactors in the current study, such salt crystals on the surface of these species were not observed, suggesting that the mechanism of salinity removal from the water and wastewater in flow-through systems may be different. As the bioreactors were operated indoors while protected from the wind, and the plants were regularly monitored, it was unlikely that such crystals could develop and leak back to the reactors.
In another study, P. virgatum showed increasing content of Na+ in its shoot biomass with the increasing salinity levels in the solution, whereas S. pectinata maintained its Na+ shoot content under 23 mg·g−1 at any level of salinity [25]. Although this is much higher than our measured 1.2 mg·g−1, it should be noted that the minimum starting concentration of Na+ in the initial solution used in that experiment was more than 4 times greater than the concentrations found in the typical greenhouse effluent. This general correlation between the enhanced salt accumulation (particularly the accumulated Na+ and Cl−) in the plant tissue and the higher starting salt concentrations up to a certain level, has been reported in other studies as well (e.g., [25,26,27,28]). Nonetheless, Ca2+, Mg2+ and K+ contents in the halophytes biomass are much less sensitive to salinity variations (e.g., [28,29]). Therefore, the high salt tissue contents reported in the existing literature suggest that salinity levels higher than those expected in the typical greenhouse effluent may promote greater absorption of the key salt elements namely Na+ and Cl−.
Despite the relatively small salt element reduction by comparing the elemental contents in the outflow and the inflow samples, EC values in the wood-chip bioreactors decreased in all the units after treatment. The greatest average EC reduction (7.0%) was demonstrated by S. tabernaemontani and S. pectinata (maximum 15.2%, Figure 17).
The control unit, T. angustifolia and D. spicata resulted in a 2.1% decrease in SAR (Table 6) and the combination of SAR and EC values showed no restriction regarding the potential infiltration issues for using the inflow or outflow solution for irrigation purposes (Table 7). However, the treated water failed to meet the guideline criteria for production of sensitive crops, mainly due to the high EC and Na+ concentration.
The performance of our plants is comparable with some of the previous findings where conductivity measurements were reported in inlet and outlet water samples. For example, in an investigation of different salinity and nutrient levels for treatment of aquaculture effluent using planted wetland cells, the mean salinity in the outflow was found to be approximately the same as the inflow [30]. Moreover, when tested in a horizontal flow CW setting, the halophytic species Bassia indica resulted in higher salinity after treatment due to enhanced evapotranspiration [3]. In a different study, it was reported that the total dissolved solids were barely removed in the planted CWs treating saline tannery wastewater [31]. B. indica showed good salinity (EC) reduction with 22.2% decrease in saline water, 6.7% mean reduction in a recirculating vertical flow CW treating domestic wastewater and a maximum of 19.9% reduction in vertical flow CW treating domestic and dairy production wastewater [32]. Despite the relatively effective salinity reduction, the authors indicated that B. indica did not reduce the wastewater salinity below the agriculture threshold of 1400 μS·cm−1, indicating that salt phytoremediation per their configuration could not stand alone for non-tolerant crops.
In the current study, since S. tabernaemontani achieved the highest EC reduction and accumulated the largest Na+ and SO42−, it was selected as the most capable candidate for phytodesalination between the other species. However, it should be noted that the outflow solution from the same species contained higher Na+ concentrations than the influent, and therefore it should be used with caution and further treatment steps should be considered.
When T. angustifolia was tested for treating synthetic reactive dye wastewater in vertical flow CWs, despite the effective salinity reduction of 86% at the HRT of 15 days, the authors found a shorter HRT of 3 days led to only about 10% salinity removal [33]. Elsewhere, in pilot scale wetlands planted with S. tabernaemontani, the plant’s Na+ tissue content was found highest at the longest nominal residence time (6.7 days) and lowest at the shortest residence time (1.9 days) [23]. Moreover, one week of retention time was recommended for salt phytoremediation using T. angustifolia mainly due to its higher Cl− absorption during that time [26]. Considering the longer HRT applied in the studies with effective ion accumulations, it can be concluded that the HRT of 3.7 days implemented in the present study was a critical factor resulting in the relatively small EC reduction. As such, it is recommended that longer periods of HRT be considered and further assessed for phytodesalination systems designed for treating the greenhouse effluent. It can be argued, however, that an excessively long HRT would present challenges from the operational perspective in on-site treatment systems such as CWs and bioreactors, particularly when a large quantity of water requires treatment with limited possibility of storing the nutrient-rich greenhouse effluent for a long period.
In terms of salinity tolerance, the survival of S. pectinata and P. virgatum were previously found to be adversely influenced by salinities higher than 250 mM NaCl (5750 mg Na+L−1 and 8863 mg Cl−L−1) and 100 mM NaCl (2300 mg Na+L−1 and 3545 mg Cl−L−1) respectively [25]. These salinity survival limits are significantly greater than the levels expected in the greenhouse effluent, and therefore, the tolerance to high salinity would not be a limiting factor for the growth. Although the germination rate of A. gerardii from seed under increased salinity levels was reported higher than S. pectinata and P. virgatum [34], the growth of the plant’s seedlings in our gravel reactors was not satisfactory and thus, the species was excluded for use in the wood-chip bioreactors. Based on the qualitative visual assessment, the other species in the gravel reactors demonstrated good biomass growth with green color. In the wood-chip bioreactors, E. canadensis and P. virgatum had a shorter survival time and therefore were substituted after Phase 1, whereas S. pectinata, S. tabernaemontani and T. angustifolia exhibited very good biomass growth and healthy green color throughout the experiment.
At last, it is worth mentioning that the results of this study and the succeeding discussion are of great interest to the greenhouse sector, as the findings are of benefit for operations looking to improve their greenhouse effluent for discharge, as well as for potential reuse.
5. Conclusions
A number of potential salt-accumulating plants were tested for their salt removal capacity in gravel and wood-chip media. The plants roots were submerged in the bioreactors, resembling the operational conditions of vertical flow subsurface CWs. S. tabernaemontani and D. spicata showed higher accumulated contents of Na+ and Cl− in their respective biomass tissue. The plant species in the gravel reactors were not successful in water desalination based on the salinity parameters in the discharged water, whereas the wood-chip bioreactors planted with S. tabernaemontani and S. pectinata improved the greenhouse effluent salinity. S. tabernaemontani was selected as the most capable species while it was concluded that the phytodesalination of the greenhouse effluent per the current HRT would require further treatment to meet the irrigation water quality guidelines for growing sensitive crops.
Acknowledgments
This research and the cost to publish in open access were funded under the College-University Idea to Innovation (CUI2I) Grants program of the Natural Sciences and Engineering Research Council of Canada (NSERC).
Author Contributions
Soheil Fatehi Pouladi, Bruce C. Anderson, Brent Wootton and Lloyd Rozema conceived and designed the experiments, and provided materials and feedback; Bruce C. Anderson and Brent Wootton co-supervised the project; Soheil Fatehi Pouladi performed the experiments, analyzed the data and wrote the paper.
Conflicts of Interest
The authors declare no conflict of interest. The funding sponsors had no role in the design of the study; in the collection, analyses, or interpretation of data; in the writing of the manuscript, and in the decision to publish the results.
References
- Koyro, H.W. Ultrastructural Effects of Salinity in Higher Plants. In Salinity: Environment—Plants—Molecules; Läuchli, A., Lüttge, U., Eds.; Springer: Dordrecht, The Netherlands, 2002; pp. 139–157. [Google Scholar]
- Läuchli, A.; Epstein, E. Plant responses to saline and sodic conditions. In Agricultural Salinity Assessment and Management; ASCE Manuals and Reports on Engineering Practice No. 71; Tanji, K.K., Ed.; American Society of Civil Engineers: New York, NY, USA, 1990; pp. 113–137. [Google Scholar]
- Freedman, A.; Gross, A.; Shelef, O.; Rachmilevitch, S.; Arnon, S. Salt uptake and evapotranspiration under arid conditions in horizontal subsurface flow constructed wetland planted with halophytes. Ecol. Eng. 2014, 70, 282–286. [Google Scholar] [CrossRef]
- Flowers, T.J.; Hajibagheri, M.A.; Clipson, N.J.W. Halophytes. Q. Rev. Biol. 1986, 61, 313–337. [Google Scholar] [CrossRef]
- Grigore, M.N.; Ivanescu, L.; Toma, C. Halophytes: An Integrative Anatomical Study; Springer International Publishing: Cham, Switzerland, 2014. [Google Scholar]
- Flowers, T.J.; Colmer, T.D. Salinity tolerance in halophytes. New Phytol. 2008, 179, 945–963. [Google Scholar] [CrossRef] [PubMed]
- Santos, J.; Al-Azzawi, M.; Aronson, J.; Flowers, T.J. eHALOPH a database of salt-tolerant plants: Helping put halophytes to work. Plant Cell Physiol. 2015. [Google Scholar] [CrossRef] [PubMed]
- Hasanuzzaman, M.; Nahar, K.; Alam, M.M.; Bhowmik, P.C.; Hossain, M.A.; Rahman, M.M.; Prasad, M.N.V.; Ozturk, M.; Fujita, M. Potential use of halophytes to remediate saline soils. BioMed Res. Int. 2014, 2014, 589341. [Google Scholar] [CrossRef] [PubMed]
- Panta, S.; Flowers, T.; Lane, P.; Doyle, R.; Haros, G.; Shabala, S. Halophyte agriculture: Success stories. Environ. Exp. Bot. 2014, 107, 71–83. [Google Scholar] [CrossRef]
- Manousaki, E.; Kalogerakis, N. Halophytes—An emerging trend in phytoremediation. Int. J. Phytoremediat. 2011, 13, 959–969. [Google Scholar] [CrossRef] [PubMed]
- Shelef, O.; Gross, A.; Rachmilevitch, S. Role of plants in a constructed wetland: Current and new perspectives. Water 2013, 5, 405–419. [Google Scholar] [CrossRef]
- Rozema, E.R.; Gordon, R.J. Plant species for the removal of Na+ and Cl- from greenhouse nutrient solution. HortScience 2014, 49, 1071–1075. [Google Scholar]
- Kadlec, R.H.; Wallace, S. Treatment Wetlands, 2nd ed.; CRC Press, Taylor & Francis Group: Boca Raton, FL, USA, 2009. [Google Scholar]
- Koide, S.; Satta, N. Separation performance of ion-exchange membranes for electrolytes in drainage nutrient solutions subjected to electrodialysis. Biosyst. Eng. 2004, 87, 89–97. [Google Scholar] [CrossRef]
- Park, J.B.K.; Craggs, R.J.; Sukias, J.P.S. Removal of nitrate and phosphorus from hydroponic wastewater using a hybrid denitrification filter (HDF). Bioresour. Technol. 2009, 100, 3175–3179. [Google Scholar] [CrossRef] [PubMed]
- APHA.; AWWA.; WEF. Standard Methods for the Examination of Water & Wastewater, 21st ed.; American Public Health Association, American Water Works Association, and Water Environment Federation: Washington, DC, USA, 2005. [Google Scholar]
- Brutsaert, W. Hydrology—An Introduction; Cambridge University Press: New York, NY, USA, 2005. [Google Scholar]
- Cameron, S.G.; Schipper, L.A. Nitrate removal and hydraulic performance of organic carbon for use in denitrification beds. Ecol. Eng. 2010, 36, 1588–1595. [Google Scholar] [CrossRef]
- Freeze, A.; Cherry, J. Groundwater, 1st ed.; Prentice-Hall: Upper Saddle River, NJ, USA, 1979. [Google Scholar]
- Ayers, R.; Westcot, D. Water Quality for Agriculture; FAO Irrigation and Drainage Paper 29 (Rev. 1); Food and Agriculture Organization of the United Nations: Rome, Italy, 1994. [Google Scholar]
- Ghane, E.; Fausey, N.R.; Brown, L.C. Non-Darcy flow of water through woodchip media. J. Hydrol. 2014, 519, 3400–3409. [Google Scholar] [CrossRef]
- Hanson, B.; Grattan, S.R.; Fulton, A. Agricultural Salinity and Drainage; Revised 2006; Department of Land, Air and Water Resources, University of California: Davis, CA, USA, 1999. [Google Scholar]
- Tanner, C. Growth and nutrient dynamics of soft-stem bulrush in constructed wetlands treating nutrient-rich wastewaters. Wetl. Ecol. Manag. 2001, 9, 49–73. [Google Scholar] [CrossRef]
- Yensen, N.P.; Biel, K.Y. Soil remediation via salt-conduction and the hypotheses of halosynthesis and photoprotection. In Ecophysiology of High Salinity Tolerant Plants; Khan, M.A., Weber, D.J., Eds.; Springer: Dordrecht, The Netherlands, 2006; Volume 40, pp. 313–344. [Google Scholar]
- Kim, S.; Rayburn, A.L.; Voigt, T.; Parrish, A.; Lee, D.K. Salinity effects on germination and plant growth of prairie cordgrass and switchgrass. Bioenergy Res. 2012, 5, 225–235. [Google Scholar] [CrossRef]
- Morteau, B.; Triffault-Bouchet, G.; Galvez, R.; Martel, L. Nutrient and removal kinetics impacts on salt phytoremediation by Atriplex patula and Typha angustifolia. J. Environ. Eng. 2014, 141. [Google Scholar] [CrossRef]
- Morteau, B.; Triffault-Bouchet, G.; Galvez, R.; Martel, L.; Leroueil, S.; Galvez, R.; Dyer, M.; Dean, S.W. Treatment of salted road runoffs using Typha latifolia, Spergularia canadensis, and Atriplex patula: A comparison of their salt removal potential. J. ASTM Int. 2009, 6, 1–7. [Google Scholar] [CrossRef]
- Miyamoto, S.; Glenn, E.P.; Olsen, M.W. Growth, water use and salt uptake of four halophytes irrigated with highly saline water. J. Arid Environ. 1996, 32, 141–159. [Google Scholar]
- Belkheiri, O.; Mulas, M. The effects of salt stress on growth, water relations and ion accumulation in two halophyte Atriplex species. Environ. Exp. Bot. 2013, 86, 17–28. [Google Scholar] [CrossRef]
- Lymbery, A.J.; Doupé, R.G.; Bennett, T.; Starcevich, M.R. Efficacy of a subsurface-flow wetland using the estuarine sedge Juncus kraussii to treat effluent from inland saline aquaculture. Aquacult. Eng. 2006, 34, 1–7. [Google Scholar] [CrossRef]
- Calheiros, C.S.C.; Quitério, P.V.B.; Silva, G.; Crispim, L.F.C.; Brix, H.; Moura, S.C.; Castro, P.M.L. Use of constructed wetland systems with Arundo and Sarcocornia for polishing high salinity tannery wastewater. J. Environ. Manag. 2012, 95, 66–71. [Google Scholar] [CrossRef] [PubMed]
- Shelef, O.; Gross, A.; Rachmilevitch, S. The use of Bassia indica for salt phytoremediation in constructed wetlands. Water Res. 2012, 46, 3967–3976. [Google Scholar] [CrossRef] [PubMed]
- Nilratnisakorn, S.; Thiravetyan, P.; Nakbanpote, W. A constructed wetland model for synthetic reactive dye wastewater treatment by narrow-leaved cattails (Typha angustifolia Linn.). Water Sci. Technol. 2009, 60, 1565–1574. [Google Scholar] [CrossRef] [PubMed]
- Schmer, M.R.; Xue, Q.; Hendrickson, J.R. Salinity effects on perennial, warm-season (C4) grass germination adapted to the northern Great Plains. Can. J. Plant Sci. 2012, 92, 873–881. [Google Scholar] [CrossRef] [Green Version]
© 2016 by the authors; licensee MDPI, Basel, Switzerland. This article is an open access article distributed under the terms and conditions of the Creative Commons Attribution (CC-BY) license (http://creativecommons.org/licenses/by/4.0/).