1. Introduction
Over the last decade, an extensive amount of research has been done on how climate change might influence different aspects of the hydrological cycle (precipitation, runoff, evapotranspiration,
etc.) in many geographic areas [
1,
2,
3,
4,
5,
6]. The Mediterranean basin is a relatively closed subsystem of the global hydrologic system, where a number of interdependent processes occur with respect to the land-atmosphere interactions and their variability. According to the output of the current coupled atmosphere-ocean general circulation models (GCMs) for the 2080–2100 time slice [
7], an increase in temperature between 1.5 °C and 3.6 °C and a decrease in precipitation between 10% and 20% are forecasted in the western Mediterranean ([
8], in accordance with the A1B storyline from ICCP, which describes a balance across all energy sources in the greenhouse effect). The climate in the Mediterranean presents a great sensitivity to global change. Climate change projections also indicate increased probability of drought [
9] and variability in extreme events. Changes in future climate will alter regional hydrologic cycles and will subsequently have an impact on water resource availability [
10].
Most climate studies have focused on the impacts on surface water resources. While climate change affects surface water resources directly through changes in the major long-term climate variables, such as air temperature, precipitation and evapotranspiration, the relationship between changing climate variables, groundwater and groundwater recharge is more complicated, less understood and not sufficiently assessed as stated by a number of researchers [
5,
11,
12,
13,
14,
15,
16]. Even less studied is the impact of climate change on aquifer properties [
17] or land use and land cover changes. Groundwater resources are related to climate change through the direct interaction with surface water resources, such as lakes, wetlands and rivers [
1,
2,
18], and indirectly through the recharge process. Therefore, quantifying the impact of climate change on water resources requires not only reliably forecasting changes in major climatic variables, but also the accurate estimation of groundwater recharge, streamflow assessment and natural recharge emanating from changes in land use and vegetation cover in the present day and over time [
3,
6,
19,
20].
Reliable natural recharge estimation can be difficult. The natural recharge rate is limited by water availability, which is temporally and spatially controlled by climatic factors, such as precipitation and evapotranspiration, and is predominately concentrated during short periods of time [
21]. In some areas where irrigated agriculture prevails over forested land, recharge estimation is even more complex due to crop irrigation, as stated by [
22], which may simultaneously abstract water from the recharge sources, while creating a new diffuse recharge [
23]. One of the most critical elements for recharge estimation is determining actual evapotranspiration rates, according to crop type, forest cover and land distribution.
The results of global climate models, on relevant spatial and temporal scales, for hydrologic impact assessment can be achieved through surface and groundwater numerical modelling coupled with downscaled GCM output based on different methodologies [
1,
4,
5,
6]. Modelling water resources’ behavior (streamflow, groundwater and groundwater recharge) is not a new undertaking, and several numerical codes are currently applied for process understanding and forecasting this behavior.
Linking groundwater-surface model results can be a more realistic scenario for problem solving in modelling water budgets in a hydraulically-connected stream-aquifer system, even if the modelling process is more complex and model calibration and validation is not always possible because data are lacking. The assessment of recharge processes requires a site-specific approach to overcome such limitations. Linking domain-specific models (surface-groundwater systems) is not an easy task and is not always possible, as the approach involves assembling equations for both groundwater and surface water at different time scales and the datasets required for the two regimes.
Climate change and other pressures impacting the environment and water resources in the Mediterranean require management adaptation plans of affected river basins and their water resources with respect to the changing future conditions. To address this challenge, the investigation of climate change impacts and land use/land cover changes on diverse hydrological systems of the Mediterranean basin characterized by different hydrologic behavior, land use and climatic conditions has taken place. The main objective of this paper is to apply a linked methodological approach to investigate the impacts of climate change on a highly forested Mediterranean hydrological system where a strong surface water-groundwater interaction exists, by taking into account joint effects on flow regime, groundwater recharge and socio-economic scenarios led by land use changes. Secondly this research aims at assessing the impact on water resources from different climate scenarios and land use scenario policies in force [
24] for land management and environmental protection, given the impact of land use changes in the hydrological system. To achieve this, the study required a downscaled GCM output of the emission scenarios B1 (medium-low) and A2 (medium-high) for the 2025 and 2050 time slice [
8]. Outputs were linked to the surface and groundwater recharge numerical modelling in a chained procedure, which considers land use/land cover and forecasted changes. To address both aspects, the methodology has been applied in the Fluvià basin (Spain), which constitutes a good example of a forested basin with a complex coupled stream/aquifer hydrologic system where slight changes of land cover use are forecasted following existing regulations. The river baseflow is provided by perennial springs and seepage areas located close to the riverbed, which drain the aquifers. The river receives a significant groundwater input, which is especially important during periods with no precipitation.
2. Study Site
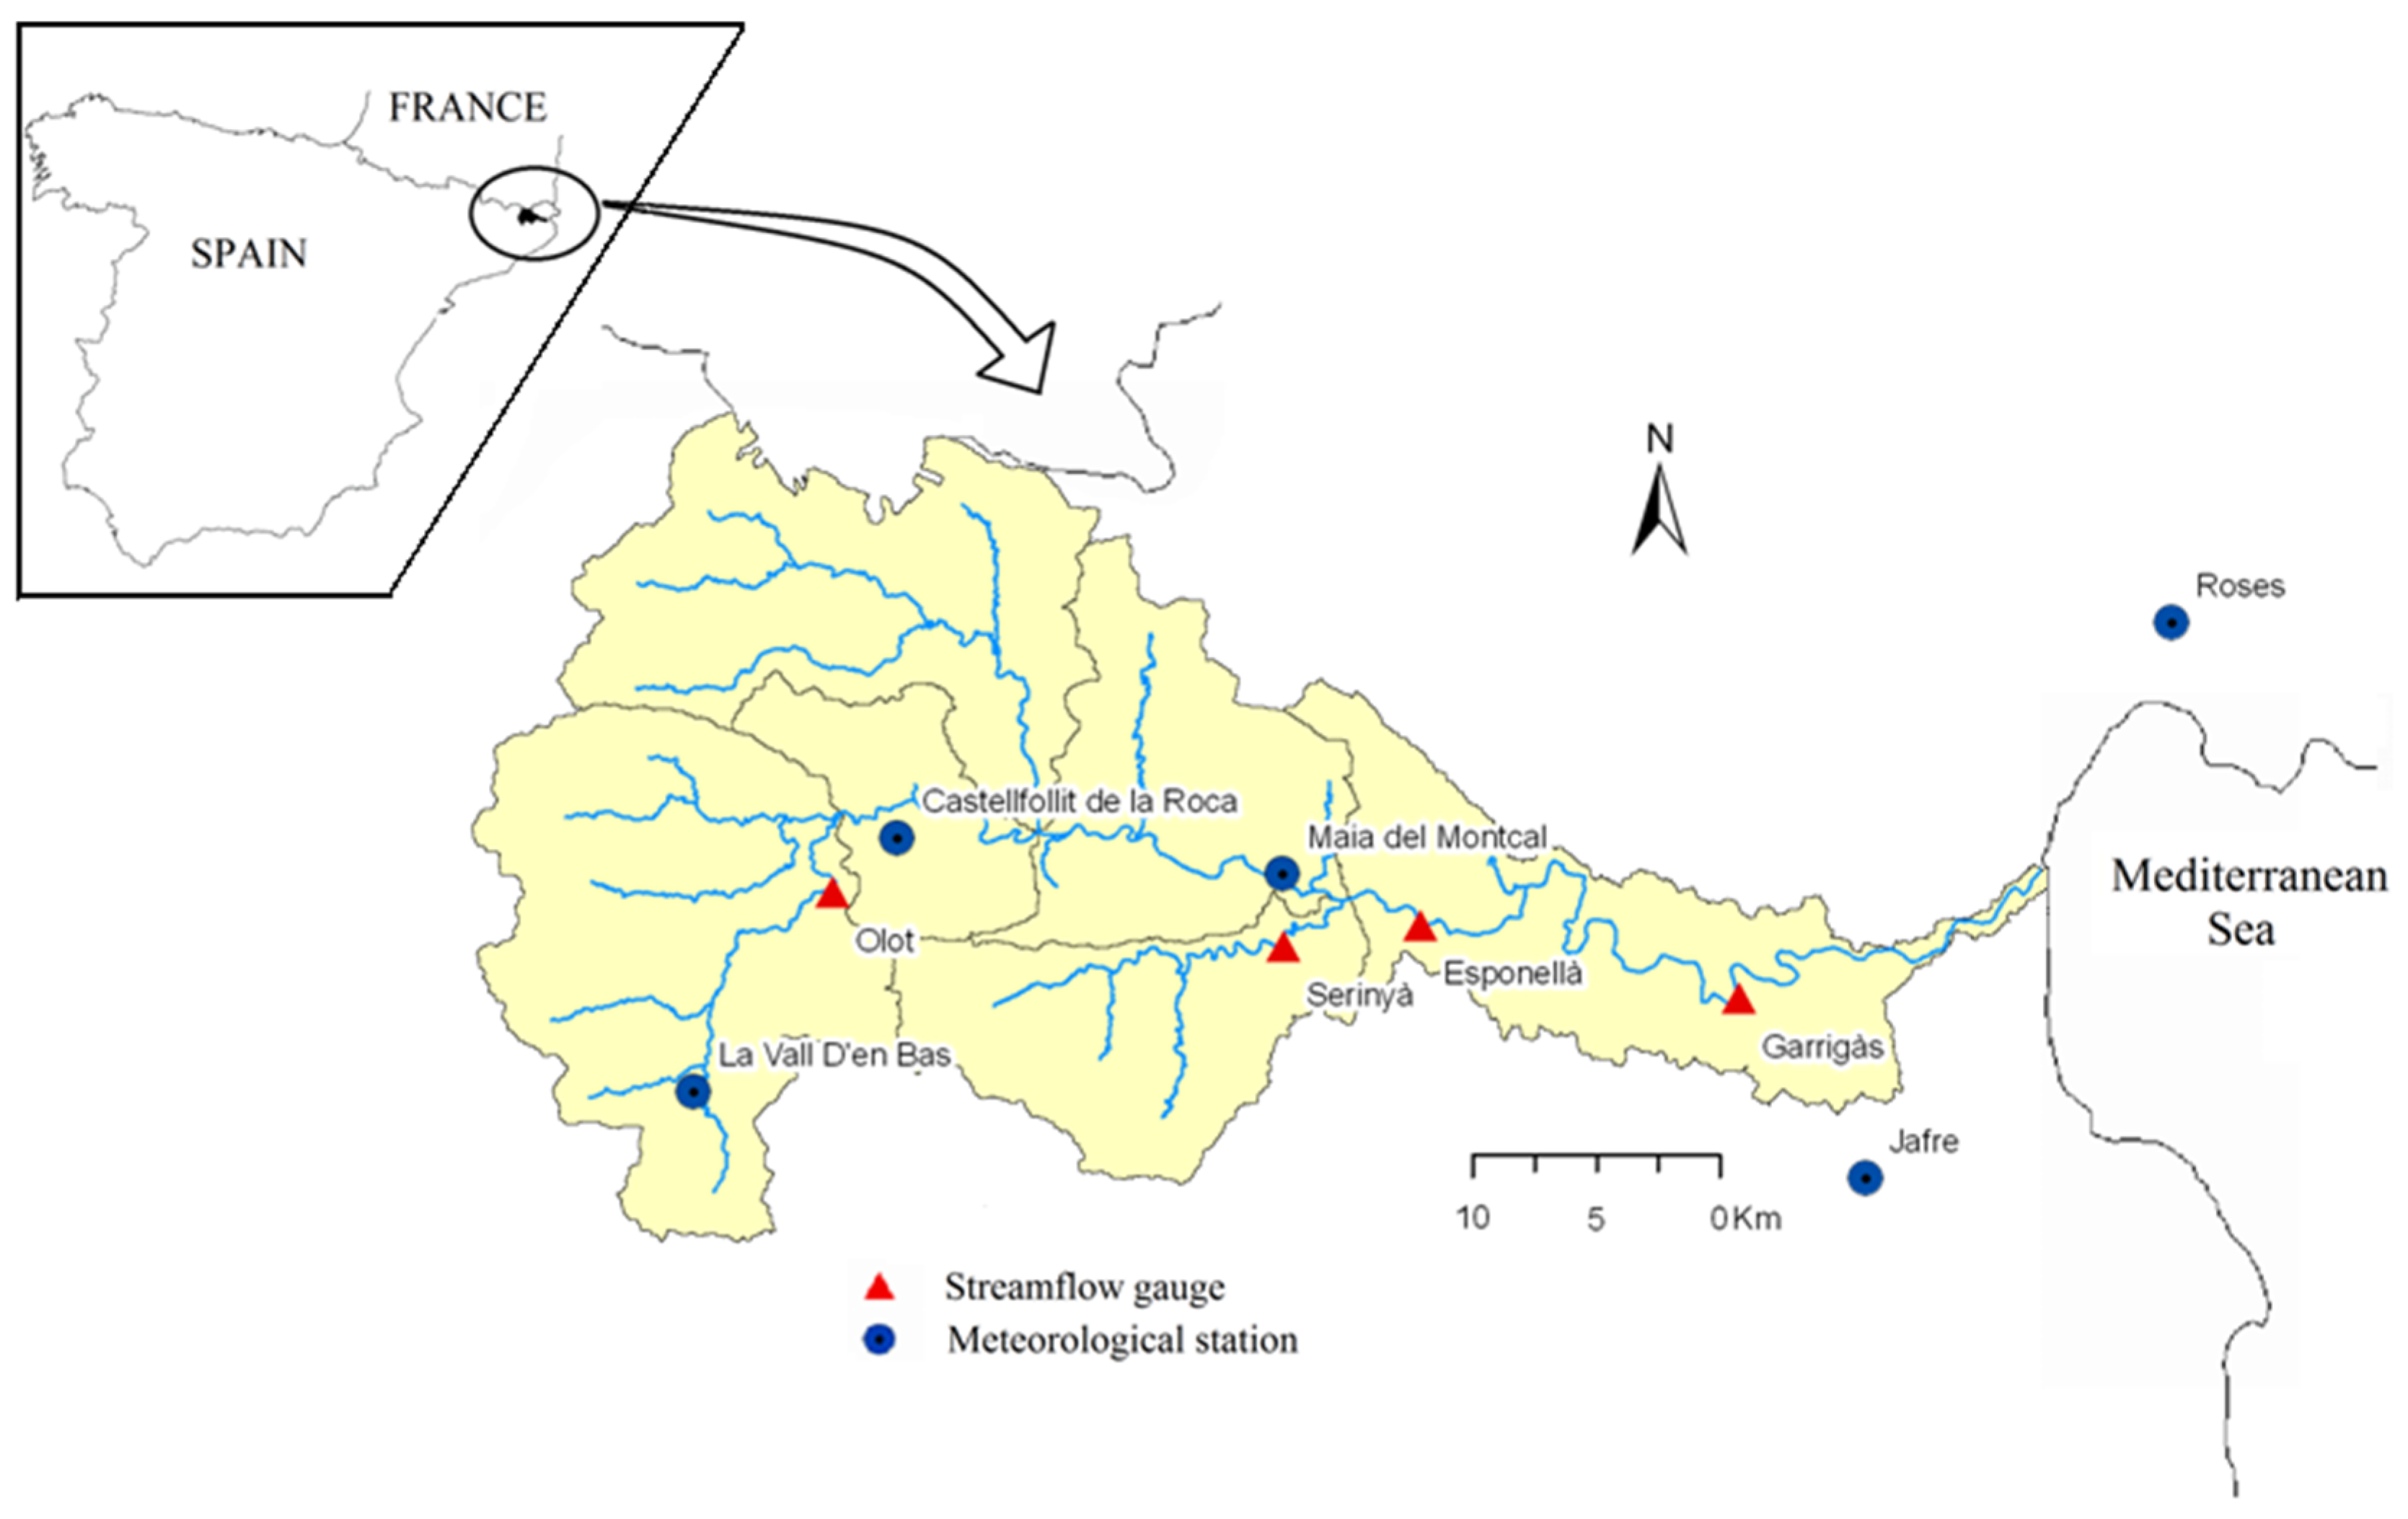
The Fluvià basin, located in NE Spain, covers more than 973 km
2 of a mainly forested cover (76% of the surface area) in the highest elevations and agricultural land (21%) in the mid- and lower alluvial valley located in the Mediterranean Sea mouth (
Figure 1).
The basin is characterized by a stepped topography in the western part, with elevations ranging from 1606 m to sea level. The average slope is 2.4% [
25,
26]. Forest and agricultural lands are the main land use in the area, with some urban areas (3%) located mainly along the coast. Catchment selection was based on existing meteorological datasets, land use (forest cover of Olm oaks, beech, pine trees and cork oaks in 76% of the total area), projected future land use changes, water demand and surface-groundwater hydraulic conditions (losing/gaining stream).
Catchment geology is composed predominantly by sedimentary materials (sandstones, conglomerates, limestones) and alluvial and coastal sediments, which constitute the main aquifer formations, and by Quaternary volcanic rocks (basaltic lava flows and pyroclastic rocks). The La Garrotxa volcanic natural park extends over 151 km2 in the upper Fluvià basin. The soils are generally thin (a few cm), mostly in steep slopes and deep (up to a few m) in valleys, reflecting a broad range of soil formation processes, land uses (irrigation/dryland) climatic and geologic conditions. Inceptisols and Entisols are found.
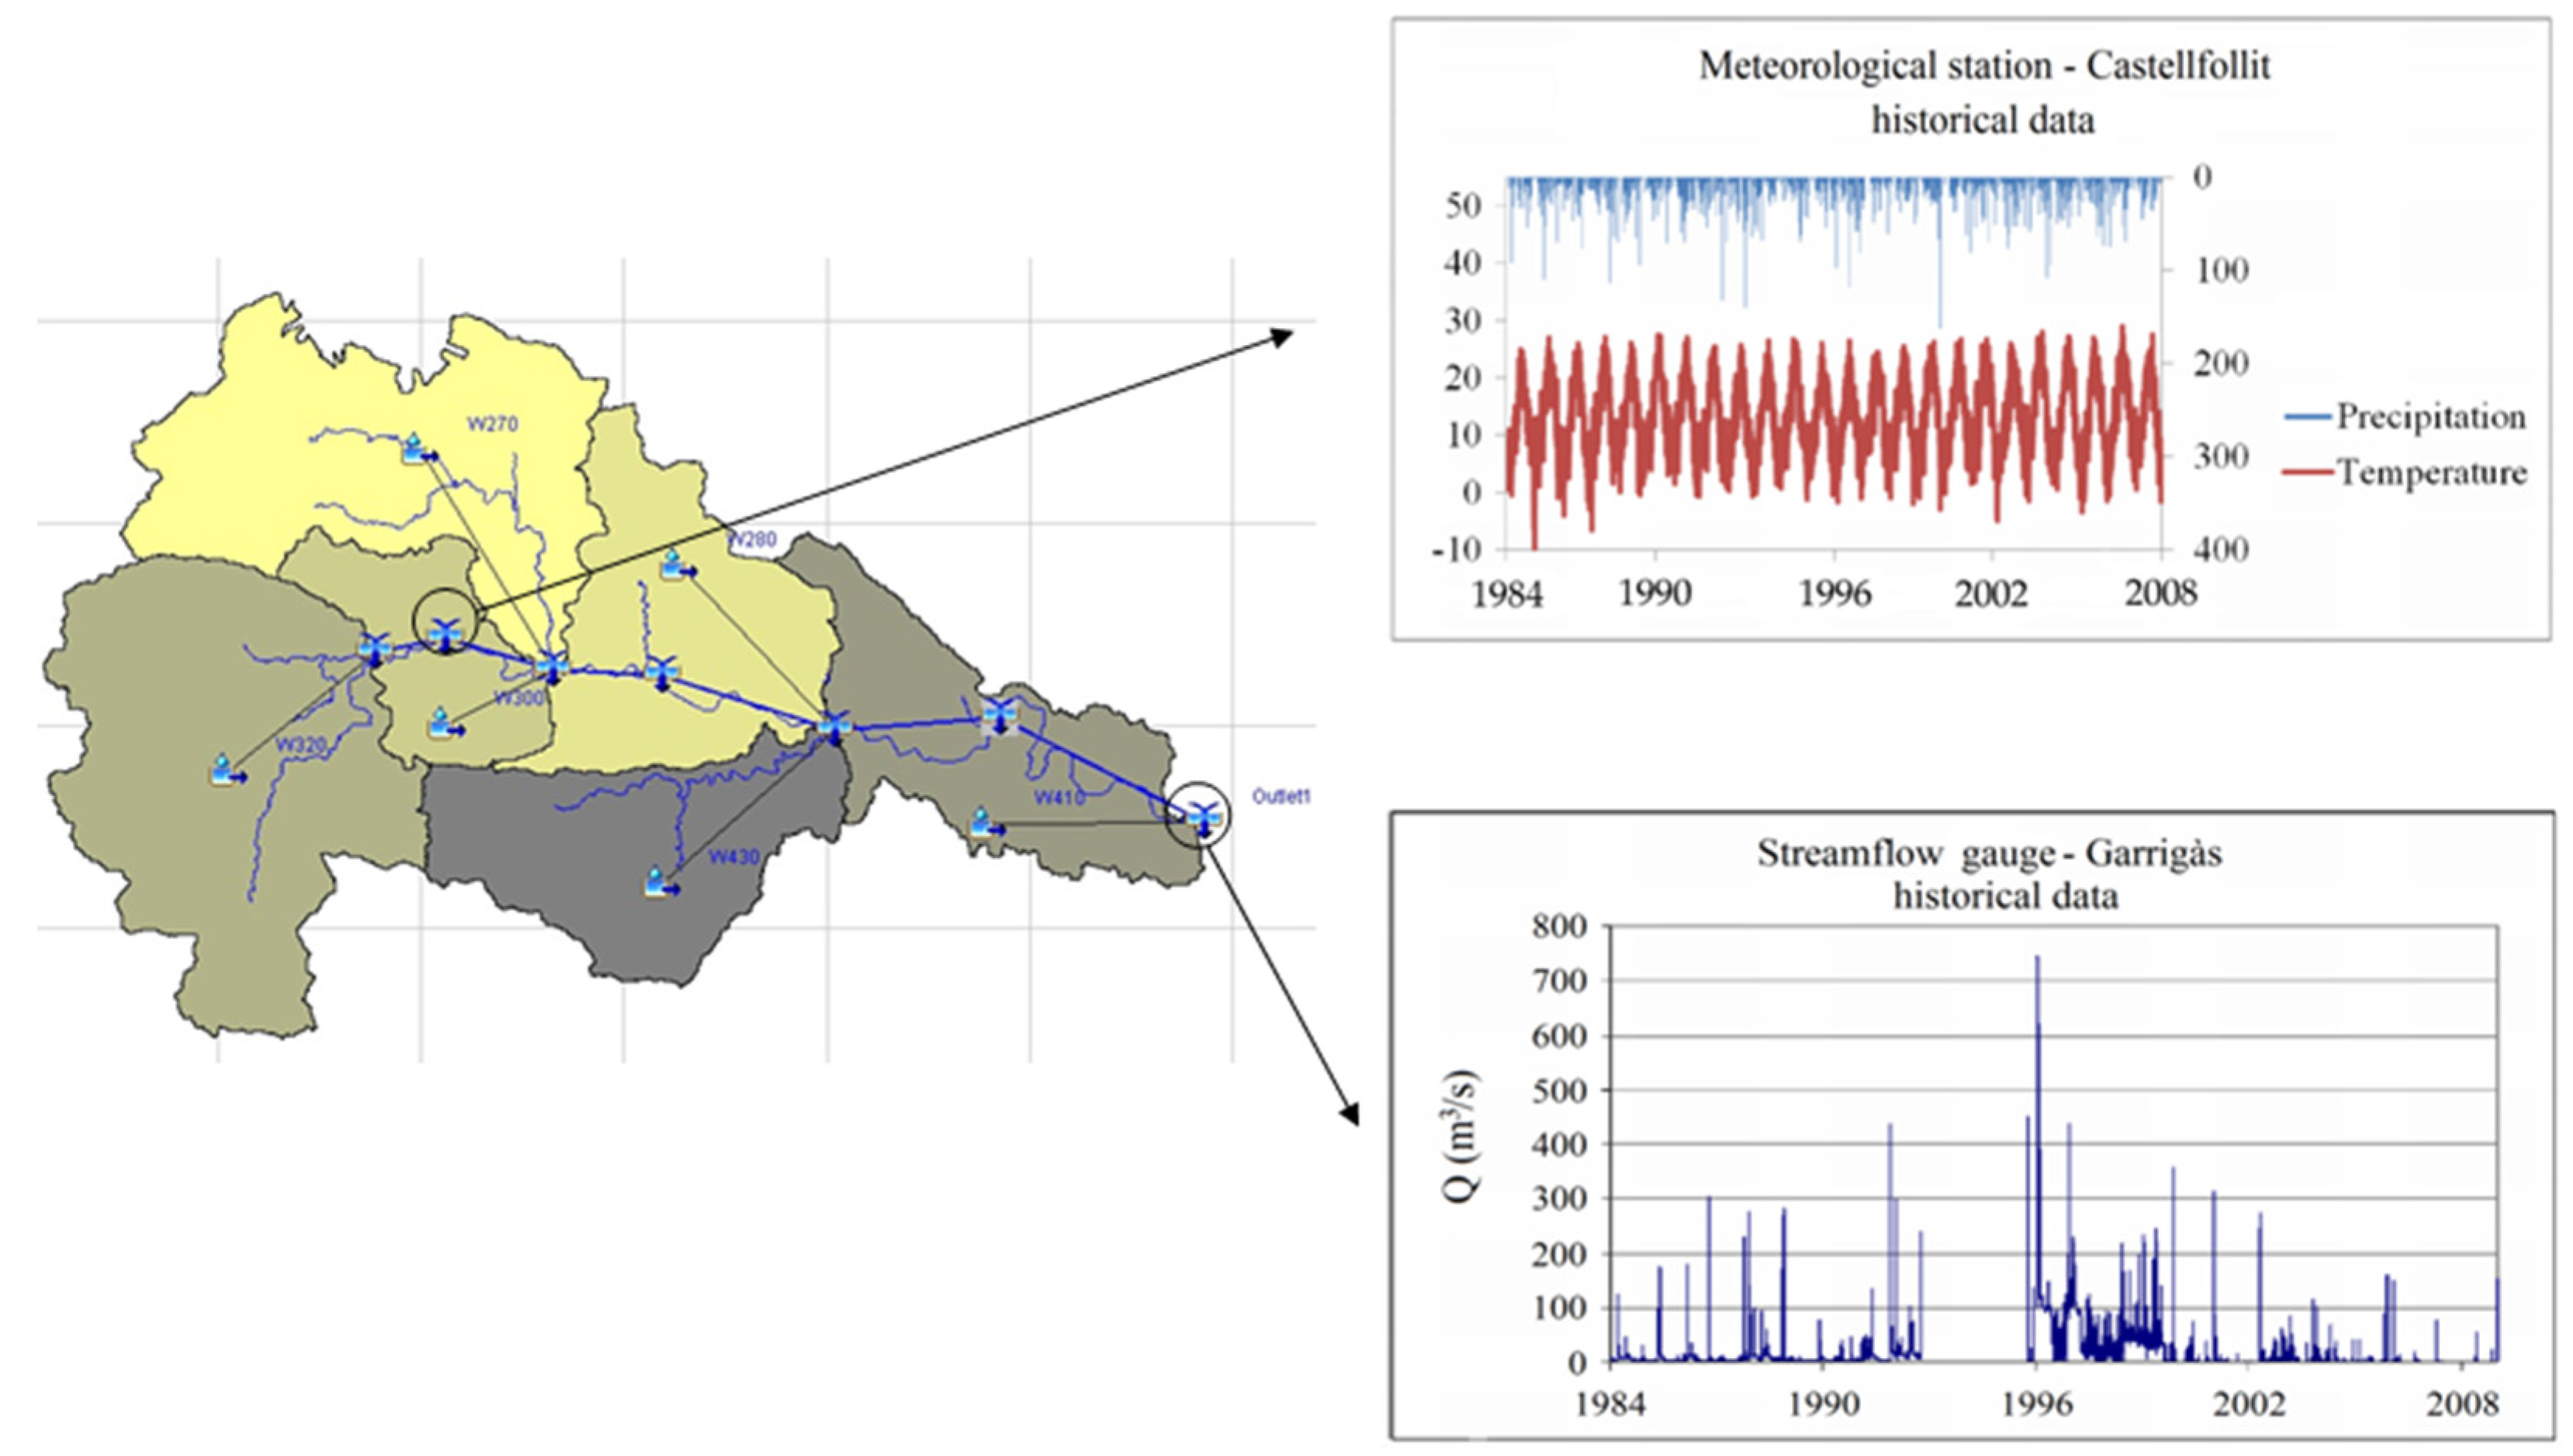
The climate is typical Mediterranean with marked seasonality, dry summers and rainy springs and autumns. For the historical period (1984–2008), the mean annual precipitation in the upper part of the catchment accounted for 1052 mm, while it reached 630 mm in the coastal area. Precipitations are strongly related to seasonal changes, with 80% occurring between October and April, with a monthly maximum of 105 mm in autumn and a minimum value of 30 mm in summer. Rainfalls have extreme variability; the precipitation can vary by large amounts, occurring mainly in autumn; indeed, a maximum rainfall event of 234 mm during a 24-h period was recorded in November 1999. The mean annual temperature is 14 °C, ranging between a maximum of 30 °C in summer and a minimum of −10.5 °C in winter. The mean annual potential evapotranspiration is 820 mm, as estimated by the Penman-Monteith method.
The hydrographic network is composed of the Fluvià River and several tributaries that flow into the Mediterranean Sea through the L’Empordà wetland after passing a 70-km length (
Figure 1). The hydrology of the river is characterized by low flows in winter, some small snow-induced peaks in spring/early summer and smaller peaks in July and August due to the effect of rainfall events. For the study period (1984–2008), the average streamflow volume (annual yield) was 158 hm
3. The catchment hydrological response is dominated by a long dry season and a short wet season, in which even large inputs of rainfall may produce little or no response at the catchment outlet. Isolated events taking place over several consecutive weeks produce only a small amount of runoff. Within 24 h of a rainfall event, a direct runoff component at the basin outlet is produced. Due to the basin’s relatively small dimensions, the concentration time is a few hours, and consequently, direct runoff is discharged after a short period of time. Besides direct runoff, a secondary flow component of aquifer discharge (baseflow) is also observed. After a rainfall period, a rapid increase in the very low initial baseflow is produced followed by a long recession time period, even months, until attaining the initial baseflow. The long recession time is clearly explained by the groundwater discharges from the hydraulically connected aquifers.
From the hydrogeologic standpoint [
27], confined and unconfined aquifer units composed of aquifer materials of a detrital, alluvial, calcareous and volcanic origin constitute the main groundwater resources [
28]. Groundwater exploitation from wells is carried out mainly for the water supply of 60,000 inhabitants (2008 statistical data) and agricultural irrigation.
3. Methodology
3.1. General Approach
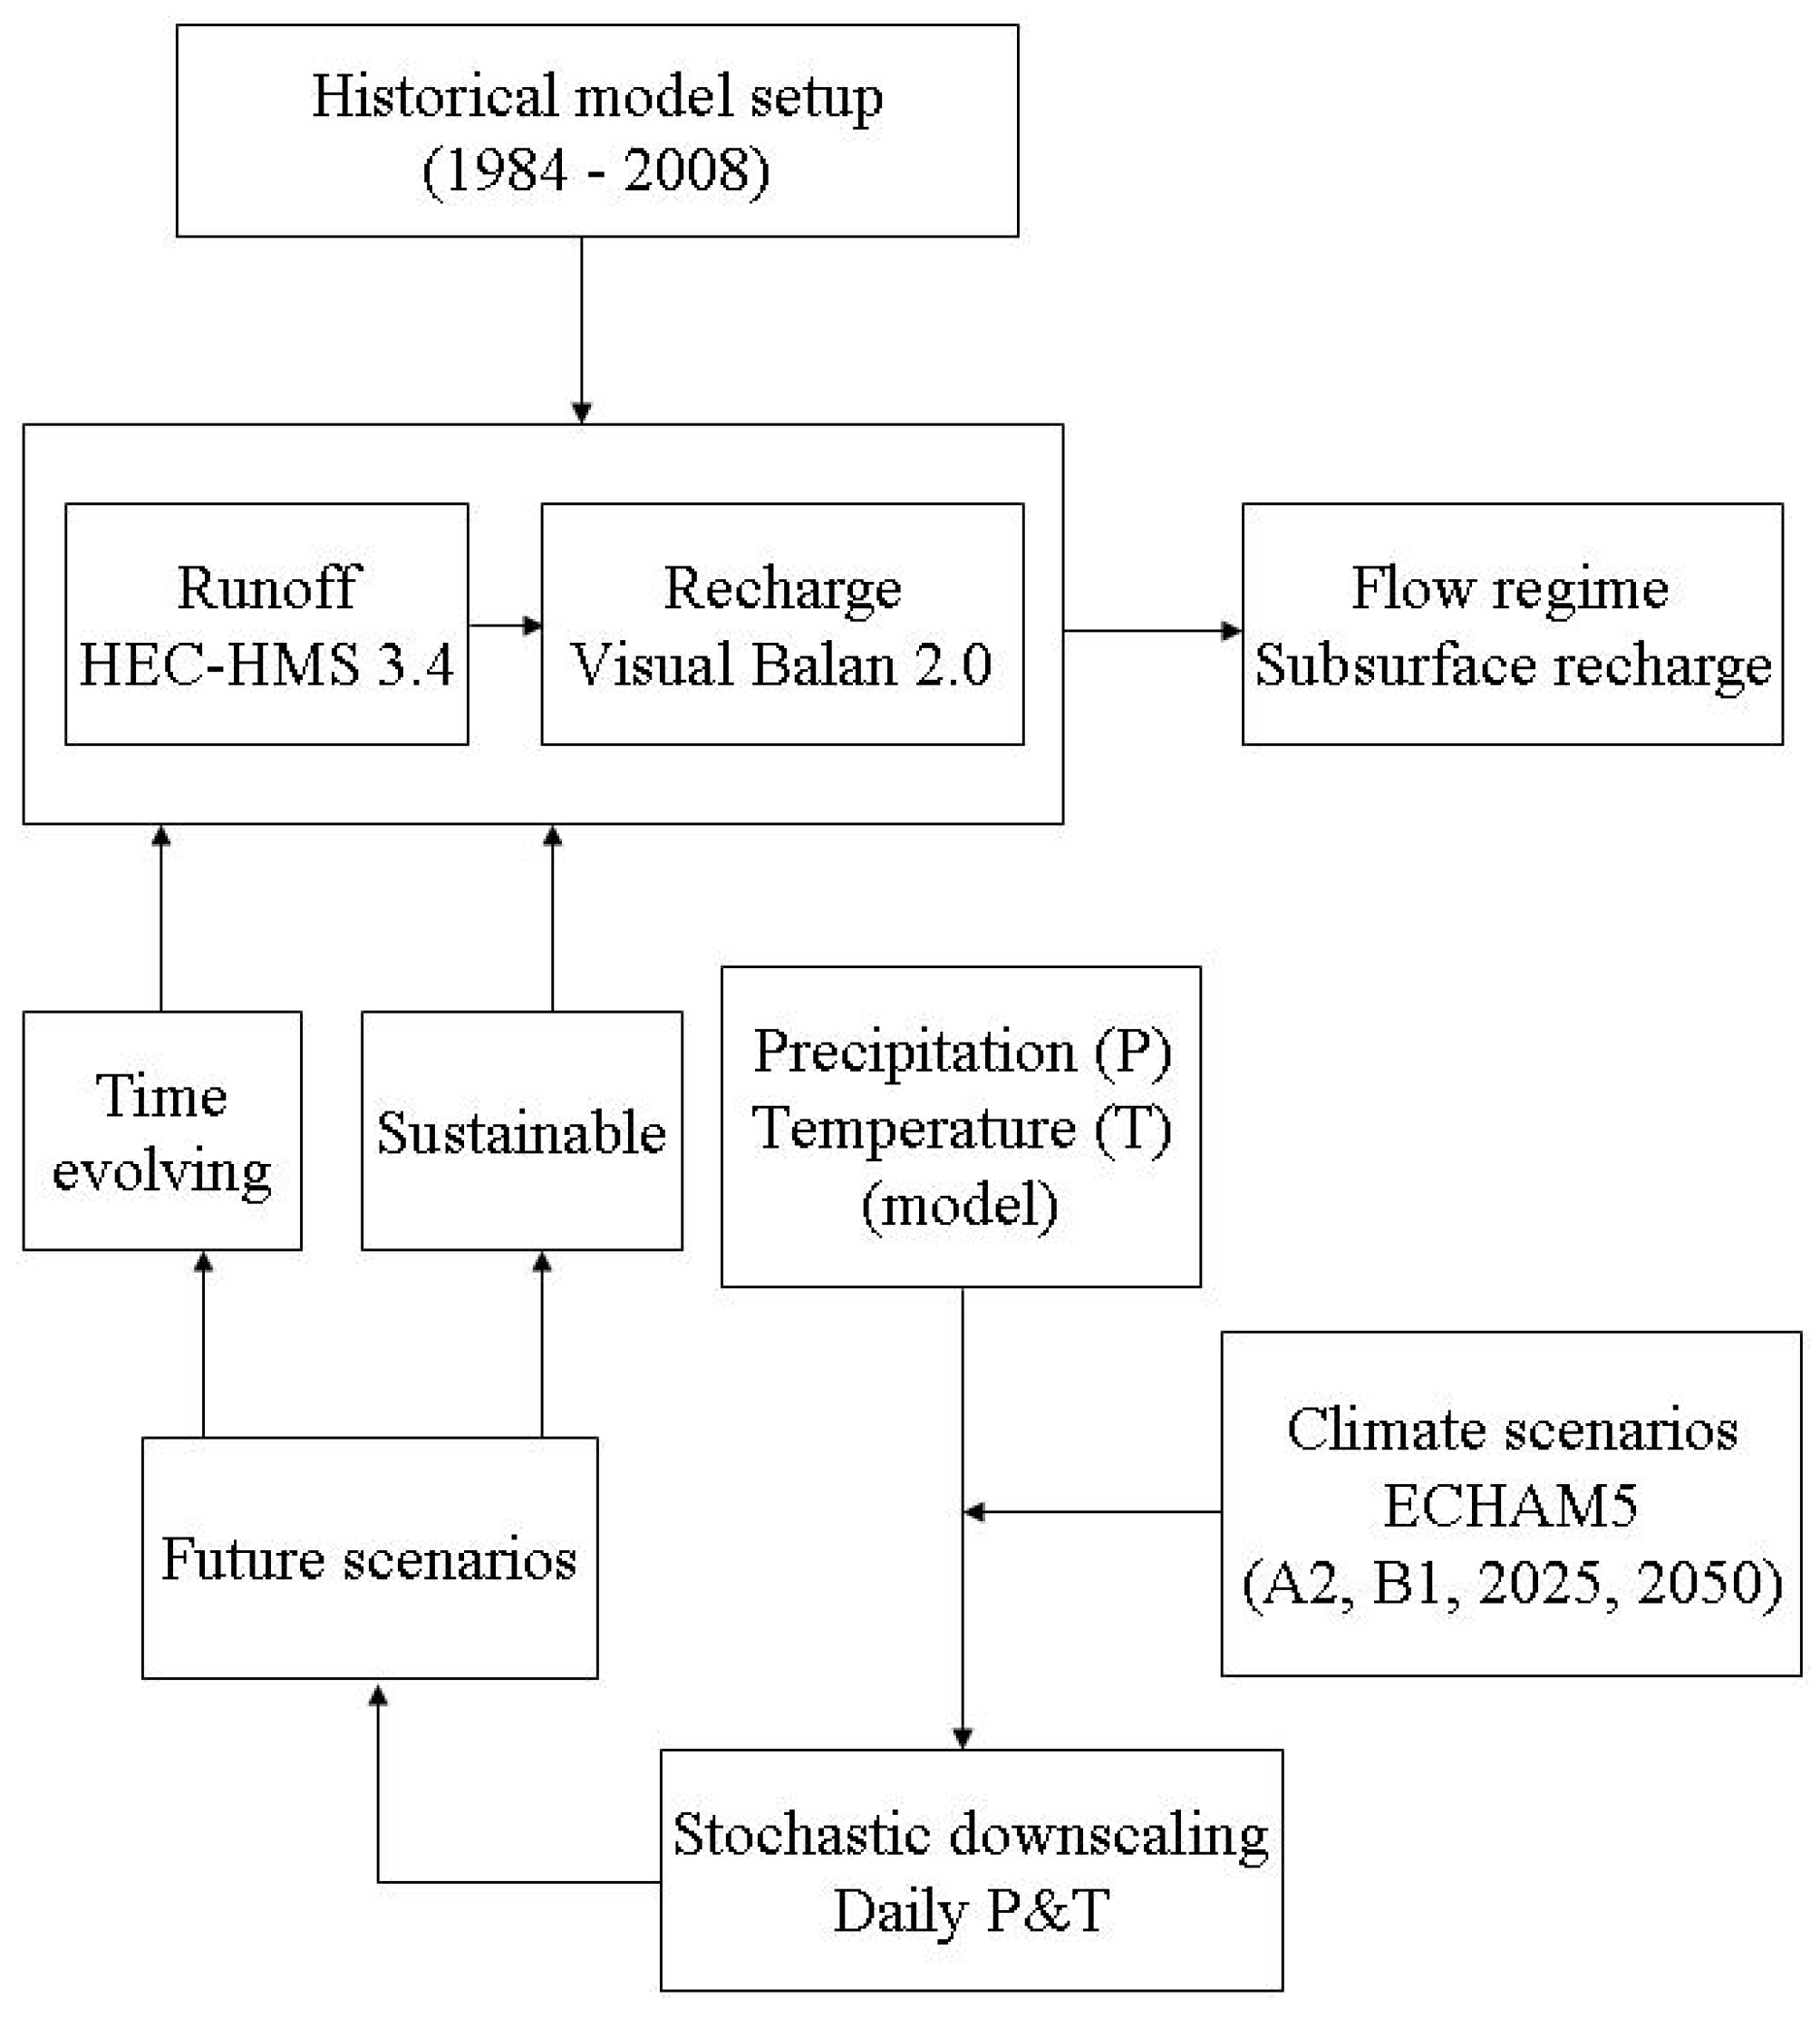
The basis of this work was the development of a methodological modelling-based framework that incorporates a global climate model, as well as hydrologic processes. Numerical models were applied to estimate streamflow and spatially-distributed groundwater recharge to simulate climate change impacts on water resources (
Figure 2).
The first step was to assess flow regime (streamflow) and recharge through modelling for the historical period (1984–2008). HEC-HMS 3.4 [
29] and Visual-BALAN 2.0 [
30] were the basic tools used for the baseline (or reference historical period) and future time period, according to the selected climate scenario, the change of crop type cultivation and land use/land cover. Secondly, streamflow and recharge for the A2 (medium high) and B1 (medium low) climate scenarios and the 2025 (2000–2024) and 2050 (2025–2050) time slices were simulated from downscaling the ECHAM5 (GCM) results (Max Plank Institute für Metereologie). Furthermore, a sustainable scenario with a moderate increase in vegetated land cover and a time-evolving scenario implying a major increase in urban areas were defined. Finally, streamflow and recharge estimation for B1, A2, 2025 and 2050 for the sustainable and time-evolving land use change scenarios were simulated. The new area distribution map includes land use and land cover estimations.
The multiple combinations of climate model, time slices, greenhouse scenarios, socio-economic scenarios and hydrological estimation methods resulted in six scenarios.
3.2. Datasets
Seven meteorological stations are located in the study area, three of them on the basin coastal boundary, covering a 25-year record of daily historical weather data were analyzed for the representative condition in the 1984–2008 reference historical period. All of the meteorological data were provided by the Spanish National Meteorological Agency (AEMET). Daily rainfall (P), average temperature (T), minimum and maximum temperature values were compiled. Missing value analyses and homogeneity tests [
31] were conducted for the available dataset (P and T). After extensively analyzing the datasets, records from two meteorological stations had to be rejected, as they contained large gaps and major errors; finally, five were selected, as shown in
Figure 1. Only La Vall d’en Bas, Castellfollit de la Roca and Roses database registered precipitation and temperature for the 25-year record. Both the historical and future scenario spatial precipitation distribution over the study area were obtained by interpolating precipitation data at existing meteorological stations using the Thiessen polygons method.
Four flow-gauge stations (
Figure 1) in the Fluvià basin were used for the runoff data assessment. Available records extend for the whole study period (1984–2008) with some gaps due to technical reasons. The streamflow data were obtained from the Catalan Water Agency (ACA).
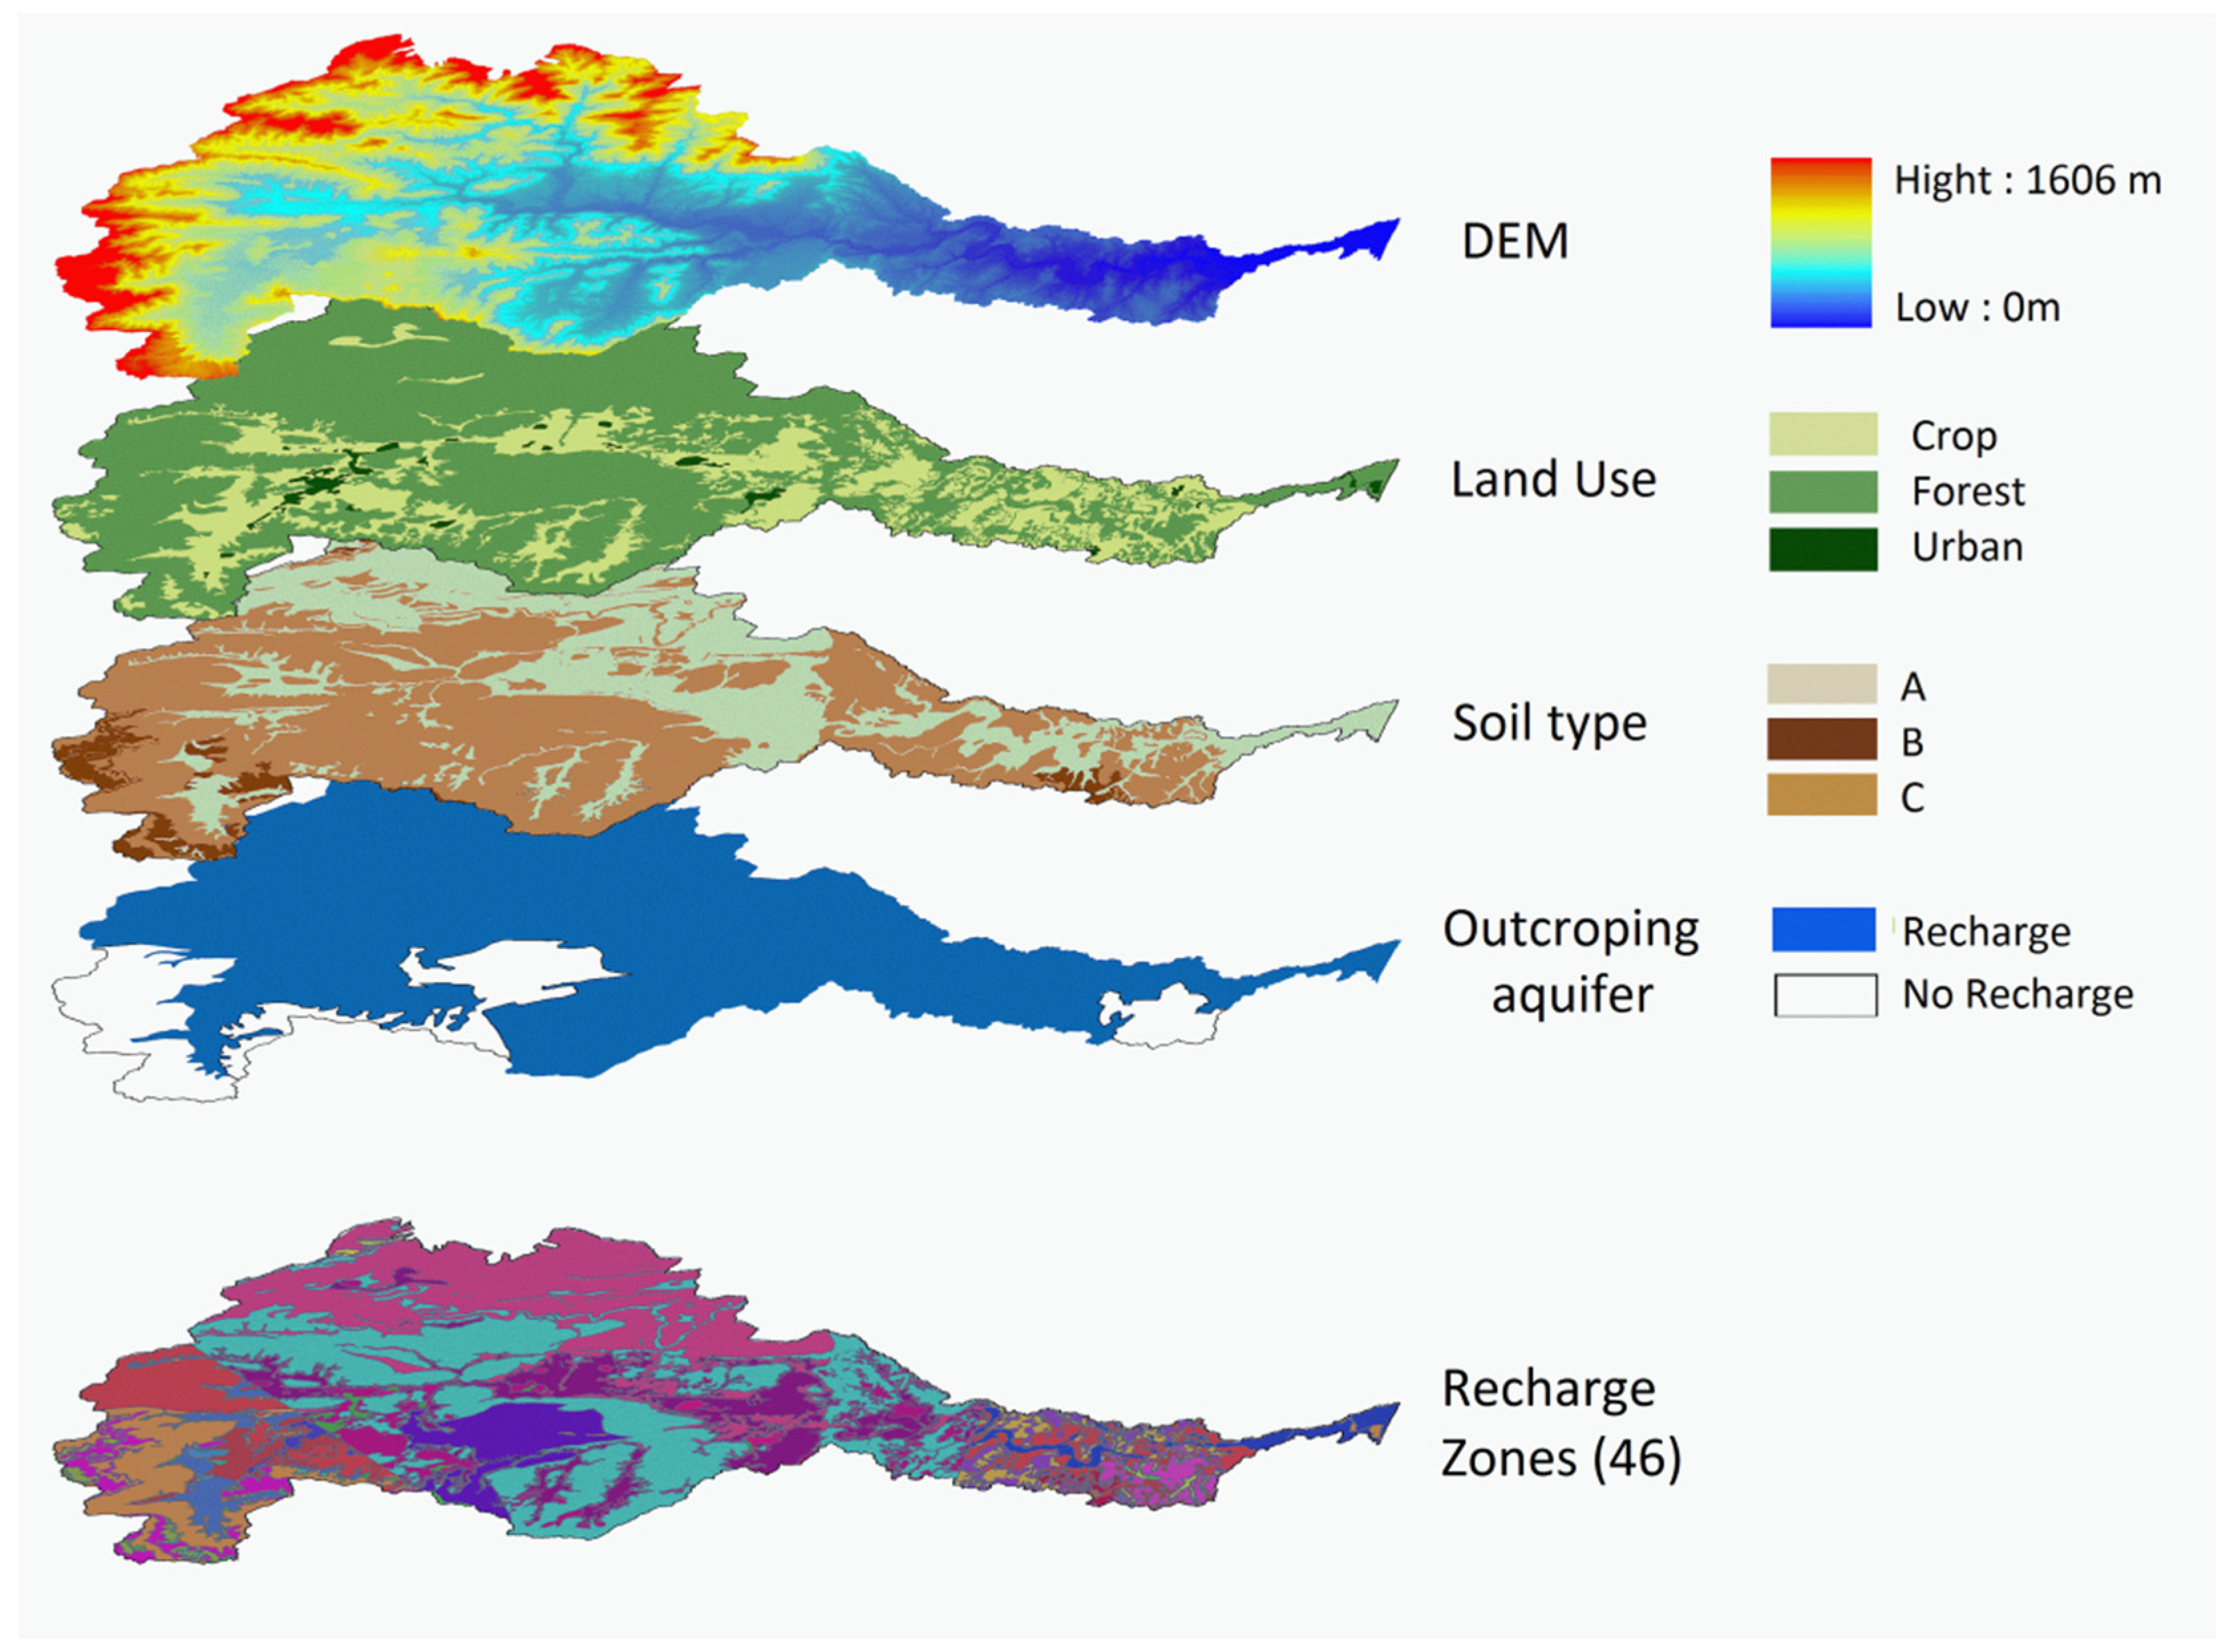
The soil map, land use and land cover data for both the baseline and future scenarios were provided by the IRTA agricultural research center (
www.irta.cat/en-US/Pages/default.aspx) and the European Topic Centre for Spatial Information and Analysis (ETC/LUSI,
www.sia.eionet.europa.eu/Consortium/UAB). Soil characteristic parameters (clay and silt content and hydrologic soil group) were compiled from the soil base map. Regarding the future land use/land cover in the basin, the forecast was based on the data provided by the Pla Territorial General de Catalunya [
24], currently in force in this Autonomous Community, which establishes regional planning projections until the year 2030. This horizon was selected after considering the difficulties for realistic long-term predictions.
The aquifer units outcropping in the area (six, total or partially outcropping) and hydrologic properties were those defined by the [
27] and were based on the hydrogeologic map (Mapa d’àrees hidrogeòlogiques de Catalunya; 1:250,000).
All of the spatial data (input and output) on the catchment scale required for this research were stored and managed in a GIS through base maps projected as layers in ArcGIS 9.2 (ESRI®). The topographic surface was based on a 10 m × 10 m digital elevation model (DEM) provided by ETC/LUSI.
3.3. Rainfall-Runoff Processes and Modelling
The Fluvià basin flow regime analysis and modelling were performed in two steps. First, a rainfall-runoff black box model based on the curve number method, which takes into account daily flow at the basin outlet and precipitation, was specifically developed in a 132.4 km
2 subcatchment located in the northern part of the basin (Vall d’en Bas, Olot, not shown here). In this catchment, the availability and quality of the meteorological, land cover/land use and flow regime data allow for accurate hydrograph derivation from a specific precipitation amount and, consequently, the assessment of the proposed approach. In the second step, a streamflow numerical model for the Fluvià basin was developed and implemented. For the flow regime analysis, the HEC-HMS 3.4 [
29], a spatially-distributed numerical code designed to simulate rainfall-runoff processes for short- and long-term duration events, was applied. Code selection was based on its user-friendly structure and its applicability to our proposed goals, and it has also been widely used in different watershed systems ([
32,
33], among others).
Among other capabilities, HEC-HMS is capable of simulating event-based and continuous modelling of variable hydrological processes. It offers the possibilities of evaluating three different layers in the hydrological system: atmosphere, vegetation and surface soil. The model allows the simulation of movement of water once it has entered the system as rainfall. Soil percolation is understood herein as subsurface recharge.
Continuous soil moisture assessment was carried out by the soil moisture accounting (SMA) sub-model, which simulates water movement (input-output) and storage through vegetation, soil surface, soil profile and groundwater. Water storage was simulated for precipitation event intervals. The ModClark rainfall-runoff transformation method applied is based on Clark’s unit hydrograph method [
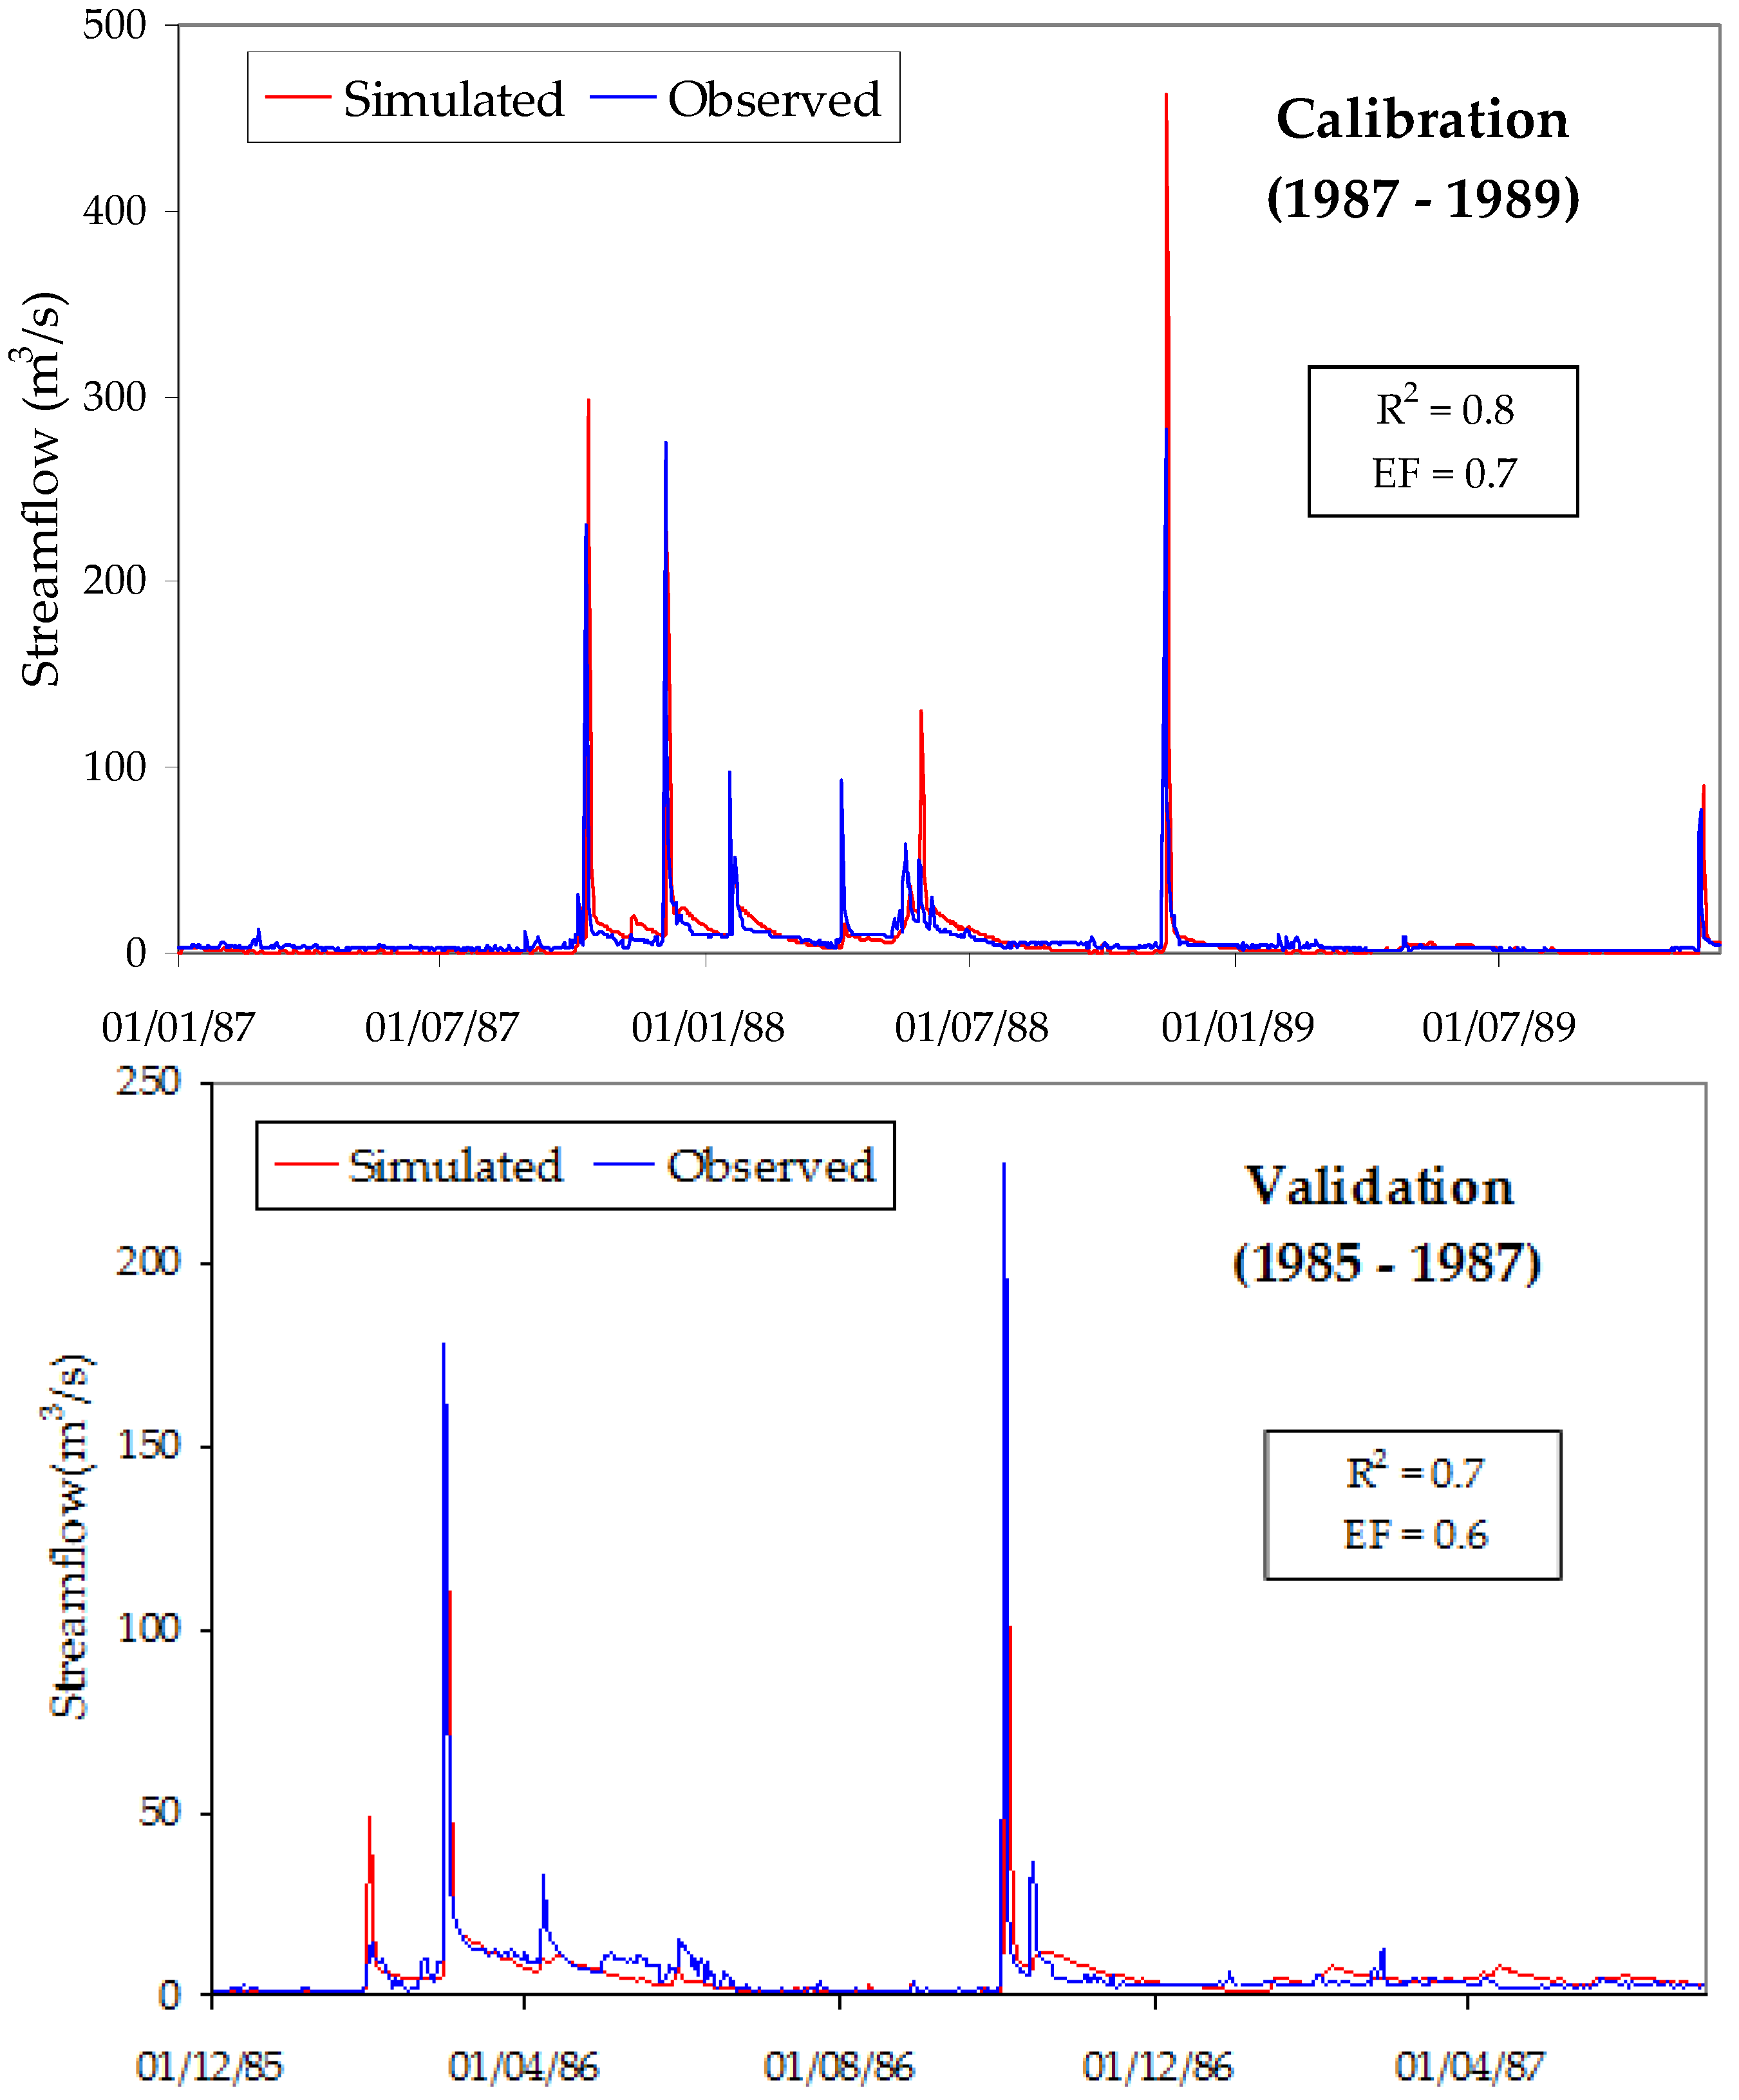
34]. For baseflow simulation, the linear reservoir method based on mass conservation was applied, as well as the kinematic wave method for the flood routing process. The model was run on a daily basis (time step of 24 h). The calibration period was January 1987–November 1989, and validation went from December 1985–June 1987; streamflow data series selection was based on their accuracy (data from the Garrigàs flow-gauge station;
Figure 3).
The catchment area was subdivided into eight sub-basins (
Figure 3), characterized by a unique combination of topography, land cover, land use and soil type, among other physiographic features, which was assumed to be averaged along the sub-basin in relation to its hydrologic properties. All of the requested information, raster maps of land use and land cover based on DEM were stored in a 1000 m × 1000 m grid. The information was built up in a GIS based on the HEC-GeoHMS tool. The boundary condition (system input) was the precipitation observed in the five rain gauges, while the initial condition to solve flow equations was the initial moisture state in the catchment. The fitting simulating the observed data (streamflow) was guided by visual inspection and statistical measures [
35]. The Nash–Sutcliffe model efficiency index (EF), used to assess the predictive power of the hydrological models, and the coefficient of determination
R2 were applied to assess the fit between the observed and predicted data.
Future predictions were obtained by running the model with the GCM downscaled meteorological data (input), while the model parameters remained unchanged. In calculation terms, the model initiates simulation after considering the parameters that represent the initial state of the system, characterized by four layers or levels for model parameterization.
3.4. Recharge Assessment and Modelling
The groundwater recharge from precipitation in the outcropping aquifers in the Fluvià River catchment area was computed by Visual-BALAN 2.0 [
30], a user-friendly modular design model based on a physical water-soil balance that has been successfully applied in many areas [
23,
36].
The code comprises three sub-models that take into account processes in the upper part of the soil (root zone), the unsaturated and saturated (aquifer) zones in a chained form. The potential recharge to the aquifer is the water that reaches the bottom of the unsaturated zone (percolation). The code also allows the calibration of the obtained recharge against groundwater level observations from the wells in the study area. Soil water processes include infiltration, evaporation, plant uptake and percolation to lower layers. Surface components are rainfall, irrigation, surface runoff, which derive from the curve number method [
37], and infiltration capacity, which is a function of the soil hydrologic properties. The main input variables are meteorological (mean daily temperature, solar radiation, daily precipitation), soil-aquifer parameters (soil depth, porosity, field capacity, wilting point, hydraulic conductivity, specific yield and transmissivity), vegetation parameters (height and interception coefficient) and irrigation. Detailed information on the model is presented in the
Supplementary Materials.
For this study, 46 recharge zones (
Figure 4) were assumed homogeneous compared to the soil parameters, land use (forest, urban, irrigated and non-irrigated crop areas), slope, altitude and meteorological data. The data of cultivated crops (pasture, barley, corn rye, alfalfa, apple trees, sunflower) were provided by the Census of Agriculture (Spanish Ministry of Agriculture), and the irrigation amounts applied by local farmers were obtained directly from field surveys.
Daily potential evapotranspiration (PET) for existing vegetation (forest and bushes) and crops was provided by the IRTA and CREAF (Centre de Recerca Ecològica i Aplicacions Forestals), and actual evapotranspiration (ET
0) was calculated by Blaney–Criddle, a commonly-accepted method for Mediterranean areas [
38]. Aquifer recharge, according to cultivation patterns (distribution and type of crop, irrigation schedule and amount applied), was assessed by estimating the corresponding plant-soil-water balance at the field scale in the catchment area. It is noteworthy that for the existing aquifers in the study area, extension did not fully correspond to the surface catchment boundary conditions to allow an accurate aquifer balance assessment; thus, we focused on natural recharge.
As Visual-BALAN soil-plant-water balance runs also provide a streamflow estimation with time, the runoff values measured at the Garrigàs gauge station, located at the lower end of the Fluvià catchment (
Figure 1), were used to assess the amount of recharged water. The contrast process also allowed the assessment of the preferential flow coefficient, evapotranspiration and recharge on transit. This approach was considered the best option, as available piezometric observations were lacking in many areas, and the datasets were of poor quality, when available, which impaired the simulated-observed recharge calibration.
For future recharge scenarios, daily precipitation and temperature from the downscaled GCM outputs and new land use scenarios (spatial distribution land cover and crop type according to the Land Planning Act, [
24]) were established; irrigation amount was assigned according to crop requirements.
3.5. Climate Change Scenarios
For the climate change impact assessment in the hydrological system, the ECHAM5 (
www.mpimet.mpg.de/wissenschaft/globale-klimamodellierung/echam/echam5/) coupled atmosphere-ocean general circulation model (GCM) was applied for this work. ECHAM5 has been widely used in climate change studies by the Fourth Intergovernmental Panel on Climate Change [
39]. The spatial resolution is equivalent to 50 km × 50 km for the latitude of interest. The model was run for estimated greenhouse gas scenarios (SRES) of medium-high (A2) and medium-low (B1) and the time slices or periods of 2013–2037 (named 2025) and 2038–2062 (named 2050), as provided by the Max Planck center. The ECHAM5 reference period run is the 1971–2000.
The future scenario results were downscaled to translate the outputs from the GCM model into useful information on a regional scale [
11,
40]. Several techniques are available for generating high resolution climate information and downscaling, but some tend to be complex and/or computationally expensive, and it is not always straightforward which techniques should be adopted [
41].
Precipitation is a random natural process and exhibits an effect influenced by previous events, although subsequent events are not rigidly controlled and can be regarded as a Markov chain process that can be downscaled by stochastic methods [
42]. The rainfall generator was based on a first-order non-stationary Markov chain-dependent process for modelling rainfall occurrence (based on the assumption that the probability of a wet/dry day is fully defined if precipitation occurred, or not, on the previous day) and a Weibull distribution for modelling the amount of rainfall [
43]. The amount of precipitation refers to a rainfall event of more than 0.1 mm/d. A classical first-order autoregressive moving average model in both the autoregressive and moving average (ARMA (1,1)) for temperature was used [
44]. The output obtained was daily temperature and precipitation. Future spatial precipitation was obtained from the five stations’ downscaled data. For a more profound explanation of the applied methodology, the reader is directed to information contained in [
18] and the
Supplementary Materials.
3.6. Land Use/Land Cover Data and Projections
Land use and land cover projections (for sustainable or time-evolving land use/land cover change scenarios) on the local scale were defined by taking into account not only the potential future evolution in the basin following the socio-economic trends in the area, but also additional official information on population projections, water management, land planning, irrigation demand projections and natural protected areas. The Land Planning Act currently in force forecasts only the land use/land cover changes by the year 2030. Changes in land use/land cover maps were obtained for future scenarios to be coupled to the hydrologic models for the streamflow and recharge estimations in the two projected scenarios.
Modelling was achieved with the Land Change Modeler 2.0 code (LCM) based on the IDRISI Taiga model (
www.clarklabs.org) and was carried out by LUSI. Specifically, changes (or story lines) in agriculture and irrigation, deforestation, reforestation and afforestation, but also from urbanization or transportation, were considered for sustainable or time-evolving land use/land cover changes.
4. Results
4.1. Historical Period (1984–2008): Streamflow and Subsurface Recharge Results
In
Figure 5, the comparison of simulated (HEC-HMS 3.4) and observed hydrographs for the calibrated and validated periods, along with the goodness-of-fit statistics, are presented. Most peak events are well simulated, and the baseflow comes close to the observations. An explanation of the peak events not captured by the model might be related to the spatial distribution of the rainfall events in the catchment (characteristic of the Mediterranean region) and the rainfall gauge spatial density distribution. It should also be noted that the data compiled at the discharge gauge cannot be considered representative of the total discharge on a given day; measured streamflow datasets correspond to a given time (midday).
Differences between the observed and simulated volume of discharge are around 1.5% and 2% for the simulated and calibrated periods, respectively, which fall within the range of acceptable error [
45]. The statistical evaluation reports good values for the calibration and validation periods; the Nash–Sutcliffe efficiency indices range between 0.6 and 0.7, indicating that model predictions are more accurate than the observed mean and that the determination coefficient (
R2, where a value of one presents a perfect fit between the observed and predicted values) is always higher than 0.7.
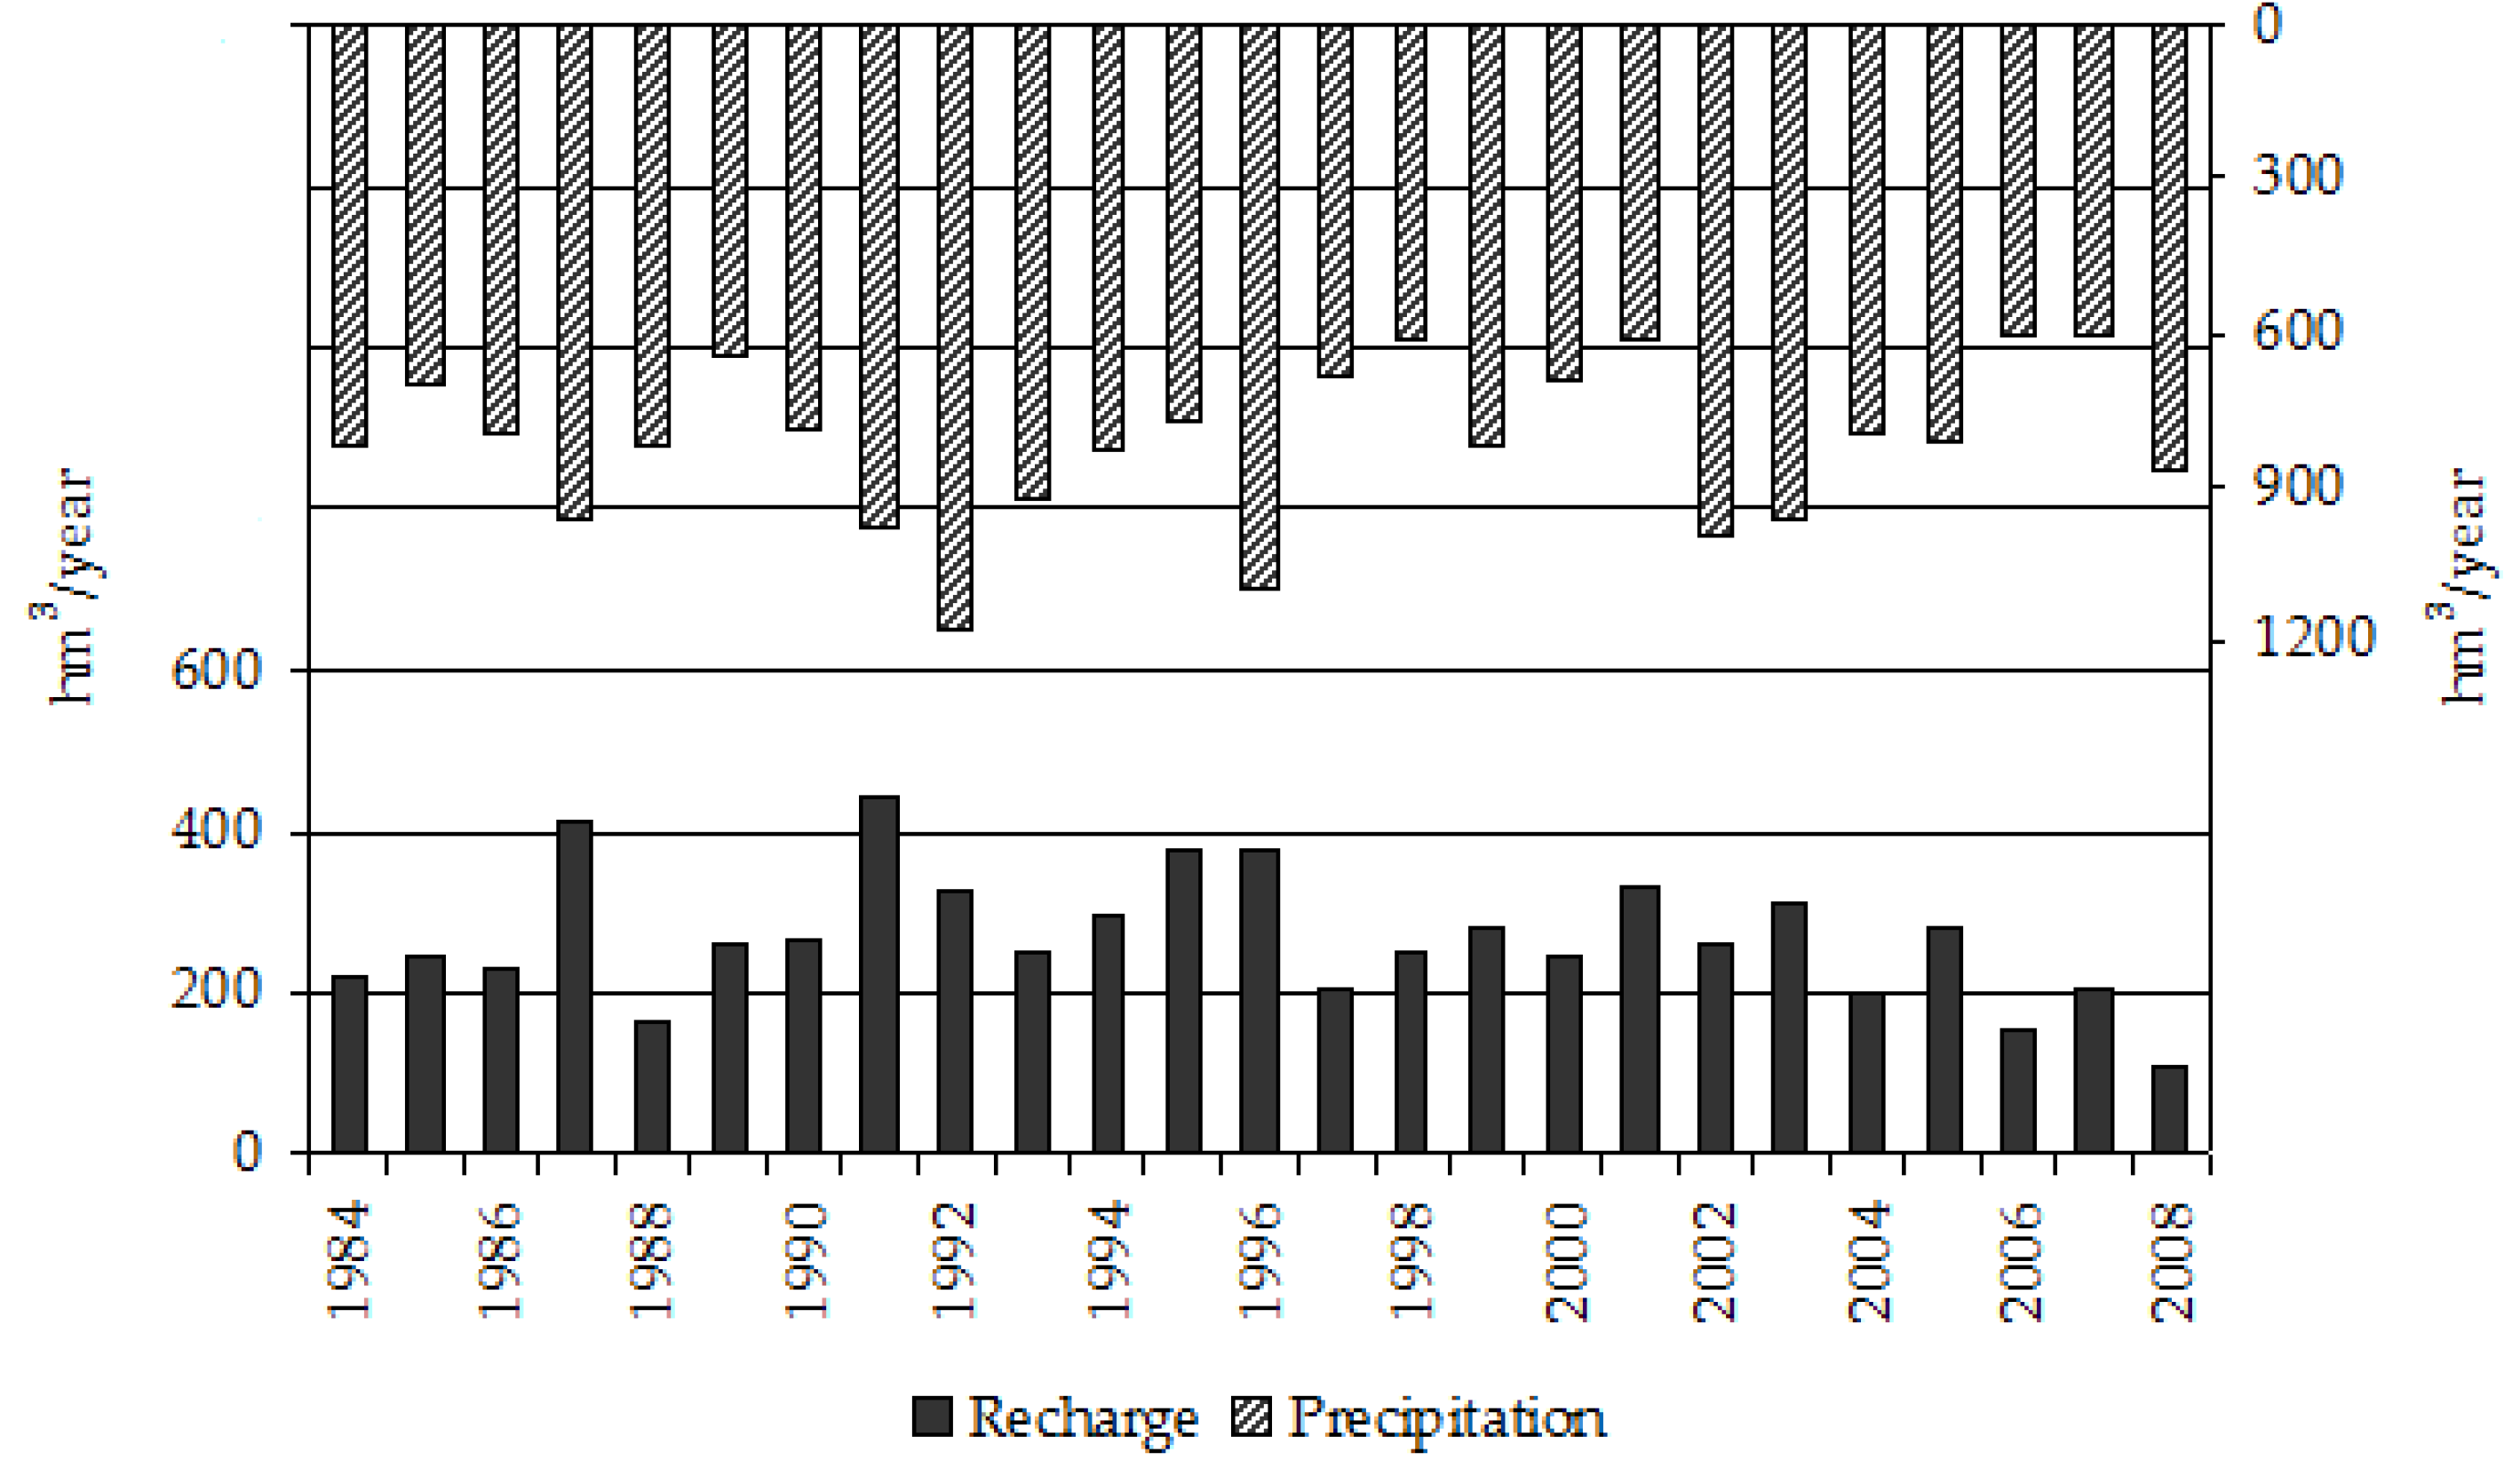
Figure 6 presents the net natural recharge results for the historical period and the outcropping aquifer area in the Fluvià catchment obtained with Visual-BALAN. The average recharge for the 1984–2008 period accounts for 273 hm
3·year
−1, which represents 31% of the total precipitation for the same period, a value that can be considered representative for this area. According to the obtained results, the highest values of recharged volume are associated with forested land, which constitutes 76% of the basin headwater land cover. Although most values lie around the historical average, a slight decreasing recharge trend has been observed since 2003, a fact that is also reflected in the observations of the historical rainfall data series.
The Visual-BALAN contrast analysis presented a difference in the results of 10%, which is an acceptable error, and also shows the capability of the applied approach for the groundwater recharge assessment. The fact of taking into account the aquifer extent within the surface basin boundaries does not invalidate the obtained results, as the groundwater discharge to the stream channel is an estimate of the streamflow during rainless periods.
4.2. Climate Change Forecast and Effects on the Hydrological System
The climate results for the historical, 2000–2024 and 2025–2050 periods and climate change scenarios (B1, A2) according to the downscaled ECHAM5 outputs (temperature and precipitation) are summarized in
Table 1. Observations (1984–2008) and downscaled precipitation and temperature for the reference period (ECHAM5, 1971–2000) have been also included as
Supplementary Materials. The results indicate a major increase in temperature and a drop in precipitation compared to the historical data (especially for the A2 scenario and the 2025–2050 time slice). Other researchers have obtained similar results in the studies they have done in the Mediterranean region [
16,
18,
46]. A decreasing rainfall trend is observed along time and scenarios, although a moderate increase in precipitation is detected for the B1 greenhouse scenario at the end of the simulated 2025–2050 period (in comparison to the 2000–2024 time slice), which can be attributed to the associated uncertainties of the results. Changes are not evenly distributed along time, as they are related directly to monthly precipitation.
It should be noted that the GCM direct output provides relative changes between two time slices (and climate scenario), later downscaled at the regional scale. For the 1971–2000 period, the downscaled ECHAM5 temperature value was 13.3 °C (mean annual); at the three meteorological stations, values ranged between 12.9 °C and 15.1 °C for the 1984–2008 (historical). Regarding precipitation, the estimated downscaled value (405 mm, ECHAM 5 reference period) underestimates the observations (870 mm, average) recorded at the five meteorological stations (1984–2008). Consequently, the estimated change in rainfall needs to consider the uncertainties arising from the GCM results [
47], which may even be greater than the predictions [
40]. In the study area, uncertainties still remain on precipitation changes, and predictions should be treated with caution; estimated values are generally lower than observations and the extreme spring and autumn Mediterranean seasonal variability, when most of the rainfall takes place, is not reflected in the simulated data. Therefore, the precipitation decrease trend is only an indication of the system’s potential response.
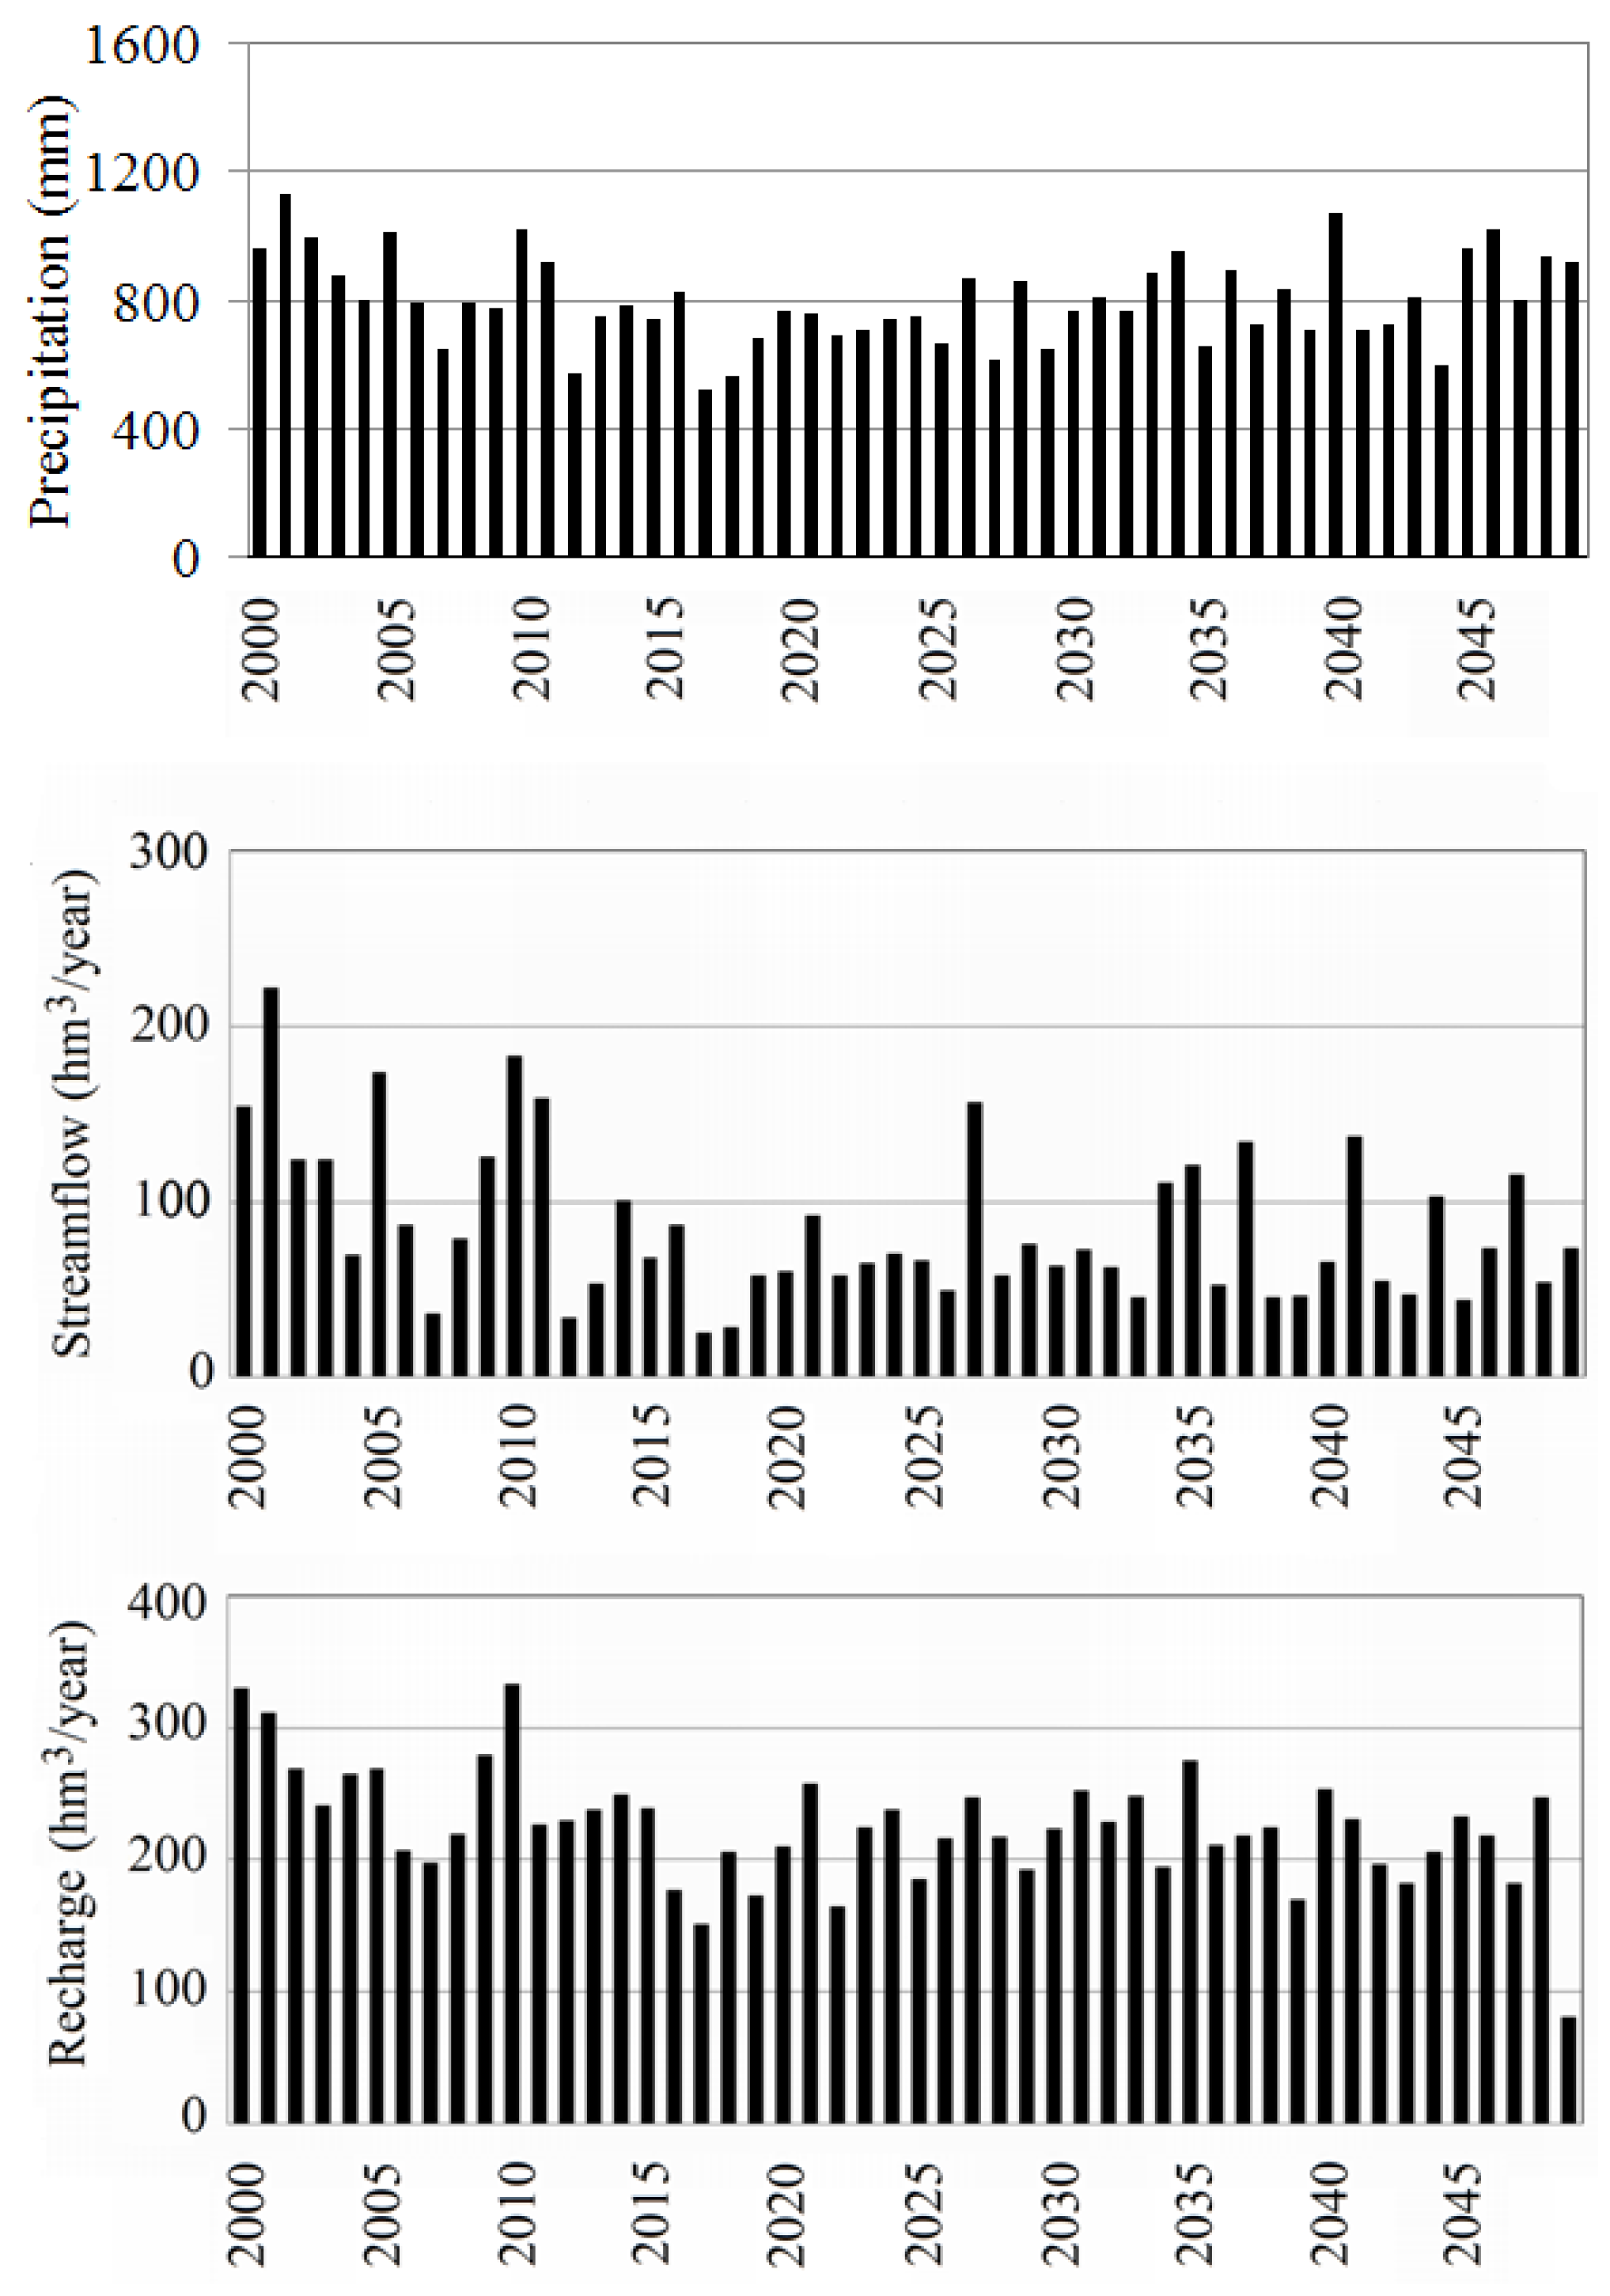
Assuming that climate change alone drives changes in the hydrologic system, an overall decrease in streamflow and natural recharge is forecasted in the study area for the future scenarios (
Table 2). As expected, the widest variability is observed for scenario A2 (medium-high greenhouse effects), with a minimum recharge value of 216.7 hm
3 and 74.2 hm
3 of streamflow at the end of the period (2050). By the end of 2050, natural water resources’ availability will have significantly decreased (
Figure 7).
At the catchment level, a decrease in precipitation of 8.6% (B1, average) and 14.7% (A2, average) originates the reduction in runoff of 41.4% (B1, average) and 49.5% (A2, average), respectively, for the 2000–2050 time slice. Similar results have been obtained by [
48] based on SWAT.
For recharge, the response to the changes expected in the precipitation pattern led to decreases of 9.1% (B1, average) and 16.8% (A2, average) and to reduced aquifer storage. It is important to note that for B1 and for both time periods (2000–2024, 2025–2050), this decrease is estimated as 9% and that these values fall within the possible estimation error, while the reduction by the end of A2 (2050) still shows a greater decrease in recharge. The recharge processes from the precipitation taking place in soil, and saturated and unsaturated zones are delayed when compared to the predicted decrease in precipitation. This delay is the result of the non-linear behavior exhibited by the recharge process, the distribution of the amount recharged throughout the year and is also dependent on the soil and plant parameters. Compared to the runoff results, the amount of recharge reduction is always lower and delayed in time, as expected.
4.3. What-If Scenarios and Water Resources
The second water resource projected set, achieved by combining the IPCC scenarios of climate change and land cover and land use projections (conservative and time-evolving changes that imply land cover increase), is shown in
Table 2; output takes the historical (2005) available land use and land cover data records as a baseline reference. According to the LCM model, for the outputs at an explicit allocation in the landscape, an increase in the areal extension in forest (6%) and urban areas (18%) is forecasted, while a decrease in agriculture (12%), bushes (23%) and pasture (38%) is produced for the time-evolving scenario (increasing trend). For the sustainable scenario, forest, urban and pasture land cover increases (4%, 4% and 8%, respectively), and bushes and agriculture areal extension diminishes (23% and 11%, respectively). The most important difference between both scenarios refers to changes in the urbanization of the catchment.
Water resource availability after coupling the B1, A2 and conservative/time-evolving scenarios mentioned previously shows that forecasted/foreseen (according to regulations) land cover changes (2030 projection) appear to be the least representative parameter that conditions hydrologic changes. The comparison made of the projections obtained from the IPCC scenarios alone shows that the meteorological parameters (P, T) are the most important drivers to condition future water resources. The slight and realistic land use changes allowed in regulations currently in force at the basin level, if compared to projected changes on temperature and precipitation uncertainties from climatic results, may counterbalance the obtained results.
5. Summary and Conclusions
The work presented herein constitutes an attempt to develop an integrated approach of climate change impact and water resources on a local scale by linking a general circulation model (GCM) with streamflow and subsurface recharge numerical models. The results of a surface-recharge modelling application in the Fluvià catchment (Girona, Spain) are presented. As the catchment is a hydraulically-connected stream-groundwater system, modelling applies a distributed recharge model (Visual-BALAN) and the HEC-HMS code for surface water streamflow simulation.
Since the approach involves assembling equations for both groundwater recharge and surface water and considering the differences in hydrologic processes between the two regimes and datasets required, modelling the two domains was carried out independently. No interface was built, and modelling was done in a chained form. In the chained model, the recharge calibration/contrast was obtained from the streamflow data. The obtained results lie within the range of possible error, which proves the capability of the applied approach in hydrologic simulation.
At the Fluvià catchment level, the observed climate impact on water resources is mainly the result of higher temperature (and higher evapotranspiration due to increased temperature) and less rainfall. Nevertheless, it is important to note the associated uncertainties of the stochastic climate simulation. Foreseen realistic land use land cover changes do not appear to be an important parameter given the minor changes forecasted. However, unexpected events (i.e., fire impact on land cover) may produce major changes to the hydrologic system, which should be taken into account in further research. Regarding the diminished subsurface recharge process for future scenarios at the Fluvià basin level, although decreases of 8.6% and 14.7% in annual precipitation are expected for the B1 and A2 scenarios, respectively, changes in intra-annual rainfall and temperature regimes will have significant impacts. Recharge is highly sensitive to seasonal changes, and further detailed research is required.
The 2050 (A2) predictions show that climate change will affect all of the hydrological system resources; i.e., surface-subsurface components, as well as inter-connected ecosystems, and increased seasonal water demand by vegetation (including forested areas) or crops as a response to temperature and evapotranspiration increase. For the irrigated area, where higher transpiration rates are expected, fulfilment of plant requirements may imply a higher irrigation dose driven by declining rainfall, a fact that needs to be assessed. Therefore, as changes in the available water resources are foreseen in the future to cover this imbalance, water reduction demand represents the only option for planned adaptive measures.
The conclusions are, to some extent, subject to uncertainties and error propagation; it is important to notice that future states are much more uncertain and unpredictable in long time horizons that are implied by standard approaches [
49]. Existing limitations of modelling coupled complex climate-hydrologic systems are clear in this study, and future work is planned to address them. Deterministic estimates may be often wrong or misleading due to a lack of indication on the magnitude of underlying uncertainties or they do not provide an indication of the key sources of uncertainty (model structure, model parameters, data) or the propagation of one part of the system to the next. Quantifying and determining uncertainty and error propagation and how uncertainties may condition final results is a key issue to evaluating in detail the impacts in water resources, to support water managers to cope with changing water resources under future scenarios and to evaluate adaptation measures. If the research purpose is to use results as a knowledge input to decision-making, uncertainties are an important aspect to assess.
Despite the fact that accurate data are lacking over time and space at the catchment level and make this exercise and its good performance difficult, the outputs and experience gained in this research can contribute to prepare to cope with forecasted global change impacts on water resources in similar catchments with sparse surface-subsurface datasets.
Supplementary Materials
The following are available online at
www.mdpi.com/2073-4441/8/6/228/s1, File S1: Historical and downscaled data; File S2: downscaling; File S3: Visual-BALAN; File S4: Sub-basins characteristics.
Acknowledgments
This study forms part of a comprehensive project framework (ACCUA, under the CREAF coordination) funded by the Catalunya Caixa, Obra Social and the CGL2013-48802-C3-3-R Project, whose financial support is gratefully acknowledged. The authors acknowledge the cooperation of ACA, CREAF, IRTA and ETC/LUSI for the research.
Author Contributions
Lucila Candela, Karim Tamoh and Manuel Gomez conceived of and designed the research. Gonzalo Olivares, Manuel Gómez and Karim Tamoh collected and analyzed the data. Lucila Candela wrote and edited the paper.
Conflicts of Interest
The authors declare no conflict of interest.
References
- Scibeck, J.; Allen, D.; Cannon, A.; Whitfield, P.H. Groundwater-surface water interaction under scenarios of climate change using a high-resolution transient groundwater model. J. Hydrol. 2007, 333, 165–181. [Google Scholar] [CrossRef]
- Serrat-Capdevila, A.; Valdés, J.B.; González Pérez, J.; Baird, K.; Mata, L.J.; Maddock, T., III. Modeling climate change impacts—And uncertainty—On the hydrology of a riparian system: The San Pedro Basin (Arizona/Sonora). J. Hydrol. 2007, 347, 48–66. [Google Scholar] [CrossRef]
- Falloon, P.; Betts, R. Climate impacts on European agriculture and water management in the context of adaptation and mitigation—The importance of an integrated approach. Sci. Total Environ. 2009, 408, 5667–5687. [Google Scholar] [CrossRef] [PubMed]
- Daniela, R.D.; Trisorio, L.G.; Lamaddalena, N.; Ragab, R. Assessing the results of scenarios of climate and land use changes on the hydrology of an Italian catchment: Modelling study. Hydrol. Process. 2010, 24, 2693–2704. [Google Scholar] [CrossRef]
- Treidel, H.; Martin-Bordes, J.J.; Gurdak, J.J. Climate Change effects on Groundwater resources: A global Synthesis of Findings and Recommendations. In International Association of Hydrogeologists (IAH)—International Contributions to Hydrogeology; Taylor & Francis Publishing: Oxford, UK, 2012; p. 414. [Google Scholar]
- Antonellini, M.; Dentinho, T.; Khattabi, A.; Masson, E.; Mollema, P.N.; Silva, V.; Silveira, P. An integrated methodology to assess future water resources under land use and climate change: An application to the Tahadart drainage basin (Morocco). Environ. Earth Sci. 2014, 71, 1839–1853. [Google Scholar] [CrossRef]
- Sumner, G.N.; Romero, R.; Homar, V.; Ramis, C.; Alonso, S.; Zorita, E. An estimate of the effects of climate change on the rainfall of Mediterranean Spain by the late twenty first century. Clim. Dyn. 2003, 20, 789–805. [Google Scholar] [CrossRef]
- IPCC. Climate Change 2001: The Scientific Basis. Contribution of Working Group I to the Third Assessment Reports of the Intergovernmental Panel on Climate Change; Houghton, J.T., Ding, Y., Griggs, D.J., Noguer, M., Van Der Linden, P.J., Dai, X., Maskell, K., Johnson, C.A., Eds.; Cambridge University Press: Cambridge, UK; New York, NY, USA, 2001; p. 881. [Google Scholar]
- Kerr, R.A. Confronting the bogeyman of the climate system. Science 2005, 310, 432–433. [Google Scholar] [CrossRef] [PubMed]
- Kundzewicz, Z.W.; Somlyódy, L. Climatic change impact on water resources in a system perspective. Water Resour. Manag. 1997, 11, 407–435. [Google Scholar] [CrossRef]
- Bouraoui, F.; Vachaud, G.; Li, L.Z.X.; Le Treut, H.; Chen, T. Evaluation of the impact of climate changes on water storage and groundwater recharge at the watershed scale. Clim. Dyn. 1999, 15, 153–161. [Google Scholar] [CrossRef]
- Parry, M.L.; Canziani, O.F.; Palutikof, J.P.; van der Linden, P.J.; Hanson, C.E. Climate Change 2007: Impacts, Adaptation and Vulnerability. Contribution of Working Group II to the Fourth Assessment Report of the Intergovernmental Panel on Climate Change; Cambridge University Press: Cambridge, UK, 2007. [Google Scholar]
- FAO. Climate Change Water and Flood Security; FAO Water Reports 36; FAO: Rome, Italy, 2008. [Google Scholar]
- Green, T.R.; Taniguchi, M.; Kooi, H.; Gurdak, J.J.; Allen, D.M.; Hiscok, K.M.; Treidel, H.; Aureli, A. Beneath the surface of global change: Impacts of climate change on groundwater. J. Hydrol. 2011, 405, 532–560. [Google Scholar] [CrossRef]
- Armandine, A.L.; Aquilina, L.; De Ridder, J.; Longuevergne, L.; Pagé, C.; Goderniaux, P. Investigating the respective impacts of groundwater exploitation and climate change on wetland extension over 150 years. J. Hydrol. 2013, 509, 367–378. [Google Scholar] [CrossRef] [Green Version]
- Pulido-Velazquez, D.; García-Aróstegui, J.L.; Molina, J.L.; Pulido-Velazquez, M. Assessment of future groundwater recharge in semi-arid regions under climate change scenarios (Serral-Salinas aquifer, SE Spain). Could increased rainfall variability increase the recharge rate? Hydrol. Process. 2014. [Google Scholar] [CrossRef]
- Santos, R.M.B.; Sanches Fernandes, L.F.; Moura, J.P.; Pereira, M.G.; Pacheco, F.A.L. The impact of climate change, human interference, scale and modeling uncertainties on the estimation of aquifer properties and river flow components. J. Hydrol. 2014, 519, 1297–1314. [Google Scholar] [CrossRef]
- Candela, L.; von Igel, W.; Elorza, F.J.; Aronica, G. Impact assessment of combined climate and management scenarios on groundwater resources and associated wetland (Majorca, Spain). J. Hydrol. 2009, 376, 510–527. [Google Scholar] [CrossRef]
- Döll, P. Impact of climate change and variability on irrigation requirements: A global perspective. Clim. Chang. 2002, 54, 269–293. [Google Scholar] [CrossRef]
- Candela, L.; Elorza, F.J.; Jiménez-Martínez, J.; Von Igel, W. Global change and agricultural management options for groundwater sustainability. Comput. Electron. Agric. 2012, 86, 120–130. [Google Scholar] [CrossRef]
- Scanlon, B.R.; Healy, R.W.; Cook, P.G. Choosing appropriate techniques for quantifying groundwater recharge. Hydrogeol. J. 2002, 10, 18–39. [Google Scholar] [CrossRef]
- Jiménez-Martínez, J.; Skaggs, T.H.; Van Genuchten, M.T.; Candela, L. A root zone modelling approach to estimating groundwater recharge from irrigated areas. J. Hydrol. 2009, 367, 138–149. [Google Scholar] [CrossRef]
- Jiménez-Martínez, J.; Candela, L.; Molinero, J.; Tamoh, K. Groundwater recharge in irrigated semi-arid areas: Quantitative hydrological modelling and sensitivity analysis. Hydrogeol. J. 2010, 8, 1811–1824. [Google Scholar] [CrossRef]
- GOV/157/2010. ACORD de 14 de Setembre, pel Qual S’aprova Definitivament el Pla Territorial Parcial de les Comarques Gironines; Departament de Politica Territorial i Obres Publiques, Generalitat de Catalunya: Barcelona, Spain, 2010. [Google Scholar]
- ACA. Pla de Gestió del Districte de Conca Fluvial de Catalunya; Departament de Medi Ambient i Habitatge, Generalitat de Catalunya: Barcelona, Spain, 2009; p. 403. [Google Scholar]
- Liquete, C.; Canals, M.; Ludwig, W.; Arnau, P. Sediment discharge of the rivers of Catalonia, NE Spain, and the influence of human impacts. J. Hydrol. 2009, 366, 76–88. [Google Scholar] [CrossRef]
- ACA. Caracterització de Masses D’aigua i Anàlisi del Risc D’incompliment dels Objectius de la Directiva Marc de L’AIGUA (2000/60/CE) a Catalunya; Conques intra I intercomunitàries; Departament de Medi Ambient i Habitatge, Generalitat de Catalunya: Barcelona, Spain, 2005; p. 860. [Google Scholar]
- ICC. Mapa D’àrees Hidrogeològiques de Catalunya, 1:250,000; Institut Cartogràfic de Catalunya, Generalitat de Catalunya: Barcelona, Spain, 1992. [Google Scholar]
- USACE. HEC-HMS 3.4. Hydrologic Modeling System, Hydrologic Engineering Center; U.S. Army Corps of Engineers: Davis, CA, USA, 2009.
- Espinha Marques, J.; Samper, J.; Pisani, B.; Alvares, D.; Carvalho, J.M.; Chaminé, H.I.; Marques, J.M.; Vieira, G.T.; Mora, C.; Sodré Borges, F. Evaluation of water resources in a high-mountain basin in Serra da Estrela, Central Portugal, using a semi-distributed hydrological model. Environ. Earth Sci. 2011, 62, 1219–1234. [Google Scholar] [CrossRef]
- Nzewi, E.U. The McGraw—Hill Civil Engineering PE Exam Depth Guide; McGraw-Hill: New York, NY, USA, 2001. [Google Scholar]
- Chu, X.; Steinman, A. Event and Continuous Hydrologic Modeling with HEC-HMS. J. Irrig. Drain. Eng. 2009, 135, 119–124. [Google Scholar] [CrossRef]
- Candela, L.; Tamoh, K.; Olivares, G.; Gomez, M. Modelling impacts of climate change on water resources in ungauged and data-scarce watersheds. Application to the Siurana catchment (NE Spain). Sci. Total Environ. 2012, 440, 253–260. [Google Scholar] [CrossRef] [PubMed]
- Kull, D.W.; Feldman, A.D. Evolution of Clark’s unit graph method to spatially distributed runoff. J. Hydrol. Eng. 1998, 3, 9–19. [Google Scholar] [CrossRef]
- Legates, D.R.; McCabe, G.J. Evaluating the use of “goodness-of-fit” Measures in hydrologic and hydroclimatic model validation. Water Resour. Res. 1999, 35, 233–241. [Google Scholar] [CrossRef]
- Stigter, T.Y.; Nunes, J.P.; Pisani, B.; Fakir, Y.; Hugman, R.; Li, Y.; Tomé, S.; Ribeiro, L.; Samper, J.; Oliveira, R.; et al. Comparative assessment of climate change and its impacts on three coastal aquifers in the Mediterranean. Reg. Environ. Chang. 2014, 14, 41–56. [Google Scholar] [CrossRef]
- Soil Conservation Service. Engineering Field Manual Conservation Practices; U.S. Department of Agriculture: Washington, DC, USA, 1984.
- FAO. Crop Evapotranspiration: Guidelines for Computing Crop Water Requirements; Irrigation and Drainage Paper 56; Food and Agriculture Organization (FAO): Rome, Italy, 1998. [Google Scholar]
- IPCC. Climate Change 2007: Synthesis Report. Contribution of Working Groups I, II and III to the Fourth Assessment Report of the Intergovernmental Panel on Climate Change; Core Writing Team, Pachauri, R.K., Reisinger, A., Eds.; IPCC: Geneva, Switzerland, 2007; p. 104. [Google Scholar]
- Chen, J.; Brissette, F.P.; Leconte, R. Uncertainty of downscaling method in quantifying the impact of climate change on hydrology. J. Hydrol. 2011, 401, 190–202. [Google Scholar] [CrossRef]
- Wilby, R.L.; Wigley, T.M.L. Downscaling general circulation model output: A review of methods and limitations. Prog. Phys. Geogr. 1997, 214, 530–548. [Google Scholar] [CrossRef]
- Pattison, A. Synthesis of hourly rainfall data. Water Resour. Res. 1965, 1, 489–498. [Google Scholar] [CrossRef]
- Wilks, D.S. Adapting stochastic weather generation algorithms for climate change studies. Clim. Chang. 1992, 22, 67–84. [Google Scholar] [CrossRef]
- Maidment, D.R. Handbook of Hydrology; McGraw-Hill, Inc.: New York, NY, USA, 1993; p. 1424. [Google Scholar]
- Majidi, A.; Shahedi, K. Simulation of Rainfall-Runoff Process Using Green-Ampt Method and HEC-HMS Model (Case Study: Abnama Watershed, Iran). Int. J. Hydraul. Eng. 2012, 1, 5–9. [Google Scholar] [CrossRef]
- Touhami, I.; Andreu, J.M.; Chirino, E.; Sánchez, J.R.; Pulido-Bosch, A.; Martínez-Santos, P.; Moutahir, H.; Bellot, J. Comparative performance of soil water balance models in computing semiarid aquifer recharge. Hydrol. Sci. J. 2014, 59, 1–11. [Google Scholar] [CrossRef]
- Swart, R.; Bernstein, L.; Ha-duong, M.; Petersen, A. Agreeing to disagree: Uncertainty management in assessing climate change impacts and responses by the IPPC. Clim. Chang. 2009, 92, 1–29. [Google Scholar] [CrossRef] [Green Version]
- Pascual, D.; Pla, E.; Lopez-Bustins, J.A.; Retana, J.; Terradas, J. Impacts of climate change on water resources in the Mediterranean Basin: A case study in Catalonia, Spain. Hydrol. Sci. J. 2014. [Google Scholar] [CrossRef]
- Koutsoyiannis, D. Hydrology and change. Hydrol. Sci. J. 2013, 58, 1177–1197. [Google Scholar] [CrossRef]
© 2016 by the authors; licensee MDPI, Basel, Switzerland. This article is an open access article distributed under the terms and conditions of the Creative Commons Attribution (CC-BY) license (http://creativecommons.org/licenses/by/4.0/).


