1. Introduction
The problem of determining the pipe diameters in a water distribution network (WDN) to ensure minimum pressure levels at nodes is complex. Due to the complexity of the problem, the design, expansion, or rehabilitation of WDNs has traditionally been based on engineering experience. However, during the last three decades, many researchers have focused their efforts on the development of different optimization methodologies for the design of water networks, with the cost of the network as an objective function to be optimized. Initially, researchers used linear programming to optimize a pipe design. This method involves an approach that reduces the complexity of the original nonlinear problem by solving a sequence of approximate linear sub problems. The original approach network [
1] has been adapted and improved by many other researchers [
2].
The optimization of a WDN is actually a nonlinear problem. Therefore, later studies applied nonlinear programming to the network design problems. Some examples are the optimization of looped pipe networks [
3,
4] and the development of models able to simulate pumps, tanks, and multiple loading cases [
5,
6]. The main limitation of nonlinear programming is the use of continuous diameters as decision variables because converting the continuous solution to commercial pipe sizes may reduce the quality of the solution.
When the diameters of the pipes are chosen as decision variables, the restrictions are implicit functions of these variables. In this case, the search space is non-convex and the objective function becomes multimodal. Developments in the field of metaheuristic techniques have proven to be useful in the optimization of WDN.
These techniques are based on using mechanisms to select the best combinations of the decision variables and to generate new solutions by recombination. The application of this type of method allows the search to extend beyond the local minimums of the function, thereby increasing the search field and obtaining better solutions.
The versatility of metaheuristic algorithms allows their use for various problems related to WDNs. In this sense, some researchers have successfully applied these techniques for watershed management [
7,
8], optimal reservoir operations [
9], leak detection [
10,
11], reliability maximization [
12], solving complex supply systems [
4,
13], controlling hydraulic pressure in a water distribution network [
14,
15], drainage networks sizing [
16,
17],
etc.Additionally, different metaheuristic techniques and many optimization models are applied to WDN in the literature. Some examples are Genetic Algorithms [
18,
19,
20], Harmony Search [
21,
22], Shuffled Complex Evolution [
23], Shuffled Frog Leaping Algorithm [
24], Particle Swarm Optimization [
25],
etc. In recent years, the development of methodologies to compare the performance of different algorithms has been of interest to the scientific community [
26,
27].
The drawback of these types of methods is the large number of simulations required to find an optimal solution. In addition, these techniques have certain parameters whose setting determines the proper performance of the algorithm.
In this case, a Shuffled Frog Leaping Algorithm (SFLA) is applied to the design of several benchmarking networks widely known in the literature: the Hanoi, New York Tunnel, and GoYang networks. The aim of this optimization problem is to minimize the investment costs for a topological distribution of the network and some requirements (demands and minimum pressures) at the nodes.
This paper presents a modification of the classical SFLA that has previously been used for mathematical problems but not applied to WDN design. Two weaknesses are usually attributed to SFLA. On one hand, it has a large number of parameters that need to be adjusted to obtain a good result. On the other hand, the classical definition of SFLA tends to be trapped in local optima function.
To prevent unwanted local minima, this paper includes a search acceleration factor, creating a modified form of the algorithm. Additionally, this paper provides a sensitivity analysis of the calibration parameters, showing that not all of them are equally important to maximize the success rate. For that, a methodology to calibrate parameters in meta-heuristic algorithms is proposed and applied.
The analysis of the results shows how certain parameters are much more sensitive to obtaining better solutions, while others can be removed from the calibration, or can even be discarded in the algorithmic formulation.
Additionally, this work shows that a proper calibration of the SFLA improves performance by increasing the probability of finding the best possible solution. In this regard, this paper performs an extensive analysis of the influence of various parameters on the probability of finding an optimal solution, thereby providing a proper calibration of the SFLA parameters for medium-sized networks. At least 35,000 different simulations were performed for each network.
2. SFL Algorithm
A metaheuristic algorithm is designed to search a global optimal solution of the problem using a heuristic function. The need to use metaheuristic techniques is justified when it comes to solving problems of type NP-Hard, and it is known that the design problem for WDNs is an NP-hard combinatorial problem. There has been some controversy about the exact place of SFLA within metaheuristics because some authors consider SFLA as an evolutionary algorithm [
26]. The generic term “evolutionary computation” refers to a broad set of metaheuristic techniques to solve complex problems that base their performance on a similar mechanism to the processes of natural evolution. These methodologies are based in selection mechanisms inspired by aspects of biological evolution such as reproduction, mutation, crossover, natural selection, and survival of the fittest.
In fact, SFLA has most of these features, but the search mechanisms used do not correspond exactly with biological evolution. For this reason, it may be more appropriate to only consider it as a metaheuristic algorithm because this group of techniques includes a more general definition. The operating principles of SFLA are similar to other existing evolutionary techniques, which try to find an optimal solution to a problem from the evolution of an initial randomly generated population.
SFLA performs a heuristic search based on the evolution of particles called memes, carried by a number of interacting individuals (frogs) that perform a global exchange of information among the population. The optimization process followed by SFLA combines elements of other optimization methodologies. The local search used in SFLA is based on the Particle Swarm Optimization (PSO) methodology [
28], while the idea of mixing information from parallel local searches comes from Shuffled Complex Evolution [
23].
SFLA tries to imitate the search for food by a group of frogs that exchange information among themselves. Each frog (individual) has a certain position within the search space, defined by
Xi. This vector represents a meme with as many memotypes as decision variables (
NVD) in the design problem. Each memotype identifies the discrete value of each decision variable.
The global exchange of information between the memes has a probabilistic component. However, this does not mean that the optimization process is random. Different parameters guide the search process of the algorithm, so the obtained results are sensitive to the values of these parameters.
The main parameters of the original SFLA [
24] are the number of memeplexes (
m), the number of frogs per memeplex (
n), the fraction of frogs in the memeplex that will evolve (
q), and the number of memetic evolutions or evolutionary steps (
Ns) within a memeplex before shuffling.
The original SFLA has been tested on several problems, including WDN design problems. However, the original SFLA often suffers from being trapped in local optima. To avoid this problem, this work introduces the search-acceleration factor (
C) proposed by Elbeltagi [
29] and creates a modified form of the algorithm. This new parameter helps to prevent premature convergence and to balance global and local searches. In this sense, assigning large values to
C at the beginning of the evolution process accelerates the global search because larger changes in the frogs’ position will be allowed.
For further understanding of the internal working of SFLA, consider the simple numerical example expressed as:
where
. This is a minimization problem with an exact solution, so we could express the global minimum as the solution vector (2,3,1). However, SFLA has its own way to find this vector solution.
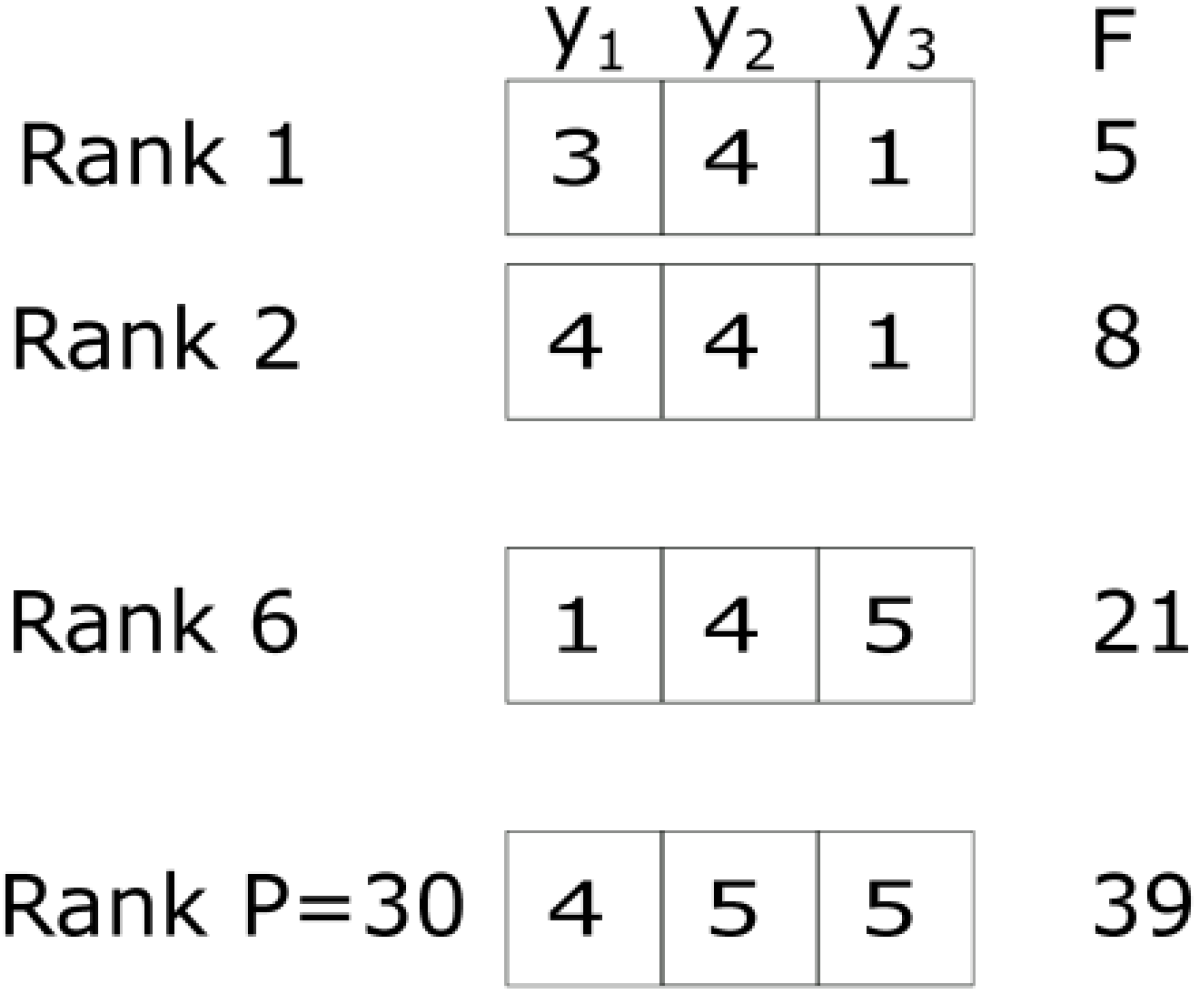
Figure 1 shows the initial population randomly generated by SFLA. In this example, assume that the initial population is
P = 30. Each of these vectors (frogs) contains a possible solution to the problem, and these are sorted according to the value of objective function.
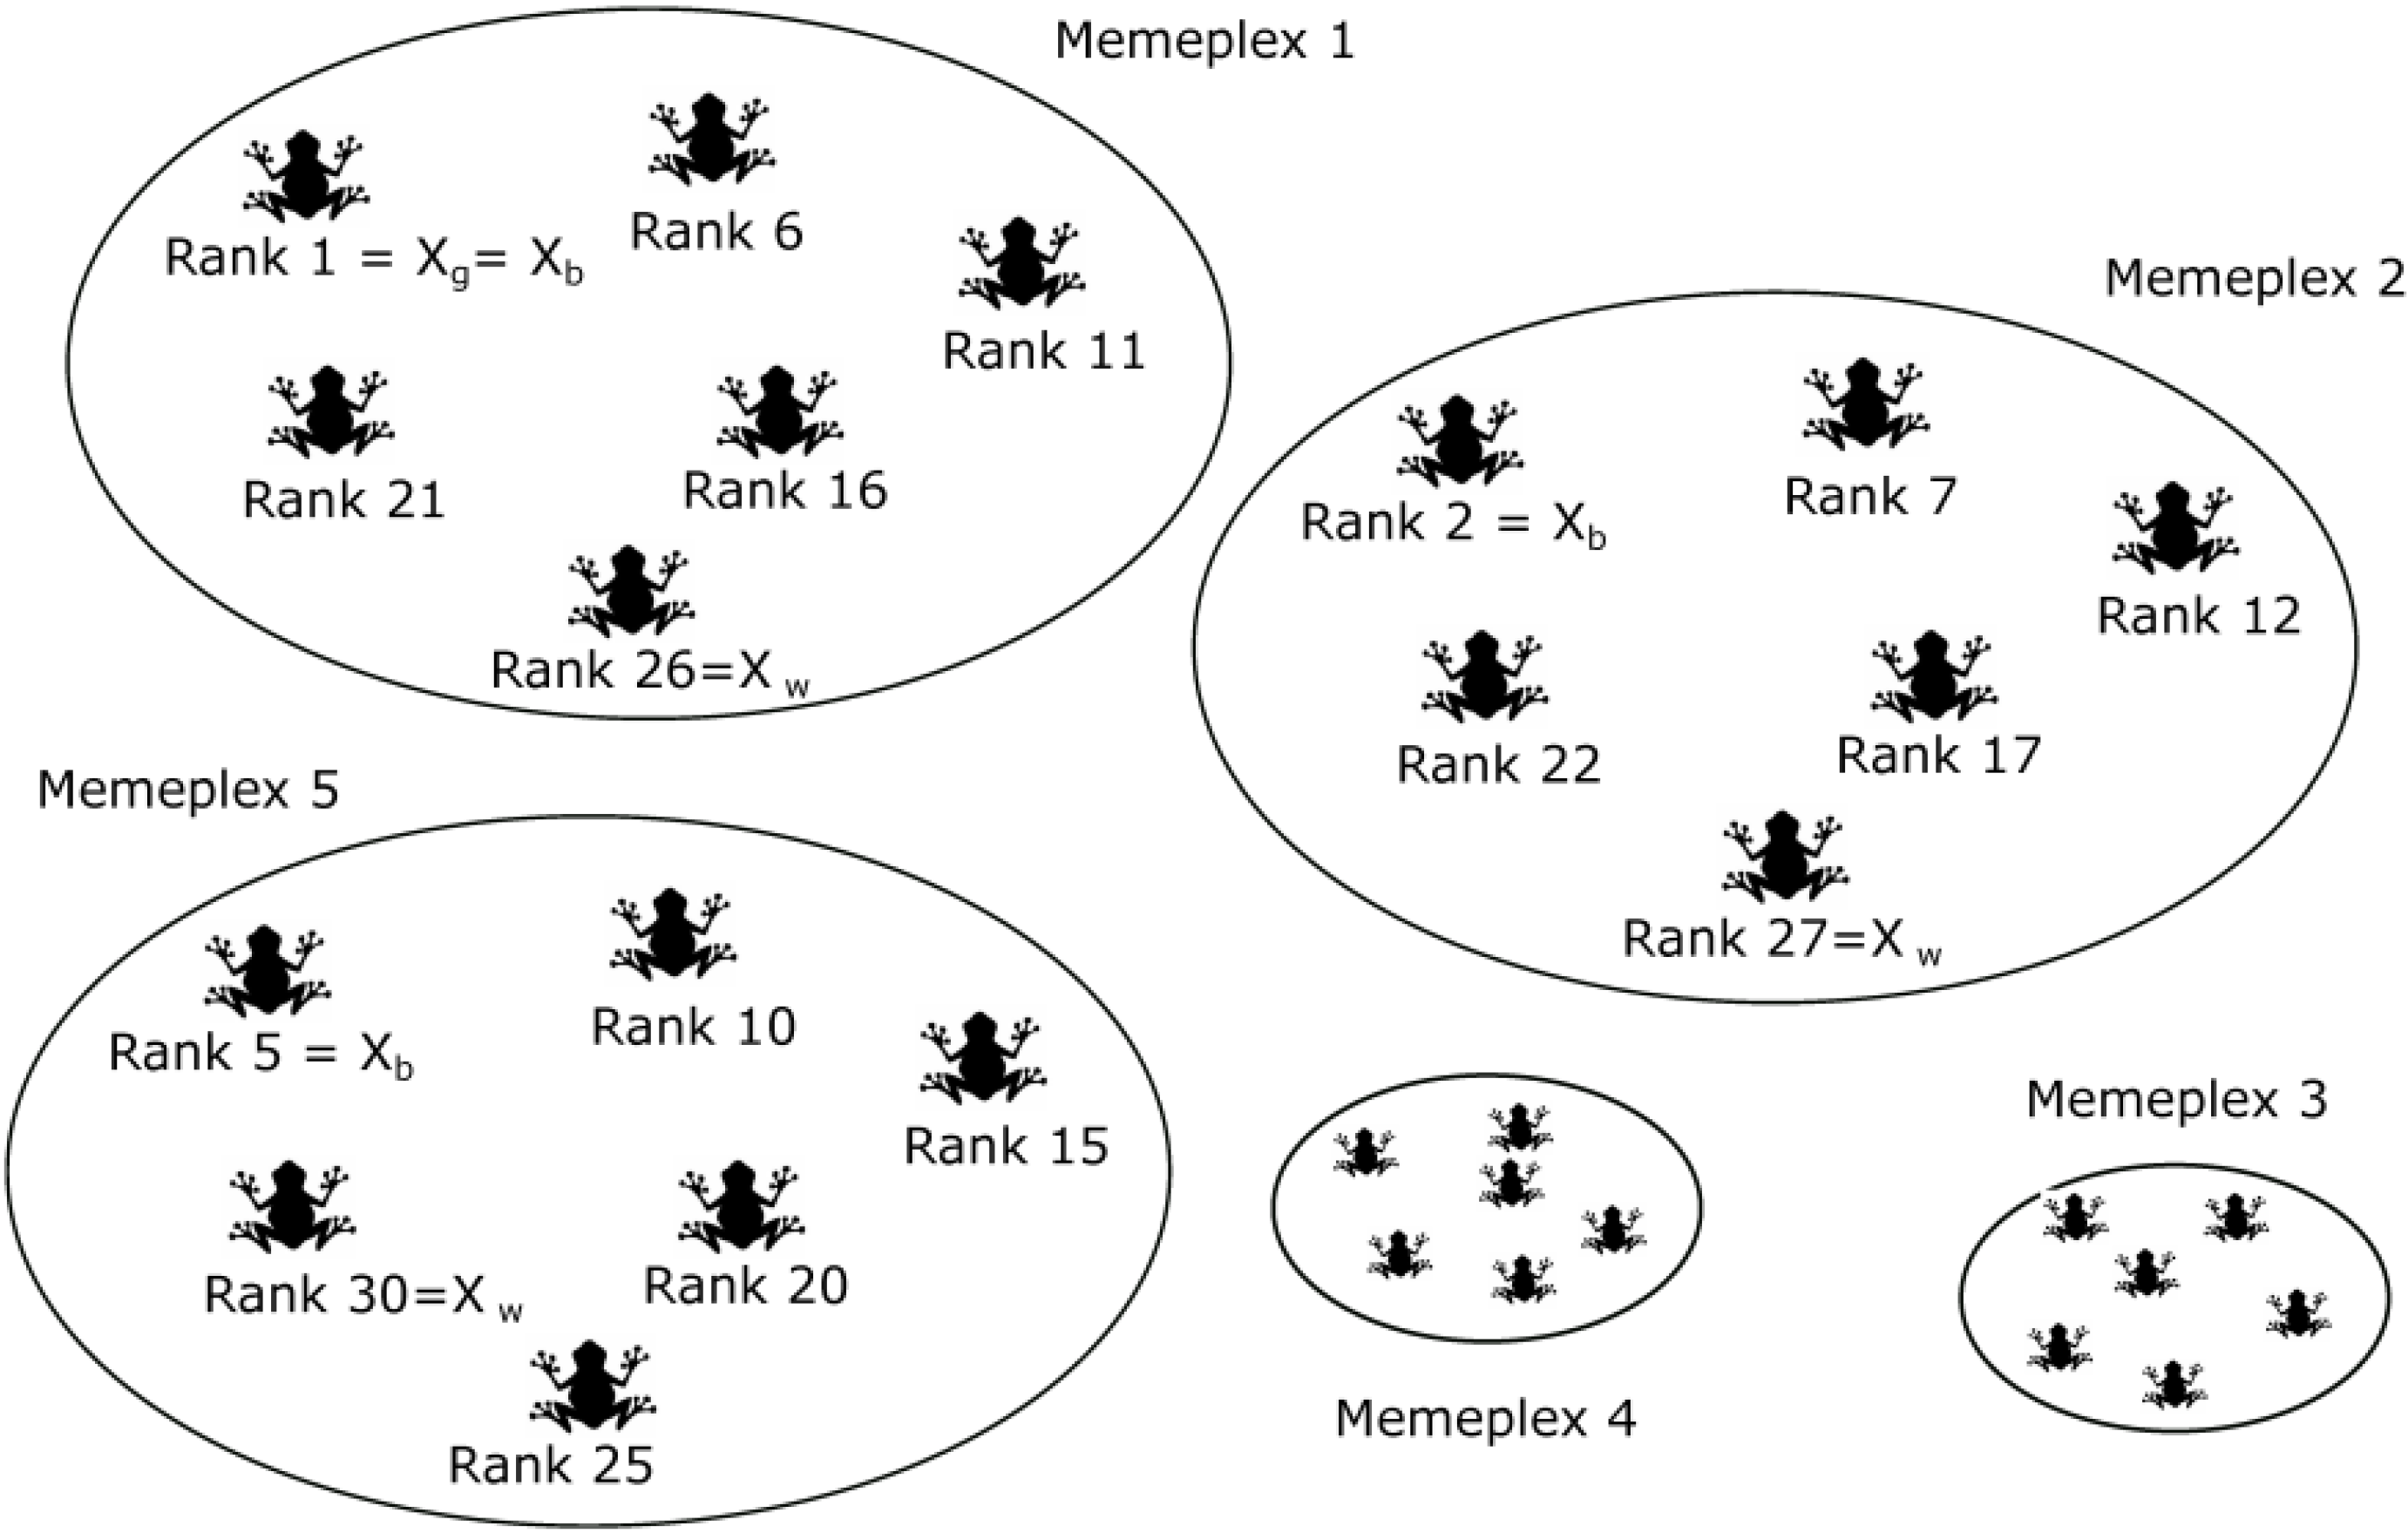
Next, P is divided into m subsets called memeplexes. Each memeplex contains n frogs and can be considered as a different culture in which a local search is performed. For the given example, consider m = 5 and n = 6.
Afterwards, frogs are sent to different memeplexes according to their cost function. The global best fitness solution is defined as
Xg, and the best and worst solutions for each memeplex are identified as
Xb and
Xw, respectively, as shown in
Figure 2.
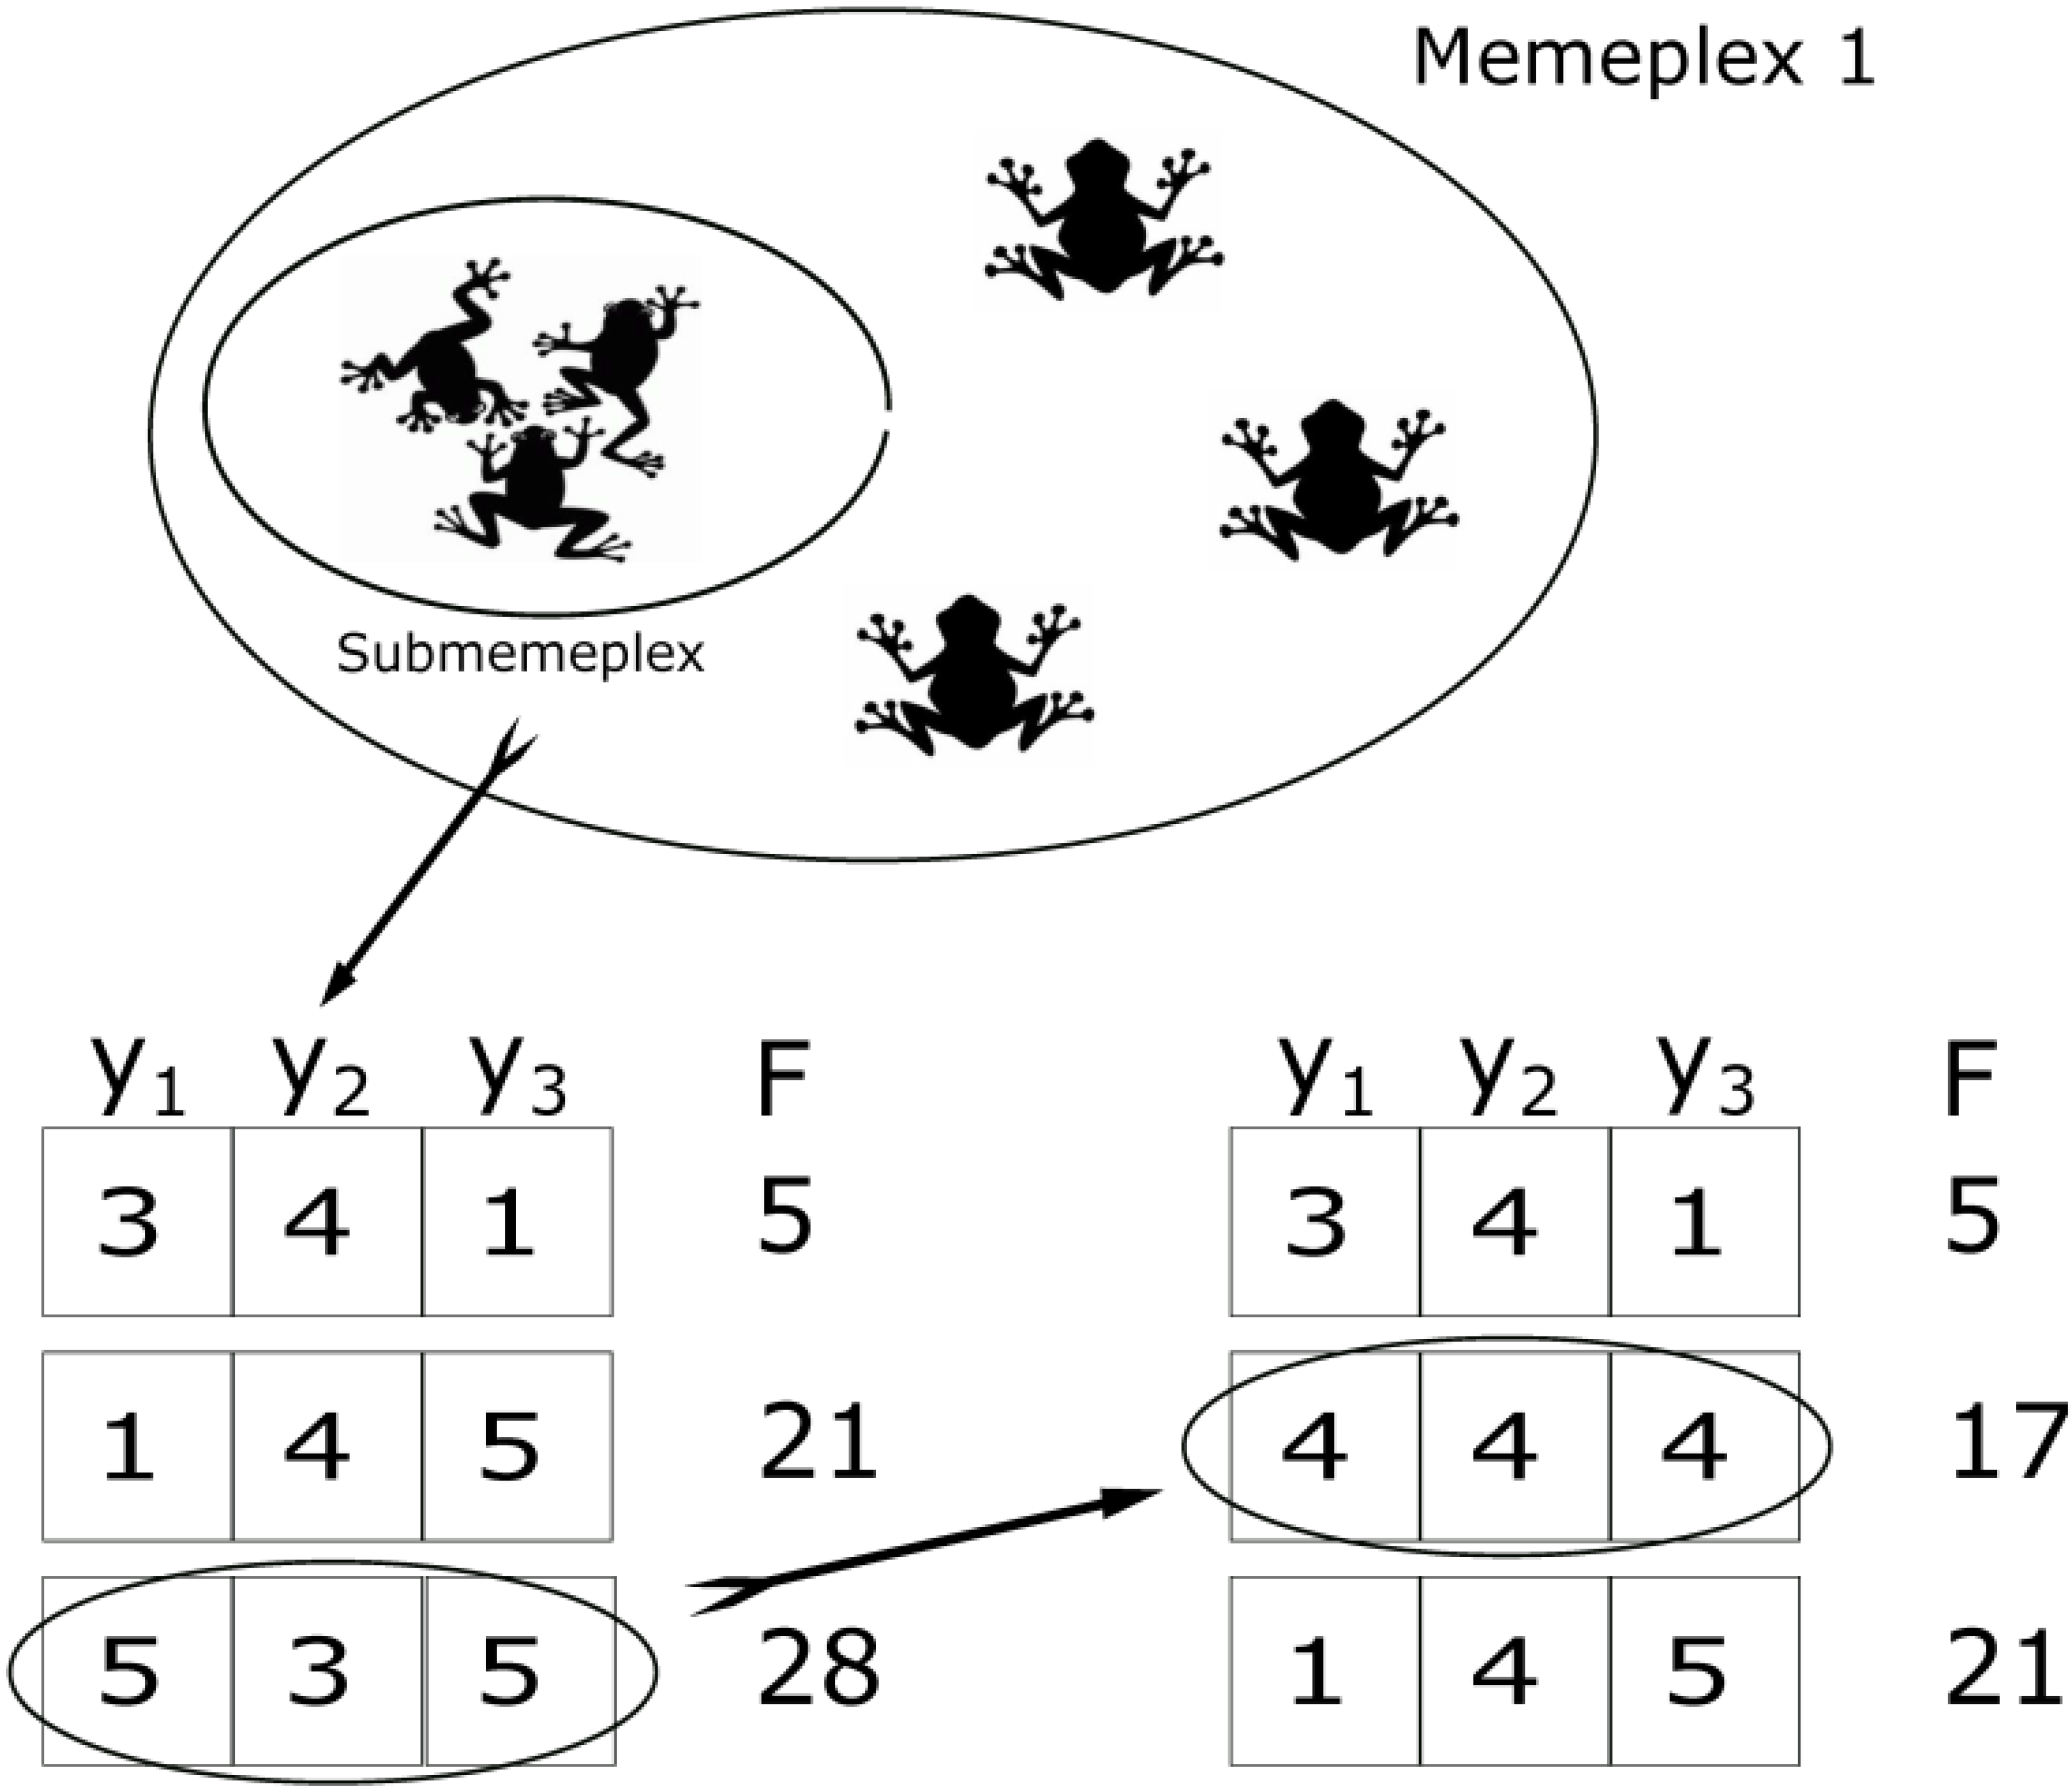
The next step is to build a submemeplex in every memeplex, which represents the amount of frogs entering memetic evolution. At this stage memetic evolution begins, and, for our example, specific SFLA parameters take values of
Q = 0.5,
Ns = 5, and
C = 1. The modified SFLA used in this work has a slightly different definition of
q than the original SFLA. Eusuff and Lansey [
24] define
q as the number of frogs per submemeplex and consider only integer values, while this work takes
q as the fraction of memes in a memeplex that are included in the submemeplex. Small sizes of submemeplexes cause smaller jumps between frogs of similar ability. This definition for the size of every submemeplex limits the range of variation of the parameter
q to allow a more precise sensitivity analysis. For the numerical example considered,
q = 0.5 means that only half of frogs (three in this case) evolve in each evolutionary step
Ns.
Within each submemeplex, frogs exchange information, so that the best reports to the worst, which evolves in a process known as an evolutionary leap. In this process, only the frog with the worst cost function in each cycle is updated as follows:
where
Di is the change in frog position; δ is a random number between 0 and 1;
C is a search acceleration factor;
Xb is the best frog’s position;
Xw is the worst frog’s position;
Xw is the new position of the frog;
XW,0 is the current position of the frog; and
Dmax is the maximum allowed change in a frog’s position. If the evolution produces a better frog, it replaces the worst frog. Otherwise,
Xb is replaced by
Xg in formula (3) and the process is repeated. If the fitness of the new frog is not better than the fitness of
Xw, then a new individual is randomly produced to replace the worst frog. The above operation is executed for a specific number of iterations called evolutionary steps (
Ns) within each memeplex.
C is the main difference between the modified SFLA and original Eusuff SFLA. This parameter can be greater than 1, allowing great leaps in the values of the frog solutions. These leaps not only accelerate the convergence but also prevent unwanted local minima.
Considering the numerical example,
Figure 3 shows how the frogs contained in a submemeplex have evolved according to the above rules; {1,4,5} changes to {4,4,4} and because the function value of the new frog is 17, the new frog replaces the worst frog {5,3,5} in the submemeplex. This process is repeated
Ns = 5 times in each submemeplex.
Then, the local search in each memeplex m is finished. After that, the sub-memeplexes are returned to memeplexes, the memeplexes are dissolved, and the process known as shuffling begins, where individuals (frogs) are mixed again based on their function cost and re-sorted into new memeplexes. With this, a generation is completed. At the end, SFLA is capable of evolving a random initial population to the function value of 3, the global minimum.
The leaping and shuffling processes are repeated until the condition of convergence is satisfied, ending the optimization problem. In this work, the optimal solution of the search algorithm corresponds to the combination of diameters providing the lowest cost design for a specific WDN.
As shown in the results, the value for each of these parameters has a key influence on the performance of the algorithm.
3. Methodology
Optimization techniques based on metaheuristic methods do not guarantee an absolute minimum; this is why many researchers [
26,
30] compare these algorithms to a widely known series of benchmark WDN design problems. These problems can be classified into four groups (small, medium, intermediate, and large) depending on the size of the search space. A detailed description of these benchmark problems, including the number of decision variables, the range of the diameters, and other information about these networks, can be found in [
31].
Similarly, the best solution provided by a metaheuristic algorithm is not repeated in all of the simulations. It is a search process that depends not only on the problem itself but also on the calibration process made for the different parameters of the algorithm. For this reason, the algorithm must be run several times to provide statistical information about its performance. This paper performs a calibration of the different SFLA parameters for medium-sized networks. Regarding the parameter optimization, Eiben [
32,
33] distinguishes between two forms of adjustment: parameter control and parameter tuning. In parameter control, the algorithm starts with initial parameter values which are changing during the run. Despite parameter control having its advantages, finding rules and methods that can ensure the best calibration of a parameter in the algorithm performance is much more complicated. In this regard, some authors have developed approaches to automate the parameter setting process [
34]. Meanwhile, in parameter tuning, the parameters remain fixed during the optimization process, being the commonly practiced approach to choose the best parameter calibration before starting the simulation.
In this sense, McClymont [
35] proposed a methodology for tuning evolutionary algorithm operators, which is partially adopted here. This methodology begins with the selection of the problems. Next, it applies the algorithms over several trial runs and tunes the operators. Finally, the algorithms are tested with tuned parameters and the results are analyzed.
In addition, solving water distribution design problems with this type of methodology requires the adoption of a hydraulic solver. Not all of these solvers use the same hydraulic parameters in the equation for energy conservation, and the results can vary slightly, changing the global optimum solution for the problem. This work uses EPANET2 [
36] because of its extensive use in this field.
As indicated above, three medium-sized benchmarking networks are used to analyze the SFLA behavior: New York Tunnel [
37], Hanoi [
2], and GoYang [
38]). These networks have a wide range of solutions obtained with different design models by several researchers. This allows for the comparison of the results from the different design models and the extension of the conclusions to networks with a search space of this numerical order.
The New York Tunnel problem consists of adding new pipes in parallel to existing ones with minimum costs. In the case of Hanoi, the objective is the correct sizing of the pipes. Finally, the GoYang problem seeks a minimum cost solution for a 30 pipe network fed by a pump. In all three cases, the topological layout of the networks, the demands in the nodes, and a discrete range of diameters to allow exploration of the solution space are known. Moreover, a minimum pressure at the nodes must be guaranteed. The objective function includes the capital costs for new pipes and penalty terms for minimum pressure violations [
20]. Up-to-date best solutions are available from different authors [
20,
21,
39,
40].
Table 1 shows a summary of the most relevant information. Despite having the largest search space, the GoYang network showed a smaller dispersion in its solutions (203 different solutions in 35,000 runs), while the Hanoi network obtained 5553 different solutions in 45,000 runs. This is a key point in the analysis of the solutions because the complexity of the problem is related not only to the size of the solution space but also to the number of local minima. Thus, a metaheuristic process will be more complex with greater numbers of local minima near the optimum solution.
Next, a methodology to calibrate the parameters of the SFLA is proposed. For every network, a two-step calibration protocol was adopted. The SFLA parameters were divided into two groups: population-related parameters (m and n) and SFLA specific parameters (Ns, q, and C).
During the first step, m and n were kept constant and equal to 10 × 10. Then, all of the possible combinations of Ns, q, and C were tested. After this first step, an optimal combination of parameters for Ns, q, and C is obtained and the second step starts.
The initial range of values of
Ns was taken from [
24]. In their work, Eusuff and Lansey took four values of
Ns ranging from 10 to 30. The results showed that for the New York network, an optimum value was obtained for
Ns = 22. However, this work used growing values of
Ns starting from 5. Both the success rate and the computational effort were continuously growing, and so the study for this parameter stopped when the success rate for 200 runs started to decrease. This point was reached at 50, 60, and 70 evolution steps in the GoYang, New York, and Hanoi networks, respectively.
The effect of the number of frogs per submemeplex (
q) was not tested in the literature. Eusuff and Lansey [
24] adopted a value of 22 frogs without further comparison. In this paper, a comparison is made with values of 20%, 40%, 60%, 80%, and 100% of the frogs within the memeplex.
Finally, Elbeltagi [
29] tried 14 different values for the acceleration factor
C ranging from 0.5 to 2.9, including the value 1 (equivalent to the original SFLA formulation). The results showed that values of
C lower than 1.0 led either to no feasible solutions or to solutions corresponding to local minima. In this study, the values tested for
C were 1, 1.5, 2.0, 2.5, and 3.0.
Table 2 shows all of the considered values. Thus, in the first part of the calibration process, a total of 225 combinations of
C,
q, and
Ns are performed. Due to the high variability of the solutions, for each combination, each problem was solved 200 times. Therefore, the algorithm was run at least 35,000 times for each network.
For the second step of the calibration process, the best parameter calibration obtained in the first step is kept constant and the effect of population is studied. Regarding the number of individuals involved in the optimization process, previous studies showed that the population size should be large enough to ensure diversity in the solutions. The main problem caused when using large populations is that the convergence time of the algorithm is much higher. Therefore, in general, larger population sizes obtain more minimal solutions, especially in complex problems. From the study of [
24], both
m and
n were allowed to vary between 10 and 30. A total of 200 simulations were performed for each of the nine possible combinations.
4. Results and Discussion
A statistical analysis of the results based on every parameter was conducted. The following information was obtained: the minimum, average, and maximum value of the objective function and the number of times the minimum was achieved. Moreover, the success rate is the ratio between the number of times this minimum was achieved and the total number of simulations [
24].
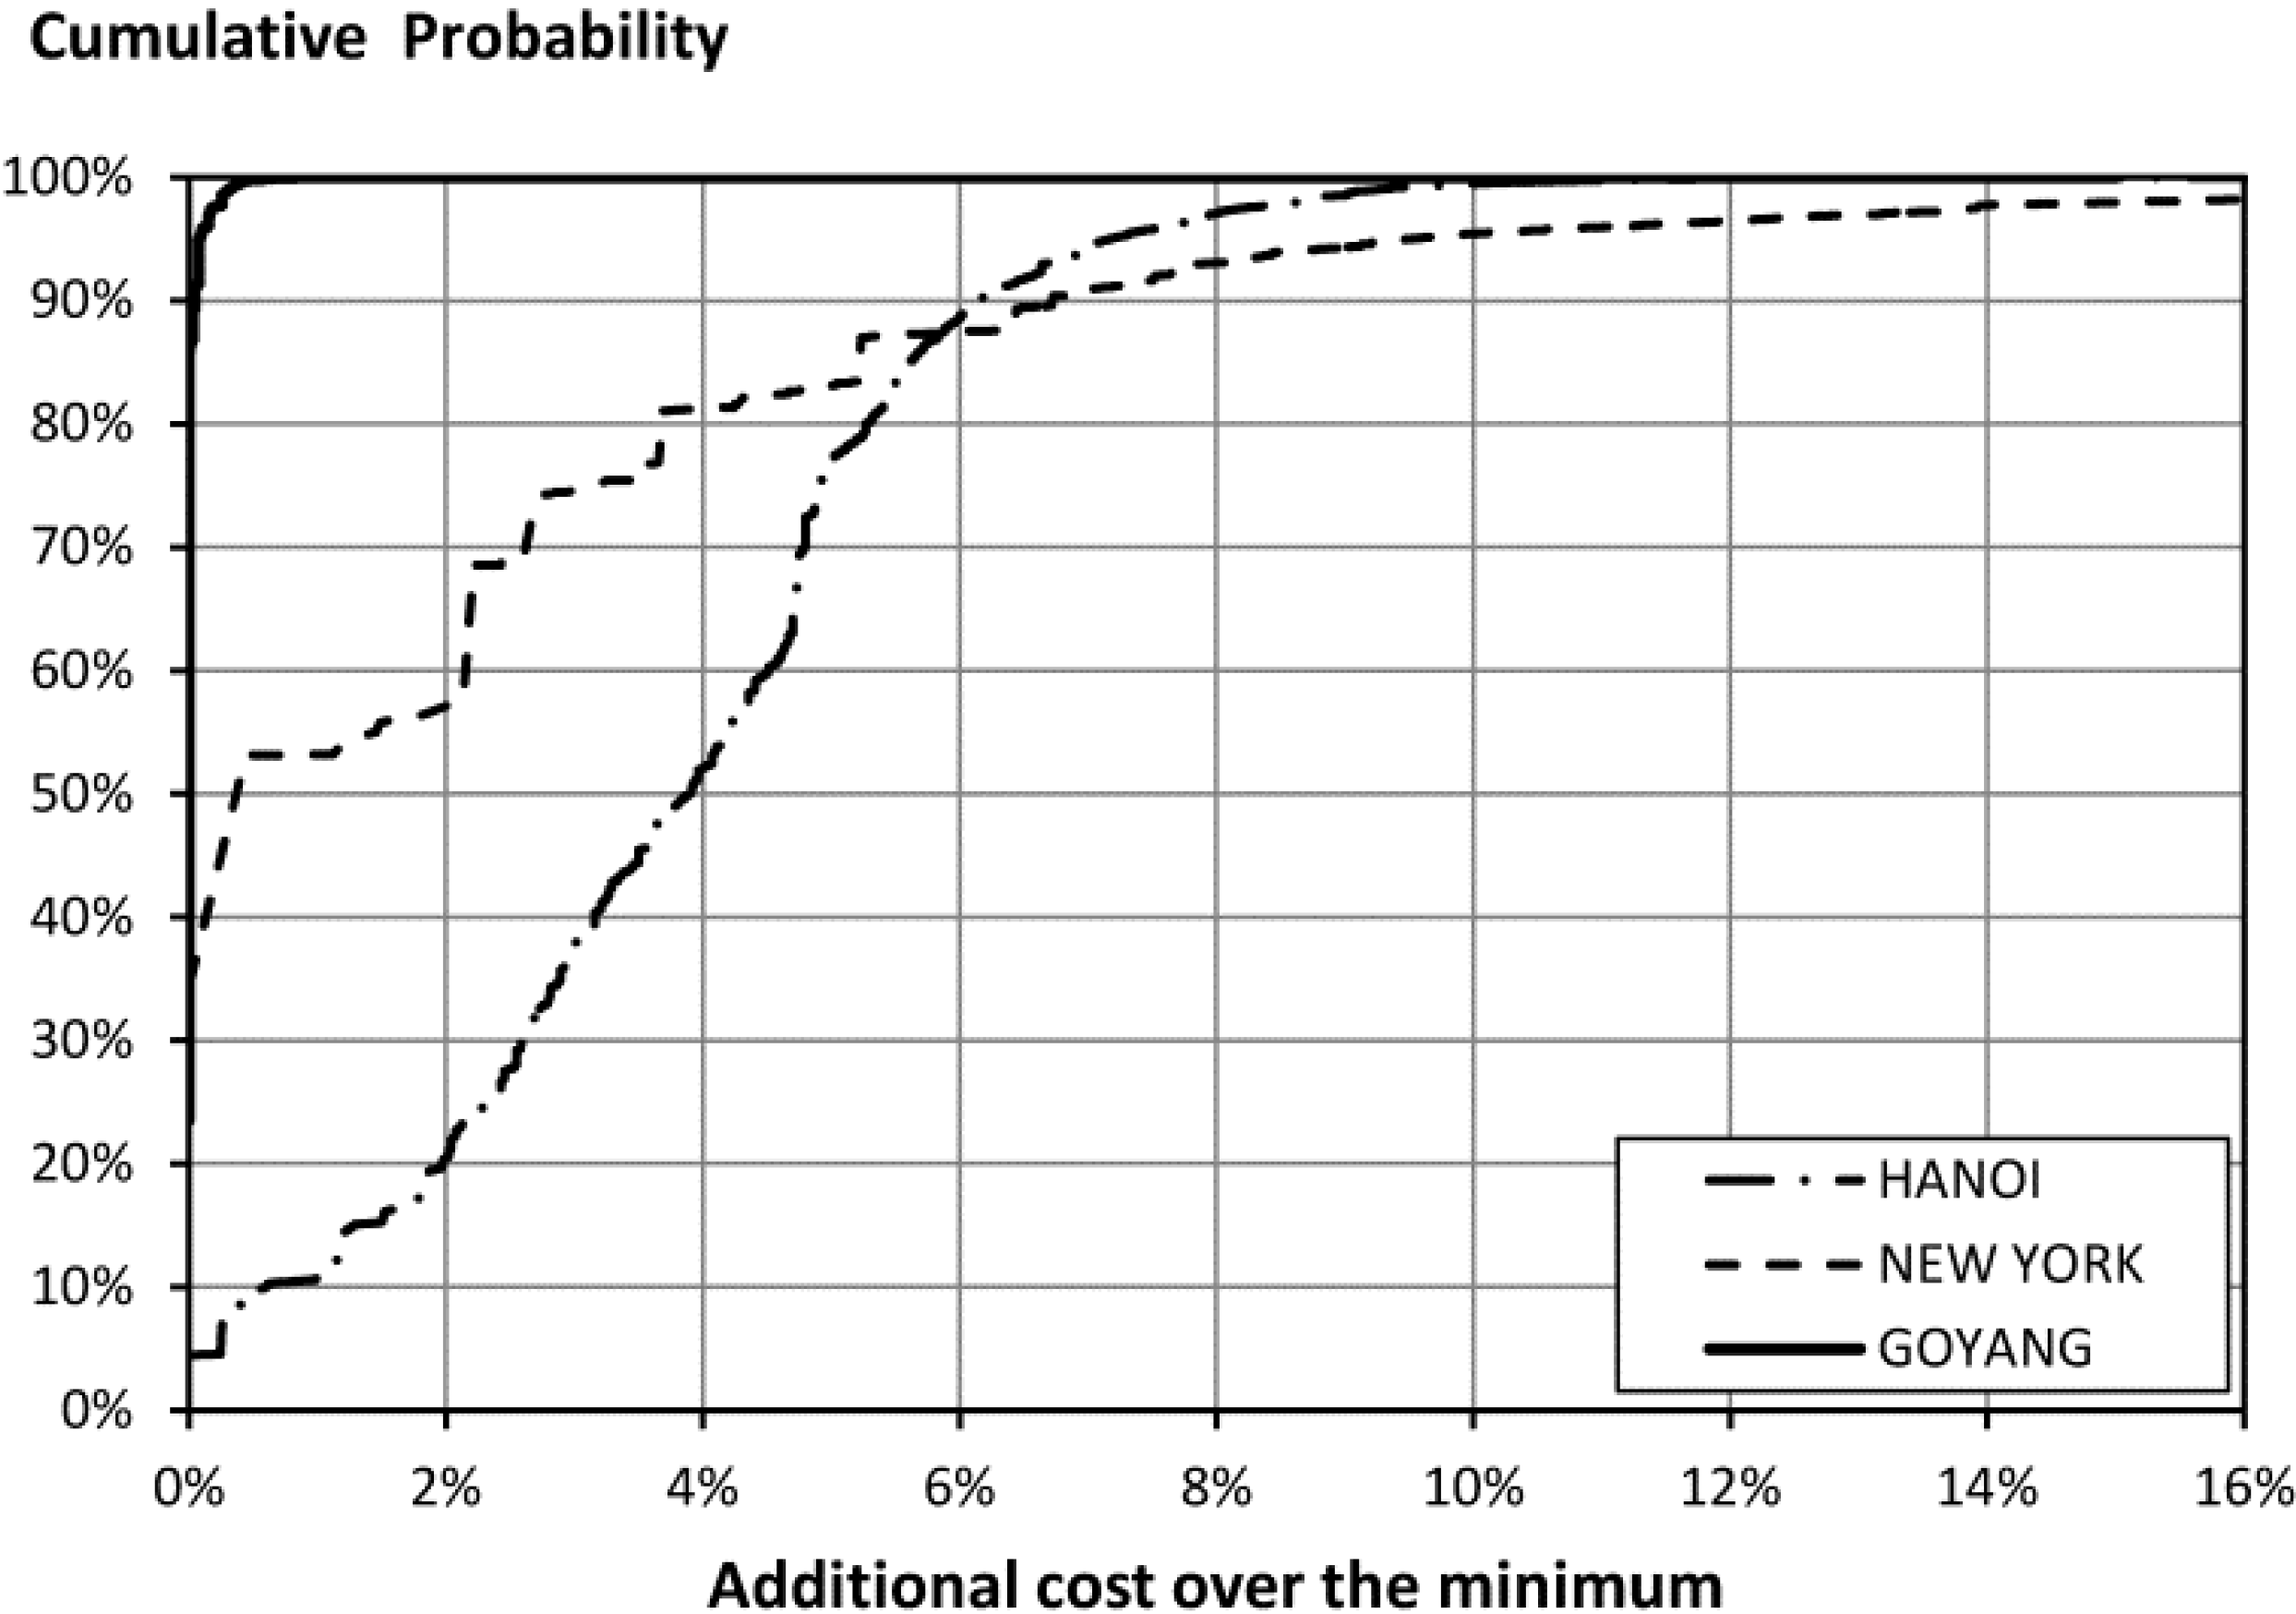
An overview of the results showed that GoYang may be considered a simpler problem because of its higher probability of obtaining a solution close to the best ever found (in 99% of the simulations, the solution was less than 0.3% more expensive than the optimum). Conversely, Hanoi shows a great dispersion of results with more than 5000 different solutions and a probability of 37.5% of obtaining a solution with less than 3% of the minimum. New York presents the highest probability of finding the optimum solution (34.5%) but also presents the highest dispersion of the results. The histogram of the three problems is shown in
Figure 4.
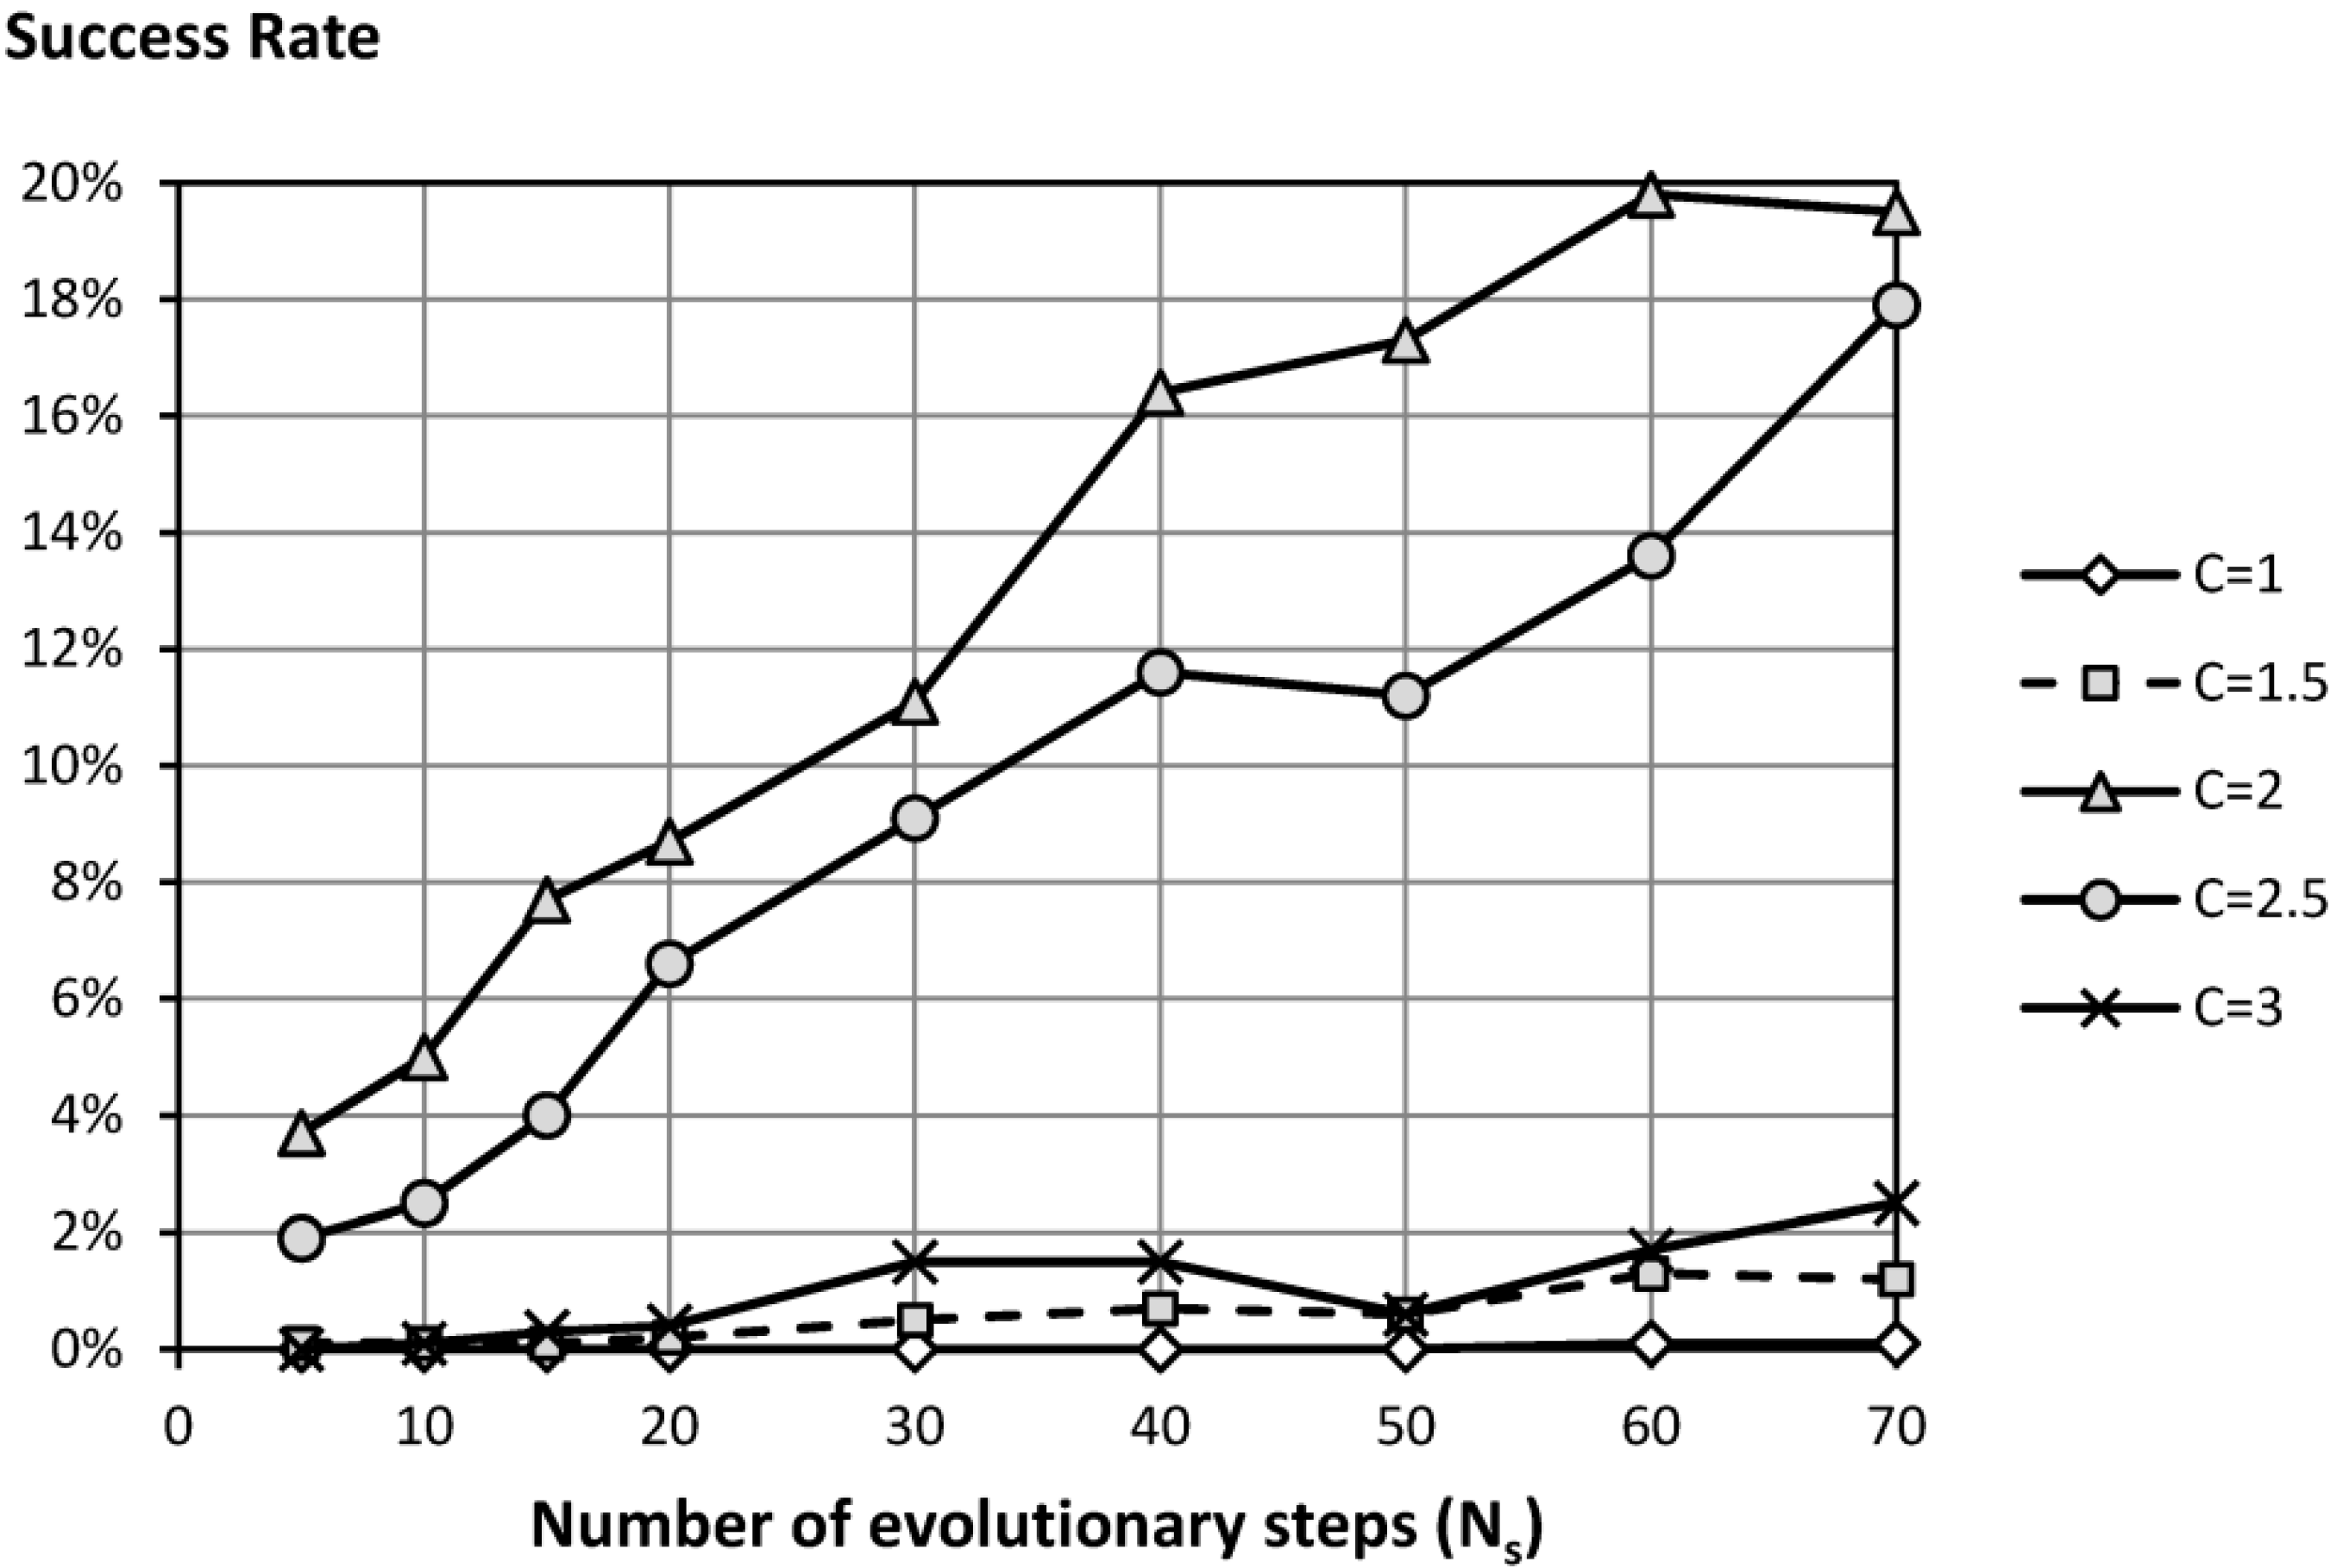
For each network, test runs were classified depending on the calibration parameters. A total of 225 different combinations were studied. Considering the parameters related to the nature of the evolutionary leaps,
Figure 5 shows the success rate in the Hanoi network for different values of the accelerator coefficient (
C) and the number of evolutionary steps (
Ns). In the case of Hanoi, values close to
C = 2 obtained better design solutions, with probabilities of nearly 20%. For the New York Tunnel and GoYang networks, this value of
C is equal to 1.5 in both cases, with probabilities of approximately 50% and 60%, respectively. The results show the importance of the parameter calibration because an incorrect choice may involve the complete absence of minimum design solutions. Thus, for values of
C = 1.0, minimal solutions do not exist in the Hanoi network, while hardly 5% of the simulations for the New York network obtain the minimum with this same value. The value of
C = 1.0 fits with the original formulation of SFLA proposed by Eusuff and Lansey [
24]. As concluded by Elbeltagi [
29], the accelerator parameter allows finding solutions beyond the local minima, avoiding one of the main disadvantages of SFLA.
The influence of
Ns was also studied. By definition, SFLA performs more evaluations of the objective function with a larger
Ns. The key to evaluating this parameter is to study when increasing
Ns does not improve the success rate. For Hanoi, this happened for
Ns = 70, for New York at
Ns = 60, and for GoYang at
Ns = 50. A relationship seems to exist between the complexity of the problem and
Ns. As the problem becomes more complicated, a larger number of evolutionary steps are needed.
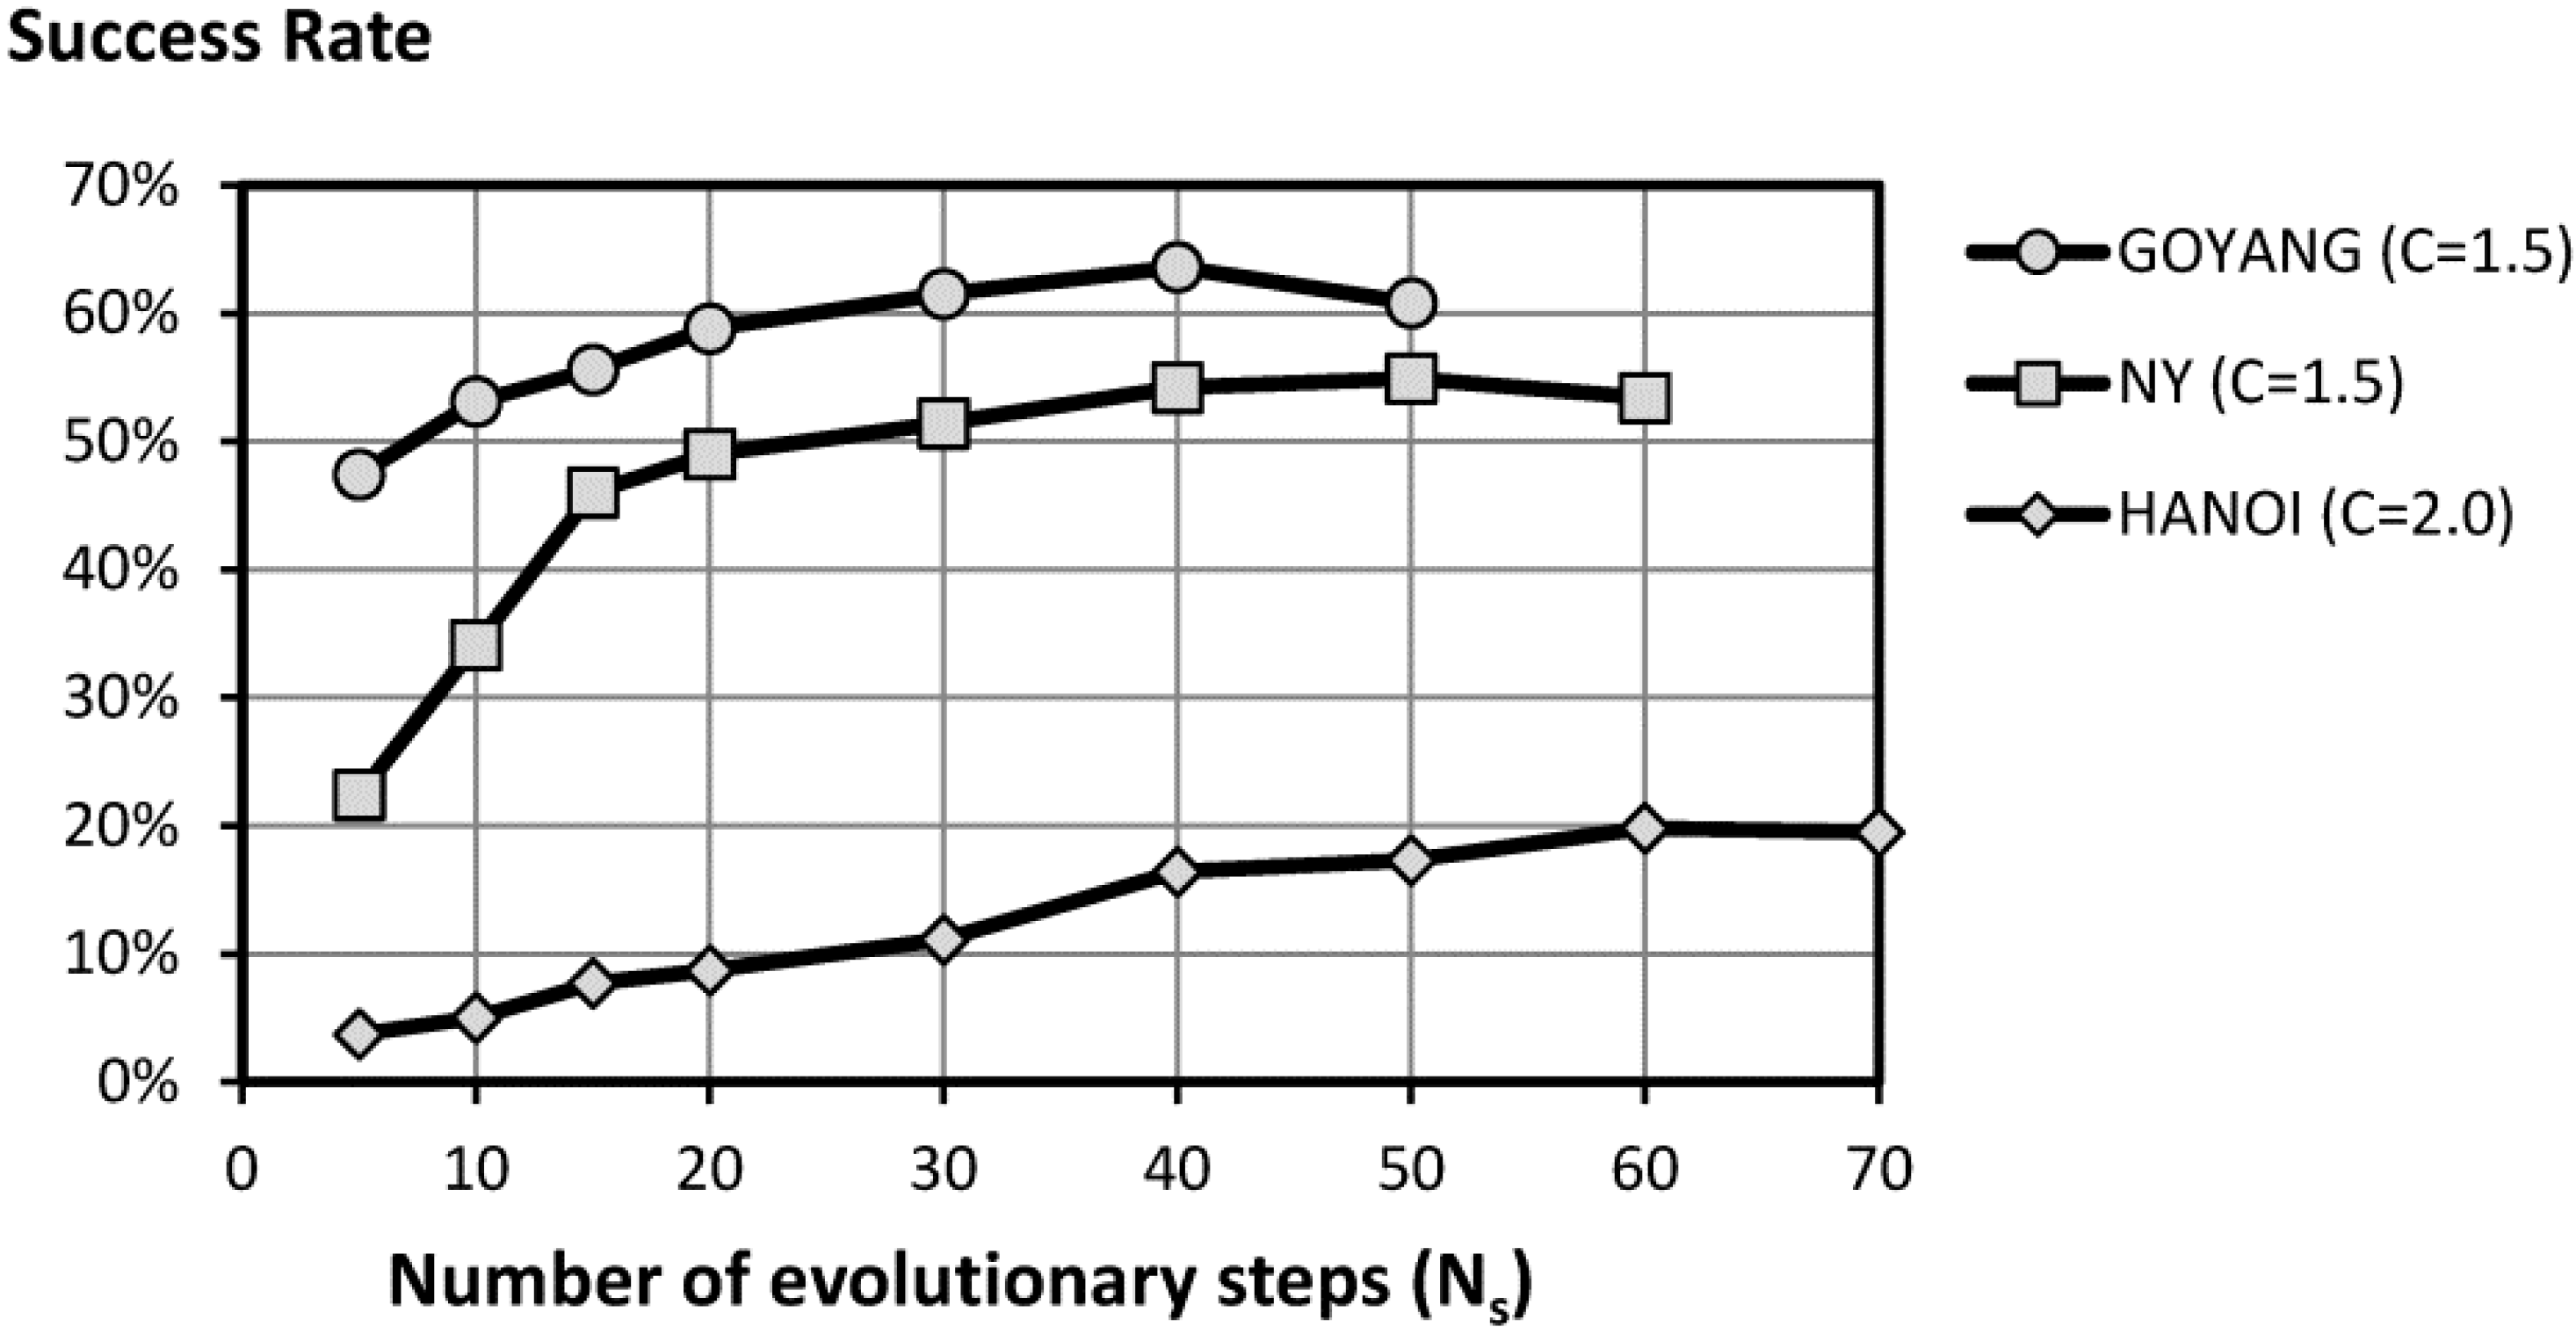
Figure 6 shows the effect of
Ns on the success rate for the three networks. For every network, the best value of
C was adopted. The success rate increases with higher values of
Ns. However, the probability tends to stabilize past a certain value.
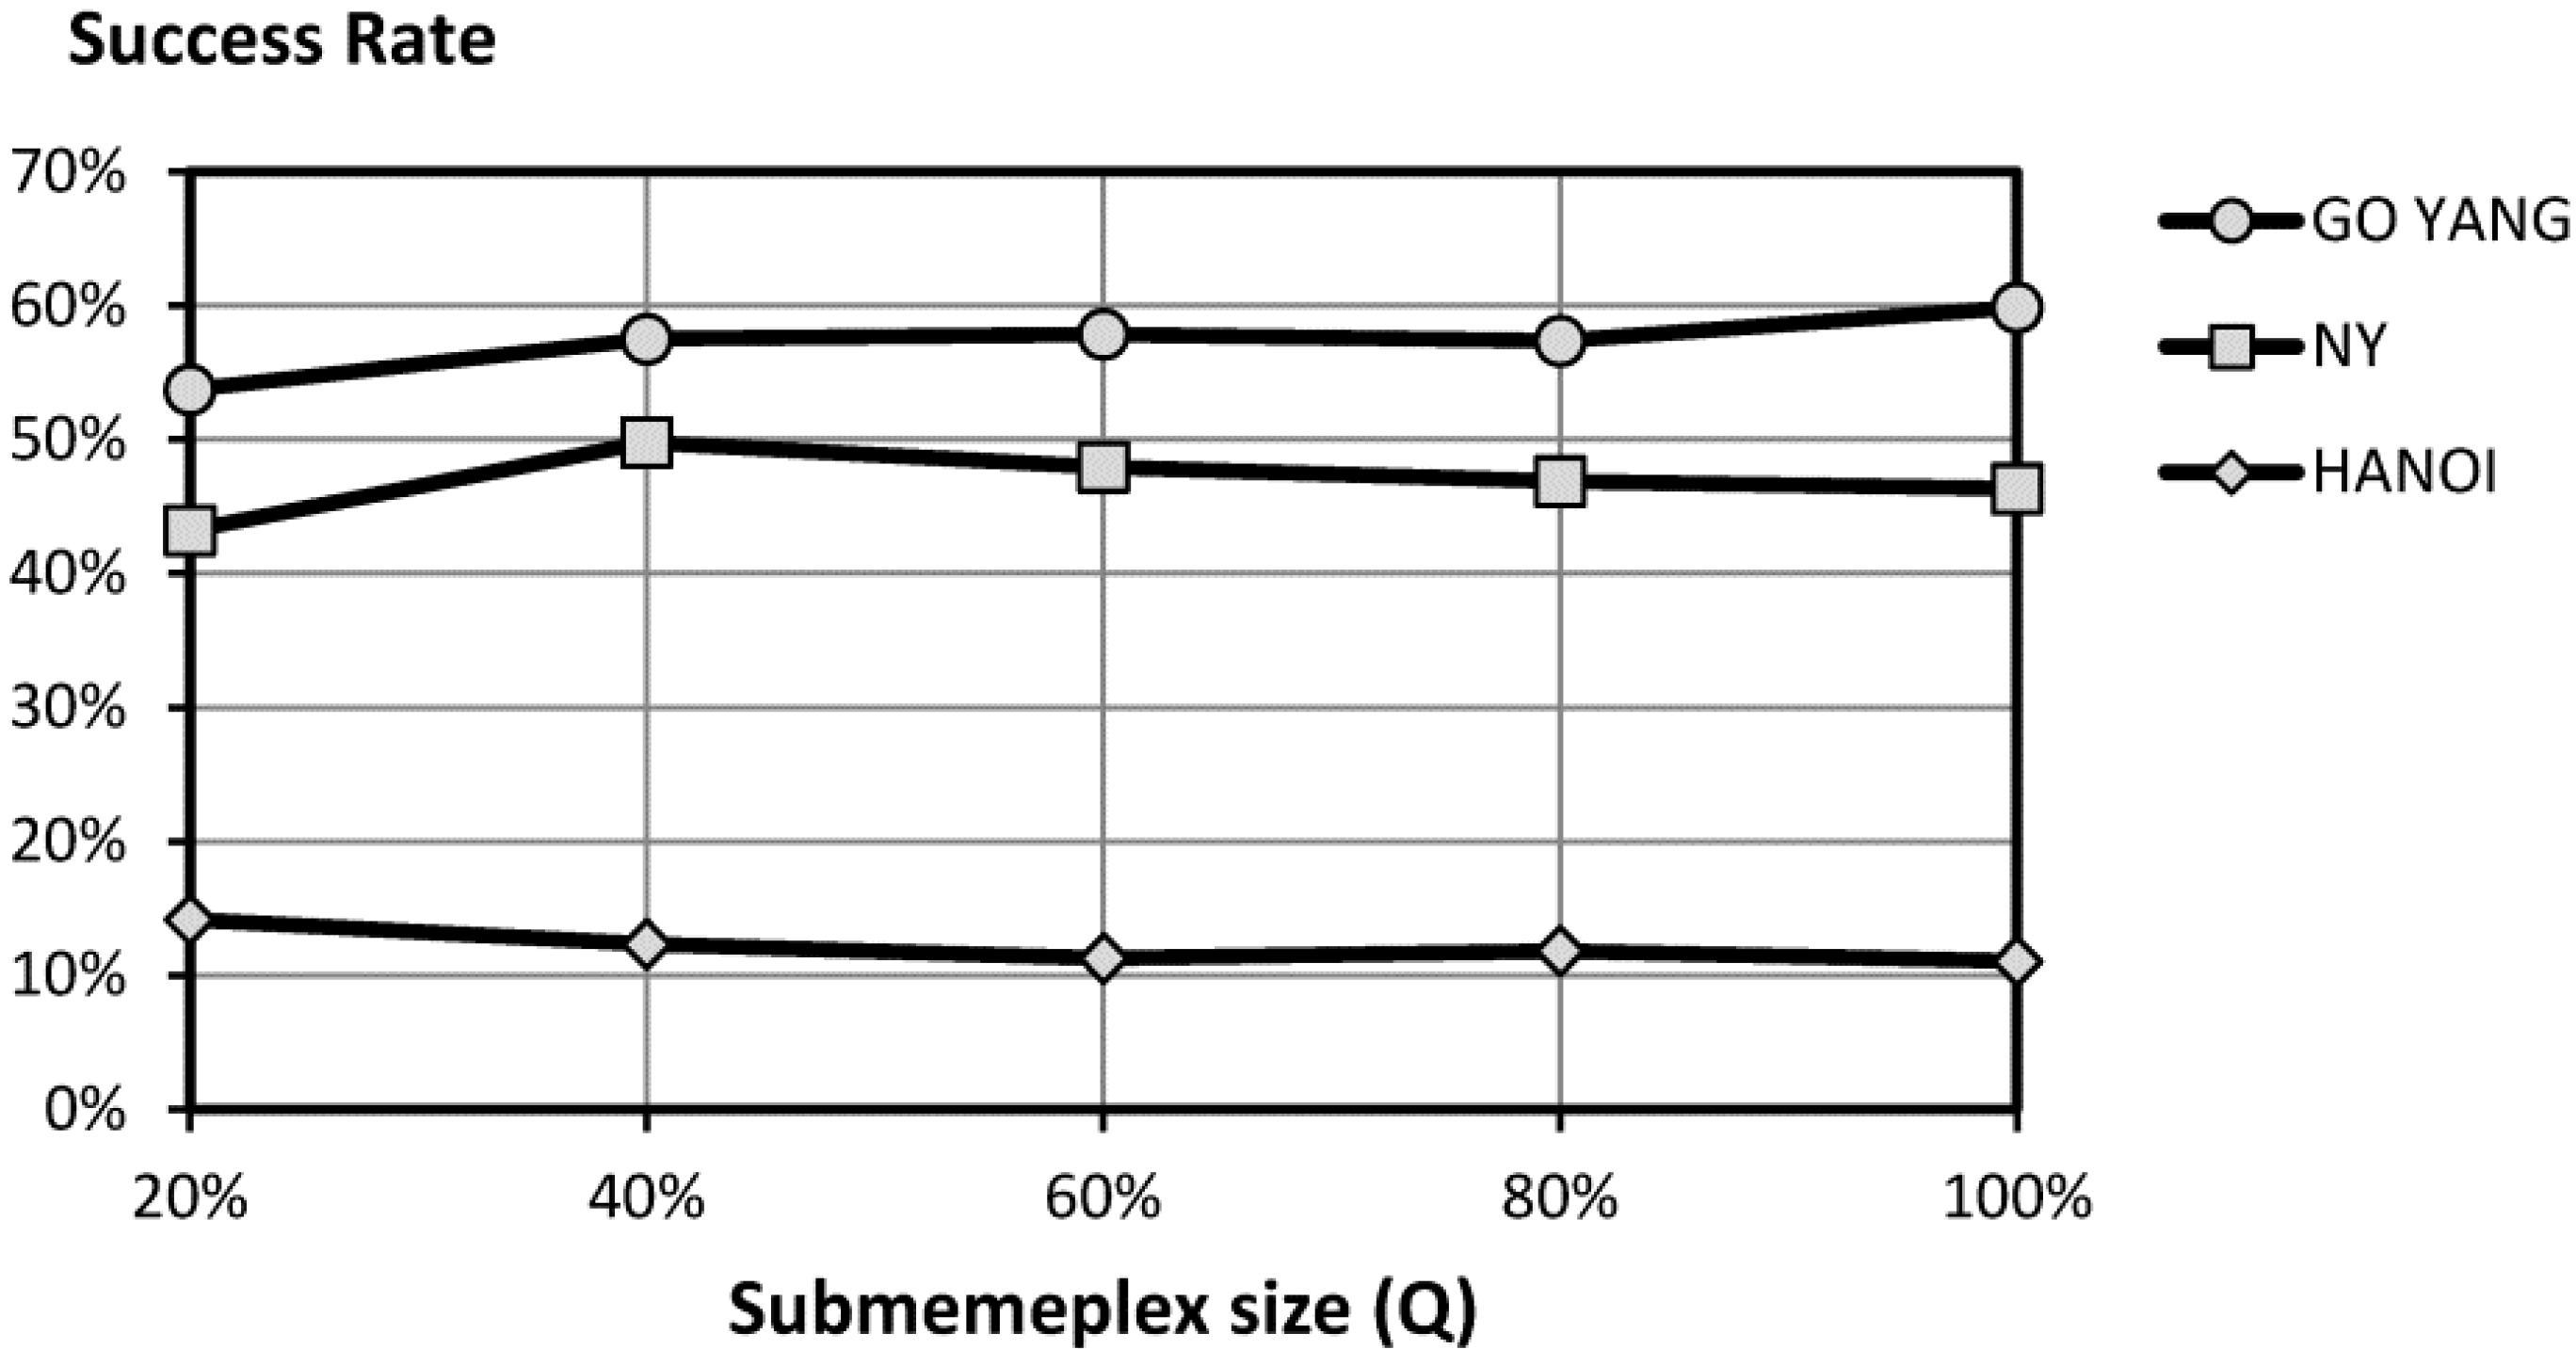
Finally, the submemeplex size (
q) was studied. Regardless of the combination used, there is no influence of
q on the success rate; the small differences are due to statistical dispersion.
Figure 7 shows the effect of
q on the success rate for the three networks.
For the Hanoi network, the success rate is practically independent of the
q value (
Figure 7). For the New York and GoYang networks, the difference between the best and the worst values of
q is approximately 7% (43.2%
vs 49.8% for New York; 53.7%
vs 59.9% for GoYang). However, within the range considered, all of the combinations are able to obtain minimum design solutions quite easily. Therefore, this parameter cannot be considered critical. In this regard, the adjustment of the
C and
Ns parameters are more important. Because one of the main criticisms of SFLA is the high number of parameters, the concept of submemeplex may be ignored when performing the evolutionary steps over the whole memeplex (
q = 100%). This also avoids the operation of selecting memes, reducing the operational times.
After completing the calibration of the SFLA specific parameters, the parameters related to the population of the SFLA (m and n) must be calibrated as well. Thus, the specific SFLA parameters remain constant and the population of the algorithm varies. The goal here is to find the minimum population size that maximizes the success rate.
In accordance with the results obtained in step 1, the key parameter is
C, so the best calibration performed for each network (
C = 2.0 for Hanoi,
C = 1.5 for New York and GoYang) is adopted. The parameter
Ns is directly related to the number of evaluations of the objective function performed by the algorithm, so a larger value of
Ns means a higher probability of obtaining minimal solutions. Overall, increasing
Ns has a similar effect to using larger populations. To conveniently separate the two effects, the authors have chosen to maintain
Ns = 40 because higher values barely increase the success rate in any of the analyzed networks. The results of step 1 determined that
q is not a critical parameter, so
q = 1 is assumed. Thus, 200 repetitions for each possible combination are performed. This paper considers population sizes between 100 (10 × 10) and 900 (30 × 30) individuals. The success rate obtained for each network is shown in
Table 3.
As expected, the success rate increases with the number of frogs involved in the process. However, it is advisable to make a more detailed analysis for each parameter and network analysis.
The general trend is for a slightly better success rate with a greater number of frogs per memeplex (n). For the Hanoi network, increases of up to 20% are obtained in the probability of finding the minimum solution going from n = 10 to n = 20, while the improvement in going from n = 20 to n = 30 memeplexes is 8.5% in the best case. For the New York and GoYang networks, the trend is the same but with smooth curves. Thus, the probability of success increases considerably going from n = 10 to n = 20 (9.5% for New York and 12.5% for GoYang when m = 10) and then decreases between n = 20 and n = 30 (5% in New York and 4% in GoYang). Furthermore, for m ≥ 20, little difference is seen between all of the considered values of n, meaning that n no longer influences the success rate.
The number of memeplexes (
m) generally has a greater impact on the probability of success when going from
m = 10 to
m = 20. For
m > 20, the algorithm performs many more inquiries of the objective function (greater computational effort), but does not improve the results. This situation is clearly seen in the New York and GoYang networks, while in the Hanoi network irregular results are observed due to its greater complexity and larger number of local minima (see
Table 1).
Populations of approximately 400 individuals (20 × 20) ensure sufficient diversity of solutions to obtain the highest success rate, while
P > 400 does not improve the outcome and significantly increases the calculation time.
Table 4 summarizes the parameter setting derived from statistical analysis in each case and shows the success rate before and after the parameter calibration.
Table 4 shows that the success rate significantly increases in all of the cases studied after the calibration of the algorithm parameters. The results demonstrate the importance of properly calibrating the SFLA and that the methodology can be extrapolated to different problem sizes.
5. Conclusions
The economic design of WDN using metaheuristic methods is of great interest because it allows for choosing between alternative solutions that meet a set of design requirements. Among different metaheuristic techniques, a modified formulation of SFLA was studied. The accelerator parameter first used by Elbeltagi [
29] was adopted, and a different definition of the submemeplex parameter
q was used. This study was performed with three benchmark networks: Hanoi, New York Tunnel, and GoYang. Different combinations of the algorithm parameters were studied with at least 35,000 simulations in each case. To define the frequency of every solution, the success rate definition from Eusuff and Lansey [
24] was used. Therefore, a statistical analysis of the results obtained from the modified SFLA was performed to reduce the range of variation of every parameter in order to then maximize the success rate. The conclusions of this study are presented as follows.
The accelerator coefficient (C) is the most significant parameter of SFLA. Values larger than 1 (2.0 in the case of Hanoi and 1.5 for New York Tunnel and GoYang) provide the best results in terms of the success rate.
The success rate is practically independent of the sub-memeplex size (q). Because one of the criticisms of this method is the large number of parameters, it is not necessary to define sub-memeplexes in the memeplexes to obtain a suitable design.
A large population size (m and n parameters) obtains the minimal solution more frequently. In the same way, an increase in the number of evolutionary steps (Ns) allows a higher frequency of the minimum cost solution. As the population size or Ns increases, the computational effort also increases. However, in either case, the value from the algorithm does not improve the success rate, while the computational expense continues to grow (i.e., the relationship between the parameter and the success rate is stabilized). Because the aim of the article included a statistical analysis, the value of both parameters was limited. Therefore, an Ns value of approximately 40 seems to be sufficient for a good success rate, while populations of approximately 400 individuals are sufficient to ensure the best possible performance optimization in medium-sized network problems.
The results show that an optimal combination of the SFLA parameters significantly increases the efficiency of the method. In the case of the Hanoi network, the best SFLA parameters increase the frequency of the minimum solutions from 4.5% to 29%. For the New York Tunnel network, the optimal solutions increase from 34.5% to 64.5%, and for the GoYang network, the optimal solutions increase from 23.5% to 67%.


 ,
, 


