Abstract
The mode of vertical recharge to aquifers is important to the application of appropriate recharge estimation methods. This study identifies the origin, geochemical evolution and mode of vertical leakage to the Gambier Basin confined aquifer, south east of South Australia. The recharge zone spans areas of the Glencoe-Nangwarry-Nagwarry (GNN). The Hundreds of Glencoe and Nangwarry are in South Australia, and the Parish of Nagwarry adjoins Nangwarry in western Victoria. The plot of stable isotopes of water molecules, δ2H versus δ18O, indicates that local rainfall with minor surface evaporation is the source of recharge. The results of hydrochemical analysis indicate that the sources of ions in the recharge zone groundwater are derived from carbonate and silicate weathering with cation exchange. The majority of water types (66% of samples) within the South Australian part of the recharge zone show Ca-Na-HCO3-Cl due to carbonate dissolution processes, and about 83% of samples within the Victorian part of the recharge zone show Na-Ca-HCO3-Cl water types, indicating cation exchange or mixing with other waters. The influence of faults on vertical leakage was studied at eight sites located in the Nangwarry and Nagwarry area using electrical conductivity logging, measuring the concentration of radiocarbon activity, δ18O, 222Rn and terrigenic 4He in the vertical profiles. Results show that regardless of land use in the study area, the interconnection of the unconfined Tertiary limestone aquifer with the Tertiary confined sand aquifer occurs, via both diffuse and preferential flows. Thus, the application of conventional vertical leakage estimation methods using Darcy’s equation or the application of tracer techniques may be inappropriate unless the duality of the flow system is considered.
1. Introduction
Given the lack of perennial creeks and surface water bodies, groundwater is the main source of water in the southeast region of South Australia. The main aquifers in the Gambier Basin are the Gambier unconfined Tertiary Limestone Aquifer (TLA) and the Tertiary Confined Sand Aquifer (TCSA), also known as the Dilwyn Formation [1]. Understanding vertical recharge mechanisms is critically important for the application of appropriate recharge estimation methods in the management of the Gambier Basin confined aquifer.
Understanding the balance between groundwater systems; with inter-aquifer leakage and the mode of recharge is fundamental to the management of the regional groundwater systems. Environmental isotopes and geochemical tracer techniques are widely used to identify the mode of recharge to confined aquifers and to delineate the recharge zone. Banwell and Parizek [2] assess the presence of zones of fracture concentration in unexposed rock by measuring the concentrations of 4He and 222Rn in groundwater and soil gas. In the Banwell and Parizek study, helium-4 and 222Rn in groundwater were measured in the vicinity of two intersecting lineaments. These measurements show that groundwater 4He concentrations may be used to identify fracture zones in unexposed bedrock. 4He, a stable product of the Uranium (U) and Thorium (Th) decay series, escapes from the Earth’s crust and mantle at an approximately constant rate and migrates to the atmosphere by diffusion of gas enhanced by the presence of fractures and faults [2]. Sukhija et al. [3] used environmental isotopes and geochemical tracer techniques to estimate vertical recharge by direct precipitation to a confined aquifer. This methodology assumes diffuse recharge as the process in the intake area of the confined aquifer.
Agarwal et al. [4] employed radiocarbon (14C), 4He and 4He/222Rn dating methods to study the age evolution of groundwater as it flows from the recharge area through a regional alluvial aquifer. The multi-isotope study [4] indicates reasonable consistency in groundwater age estimates, increasing progressively in the groundwater flow direction. Agarwal et al. [4] observed anomalous groundwater ages obtained from 4He and 4He/222Rn and concluded that this is due to the migration of ‘excess helium’ from vents along deep-seated faults. In a northern Western Australia study, Gardener et al. [5] show the usefulness of terrigenic 4He in identifying areas of groundwater inflow to rivers and in distinguishing shallow local and deep regional ground water. The study of Gardner et al. [5] involves measurements of dissolved 4He and 222Rn to identify areas of regional groundwater discharge. Choi et al. [6] demonstrated the usefulness of depth profiles of hydrochemistry and environmental isotopes to identify groundwater recharge sources, processes and geologic control. In the study, environmental isotopes (δ2H, δ18O and 3H) were used to elucidate two distinct recharge zones on the basis of groundwater age and the degree of evaporation during recharge. According to the study of Gumm et al. [7], fluid exchange between the deep basal aquifer system and the upper aquifer layers is generally impeded by confining layers, but can exchange in the locality of faults zones. Geochemical data reported in Gumm et al. [7] indicate that faults, even in unconsolidated aquifer systems, can act as loci for hydraulic connectivity between deep and shallow aquifers. Groundwater age tracers are widely used to estimates groundwater recharge. However, the recent work of Wood et al. [8] shows that multiple processes can influence the shape of vertical tracer profiles in the aquifer, including variation in tracer input concentration from the unsaturated zone, diffusion in transporting the tracer into the aquifer and the spatial variability of recharge.
Most of the early works in the Gambier Basin focus on the TLA [9,10,11,12]. Regional scale recharge to the TCSA has been undertaken by Love [1] by studying the distribution of δ2H, δ18O and 14C activity. This work suggests two predominant recharge mechanisms for groundwater reaching the TCSA system: rapid recharge via sinkholes or through very permeable soil and slower recharge with more evaporation due to storage in wetlands and lower permeable soil. Harrington et al. [13] construct a compartmental mixing-cell model to simulate the transport of hydrochemical and isotope species in regional groundwater systems. Radiocarbon simulation helped to quantify leakage to the confined aquifer, in an area outside the Glencoe-Nangwarry-Nagwarry (GNN) recharge zone, with the rates of modelled leakage in the range of 2–9 mm·year−1. The only study within the GNN recharge zone focusing on vertical groundwater recharge to the TCSA to date was carried out in 2001 by Brown et al. [14]. This study examines the hydraulic relationship between the two aquifer systems and the aquitard at two sites, Nangwarry and Tarpeena, within the recharge zone described by Holmes and Waterhouse [15]. Brown et al. [14] conclude that recharge to the confined aquifer may occur in a relatively small localized area, possibly controlled by preferential flow. This study makes no recharge estimation to the TLA or vertical leakage estimation to the TCSA. Available investigation sites (two) were constraints to the Brown et al. [14] study.
The present investigation represents an extension of Brown et al. [14] and provides insight into the mode of recharge (diffuse or preferential) to the TLA and vertical leakage through the aquitard to the TCSA. This is examined at eight study sites. About 83% of the Hundreds of Nangwarry recharge zone [1,14,15] is covered with pine or softwood (Pinus radiata) and Tasmanian blue gum or hardwood (Eucalyptus globulus) plantation forests, and the impact on recharge to both TLA and TCSA is a concern for the sustainability of the water resource. We investigate mechanisms of vertical recharge to unconfined and confined aquifers at eight sites to develop a conceptual model for the estimation of vertical recharge to the TCSA. In this investigation, we study: the geochemical processes within the recharge zone; use stable isotopes (δ2H, δ18O), 14C, 222Rn, terrigenic 4He (4Heterr) and Electrical Conductivity (EC) profiles to examine the mode of downward leakage that occurs from the unconfined to the confined aquifer systems; evaluate recharge mechanisms; and delineate potential recharge zones to the TCSA of the Gambier Basin, South Australia. In addition, we provide an improved potentiometric head contour map and groundwater distribution pattern from the recharge zone along flow paths within the TCSA.
2. Hydrogeological Setting of the Recharge Zone and the Gambier Basin
The study area is located within the Gambier Basin (formerly called the Gambier Embayment), which is defined as the Tertiary section of the Otway Basin and contains a mixed sequence of marine and terrestrial deposits [16]. The South Australian portion of the Gambier Basin spans approximately 11,350 km2. The Gambier Basin is separated from the Murray Basin to the north by the Padthaway Ridge, a granitic basement high, towards the northeast by the Kanawinka fault line and to the southeast by the Dundas Plateau (Figure 1). Numerous structural features occur within the Gambier Basin, including the prominent northwest trending Kanawinka Fault and the west-northwest trending Tartwaup Fault (Figure 1). Structural features in the Gambier Basin are considered to have a significant influence on groundwater flow [17]. Two major aquifer systems within the Gambier Basin are the multi-lithological unconfined aquifer system, the TLA and the TCSA, also known as the Dilwyn Formation. The TLA consists of the Tertiary Gambier Limestone, the Quaternary Padthaway Formation and the Bridgewater Formation [1] and small superficial aquifers overlying, but hydraulically interconnected with the underlying Gambier Limestone [1]. The Gambier Limestone, which is divided into a series of sub-units [18], is a continuous system. Karstic features are common within the Gambier Limestone making it a dual porosity system. The Gambier Limestone is the main unconfined aquifer of interest although occasionally may contain some Bridgewater Formation. The main lithologies of the upper Tertiary aquitard are glauconitic and fossiliferous marls and clays of the Narawarturk Marl and the clays of the Mepunga Formation [1]. The Mepunga Formation is sparsely fossiliferous, brownish, geothitic quartz grit, 9–12 m thick over much of the southern Gambier Basin [16]. When the unit occurs in the clay facies, it can be hard to distinguish from the Narawarturk Marl until the iron composition becomes more dominant or limonitic grains are observed.
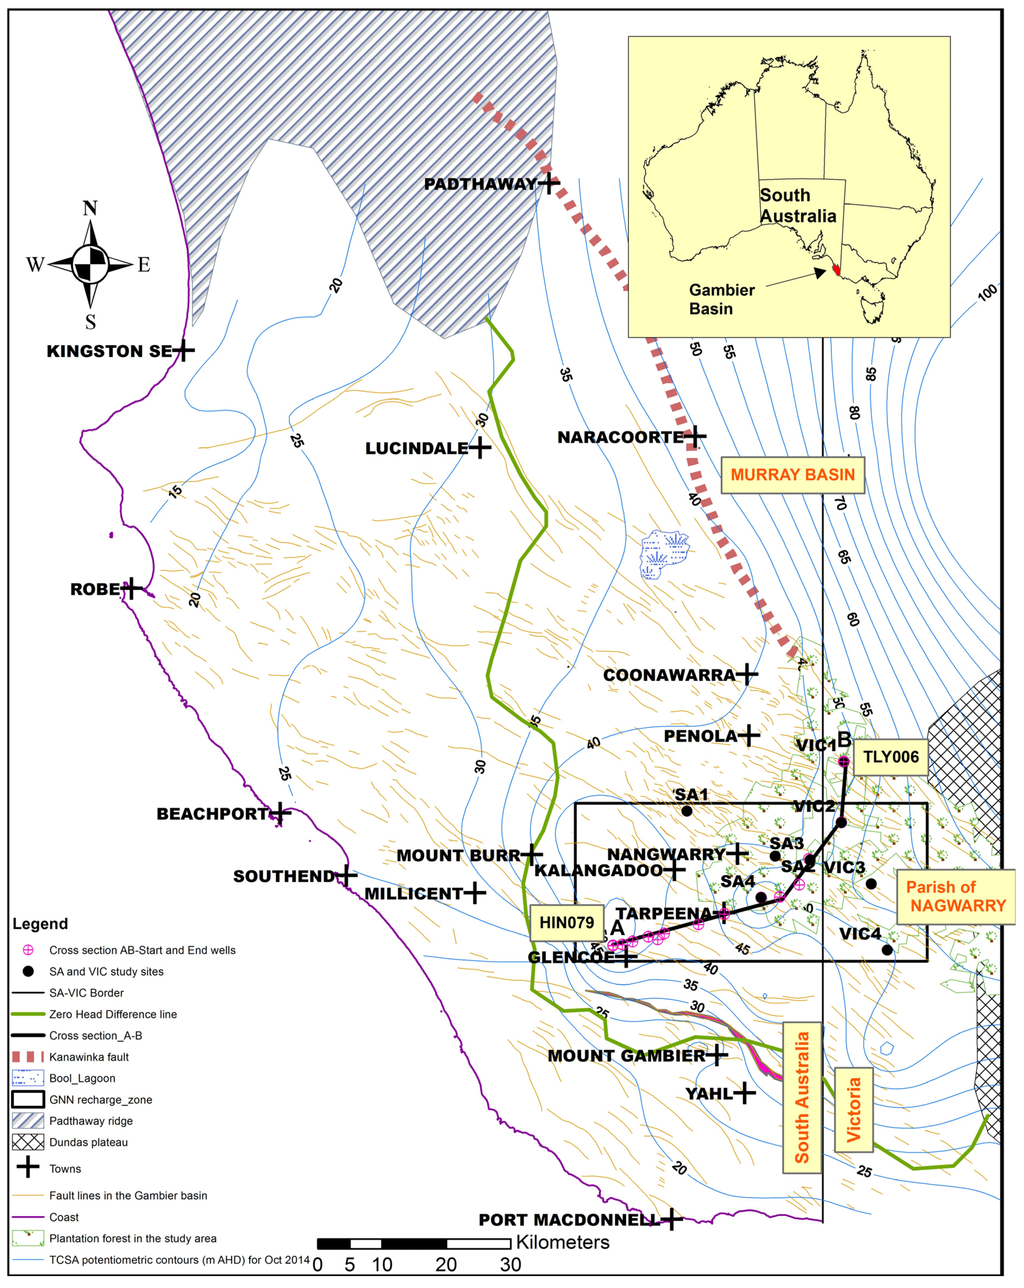
Figure 1.
Gambier Basin and the Glencoe-Nangwarry-Nagwarry (GNN) recharge zone. TCSA, Tertiary Confined Sand Aquifer; AHD, Australian Height Datum.
The TCSA is a multi-aquifer system, but due to the paucity of data, it is treated as one aquifer. The TCSA comprises interbedded sands, silts and carbonaceous clays of early Tertiary age and generally increases in thickness towards the south, being up to 800 m thick [17] and covered by up to 300 m of Quaternary and Tertiary sediments. The TCSA outcrops adjacent to the basement high area of the Dundas Plateau (Figure 1) have historically been considered the main area of recharge. The only known outcrop of the TCSA in South Australia occurs 10 km northwest of Mount Gambier [19]. Uplift of TCSA occurs at the Nangwarry and Glencoe area and is found at shallow depths, with pronounced groundwater mounds found at both localities (Figure 1). The Nangwarry area studied by Colville and Holmes [10] was identified as a recharge zone to the confined aquifer and named the Nangwarry recharge zone by Holmes and Waterhouse [15]. Since most of the wells drilled penetrate only the upper sand unit, hydraulic interconnection between the sub-aquifers of TCSA is unknown [17]. Due to the limited outcrop of the TCSA, Love [1] considers that recharge is predominantly via downward leakage through the unconfined aquifer and confining beds; there is potential for this to happen in the area north and east of the Zero Head Difference line, where the hydraulic head in the unconfined aquifer is up to 15 m higher than the confined aquifer (Figure 1).
In the Glencoe and Nangwarry area in South Australia and the adjoining area of Nagwarry in western Victoria, TCSA occurs at shallow depths. The area is highly faulted, and groundwater mounds occur in TCSA at Glencoe and Nangwarry (Figure 1), indicating that TCSA is receiving high vertical recharge. The Glencoe-Nangwarry-Nagwarry (GNN) recharge zone is therefore considered the primary vertical recharge zone to the TCSA. Groundwater movement from the TCSA recharge zone is radially to the northwesterly-south direction. The topography of the area is generally flat at about 70 m above Australian Height Datum (m AHD).
The main geological units in a downward order consist of unconfined TLA, the Narawarturk Marl aquitard, the Mepunga Formation, the Dilwyn clay aquitard and the TCSA-Dilwyn sand aquifer (Figure 2). Of the eight investigation sites, four (SA 1–4) are located within the South Australian side and the rest (VIC 1–4) are located across the border on the Victorian side (Figure 1). Brown et al. [14] established two sites with nests of wells completed at various intervals through the unconfined aquifer, aquitard and confined aquifer. These authors established the sites at Nangwarry (SA 3) and at Tarpeena (SA 4) with the aim of determining hydraulic connectivity between TLA and TCSA and the mechanism that controls groundwater flow through the aquitard. The rest of the sites (SA 1–2, VIC 1–4) were established for the South Australia-Victoria Border Zone Groundwater Investigation in 2011 [20,21]. Five wells have been drilled at each site; 100 mm-diameter monitoring wells in TLA, Mepunga Formation, Dilwyn clay aquitard and TCSA, and one well completed with a 250-mm diameter in TCSA for pumping tests. All wells are pressure cemented above the production zone (to full casing depth) to isolate the target zone and to prevent cross-contamination from other layers. The main features of the study sites include: the presence of the Narawarturk Marl found in SA 3 (9 m thick), at VIC 1 (1 m thick) and at VIC 4 (12 m); the varying thickness of the Mepunga Formation (4–12 m at SA sites and 1–12 m at VIC sites) and the Dilwyn clay aquitard (2–7 m at SA sites and 3–20 m at VIC sites). Overall, no Dilwyn clay aquitard (3-m Mepunga Formation separating TLA and TCSA) occurs at VIC 3 and the thickest at the VIC 4 site (26 m: 9-m Narawarturk Marl, 12-m Mepunga Formation and 5-m Dilwyn clay). Apart from the SA 1, VIC 3 and VIC 4 sites, the remaining sites are located within the plantation forest.
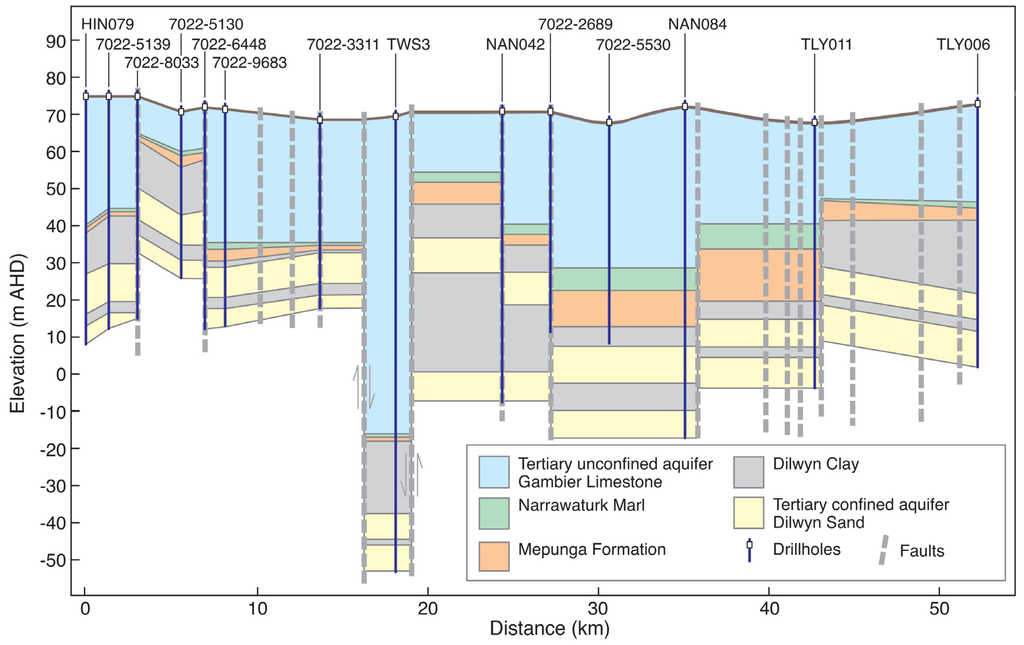
Figure 2.
Conceptual geological cross-section AB in Figure 1. Inferred fault displacements are shown in exaggerated vertical scale.
A geological cross-section across the GNN recharge zone is presented in Figure 2. In the southwestern part of the GNN recharge zone, the Narawarturk Marl and Mepunga Formations are thin; for example, at well HIN079, both Narawarturk Marl and Mepunga are about 1 m thick, and a 12 m-thick Dilwyn clay aquitard is present. About 20 m uplift of all formations is evident from Drill Hole 7022–8033 to Drill Hole 7022–6448. A major displacement occurs between two fault lines east and west of TWS 3 (Town Water Supply 3), the water supply well to the township of Kalangadoo. The thickest TLA is found at this location with thin Narawarturk Marl and Mepunga Formations. The area is identified as the Kalangadoo-Tarpeena fault zone. In this area Narawarturk Marl and Mepunga Formation are about one metre thick, and the thickness of the Dilwyn clay aquitard is about 20 m. Vertical displacement of the formations combined with a thin aquitard favours relatively high direct recharge to the TCSA, as evident in the presence of groundwater mounds in the Glencoe area (Figure 1). However, currently, there are no investigation sites available.
Towards the east of the Kalangadoo-Tarpeena fault zone, from NAN042–NAN084 wells, a moderately thick Narawarturk Marl (3–7 m) and Mepunga Formation (3–12 m) are found. Monitoring well NAN042 is the TCSA well at the study site SA 4 and is located close to a fault line. The monitoring wells TLY011 and TLY006 are the TCSA wells at study sites VIC 2 and VIC 1. In this area, once again, the thickness of the Narawarturk Marl (1–2 m) and Mepunga Formation (3–5 m) is reduced, but thick Dilwyn clay (13–20 m) is present.
In general, the TCSA is a laterally hydraulically-connected aquifer throughout the Gambier Basin, but some disconnections may occur as observed in the vicinity of major regional faults; the Kanawinka and Tartwaup (Figure 1). Within the GNN recharge zone, the hydraulic head in the TLA is 7–19 m higher than the TCSA, except at the VIC 3 site.
3. Methods
3.1. Field Measurement and Laboratory Analysis
The primary dataset used for this study is the hydrochemical, noble gas, stable isotopes and 14C data collected for the South Australia-Victoria Border Zone Groundwater Investigation by the predecessor of the Department of Environment, Water and Natural Resources (unpublished data, 2011) supplemented by historical data collected in 1991 [1] and 2001 [14]. Even though the three sets of data have a 10-year gap, they match remarkably well. In addition, EC logging was conducted in 2013 and 2015 at all sites. Groundwater samples were collected in 2011 by well purging. The wells were purged until the pH and EC had stabilized according to the sampling procedure [22]. It is accepted that stabilization occurs when at least three consecutive measurements remain constant. Well construction details at the study sites are given in Table 1.

Table 1.
Well depths and production zones of the sites SA 1–SA 4 and VIC 1–VIC 4. TLA, Tertiary Limestone Aquifer.
Water samples were preserved according to the standard methods specified in the Australia/New Zealand standard AS/NZS 5667.5 [23] guidelines. Analysis of Ca, Mg, Na, K and SO4 is based on Method 3120B-Metals by plasma emission spectroscopy [24]; for the analysis of chloride, Method 4500-Cl Chloride-E (automated ferricyanide method) [25] was followed; and for the analysis of HCO3, Method 2320 Alkalinity-B [26] was followed using a radiometer autotitrator. Water samples for stable isotope analysis were collected in 30-mL McArtney glass bottles with metal screw top lids with a rubber insert. In order to reduce evaporation, samples were stored and transported inverted. Stable isotope (δ2H and δ18O) samples were analysed at the CSIRO isotope laboratory in Adelaide. The standard procedure for analysis of the oxygen-18 composition of water is that described by Epstein and Mayeda [27] with CSIRO isotope laboratory modification involving equilibration of CO2 with 1 mL of water in a temperature-controlled block held at 50 °C for 8 h. The preparation and extraction of the CO2 is automated using a 59-port Water Equilibration System (WES). This is attached to a GEO 20–20 dual inlet stable isotope gas ratio mass-spectrometer [28]. The WES method is also used for the analysis of the deuterium composition of water. The method is similar to 18O analysis via WES, except that, for 2H analysis, hydrogen atoms from the water molecules are equilibrated with hydrogen gas rather than oxygen atoms equilibrating with oxygen in CO2. The water samples for 14C were collected using 1.25-L Polyethylene Terephthalate (PET) bottles. The well was pumped till the EC, temperature and pH readings were stabilised. A total of 5.0 L of groundwater was collected from each well. The sample bottles were sealed and securely capped. Radiocarbon was analysed at the Australian National University Radiocarbon Dating Centre according to the method described by Fallon et al. [29].
Noble gases were sampled without exposure to the atmosphere, using a passive diffusion sampler [30]. The sampler is about 15 cm in length and 3 cm in diameter. The sampler was lowered into the well to a location at the midpoint of the well screen. Following the procedure described by Gardner and Solomon [30], samples were retrieved after 24 h of equilibrium in the well. 222Rn was measured at the CSIRO Environmental Isotope Laboratory in Adelaide, using low-level liquid scintillation counting [31], and dissolved 4He was analysed with a Stanford Research Systems RGA 220 quadrupole mass spectrometer with cryogenic separation (Poole et al. [32], cited in Gardner et al. [5]). The integrity of the samples was checked for terrigenic 4He lost during the sampling (which has already been ‘excess air corrected’ [33,34]) and is based on the ratio of measured neon-20 (20Nem) to neon-20 equilibrium with the atmosphere (20Neeq). If the ratio of 20Nem/20Neeq is less than 1, then the gas has been lost during the sampling. For the analysis, we used the assumed recharge water equilibrium concentration of neon-20 as 1.67 × 10⁻⁷ cm3 STP g−1 at a recharge temperature of 15 °C and an altitude of 70 m AHD, and no fractionation of gas occurs during the loss process. Three samples, VIC 1, Mepunga Formation, and TCSA samples at VIC 3 and VIC 4, were found to be degassed during sampling and were removed from the analysis. Because of the short half life of 222Rn, any contribution from excess air would be considered negligible.
Salinity profiles of monitoring wells were obtained using YSI 600XLM Sonde [35] connected to a laptop computer. The sonde was calibrated using conductivity standard placed in a pre-rinsed and dry calibration cup, with the probe end of the sonde immersed into the solution and calibrated according to the procedure in the manual. The sonde was connected to a 120-m length cable and lowered down the well from the surface to the well base, recording EC data along the way. The calibrated 600 XLM Sonde has a conductivity range of 0–100,000 μS·cm−1 with an accuracy of measurements ±0.5% reading +1 μS·cm−1 and can operate in a temperature range −5 °C to 45 °C up to a 200-m depth.
3.2. Method of Data Analysis
Characteristics of rainfall-recharge were assessed using the δ2H versus δ18O relation, plotted together with the Global Meteoric Water Line (GMWL) [36] and the Local Meteoric Water Line (LMWL) of Adelaide and Gambier Basin. Enrichment of stable isotopes, δ2H and δ18O, and conservative tracers, such as chloride, are used as an indicator of water loss by evaporation and transpiration [1,37,38]. With regards to groundwater mixing, groundwater was classified into “water types” on the basis of the absolute and relative abundance of major ions [39]. The Piper diagram is commonly used to graphically display the bulk chemical composition of groundwaters, and it was therefore used to identify groundwater mixing and for classification into water types. Gibbs diagrams are widely used in hydrogeochemical studies [40]. Gibbs [41] recommended two diagrams, and used in this study to assess the dominant effects of precipitation, rock weathering and evaporation on hydrochemical evolution of groundwater in the GNN recharge zone. The vertical recharge mechanism and spatial variability were interpreted from the vertical profiles of EC, 14C activity, δ18O, 222Rn and 4Heterr with respect to the stratigraphy of each site.
4. Results and Discussion
4.1. δ2H and δ18O Variation in the TCSA Recharge Zone
Distinct isotopic and geochemical compositions allow us to distinguish the contribution from various recharge sources, such as surface water subject to evaporation or direct recharge of the aquifer through preferential flow paths.
The empirical relationship of δ2H = 8δ18O + 10 [35] for meteoric water on a global scale is a common reference for local studies. The Global Meteoric Water Line (GMWL) relationship varies depending on location, and it is necessary to define a local meteoric water line relationship derived from the annual weighted mean of δ2H and δ18O in local rainfall. Due to the lack of sufficient data for the study recharge zone, the Adelaide LMWL and Gambier Basin LMWL [1] are taken as the reference in this study. GMWL and LMWL are presented in Figure 3.
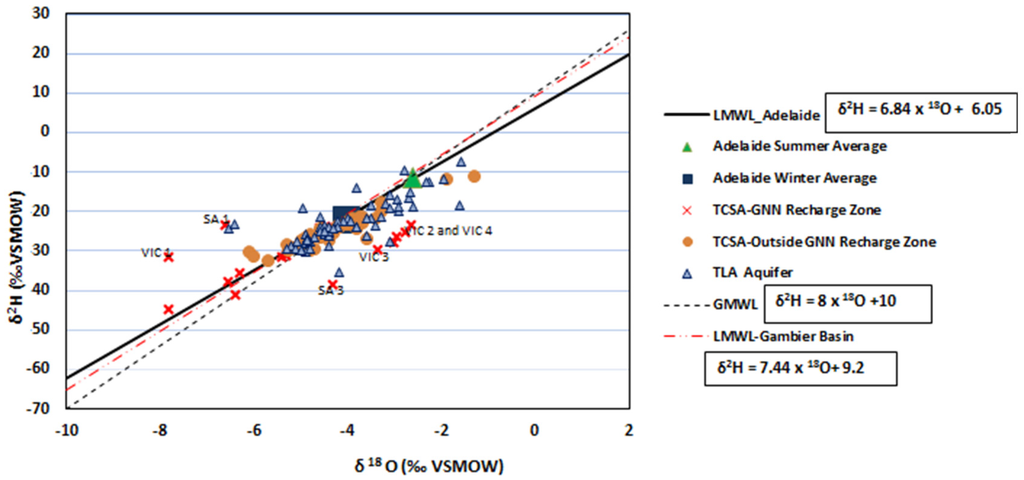
Figure 3.
Relationships of δ2H and δ18O within and outside the GNN recharge zone, with groundwater stable isotopes from TCSA and TLA aquifers. LMWL, Local Meteoric Water Line; GMWL, Global Meteoric Water Line.
The majority of groundwater samples from the TCSA and TLA are plotted with the Adelaide winter average, with few observations around the summer average isotope. This indicates that recharge takes place predominantly during winter months. While there are varying degrees of overlap, particularly from data at TLA and TCSA outside the GNN recharge zone, the data tend to fall in the upper, middle and lower ends respectively of the Meteoric Water Line (MWL).
When water is subject to evaporation, the lighter isotopic species are preferentially removed; thus, the remaining water becomes relatively enriched in the heavier isotopic species. A majority of the results show good conformance with the MWL, indicating that recharge occurred either aerially during rainfall periods or shortly afterwards with minor surface evaporation. This could also be due to variations in distance from the coast to sample points or rainfall variation across the Gambier Basin [42]. Relative to MWL, this enriched water plots below and on a line of slope less than 8.0 (6.84 for Adelaide MWL and 7.44 for Gambier Basin). A majority of TLA and TCSA data plotting along the MWL suggests that rainfall is the source of recharge in this aquifer. In the GNN recharge zone, TCSA waters at sites SA 3 and VIC 2–4 plot below the MWL, exhibiting signs of evaporative enrichment. At sites SA 3 and VIC 4, a 9 m-thick Narawarturk Marl aquitard is present, and the process may be controlled by slow diffuse recharge. Site VIC 2 is close to a wetland (Lake Mundi), and enriched surface water may be a contributing factor to TCSA recharge. The lighter isotope data points for the GNN-TCSA aquifer, which plots along GMWL and LMWL, belong to sites SA 1, SA 2, SA 4 and VIC 1, indicating that recharge occurred during the cooler winter months.
4.2. Water Chemistry of the Recharge Zone
Understanding geochemical processes in groundwater is a prerequisite for correction of 14C ages and documenting groundwater flow and recharge [43]. Processes that govern the hydrochemical evolution in the GNN recharge zone were studied using major ion chemistry. The concentration of ions dissolved in groundwater is generally controlled by lithology, groundwater flow rate, natural geochemical reactions and human activities [44,45]. In fresh groundwaters, both HCO3− and CO32− originate mainly from the dissolution of sulphates; dolomite, calcite or silicate minerals also contribute to this concentration. Apart from the Ca-HCO3 water type in TLA at the SA 3 site and the Ca-SO4 water type in the Mepunga Formation at the SA 1 site, no end member water types are present in the recharge zone. However, Na-Cl-HCO3 water is present in the Dilwyn clay aquitard at SA 4 and TCSA at VIC 1, VIC 2 and VIC 4. The Piper diagram shows that Na+, Ca2+, Cl− and HCO3− are the dominant ions in most parts of the study area (Figure 4).
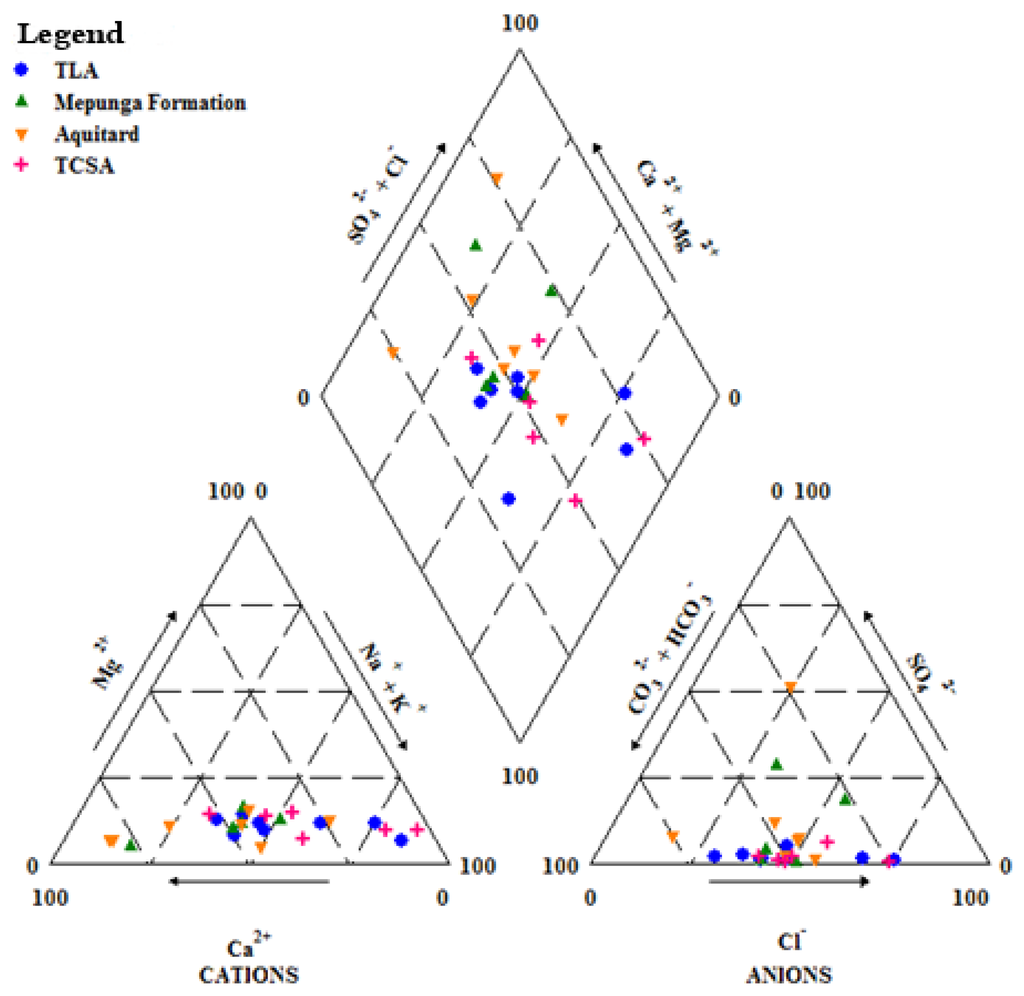
Figure 4.
Piper diagram.
Hydrochemical facies of the majority of groundwater samples (66%) at SA sites showed Ca-Na-HCO3-Cl due to carbonate dissolution processes. About 83% of samples at VIC sites show the Na-Ca-HCO3-Cl water type. At the SA 2–4 sites, TCSA water is Na-Cl-HCO3, and at SA 4, the Na-Ca-Cl-HCO3 water type indicates that ion exchange processes or silicate weathering occurred. Calcium and sodium are the dominant cations, and bicarbonate was the dominant anion in the recharge zone. The abundance of Ca2+ and Na+ in the groundwater could be related to the presence of carbonate rock in the basin, while weathering of carbonate and silicates may contribute Ca2+ and Na+ to the groundwater. In a similar study, Chae et al. [46] report two distinct groundwater types, a Ca-HCO3 type and a Na-HCO3 type, with the former indicating strong influence by surface processes and the Na-HCO3 type water indicating the attainment of a chemically more stable state.
The plot of (Ca + Mg) versus (HCO3 + SO4) shows (Figure 5a) that the majority of data points cluster around a 1:1 stoichiometry of (Ca + Mg) to (HCO3 + SO4), indicating that Ca, Mg, SO4 and HCO3 are derived from simple dissolution of calcite, dolomite and gypsum [47,48,49]. Minor ion exchange takes place at TLA and the Mepunga Formation at VIC 3, as the data plot below the 1:1 line, which reflects that portion of the anion balances of Na and K produced by silicate weathering. The various ionic relationships confirm the ion exchange process, where Ca and Mg in the aquifer matrix have been replaced by Na at favourable exchange sites [50]. Excess (Ca + Mg) over (HCO3 + SO4) at sites SA 1, SA 4 and VIC 1 indicates a reverse ion exchange phenomenon.
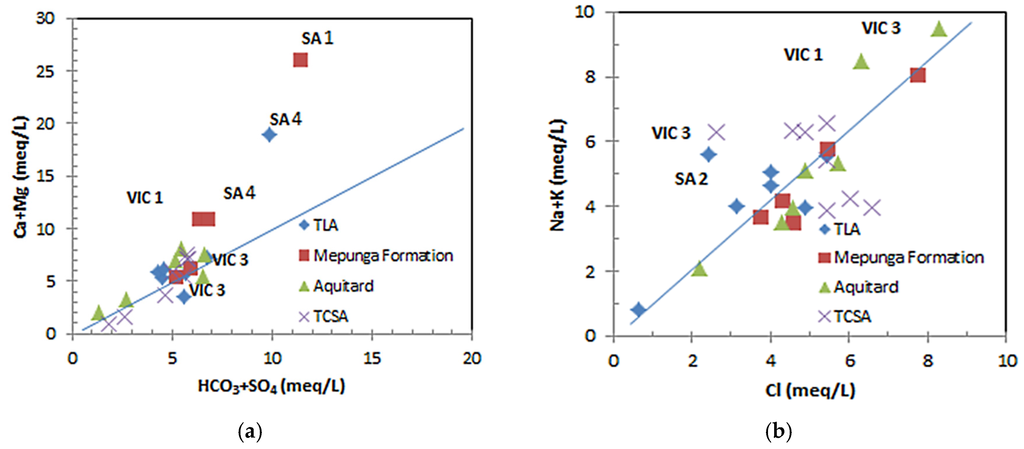
Figure 5.
(a) Plot for (Ca + Mg) versus (HCO3 + SO4); (b) plot for (Na + K) versus Cl.
The plot of (Na + K) versus Cl (Figure 5b) shows that the majority of data clusters around, but sits above the 1:1 line, particularly at the SA 2 , VIC 1 and VIC 3 sites, where excess (Na + K) over Cl is found. Since the salinities of the samples are low (1551, 718 and 533 mg·L−1, respectively) and have lower chloride concentrations (170, 270 and 130 mg·L−1, respectively), this reflects Na and K were derived from silicate weathering and ion exchange processes.
Several factors influence natural groundwater chemistry. These include the physical situation of the aquifer, bedrock mineralogy and climatic conditions. Gibbs [41] suggests the mechanism controlling water chemistry and the functional sources of dissolved ions can be assessed by plotting Total Dissolved Solids (TDS) versus the ratios of Cl/(Cl + HCO3) for anions and (Na + K)/(Na + K + Ca) for cations. Gibbs diagrams illustrate the natural mechanism controlling groundwater chemistry, including rock weathering dominance, evaporation and precipitation dominance. Based on the Gibbs diagram (Figure 6), all samples from the GNN recharge zone fell into the group influenced by the rock weathering reaction, where ion ratios are between 0.4 and 0.5, with TDS less than 1000 mg·L−1.
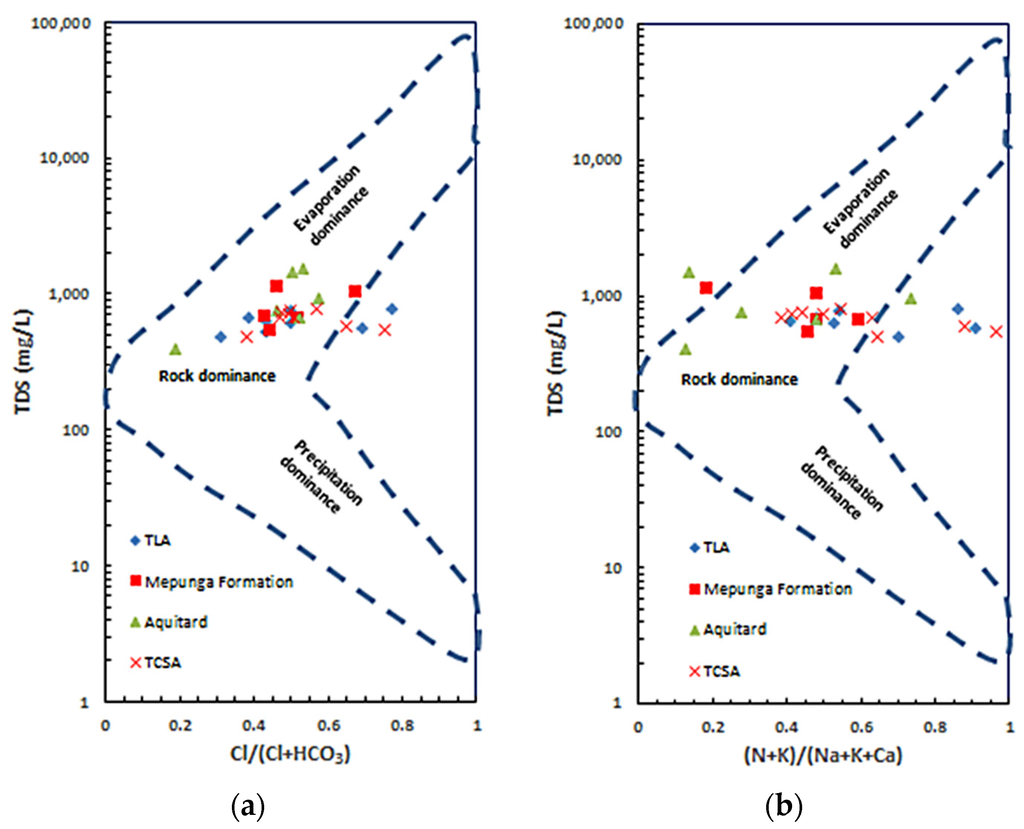
Figure 6.
Gibbs diagrams for the groundwaters at the study sites. (a) TDS vs. Cl/(Cl + HCO3); (b) TDS vs. (Na + K)/(Na + K + Ca).
It appears that the ion chemistry of fresh groundwater is related to the carbonate and silicate weathering process in the GNN study area. However, evaporation is marginally influential, approaching the boundary line of the evaporation dominance zone (Figure 6). The Gibbs diagrams also show that the ion ratios in both TLA and TCSA are increasing without great variation of TDS. This indicates cation exchange also takes place in both aquifers (VIC 1, VIC 2 and SA 2 in TCSA and SA 1, VIC 3 and SA 4 in TLA). The results of hydrochemical analysis indicate that the sources of ions in the recharge zone groundwater are derived from carbonate and silicate weathering with cation exchange.
4.3. EC, 14C and 18O Profiles at the Study Sites
One of the objectives of the chemical investigation is to examine the mode of downward leakage that occurs from the unconfined to the confined aquifer systems. The profiles of parameters EC, 14C and δ18O are used to identify variations in the profile, which in turn indicate the mode of recharge. Carbon-14 is commonly used for groundwater ‘apparent age’ determination using the expression [51]:
Carbonate mineral dissolution dilutes the radiocarbon content of Dissolved Inorganic Carbonate (DIC), and for studies requiring ‘best estimate age’ [51], correction is necessary in order to determine absolute groundwater ages [52,53].
where q is the fraction of carbon derived from the soil zone and is estimated following Atkinson et al. [43]:
where δ13CDIC is the measured values of the samples; δ13Ccc is the value for carbonate, taken as 0‰, as is derived from marine sediments [1]. For soil gas, initial values of δ13Cr (recharging water) and 14Cintial were taken as −20‰ and 100 pmC [54]. The correction for dilution is applied to the site SA 3-TLA sample. For carbonate, measured δ13CDIC and 14C activity for the SA 3-TLA sample are −13.36‰ [54] and 73.3 pmC. This results in an apparent age of groundwater of 2569 years, a dilution factor of 0.665, a corrected 14C activity of 109 pmC and a corrected radiocarbon age of 805 years. Obviously, dissolution of carbonate results in estimating longer residence time and, hence, is considered as the maximum possible groundwater age. The reliability of radiocarbon in estimating groundwater residence times depends on accurate estimation of C14initial and δ13Cr of the DIC at the time of recharge [55]. In order to illustrate the sensitivity, if it is assumed that δ13Cr is −15‰ for the SA 3-TLA sample; the corrected radiocarbon age would be 1511 years. Thus the ‘best estimate age’ should not be used for further calculations or quantitative interpretations, since the veracity of the carbon dilution correction cannot be verified. The apparent age (or measured 14C activity) is the best reference and is used for all comparison studies [51].
In this study, the relative presence of measured 14C activities is used, in preference to the corrected 14C or absolute residence time of groundwater recharge to compare the TLA, aquitard and TCSA and between study sites. Therefore, correction to measured 14C activity was not made. In the Gambier Basin, 13C values [1,14] are fairly constant in groundwater at −11.17‰ ± 1.8‰ (n = 40), and therefore, the contribution to 14C from carbonate weathering within TCSA is considered insignificant. We have not considered the influence of diffusion on 14C transport in this study.
Detailed profiles of EC, 14C and δ18O are presented in Figure 7 (SA sites) and Figure 8 (VIC sites) with corresponding stratigraphy units for each site. EC profiles are considered useful indicators to identify possible pathways of freshwater from point recharge sources [46,47] and are used to track possible groundwater flow pathways. EC profiles are considered superior to mid-screen water sampling alone as the sonde records EC of water at 0.05-m intervals, thus enabling identification of EC changes at short depth intervals. A single water sample from the production zone obtained by well purging may contain water received from all flow paths to the production zone and may include a mixing effect. For comparison, EC measurements made during 2011 are plotted alongside EC profiles obtained in 2013 and 2015. The results show that groundwater of the TLA, aquitard and TCSA generally has different EC and isotopic signatures.
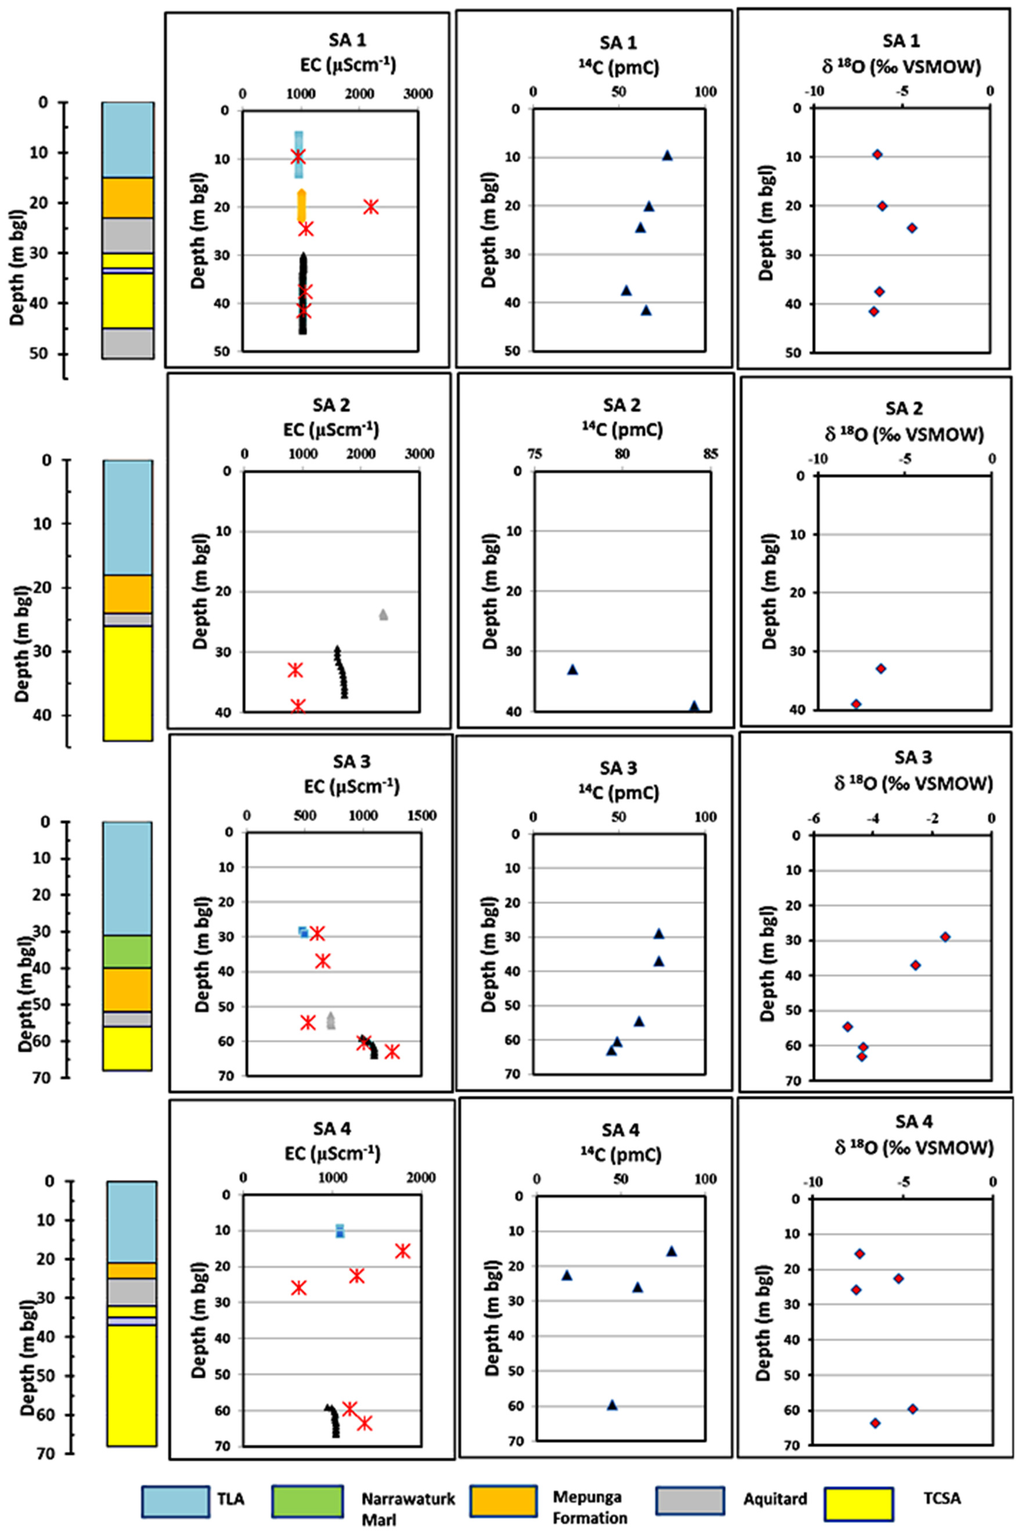
Figure 7.
Electrical Conductivity (EC), pmC and δ18O profiles for the SA sites. Red colour crosses in Panel 1 are the EC measurements made in 2011. bgl, below ground level.
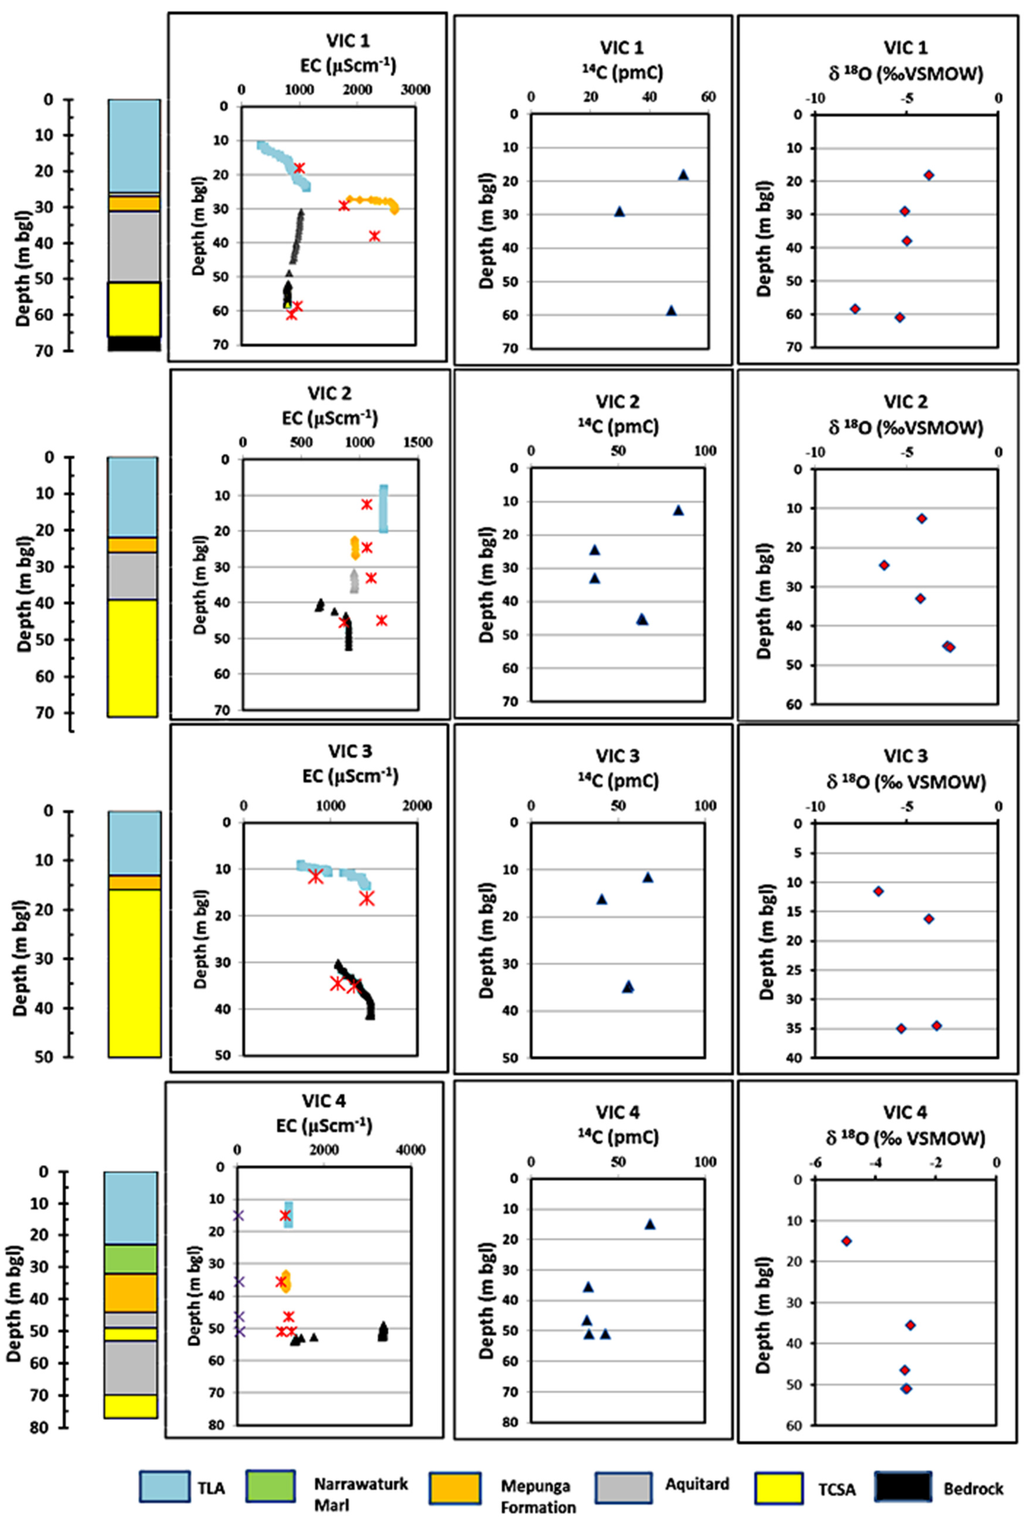
Figure 8.
EC, pmC and δ18O profiles for the VIC sites. Red colour crosses in Panel 1 are the EC measurements made in 2011.
At the SA sites, Narawarturk Marl is absent, except at SA 3, while the Dilwyn clay aquitard, which is a clay layer in the upper part of TCSA, is present at all sites. The EC profiles in SA 1 show a step-wise increase of 68 μS·cm−1 of EC from TLA to TCSA. The 14C activity by a reduction of 78 pmC in TLA to 55 pmC in TCSA reflects increasing residence time as the recharge flux flows through the profile. Enrichment of δ18O occurs in the Dilwyn clay aquitard, but depleted δ18O was found at TCSA, possibly due to TCSA receiving groundwater from preferential recharge sources. Depth to water at SA 1 is 4.8 m in TLA and 22.5 m in TCSA. At SA 2, Dilwyn clay is very thin (about 1 m); this may influence high direct recharge to TCSA. The unconfined aquifer TLA is dry at this site. At SA 2, depth to water in TCSA is approximately 23 mbgl (metres below ground level). At this site, EC is highest (1650 μS·c−1m), but 14C (77–84 pmC) and δ18O (−6.3 to −7.8 per mil) are indicative of modern high recharge into the TCSA aquifer.
Site SA 3 is located in the Nangwarry fault zone and was described by Brown et al. [14] in 2011. Depth to water occurs at 9.6 mbgl in TLA and 23 mbgl in TCSA. At SA 3, EC progressively increases from 480 μS·cm−1 at TLA to about 1090 μS·cm−1 at TCSA. Similarly, 14C is progressively reduced from 73 pmC in TLA to 45 pmC in TCSA. The presence of the 9 m-thick Narawarturk Marl at this site influences residence time as reflected in enriched δ18O (−1.57 per mil) in TLA and the aquitard, but less in TCSA (δ18O is at −4.3 per mil), indicating mixing with different waters. At this site, TCSA possibly receives both diffuse and preferential recharge. SA 4 (NAN042 in Figure 2) is also a Brown et al. [14] study site and is located adjacent the Tarpeena fault. Depth to water occurs at 6.7 and 25.7 mbgl in TLA and TCSA, respectively. EC is identical in TLA and TCSA; the highest 14C is found in TLA (80 pmC) and the lowest in the Mepunga Formation (18 pmC). The 14C is increasing again back to 59 pmC in the Dilwyn clay aquitard and to 45 pmC in TCSA, indicate recharging water bypasses the Mepunga Formation. The 14C in TCSA is about 45 pmC, probably due to mixing with older water within TCSA. However, δ18O is not as enriched as in SA 3 (−4 to −7 per mil). The presence of identical EC and δ18O suggests direct preferential recharge to TCSA.
The VIC 1 site (TLY006 in Figure 2) is north of the GNN recharge zone, but is located between two fault lines (Figure 1). At this location, depth to water occurs at 18 and 25 mbgl in TLA and TCSA, respectively. EC profiles show a gradual increase from TLA (400–1120 μS·cm−1) to the Mepunga Formation (1870–2590 μS·cm−1), then a reduction in TCSA (1020 down to 792 μS·cm−1), indicating good connection between TLA and TCSA bypassing the Mepunga Formation. Carbon-14 in TCSA is similar to the levels in TLA, indicating that recharging water from TLA bypasses the Mepunga Formation and reaches TCSA. The lowest EC occurs in TCSA at the base, and depleted δ18O (−8 to −5.3 per mil) indicates that TCSA receives direct recharge from other sources. We suggest this is from the two fault lines located nearby. At VIC 2 (TLY011 in Figure 2), progressively decreasing EC is found in the profile; 1200 μS·cm−1 in TLA (evaporation effect due to nearby wetland), 960 μS·cm−1 in the Mepunga Formation and 900 μS·cm−1 in TCSA. The highest 14C activity (85 pmC) at this site is in TLA, suggesting that TLA receives rapid recharge from surface water. The 14C in Mepunga is about 36 pmC, but increases in TCSA to 63 pmC. This suggests that TCSA receives possible preferential and diffuse recharge. Depth to water occurs at about 7 and 15 mbgl in TLA and TCSA, respectively, at VIC 2. At the VIC 3 site, the Narawarturk Marl and Dilwyn aquitard are absent, and TLA is connected to TCSA through a 3 m-thick section of the Mepunga Formation. Almost complete hydraulic connection is observed at this site, as depth to water occurs at 4.9 mbgl in TLA and 5 mbgl in TCSA. The EC, 14C and δ18O are similar, indicating direct vertical recharge. In contrast, EC profiles at VIC 4 show identical EC in TLA and the Mepunga Formation (1170 μS·cm−) compared to that in TCSA (1470–3300 μS·cm−); decreasing 14C from 68 pmC in TLA to 32–45 pmC in the Mepunga Formation and TCSA; and enriched δ18O from −5 per mil (TLA) to −3 per mil (TCSA). This indicates that the Mepunga Formation and TCSA are interconnected, bypassing the Dilwyn clay aquitard. The VIC 4 site is located at the southeastern edge of the GNN recharge zone, and stratigraphy shows a 9 m-thick Narawarturk Marl layer at this site. A head difference of 13.7 m is found at this site, as depth to water in TLA and TCSA occurs at 4.5 and 18.2 mbgl, respectively.
Brown et al. [14] used two sites, SA 3 and SA 4 in Australia, and concluded that vertical leakage to TCSA is predominantly from preferential flows. This study extended the investigation to an additional six sites and, as shown above, confirms that vertical recharge to TCSA is from both diffuse recharge and preferential flows via fractures, faults or sinkholes. Since TCSA is hydraulically connected across inferred faults and the hydraulic head is 7–19 m lower than TLA (except at VIC 3), lateral flow from TLA to TCSA is not expected.
4.4. Depth-Distribution of 222Rn and Terrigenic 4He in the Profile
222Rn, a by-product of the uranium decay series, is the direct decay product of 226Ra (half life of 1.6 × 10³ years) found in aquifer materials. In the case of 4Heterr, it is added to groundwater originating from different geochemical reservoirs, such as the Earth’s mantle or rocks of the continental crust. 4Heterr is estimated by subtracting the concentration of helium equilibrium with atmosphere at the temperature, pressure and salinity of recharge water and helium added from excess air entrainment from the total helium concentration in groundwater. Since 4Heterr is mobile and ascends from deeper strata towards the Earth’s surface, deep circulating groundwaters trap the ascending 4Heterr [34]. Hence, 4Heterr accumulation is interpreted as a different zone of restriction to groundwater movement. We use 222Rn and 4Heterr to identify the presence of preferential vertical recharge paths. Consistent with EC, 14C and δ18O profiles, 4Heterr indicates that the Mepunga Formation and Dilwyn clay aquitard at VIC 1, VIC 2 and VIC 4 show 4He accumulation occurring as aquitards act as barriers; and the lesser accumulation (Figure 9) in the Dilwyn clay aquitard at VIC 4 and the Mepunga Formation at SA 4 is from faults leakage bypassing the aquitard and the Mepunga Formation described in Section 4.3. Hence, recharge flux bypasses the Mepunga Formation and the Dilwyn clay aquitard at different locations, making a complex vertical leakage process within the GNN recharge zone.
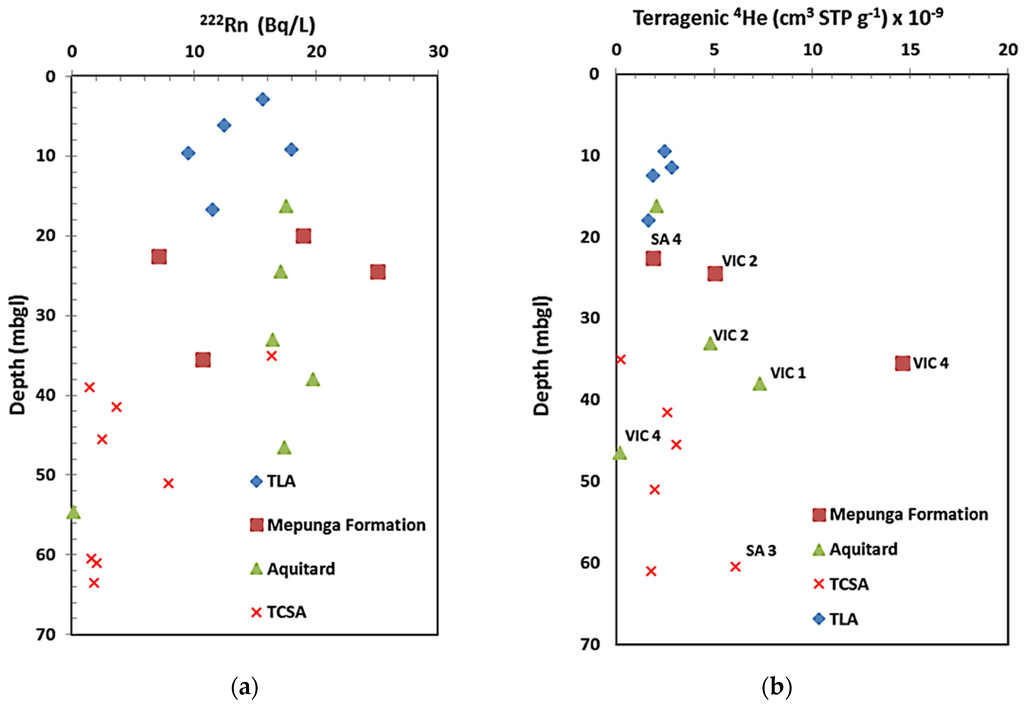
Figure 9.
Depth distribution of (a) 222Rn and (b) 4Heterr in the recharge zone.
In general, groundwater 4He concentrations may be used to identifying fracture zones in unexposed bedrock. The 4He and 222Rn migrates by diffusion and fluid transport, but 222Rn migration is limited because of its short half life of 3.82 days. 222Rn in groundwater is thus considered a local product, not far removed from its source [6]. Groundwater 4He concentration reveals that zones of fractures conduct helium from basement or overlying sedimentary layers to the surface. In this study, groundwater 222Rn activities in the GNN are less reliable indicators of fracture flow than 4Heterr concentrations. Terrigenic helium distribution supports the notion of a conceptual model of fault zone vertical leakage, as evidenced in the δ18O, 14C and EC profiles. Since the 4Heterr is added from radioactive decay in aquifer materials, mantle-derived helium and diffusive fluxes of crustal helium [5], further analysis to determine 3He/4He and U/Th ratios could help to discriminate the sources of terrigenic helium.
4.5. Influence of GNN Recharge Zone on Regional Groundwater Flow in the TCSA
Understanding the regional groundwater flow system is fundamental to the management of the TCSA. October 2014 potentiometric head contours for the TCSA, along with available 14C and chloride distribution are shown in Figure 10. Figure 10 also shows radial flow associated with the groundwater mounds from the GNN recharge zone superimposed onto the regional flow regimes across the Gambier Basin. Steep groundwater gradient zones associated with both the Kanawinka and Tartwaup fault zones are related to decreased transmissivity caused by probable displacement within the fault zones [1] or strong marl smearing. The flat hydraulic gradient zone west of Kanawinka fault zone, where KLN017 and KLN018 are located, is due to the high transmissivity of the TCSA, corresponding to increased thickness [56].
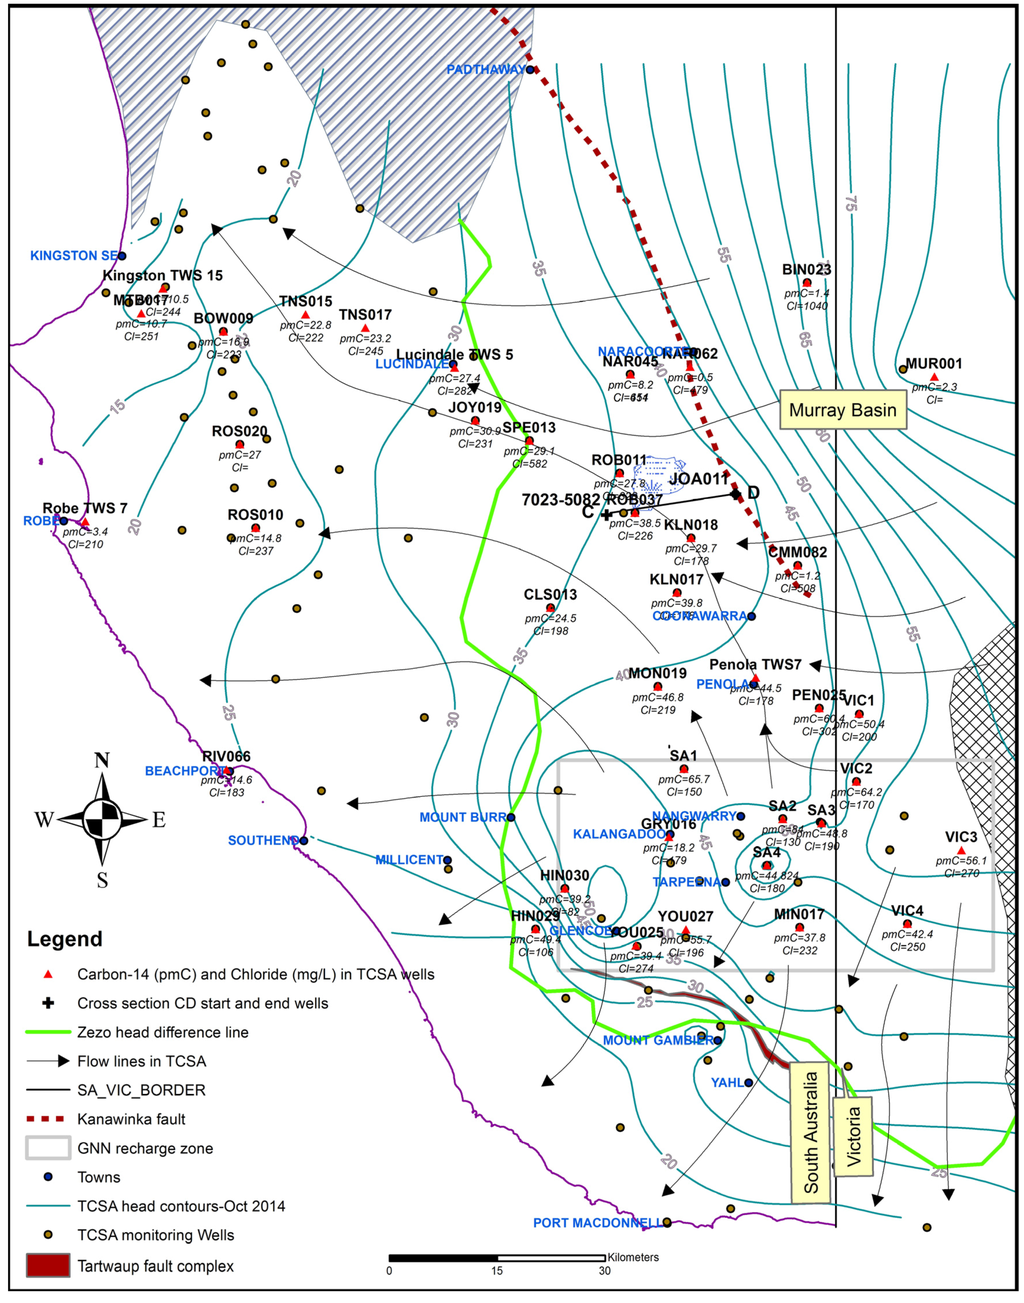
Figure 10.
Regional groundwater flow in the TCSA.
There is potential for vertical leakage to TCSA in areas east of the zero head difference line [1,13], where TCSA heads are lower than the TLA. The higher 14C is an indication of modern recharge, which gradually decreased along flow paths due to decay, as the distance from the recharge zone (and hence, residence time) increases. Values went from 49.6 ± 9.5 pmC in the GNN recharge zone to 10.7 pmC at well MTB017 located on the northwestern edge of the basin. Along the northwestern flow line in Figure 10 (SA 2 and VIC 2, PEN025, TWS 7, KLN018, ROB07, ROB011, SPE013, JOY019 and TNS017), the gradual decrease in 14C is from 64.2 pmC at VIC 2 to 23.2 pmC at TNS017. The concentrations of chloride gradually increased, along the same flow line from 170 mg·L−1 at VIC 2 to 245 mg·L−1 at TNS017.
Since TCSA in the Murray Basin is hydraulically connected to TCSA in the Gambier Basin north of the GNN recharge zone, groundwater mixing occurs in the northeastern part of the Gambier Basin. The TCSA groundwater in the Murray Basin is characterized by low radiocarbon and high chloride (Figure 10). Using groundwater chloride as a conservative tracer, mixing of chloride at the VIC 2 site in the GNN with that of the Murray Basin water in CMM082 well shows different degrees of mixing along the northwestern flow line. At KLN018 well, there is no evidence of mixing with Murray Basin water; at ROB037 and ROB011, there is about 15% and 30%, respectively, of Murray Basin water. As part of the investigation to assess inter-aquifer leakage and groundwater flow paths in the vicinity of the Bool Lagoon area, groundwater age estimation by Harrington [54] from carbon-14 measurements shows modern water in the GNN recharge zone and progressively increasing to about 3200–4600 years near Bool Lagoon (Figure 11). In a study by Lawson et al. [57], all of the known faults have been mapped (Figure 1 and Figure 10) that extend upwards from basement through the entire Tertiary sequence to ground surface [56]. Two seismic survey-based “inferred faults displacement” near Bool Lagoon area are shown in Figure 11.
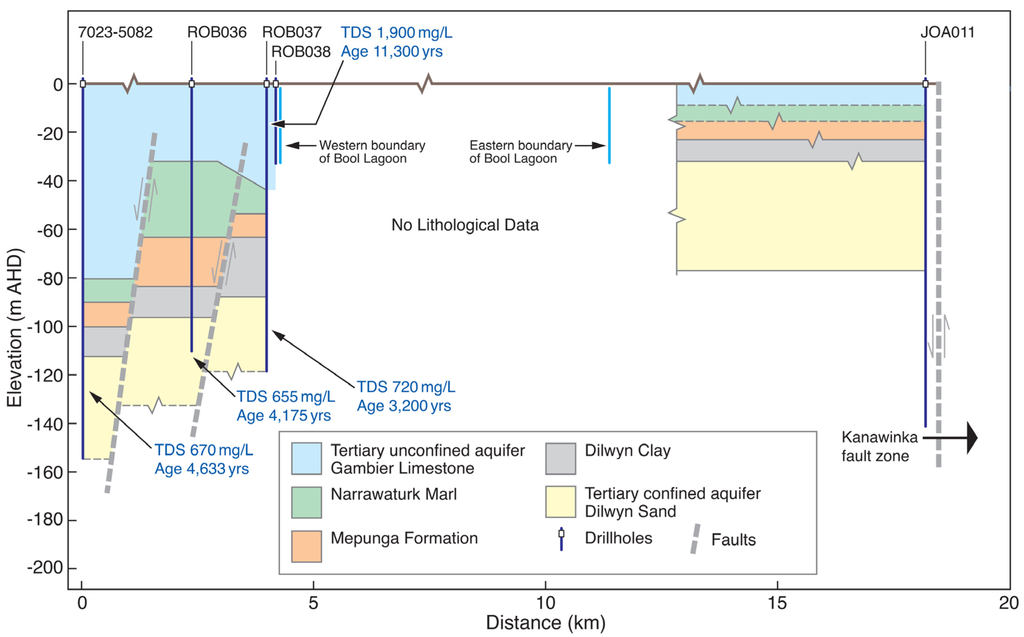
Figure 11.
Conceptual geological cross-section CD with inferred fault displacement in exaggerated vertical scale.
Despite the presence of faults, salinity, expressed in TDS (Total Dissolved Solids), and groundwater age contrast in TLA and TCSA indicate that the two groundwater systems are effectively separated by approximately a 55 m-thick combined aquitard of the Narawarturk Marl, Mepunga Formation (marl, clay and sand) and Dilwyn Formation clay. The competency of the thick aquitard to prevent the connection of the two systems is further supported by the pumping test conducted at the ROB037 well. In order to assess the aquitard for vertical leakage between TLA and TCSA aquifers, the ROB037 well was pump tested at a 50-L·s−1 rate for 72 h. The TLA monitoring well, ROB038, located 20 m from ROB037, had no drawdown response, while the TCSA monitoring well, ROB036, located 1600 m from ROB037, showed 3.89 m of drawdown [58]. This indicates vertical leakage through structural faults being more effective when the aquitard is thin or absent.
Previous studies by Love [1] and Harrington et al. [13] suggest that the role of faults on the local geology and hydrogeology extends beyond the TCSA recharge zone and may have profound impacts on water movement in TCSA. Love [1] suggests a recharge zone between Naracoorte and the zero head line near Lucindale (Figure 10) based on the gradual increase of radiocarbon activity along a flow line from Naracoorte to Lucindale. The new evidence presented above suggests a northwestern flow line originating from the GNN recharge zone as the source of transporting modern recharge water. Any potential recharge zone further north is more likely at the basin boundary close to the Padthaway ridge. The TCSA may occur at a shallow depth in this northern area and with a thin aquitard present in the fault zone; however, this has not been investigated.
5. Conclusions
Environmental isotope techniques are used to study the mode of recharge to the unconfined aquifer and the vertical leakage to the southeast confined aquifer in South Australia. Hydrochemical analysis indicates that the sources of ions in the recharge zone groundwater are derived from carbonate and silicate weathering with cation exchange. The results of the environmental isotope, supplemented by EC profiles, 14C activity, hydrochemical and lithological data, indicate that in part of the recharge zone, the shallow aquifer is in direct hydraulic connection with the confined aquifer. Higher vertical leakage to the confined aquifer is attributed to the presence of fault structures in the recharge zone. This is effective where the aquitard is thin or absent. Regardless of plantation forests in the study area, we show that the interconnection of unconfined TLA with the TCSA is both by diffuse and preferential recharge. Thus, the application of conventional recharge estimation methods to the confined aquifer using the Darcy equation or tracer techniques is inappropriate. These findings improve the current understanding of how recharge to the confined aquifer takes place and help to develop a conceptual model for recharge estimation. In addition, this work highlights the value of further investigations in the Glencoe area to determine the recharge process to the confined aquifer for the benefit of groundwater management for agricultural, industrial and municipal water use. Regional groundwater flow regimes in the TCSA are controlled by the presence of groundwater mounds in the GNN recharge zone. From the recharge zone, groundwater flows from northwestern to southern directions. This highlights the need for assessing vertical leakage to the TCSA and the importance of maintaining or improving the recharge in the GNN recharge zone.
Acknowledgments
We thank Glyn Ashman for the manuscript review. Constructive comments provided by the academic editor and three anonymous reviewers are gratefully acknowledged, as they helped in improving the original manuscript to the final version. Funding for the 2011 investigation was received from the Australian Government through the National Water Commission under the Raising National Water Standards Program, and the 2013–2015 investigation program was funded by the South Australian Water Corporation under the Bool Lagoon Wellfield Investigation Project.
Author Contributions
This study was designed and conceived of by Nara Somaratne as part of the Bool Lagoon wellfield investigation study. Somaratne analysed and interpreted the data and wrote the first draft of the paper. Saad Mustafa collected water and noble gas samples for analysis in 2011 and carried out additional data interpretation and water sampling for carbon-14 analyses in 2015. Jeff Lawson contributed to the hydrogeology component of the study. All authors contributed equally to EC logging and revision of the original manuscript.
Conflicts of Interest
The authors declare no conflict of interest.
References
- Love, A.J. Groundwater Flow Systems: Past and Present, Gambier Embayment, Otway Basin, South Australia. Master’s Thesis, Flinders University of South Australia, Adelaide, Australia, October 1991; p. 261. [Google Scholar]
- Banwell, G.M.; Parizek, R.R. Helium 4 and Radon 222 concentrations in groundwater and soil gas indicators of zones of fracture concentrations in unexposed rock. J. Geophys. Res. 1988, 91, 355–366. [Google Scholar]
- Sukhija, B.S.; Reddy, D.V.; Nagabhushanam, P.; Hussain, S.; Giri, V.Y.; Patil, D.J. Environmental and injected tracers methodology to estimate direct precipitation recharge to a confined aquifer. J. Hydrol. 1996, 177, 77–97. [Google Scholar] [CrossRef]
- Agarwal, M.; Gupta, S.K.; Deshpande, R.D.; Yadava, M.G. Helium, radon and radiocarbon studies on a regional aquifer system of the North Gujarat-Cambay region, India. Chem. Geol. 2006, 228, 209–232. [Google Scholar] [CrossRef]
- Gardner, W.P.; Harrington, G.A.; Solomon, D.K.; Cook, P.G. Using terrigenic 4He to identify and quantify regional groundwater discharge to streams. Water Resour. Res. 2011, 47. [Google Scholar] [CrossRef]
- Choi, B.Y.; Yun, S.K.; Mayer, B.; Chae, G.T.; Kim, K.H.; Kim, K.; Koh, Y.K. Identification of groundwater recharge sources and processes in a heterogeneous alluvial aquifer: Results from multi-level monitoring of hydrochemistry and environmental isotopes in a riverside agricultural area in Korea. Hydrol. Process. 2010, 24, 317–330. [Google Scholar] [CrossRef]
- Gumm, L.P.; Bense, V.F.; Dennis, P.F.; Hiscock, K.M.; Cremer, N.; Simon, S. Dissolved noble gases and stable isotopes as tracers of preferential fluid flow along faults in the Lower Rhine Embayment, Germany. Hydrogeol. J. 2016, 24, 99–108. [Google Scholar] [CrossRef]
- Wood, C.; Cook, P.G.; Harrington, G.A. Vertical carbon-14 profiles for resolving spatial variability in recharge in arid environments. J. Hydrol. 2015, 520, 134–142. [Google Scholar] [CrossRef]
- Holmes, J.W.; Colville, J.S. Grassland hydrology in a karstic region of South Australia. J. Hydrol. 1970, 10, 38–58. [Google Scholar] [CrossRef]
- Colville, J.S.; Holmes, J.W. Water table fluctuations under forest and pasture in a karstic region of Southern Australia. J. Hydrol. 1972, 17, 61–80. [Google Scholar] [CrossRef]
- Allison, G.B.; Hughes, M.W. The use of environmental chloride and tritium to estimate total recharge to an unconfined aquifer. Aust. J. Soil Res. 1978, 16, 181–195. [Google Scholar] [CrossRef]
- Leaney, F.W.; Herczeg, A.L. Regional recharge to a karst aquifer estimated from chemical and isotopic composition of diffuse and localised recharge, South Australia. J. Hydrol. 1995, 164, 363–387. [Google Scholar] [CrossRef]
- Harrington, G.A.; Walker, G.R.; Love, A.J.; Narayan, K.A. A compartmental mixing-cell approach for the quantitative assessment of groundwater dynamics in the Otway Basin, South Australia. J. Hydrol. 1999, 214, 49–63. [Google Scholar] [CrossRef]
- Brown, K.G.; Love, A.J.; Harrington, G.A. Vertical Groundwater Recharge to the Tertiary Confined Sand Aquifer, South East, South Australia; Report DWR 2001/002; Department for Water Resources: Adelaide, Australia, 2001.
- Holmes, J.W.; Waterhouse, J.D. Hydrogeology. In Natural History of the South East; Tyler, M.J., Twidale, I.R., Ling, J.K., Holmes, J.W., Eds.; Adelaide Royal Society of South Australia: Adelaide, Australia, 1983; pp. 48–59. [Google Scholar]
- Drexel, J.F.; Preiss, W.V. (Eds.) The Geology of South Australia; The Phanerozoic: Adelaide, Australia, 1995; Volume 2.
- Harrington, N.M.; Chambers, K.; Lawson, J. Primary Production to Mitigate Water Quality Threats Project, Zone 1A Numerical Modelling Study: Conceptual Model Development; DWLBC Report 2008/12; Government of South Australia through Department of Water, Land and Biodiversity Conservation: Adelaide, Australia, 2007.
- Li, Q.; McGowran, B.; White, M.R. Sequences and biofacies packages in Mid-Cenozoic Gambier Limestone, South Australia; repraisal of foraminiferal evidence. Aust. J. Earth Sci. 2000, 47, 955–970. [Google Scholar] [CrossRef]
- Waterhouse, J.D. The Hydrogeology of the Mount Gambier Area; Report of Investigation; Geological Survey of South Australia: Adelaide, Australia, 1977; p. 48.
- Mustafa, S.; Lawson, J. South Australia-Victoria Border Zone Groundwater Investigation: Results of the Pumping Test Program; DFW Technical Report 2011/23; Government of South Australia, through Department for Water: Adelaide, Australia, 2011.
- Sinclair Knight Merz (SKM). SA-Vic Border Zone Groundwater Investigation. Interaction between the TLA and TCSA; SKM: Melbourne, Australia, 2012. [Google Scholar]
- Vail, J. Groundwater Sampling; SESDRPROC-301-R3; U.S. Environmental Protection Agency, Science and Ecosystem Support Division: Athens, GA, USA, 2011.
- Australia/New Zealand Standard. Water Quality Sampling-Guidance on the Design of Sampling Programs, Sampling Techniques and the Preservation and Handling of Samples; AS/NZS 5667.5; Australia/New Zealand Standard: Homebush, Australia, 1998. [Google Scholar]
- American Public Health Association. APHA/AWWA/WEF Method 3120B. In Standard Methods for the Examination of Water and Wastewater, 20th ed.; American Public Health Association: Washington, DC, USA, 1999. [Google Scholar]
- American Public Health Association. APHA/AWWA/WEF Method 4500. In Standard Methods for the Examination of Water and Wastewater, 22nd ed.; American Public Health Association: Washington, DC, USA, 2012. [Google Scholar]
- American Public Health Association. APHA/AWWA/WEF Method 2320. In Standard Methods for the Examination of Water and Wastewater, 22nd ed.; American Public Health Association: Washington, DC, USA, 2012. [Google Scholar]
- Epstein, S.; Mayeda, T.K. Variation of the 18O/16O ratio in natural waters. Geochim. Cosmochim. Acta 1953, 4, 213–224. [Google Scholar] [CrossRef]
- PDZ Europa Ltd. 20-20 ANCA-GSL User Manual, version 4.0; PDZ Europa Ltd.: Sandbach, UK, 2001; p. 8. [Google Scholar]
- Fallon, S.J.; Fified, L.K.; Chappel, J.M. The Next Chapter in Radiocarbon Dating at the Australian National University: Status Report on the Single Stage AMS; Nuclear Instruments and Methods in Physics Research B268898-901; Australian National University: Canberra, Australia, 2010; pp. 898–901. [Google Scholar]
- Gardner, P.; Solomon, D.K. An advanced passive diffusion sampler for the determination of dissolved gas concentration. Water Resour. Res. 2009, 45. [Google Scholar] [CrossRef]
- Leaney, F.W.; Herczeg, A.L. A rapid field extraction method for determination of radon-222 in natural waters by liquid scintillation counting. Limnol. Oceanogr. Methods 2006, 4, 254–259. [Google Scholar] [CrossRef]
- Poole, J.C.; McNeill, G.W.; Langman, S.R.; Dennis, F. Analysis of noble gases in water using a quadrupole mass spectrometer in static mode. Appl. Geochem. 1997, 12, 707–714. [Google Scholar] [CrossRef]
- Heaton, T.H.E.; Vogel, J.C. “Excess air” in groundwater. J. Hydrol. 1981, 50, 201–216. [Google Scholar] [CrossRef]
- Kipfer, R.; Aeschbach-Hertig, W.; Peeters, F.; Stute, M. Noble gas in Lakes and Groundwaters. Rev. Miner. Geochem. 2002, 47, 615–700. [Google Scholar] [CrossRef]
- YSI Incorporated. Environmental Monitoring Systems Operations Manual. Available online: http://wenku.baidu.com/view/d785b92058fb770bf78a55ca.html (accessed on 3 September 2014).
- Craig, H. Isotopic variation in meteoric waters. Science 1961, 133, 1702–1703. [Google Scholar] [CrossRef] [PubMed]
- Abdalla, O.A.E. Groundwater recharge/discharge in semi-arid regions interpreted from isotope and chloride concentrations in north White Nile Rift, Sudan. Hydrogeol. J. 2009, 17, 679–692. [Google Scholar] [CrossRef]
- Van der Akker, J. The Use of Stable Isotopes and Chloride to Assess Evaporation and Transpiration Impacts from Flood Irrigation. Master’s Thesis, School of Environment, Flinders University, Adelaide, Australia, 10 September 2010. [Google Scholar]
- Custodio, E. Hydrogeochemistry and tracers. In Groundwater Problems in Coastal Areas (Studies and Reports in Hydrology); Custodio, E., Brugeman, G.A., Eds.; United Nations Educational, Scientific and Cultural Organization: Paris, France, 1987; pp. 213–269. [Google Scholar]
- Liu, F.; Song, X.; Yang, L.; Zhang, Y.; Ma, Y.; Bu, H. Identifying the origin and geochemical evolution of groundwater using hydrochemistry and stable isotopes in the Subei Lake basin, Ordos energy base, Northwestern China. Hydrol. Earth Syst. Sci. 2015, 19, 551–565. [Google Scholar] [CrossRef]
- Gibbs, R.J. Mechanism controlling world water chemistry. Sciences 1970, 170, 795–840. [Google Scholar] [CrossRef] [PubMed]
- Williams, A.E.; Rodoni, D.P. Regional isotope effects and application to hydrologic investigations in southwestern California. Water Resour. Res. 1997, 37, 1721–1729. [Google Scholar] [CrossRef]
- Atkinson, A.P.; Cartwright, I.; Gilfedder, D.I.; Unland, N.P.; Hofmann, H. Using 14C and 3H to understand groundwater flow and recharge in an aquifer window. Hydrol. Earth Syst. Sci. 2014, 18, 4951–964. [Google Scholar] [CrossRef]
- Karnath, K.B. Groundwater Assessment, Development and Management; McGraw-Hill Publishers: New Delhi, India, 1997. [Google Scholar]
- Bhatt, K.B.; Salakani, S. Hydrogeochemistry of the upper Ganges River, India. J. Geol. Soc. India 1996, 48, 171–182. [Google Scholar]
- Chae, G.T.; Yun, S.K.; Kim, K.; Mayer, B. Hydrochemistry of sodium-bicarbonate type bedrock groundwater in the Pochen spa area, South Korea: Water-rock interaction and hydrologic mixing. J. Hydrol. 2006, 321, 326–343. [Google Scholar] [CrossRef]
- Krishnaraj, S.; Murugesan, V.; Vijayaraghavan, K.; Sabarathnam, C.; Paluchamy, A.; Ramachandran, M. Use of hydrochemistry and stable isotopes as tools for groundwater evolution and contamination investigations. Geosciences 2011, 1, 16–25. [Google Scholar] [CrossRef]
- McLean, W.; Jankowski, J.; Lavitt, N. Groundwater quality and sustainability in an alluvial aquifer, Australia. In Groundwater: Past Achievements and Future Challenges; Sililo, O., Ed.; A Balkema: Rotterdam, The Netherlands, 2000; pp. 567–573. [Google Scholar]
- Stallard, R.F.; Edmond, J.M. Geochemistry of the Amazon 2. The influence of geology and weathering environment on the dissolved load. J. Geophys. Res. 1983, 88, 9671–9688. [Google Scholar] [CrossRef]
- Zaidi, F.K.; Nazzai, Y.; Jafri, M.K.; Ahmed, I. Reverse ion exchange as a major process controlling the groundwater chemistry in an arid environment: A case study from northwestern Saudi Arabia. Environ Monit. Asses. 2015, 187. [Google Scholar] [CrossRef] [PubMed]
- BETA Radiocarbon Dating. Radiocarbon Dating of Groundwater-Practical Applications. Beta Analytic Inc.: Miami, FL, USA. Available online: http://www.radiocarbon.com/PDF/Groundwater%20Radiocarbon%20Dating%20Practical%20Applications.pdf (accessed on 1 March 2016).
- Tamers, M.A. Validity of radiocarbon dates on groundwater. Geophys. Surv. 1975, 2, 217–239. [Google Scholar] [CrossRef]
- Wassenar, L.; Aravena, R.; Hendry, J.; Fritz, P. Radiocarbon in dissolved organic carbon, a poosible groundwater dating method: Case studies from Western Canada. Water Resour. Res. 1991, 27, 1975–1986. [Google Scholar] [CrossRef]
- Harrington, G.A. Bool Lagoon Wellfield Investigation, Groundwater Chemistry Assessment; A Report Prepared for SA Water Corporation; Innovative Groundwater Solution: Blackwood, Australia, 2015. [Google Scholar]
- Love, A.J.; Herczeg, A.L.; Leaney, F.W.; Stadter, M.F.; Dighton, J.C.; Armstrong, D. Groundwater residence time and palaeohydrology in the Otway Basin, South Australia: 2H, 18O and 14C data. J. Hydr. 1994, 153, 157–187. [Google Scholar] [CrossRef]
- Lawson, J. A Stratigraphic and Hydrogeological Investigation of an Area between Nangwarry and Naracoorte, South Australia; Technical Report; South Australian Department of Environment, Water and Natural Resources: Adelaide, Australia, 2015; p. 47.
- Lawson, J.; Mustafa, S.; Wood, C. Field Investigations into the Influence of Faulting on the Groundwater Flow and Recharge of the Tertiary Limestone Aquifer, Lower South East, South Australia; Draft Report; South Australian Department of Water, Land and Biodiversity Conservation: Adelaide, Australia, 2009.
- Lawson, J.; Howles, S. Investigative Drilling, Aquifer and Groundwater Salinity Testing-Naracoorte Water Supply; Technical Report 2015/03; Bool Lagoon Investigation Department of Environment, Water and Natural Resources: Adelaide, Australia, 2015; p. 108.
© 2016 by the authors; licensee MDPI, Basel, Switzerland. This article is an open access article distributed under the terms and conditions of the Creative Commons Attribution (CC-BY) license (http://creativecommons.org/licenses/by/4.0/).