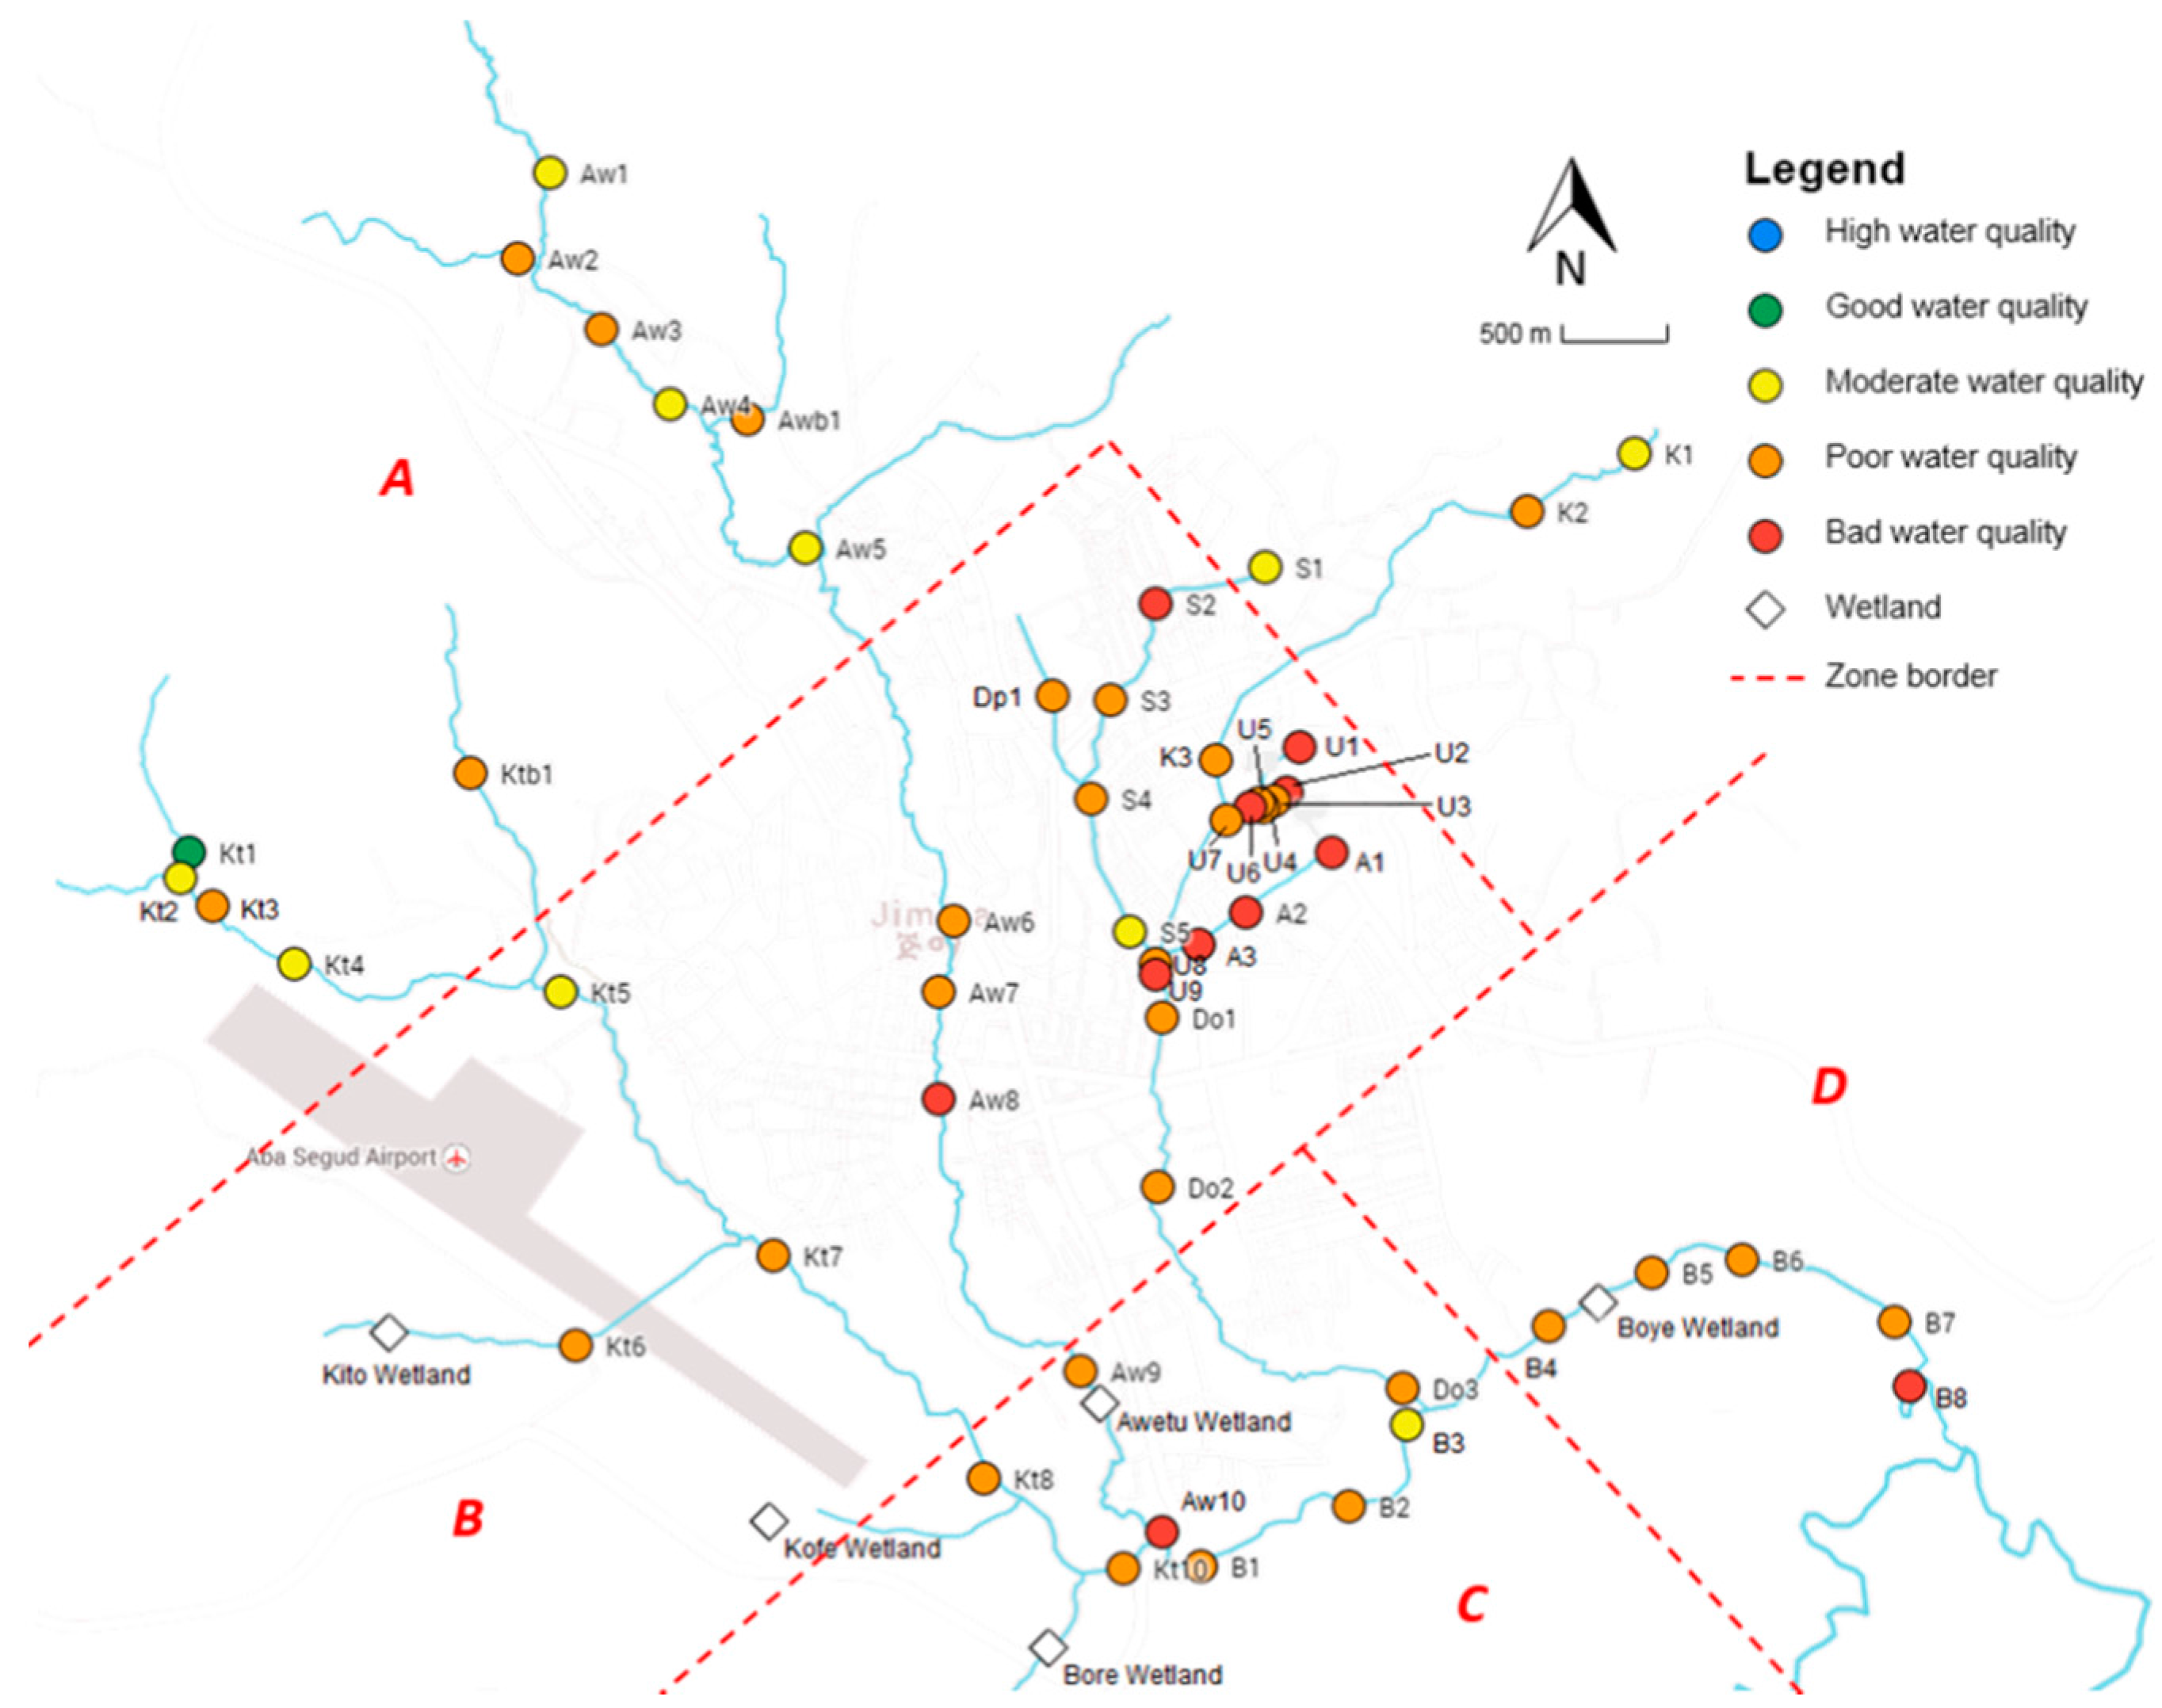
Article

Water Quality Assessment of Streams and Wetlands in a Fast Growing East African City

1
Laboratory of Environmental Toxicology and Aquatic Ecology, Ghent University, J. Plateaustraat 22, 9000 Ghent, Belgium
2
Department of Environmental Health Science and Technology, Jimma University, P.O. Box 378, Jimma, Ethiopia
3
Provincial Centre of Environmental Research, Godshuizenlaan 95, 9000 Ghent, Belgium
*
Author to whom correspondence should be addressed.
Water 2016, 8(4), 123; https://doi.org/10.3390/w8040123
Submission received: 20 January 2016 / Revised: 14 March 2016 / Accepted: 18 March 2016 / Published: 29 March 2016

Abstract

:
The combination of rapid urbanization, industrialization, population growth, and low environmental awareness poses a major threat to worldwide valuable freshwater resources, which provide important ecosystem services to humans. There is an urgent need to monitor and assess these resources, as this information is indispensable for sustainable decision-making and management. In this context, we analyzed the chemical and ecological water quality of the riverine environment of a fast growing city in Southwest Ethiopia for which we proposed possible remediation options that were evaluated with an empirical model. The chemical and ecological water quality was assessed at 53 sampling locations using the oxygen Prati index and the ETHbios, which is a biotic index based on macroinvertebrates. In addition, a microbiological analysis was performed to estimate the degree of fecal contamination. Finally, we analyzed the relationship between the oxygen content and the organic pollution to simulate the effect of organics removal from waste streams on the chemical water quality. Our results showed that the average values for dissolved oxygen (4.2 mg DO·L−1) and nutrients (0.9 mg oPO43−·L−1 and 12.8 mg TAN·L−1) exceeded international standards. Moreover, high turbidity levels revealed that land erosion is a severe problem in the region. Along the rivers, a significant increase in oxygen consumption and in nutrient concentrations was observed, indicating organic pollution originating from different diffuse and point sources of pollution. The lack of proper sanitation also led to exceedingly high abundances of fecal coliforms in the surface water (>320 MPN·mL−1). However, fecal contamination was strongly reduced (>92%) after the polluted river water passed Boye wetland, indicating the purification potential of natural wetlands and the importance of conserving and protecting those ecosystems. The simulation results of the model showed that water quality could be substantially improved if municipal, industrial, and institutional wastewater was efficiently collected and transported to a treatment facility. Waste stabilization ponds and constructed wetlands are highly promising techniques, as they provide a cheap, effective, reliable, and sustainable way to purify wastewater. It is advised that the environmental awareness of the people via sensitization, education, and law enforcement is increased, as this is essential for sustainable development.

1. Introduction

Fresh water is a vital resource for people all around the world and provides many provisioning (e.g., water for consumptive use), regulatory (e.g., buffering of flood flows), and cultural (e.g., recreation) ecosystem services [1]. It is consequently imperative that clean water can be easily accessed. However, the lack of sanitation and water scarcity remain important global issues affecting public health, particularly in developing countries [2]. Sub-Saharan Africa is characterized by one of the highest numbers of people that do not have access to clean water (319 million people in 2015) or sanitation (695 million people in 2015) [3]. Additionally, many African cities experience rapid urbanization, industrialization, uncontrolled population growth, and poor infrastructure, exacerbating these issues [4].
Ethiopia, situated in the horn of Africa, is confronted with poor sanitation and drinking water infrastructure. Beyene et al. [5] revealed that 52.1% of the population used unimproved sanitation facilities in 2014, of which 35.6% practiced open defecation. The relative high poverty status of Ethiopia is related to these problems. In 2011, 31% of the population lived below a poverty line of US $1.25 per day, mainly due to the low rate of sanitation [6]. The rapid urbanization of different Ethiopian cities demands an improvement in urban sanitation. Jimma city is one of the larger cities in Southwest Ethiopia where there is low environmental awareness and poor waste management, such as the lack of waste treatment systems and a properly planned waste disposal system. Consequently, solid and liquid waste is indiscriminately discharged in the city’s waterways, resulting in environmental pollution and human health risks [7].
Monitoring water quality is essential to determine the water quality status and to improve the environmental conditions and the related public health. Therefore, the first objective of this study was to assess the chemical water quality of the rivers and wetlands in and around Jimma city, which was used as an example case study for fast growing mid-sized cities in Eastern Africa. After that, the ecological water quality was determined by sampling the macroinvertebrate community. Macroinvertebrates have proven to be useful bio-indicators to determine the status of freshwater ecosystems, as their community consists of a broad range of species with different tolerances to water pollution [8]. Additionally, macroinvertebrates (1) respond very rapidly to pollution, (2) are ubiquitous, abundant and easy to collect, (3) are a representation of the local conditions due to their relative sedentary behavior, and (4) have long live spans which provide an integrated record of water quality [9]. A final objective of this study is an evaluation of remediation possibilities to improve the water quality, as there is a need for sanitation infrastructure in the city of Jimma. Holguin-Gonzalez et al. [10] developed an integrated ecological modeling framework (IEMF), which was used for scenario-based analysis for enhancement of the water quality of the river Drava (Croatia) in Europe. They concluded that the removal of organics and nutrients via a wastewater treatment plant (WWTP) and the remediation of point sources and diffuse sources are essential to achieve better water quality. Therefore, in this study we examined the effect of connecting 10%, 30%, 50%, and 80% of wastewater to the sewer that goes, afterwards, to a constructed wetland (80% organics removal) or a waste stabilization pond (90% organics removal) before being discharged into the rivers and wetlands.

2. Materials and Methods

2.1. Study Area

Jimma is located 350 km southwest of Addis Ababa (7°41′ N, 36°50′ E) at an average altitude of 1780 m above sea level and is characterized by a temperate rainy climate with a warm summer [11]. The city has a population density of about 3521 persons·km−1 in 2015 and an average population growth rate of 4.9% per year [12]. East African cities like Addis Ababa, Nairobi, and Mombasa have higher population levels and lower population growth rates. Jimma is therefore considered as a fast growing mid-sized East African city, similar to the Ethiopian cities Nekemte and Shashemene.
There are two major rivers flowing through the city: Awetu, which bisects the centre of the city and Kito, which flows at the western end. At the eastern part of Jimma, some smaller rivers (Dipo, Seto, Kochi, University Stream, Aramaic, and Dololo) are present. South of Jimma, these rivers merge together and flow into Boye wetland, a large waterbody covered by vegetation. This was initially a pond but became overgrown by vegetation due to eutrophication [13]. Eventually, the water from Boye ends up in the Gilgel Gibe river below the intake point of the water treatment plant of Jimma [4]. The rivers are bordered by wetlands, which harbor a high diversity of foraging and breeding birds [8]. The discharge of untreated domestic, industrial, and instutional wastewater, the disposal of solid waste, drainage, farming, clay mining, removal of riparian vegetation, and intensive livestock grazing threaten these valuable freshwater ecosystems [7,8]. Jimma city and its rivers are shown in Figure 1, illustrated with photographs of four different river areas and their anthropogenic impacts.
The rivers of Jimma are fairly small in comparison with, e.g., the Omo river and the Blue Nile. Consequently, the results of the water quality assessment conducted in this study are relevant for small rivers exposed to high anthropogenic pressures. Such rivers are also found in Nekemte (e.g., Boke, Asa-Irbata, Jato, and Chalalaka river) and Shashemene (e.g., Laftu, Melka, Oda, and Issa river). As in Jimma, the rivers of Shashemene are threatened by solid and liquid waste disposal, poor sanitation, and little environmental awareness [14].

2.2. Sampling and Monitoring Methods

It was suspected that the water quality would decrease from source to mouth due to increasing anthropogenic pressure and that it would improve after passing Boye wetland, as natural wetlands have proven to reduce organics and nutrient loadings [15]. Therefore, we divided the study area into upstream, midstream, downstream, and recovery zones (respectively A, B, C, and D). Sampling points were selected based on accessibility and the presence of point sources and diffuse sources of pollution. A total of 53 samples was collected in and around Jimma from 6 March 2015 to 24 March 2015 (dry season) of which 12 were located in Zone A, 27 in Zone B, 9 in Zone C, and 5 in Zone D (Figure 2). The river water quality during dry season was assumed to be worse than in the wet season due to lower water availability for dilution leading to higher concentrations of organics and nutrients and lower oxygen levels [16].
Zone A included the upstream areas of the rivers Kito, Awetu, Kochi, and Seto and was mainly characterized by small-scaled agriculture and cattle grazing. Runoff from land was therefore expected to be the major source of pollution. Additionally, the recently constructed, but poorly operating, waste stabilization pond of the technology campus of Jimma University (WSPJU, Figure 3) and the newly built slaughterhouse (Snew, near Aw2) were investigated as potential point sources of pollution.
The midstream reaches (Zone B) were subjected to high anthropogenic impacts, as these were situated in the urban area. Untreated wastewater and solid waste were indiscrimately discharged on land and in Jimma’s waterways. The main campus of Jimma University (JU), which mainly discharged its wastewater in the river Aramaic (at location A1), the prison of Jimma (between S1 and S2), and a dry coffee processing plant (CP, between Aw6 and Aw7) were considered to have a negative effect on the water quality of Awetu. The rivers from Zones A and B merge together in Zone C, where the main human activity is agriculture. Finally, Zone D refers to the area around the highly eutrophied Boye wetland.
To determine the water quality, chemical and biological samples were taken at each sampling location. Temperature, dissolved oxygen (DO), pH, electrical conductivity (EC), total dissolved solids (TDS), and turbidity were measured on site using a HI 98290 multiparameter meter with a HI 7639829/10 probe (HANNA Instruments, Woonsocket, RI, USA). The probe was gently stirred in a 5-L bucket filled with river water for at least 40 seconds. The amount of chlorophyll a was measured spectrophotometrically with an AquaFluor Handheld Fluorometer/Turbidimeter (Turner Designs, Sunnyvale, CA, USA). The determination of the concentration of total suspended solids (TSS), chemical oxygen demand (COD), total nitrogen (TN), nitrate (NO3), total ammoniacal nitrogen (TAN), total phosphorous (TP), orthophosphate (oPO43−), and chloride (Cl) was done in the laboratory. Therefore, 1 L of water was sampled at every sampling location with a thoroughly cleaned HDPE bottle. These samples were transported cool and dark to the lab where they were stored at 4 °C. Hach Lange cuvette tests were used for measuring total nitrogen (TN), total phosphorous (TP) and the chemical oxygen demand (COD) while TSS, oPO43−, Cl, NO3, and TAN were determined according to the America Public Health Association (APHA) standard methods from 1999 for the examination of water and wastewater [17]. For every location, we calculated the ammonia levels based on the TAN and pH measurements, as this is more relevant regarding ecotoxicity than TAN [18]. As 80% of the values for COD and 88% of the values for TN and TP were outside the detection range of the chemical tests, these variables were only used as indicative values for the assessment of the chemical water quality. The biological analysis consisted of two parts. Firstly, the abundance of fecal and total coliforms was determined to have an idea about the contamination of the river with fecal matter, which can be seen as a threat to human health. The monitored sites served as a reference for the different zones and consisted of three upstream areas (Kt1, K1, and Aw2), six locations that were expected to be polluted (Aw6, Kt7, U1, U7, U9, and A1), and three downstream sites (DO3, B1, and A1). At each location, a water sample of 300 mL was collected in a sterile glass bottle. Afterwards, the samples were transported cool and dark to the laboratory within four hours where they were stored at 4 °C. When samples were processed, they were firstly diluted with a sterilized physiological solution (0.85% NaCl) under sterile conditions and afterwards added to a 34.51 g·L−1 autoclaved MacConkey Broth medium. The inoculated test tubes were incubated at 36 °C and 44 °C for the determination of the total and fecal coliforms, respectively. After 24 h to 48 h, the coliforms were counted using the most probable number (MPN) method [19]. Secondly, the macroinvertebrate community was sampled at all 53 stations, as this reflects the (ecological) water quality. The sampling was realized via a 10-minute kick-sampling technique with a rectangular kicking net (20 × 30 cm) with a mesh size of 300 μm over a distance of 10 m [20]. The organisms were sorted in the field and stored into labeled vials with an 80% ethanol solution. Afterwards, they were transferred to the lab for identification to family level using a stereomicroscope (10× and 20× magnification) and the identification keys of Bouchard [21], McCafferty [22], and Tachet [23].

2.3. Data Analysis

Firstly, the chemical water quality was evaluated via the percentage of dissolved oxygen by calculating the oxygen Prati index. After that, the recently developed Ethiopian Biological Score index (ETHbios) was determined to assess the ecological water quality. ETHbios is a rapid, inexpensive, but scientifically sound monitoring method similar to the Biological Monitoring Working Party (BMWP) index, but excludes taxa that do not occur in Ethiopia and includes some endemic species. Such an area-specific index has been developed in a similar way for other African countries and is thus comparable to ETHbios (e.g., the Namibian Scoring System for Namibia, the Okavango Assessment System for Botswana, and the South African Scoring System for South Africa). To calculate ETHbios each family is assigned a tolerance score, which is based on the literature, and the summation leads to an index value [24]. The resulting score of both indices were ascribed to a certain color class (Table 1). Additionally, the average score per taxon (ASPT), which is the average sensitivity of the families of the present organisms, was calculated by dividing the index scores by the number of taxa.
Secondly, statistical analysis was performed with the IBM SPSS statistics 22 software to detect significant differences between the different zones for every measured variable. The hypothesis of normality was verified via the Shapiro-Wilk W test, which provides better power than the Lilliefors corrected Kolmogorov-Smirnoff test [25]. As the condition of normality was not met for at least one zonal distribution (A, B, C, or D) per variable, we analyzed the data with the Kruskall Wallis H test combined with a post hoc pairwise comparison. All tests were evaluated at the 5% significance level.
Thirdly, chemical and biological water quality was expected to respond to environmental changes, such as nutrient enrichment, oxygen and food availability, and changes in habitat structure. Possible relationships between chemical variables and biological variables were explored via a Canonical Correspondence Analysis (CCA) plot that was developed with the BiodiversityR package in R [26]. Only taxa that included more than 4 individuals were used in the analysis. Additionally, the correlation between chemical variables was a priori analyzed in R via the Pearson correlation coefficient. For highly correlated variables that gave similar information, only one was retained for CCA.
Regarding restoration options, the beneficial effect of the implementation of sewerage/wastewater treatment plant (WWTP) systems on the water quality of Jimma’s rivers was analyzed. The proposed treatment options were a waste stabilization pond (WSP) and a constructed wetland (CW). In contrast to a conventional activated sludge system (CAS), these installations are less expensive to construct, to operate, and to maintain and show relative high removal efficiencies, making them attractive alternatives for developing countries [27]. Additionally, tropical areas provide optimum climate conditions for their operation [28]. In the WWTP, only a reduction in biological oxygen demand (BOD5) was assumed. The BOD5 removal efficiency of a CW was set to 80%, which was based on the study of Haddis [29], who investigated the removal performance of organics and nutrients from Jimma University wastewater of a CW planted with Cyperus papyrus (papyrus) and Scirpus validus (bulrush) on a pilot scale. Based on the research of Mburu et al. [27], the concentration of BOD5 was assumed to reduce with 90% in the WSP. For each treatment system, the effect of different sewerage connections on the chemical water quality was analyzed. The optimal scenario was based on that of Flanders (Belgium), where approximately 80% of the population is connected to the sewerage/WWTP system [30]. The other scenarios included a 10%, 30%, and 50% sewerage connection which was the situation in 2010 for Somalia, Namibia, and South Africa, respectively [31]. Table 2 summarizes the eight scenarios.
Additionally, we analyzed the effect on the chemical water quality if these WWTPs were used to treat the effluent of different potential point sources of pollution. The total amount of BOD5 that ends up in the river after purification is shown in Equation (1). It was suspected that BOD5 was directly negatively proportional to the percentage of DO (Equation (2)). As no BOD5 data were available in this research, data from Haddis et al. [4], who analyzed chemical water quality in the same rivers in Jimma as in this study, were used to investigate the relationship between these two variables. However, the resulting empirical model could not be tested with independent data; therefore, the results of this analysis should be considered hypothetical. The new percentage of DO could be calculated with Equation (3), which resulted from the combination of Equation (1) and Equation (2). Finally, the oxygen Prati index and the associated quality classes were recalculated with the new level of DO to make an estimation of the possible positive influence of organics removal on the chemical water quality.
B O D 5 , n e w = ( 1 α ε )   B O D 5 , o l d
where BOD5,new is the amount of organics entering the rivers after purification of the waste streams (mg·L−1), α the degree of sewerage connection (-), ε the removal efficiency of the WWTP (-), and BOD5,old the initial organics concentration (mg·L−1).
B O D 5 = γ   D O + δ
where δ and γ represent the slope and intercept of the BOD5DO linear regression line.
% D O n e w = ( 1 + α ε | 1 + δ γ   D O o l d | ) % D O o l d
where %DOnew is the percentage of DO after organics removal from waste streams (%), DOold the initial concentration of oxygen in the water column (mg·L−1), and %DOold the initial DO percentage (%).

3. Results

3.1. Chemical and Microbiological Water Quality Analysis

The average, minimum, and maximum of every measured variable is summarized in Table 3. Comparing the values with surface water quality standards for the protection of the aquatic ecosystem is important for assessing the water quality. To our knowledge, no such standards are available for Ethiopian freshwater ecosystems or other countries in Eastern Africa [32]. Therefore, the quality standards for effluent discharge published by the Ethiopian Ministry of Water Resources (MOWR) [33] and the basic environmental water quality standards for a small river in Flanders (Belgium) were used for indicative comparison [34].
The variables temperature, pH, Cl, and NO3 generally met the proposed standards. On the other hand, 94% of all locations contained less dissolved oxygen than the minimum required level to support aquatic life (6 mg·L1), indicating high organic loads and poor chemical water quality conditions. Additionally, the amount of oPO43−, TAN, NH3, and TSS in the assessed rivers and wetlands was too high for respectively 34%, 47%, 21%, and approximately 50% of all sampled sites to ensure a healthy ecosystem. Note the exceedingly high maximum level of these variables. The maximum concentration for oPO43−, NH3, and TSS was respectively 150, 57, and 105 times higher than the Flemish standard while TAN exceeded the MOWR standard with a factor 183. The variables from Table 3 are shown in more detail in Figure 4 (DO, oPO43−, NO3, TAN, EC, and TSS) and Figure A1 (pH, TDS, temperature, Cl, chlorophyll a, and turbidity) (Appendix). River flow data is summarized in Table A1 (Appendix).
The level of DO decreased gradually from 70% in the upstream reaches to approximately 45% in the downstream part (Figure 4). Additionally, the results of the Kruskal Wallis H test verified a significant difference between the source area A and the more downstream areas B and C (p-values of 0.01 and 0.02 respectively). A small increase in dissolved oxygen could be observed in Zone D but this appeared to be not significant (p = 0.86). The variables oPO43−, TAN, chlorophyll a, EC, Cl, and TDS shared the same graphical pattern (Figure 4, Figure A1). The concentrations increased from the low impacted Zone A to the high impacted Zone B, after which a decrease was observed in the Zones C and D. The increasing trend between Zones A and B was statistically verified for every variable but, as the rivers flow from the midstream area to Boye wetland, no significant changes were detected. Nitrate levels tended to increase from Zone A to C and dropped in Zone D. However, statistical analysis did not provide any evidence for this statement. After that, no significant differences were detected between the different zones for the variables TSS, turbidity, and pH.
The results of dissolved oxygen, as a measure for organic pollution, and nutrients (NO3, TAN, and oPO43−) near the considered point sources of pollution are shown in Table 4. There is no data available for Kito before the WSP of the technology campus of Jimma University (WSPJU). However, comparing the measurements around this area to other upstream sampling points of Kito (Kt1 to Kt4) revealed that the level of dissolved oxygen was approximately 20% lower at WSPJU, and nitrate concentrations were on average 11 times higher. Therefore, it was recognized as a major point source of pollution. Around Jimma University and the prison facility, the concentration of dissolved oxygen in the water column decreased by respectively 20% and 11%, while nutrient levels increased remarkably. The level of total ammoniacal nitrogen after the prison was 587 times higher than before the facility, and, at the discharge point of Jimma University, TAN increased from 16 mg·L−1 to 183 mg·L−1, which was the highest measured concentration. Moreover, the highest oPO43− concentrations were measured in the vicinity of the prison (17.6 mg·L−1) and Jimma University (6.6 mg·L−1). Note that nitrate levels remained more or less unchanged. Additionally, almost no changes were observed in oxygen level and nutrient status for the newly built abattoir and the dry coffee processing plant. The latter two were therefore not considered as point sources of pollution anymore and were excluded from further data analysis.
The results of the microbiological analysis of the water samples of the twelve sampled sites are shown in Table 5. For every monitored location, the MOWR’s TC and FC effluent standards were exceeded (4 MPN·mL−1 and 2 MPN·mL−1 for TC and FC, respectively). Along the river continuum, the contamination level remained high, but coliforms concentrations decreased drastically after passing Boye wetland (>69% for TC and >92% for FC).

3.2. Water Quality Assessment based on Chemical and Biological Indices

The results of the chemical and ecological water quality are shown in Figure 5 (Prati) and in Figure 6 (ETHbios). The majority of the sampling points were labeled as polluted or heavily polluted (23 and 24 sites respectively) (Figure 5). Five sampling points had an acceptable water quality (Kt1 to Kt4 and Awb1, Zone A), and only one of the samples had good water quality (S4, Zone B). None of the samples were characterized as very heavily polluted. The chemical water quality in Zone A ranged from acceptable to polluted and was significantly better than in Zone B (p = 0.01), where the river water was mainly polluted to heavily polluted. After Zone B, no significant changes in chemical water quality occurred. Additionally, the water at the WSP of the Jimma University technology campus (WSPJU) was polluted. The chemical water quality remained unchanged after the river passed the new slaughterhouse (Snew at Aw2) and the dry coffee processing plant (CP between Aw6 and Aw7). At Jimma’s prison, the chemical water quality evolved from polluted to heavily polluted, while no change was observed at the discharge point of Jimma University (A1).
Figure 6 reveals that only Kt1 had good ecological water quality, and 10 locations had moderate quality. The majority of the samples (31 sites) had poor ecological water quality, and 11 samples were classified as having bad ecological water quality with the majority of them located in Zone B. As for the oxygen Prati index, the ecological water quality significantly decreased from the source (Zone A) to the middle reaches (Zone B), after which no significant differences between Zone C and D were detected. Near WSPJU and Snew, the water had poor ecological water quality. After that, the ecological water quality decreased at Jimma’s prison and the new slaughterhouse (Snew) and remained unchanged at Jimma University’s discharge point (JU) and the dry coffee processing plant.

3.3. Multivariate Data Analysis

The results of the canonical correspondence analysis are shown in Figure 7. The ecological indicators ETHbios and ASPT were positively correlated to the percentage of DO and showed a negative correlation with nutrient levels (oPO43− and NO3), EC, Prati, chlorophyll a, pH, and TSS. Regarding biological communities, the presence of most pollution sensitive taxa (e.g., Hydropsychidae, Caenidae, Heptageniidae, and Lepidostomatidae) was associated with high levels of DO or a low oxygen Prati index. On the other hand, pollution resistant taxa (e.g., Haplotaxidae, Culicidae, Physidae, and Hydrophylidae) were more abundant in waters with high nutrient levels.

3.4. Simulation of the Effect of Wastewater Treatment: Scenario Analysis

Firstly, the relationship between the organic content and the dissolved oxygen was determined with the data from Haddis et al. [4] and is shown in Figure 8. The coefficient of determination (R2 = 0.79) corresponded to a Pearson’s correlation coefficient of 0.89, which was a strong correlation according to Dancey and Reidy’s categorization [35]. The slope and the intercept of the linear regression line, which were used to determine the new level of DO in the water (Equation (3)), were equal to −81.6 and 517.2, respectively. The simulations with this empirical model were hypothetical, as we could not test it with independent data to verify the relationship.
Secondly, the calculation of the oxygen Prati index with the new level of DO revealed that several locations were categorized in a higher water quality class, indicating better chemical water quality due to organics removal via wastewater collection (sewerage) and treatment (Figure 9). The water quality class for most locations increased by one, but for the best scenarios Sc7 (αε = 64%) and Sc8 (αε = 72%), 6% and 17% of the respective locations advanced two classes. Additionally, the maximum percentage total improved water quality (Sc8) is 87%, which would be the case if a sewerage connection resembling that in developed countries (80%) and a highly efficient WWTP (90%) was used.
Finally, the results of the analysis of treating wastewater from the point sources of pollution Jimma University, the prison facility, and the initial WSP at the Jimma University technology campus are summarized in Table 6. It was assumed that these sources were responsible for the decrease in chemical water quality. Additionally, the generated wastewater directly went to the WSP (no loss; ε = 100%). Implementing a WWTP led to a decrease in the oxygen Prati index values. The decrease was most explicit for Jimma University (61% for CW and 66% for WSP), then for the current WSP at the Jimma University technology campus (58% for CW and 65% for WSP), and least for Jimma’s prison (55% for CW and 61% for WSP).

4. Discussion

4.1. Water Quality

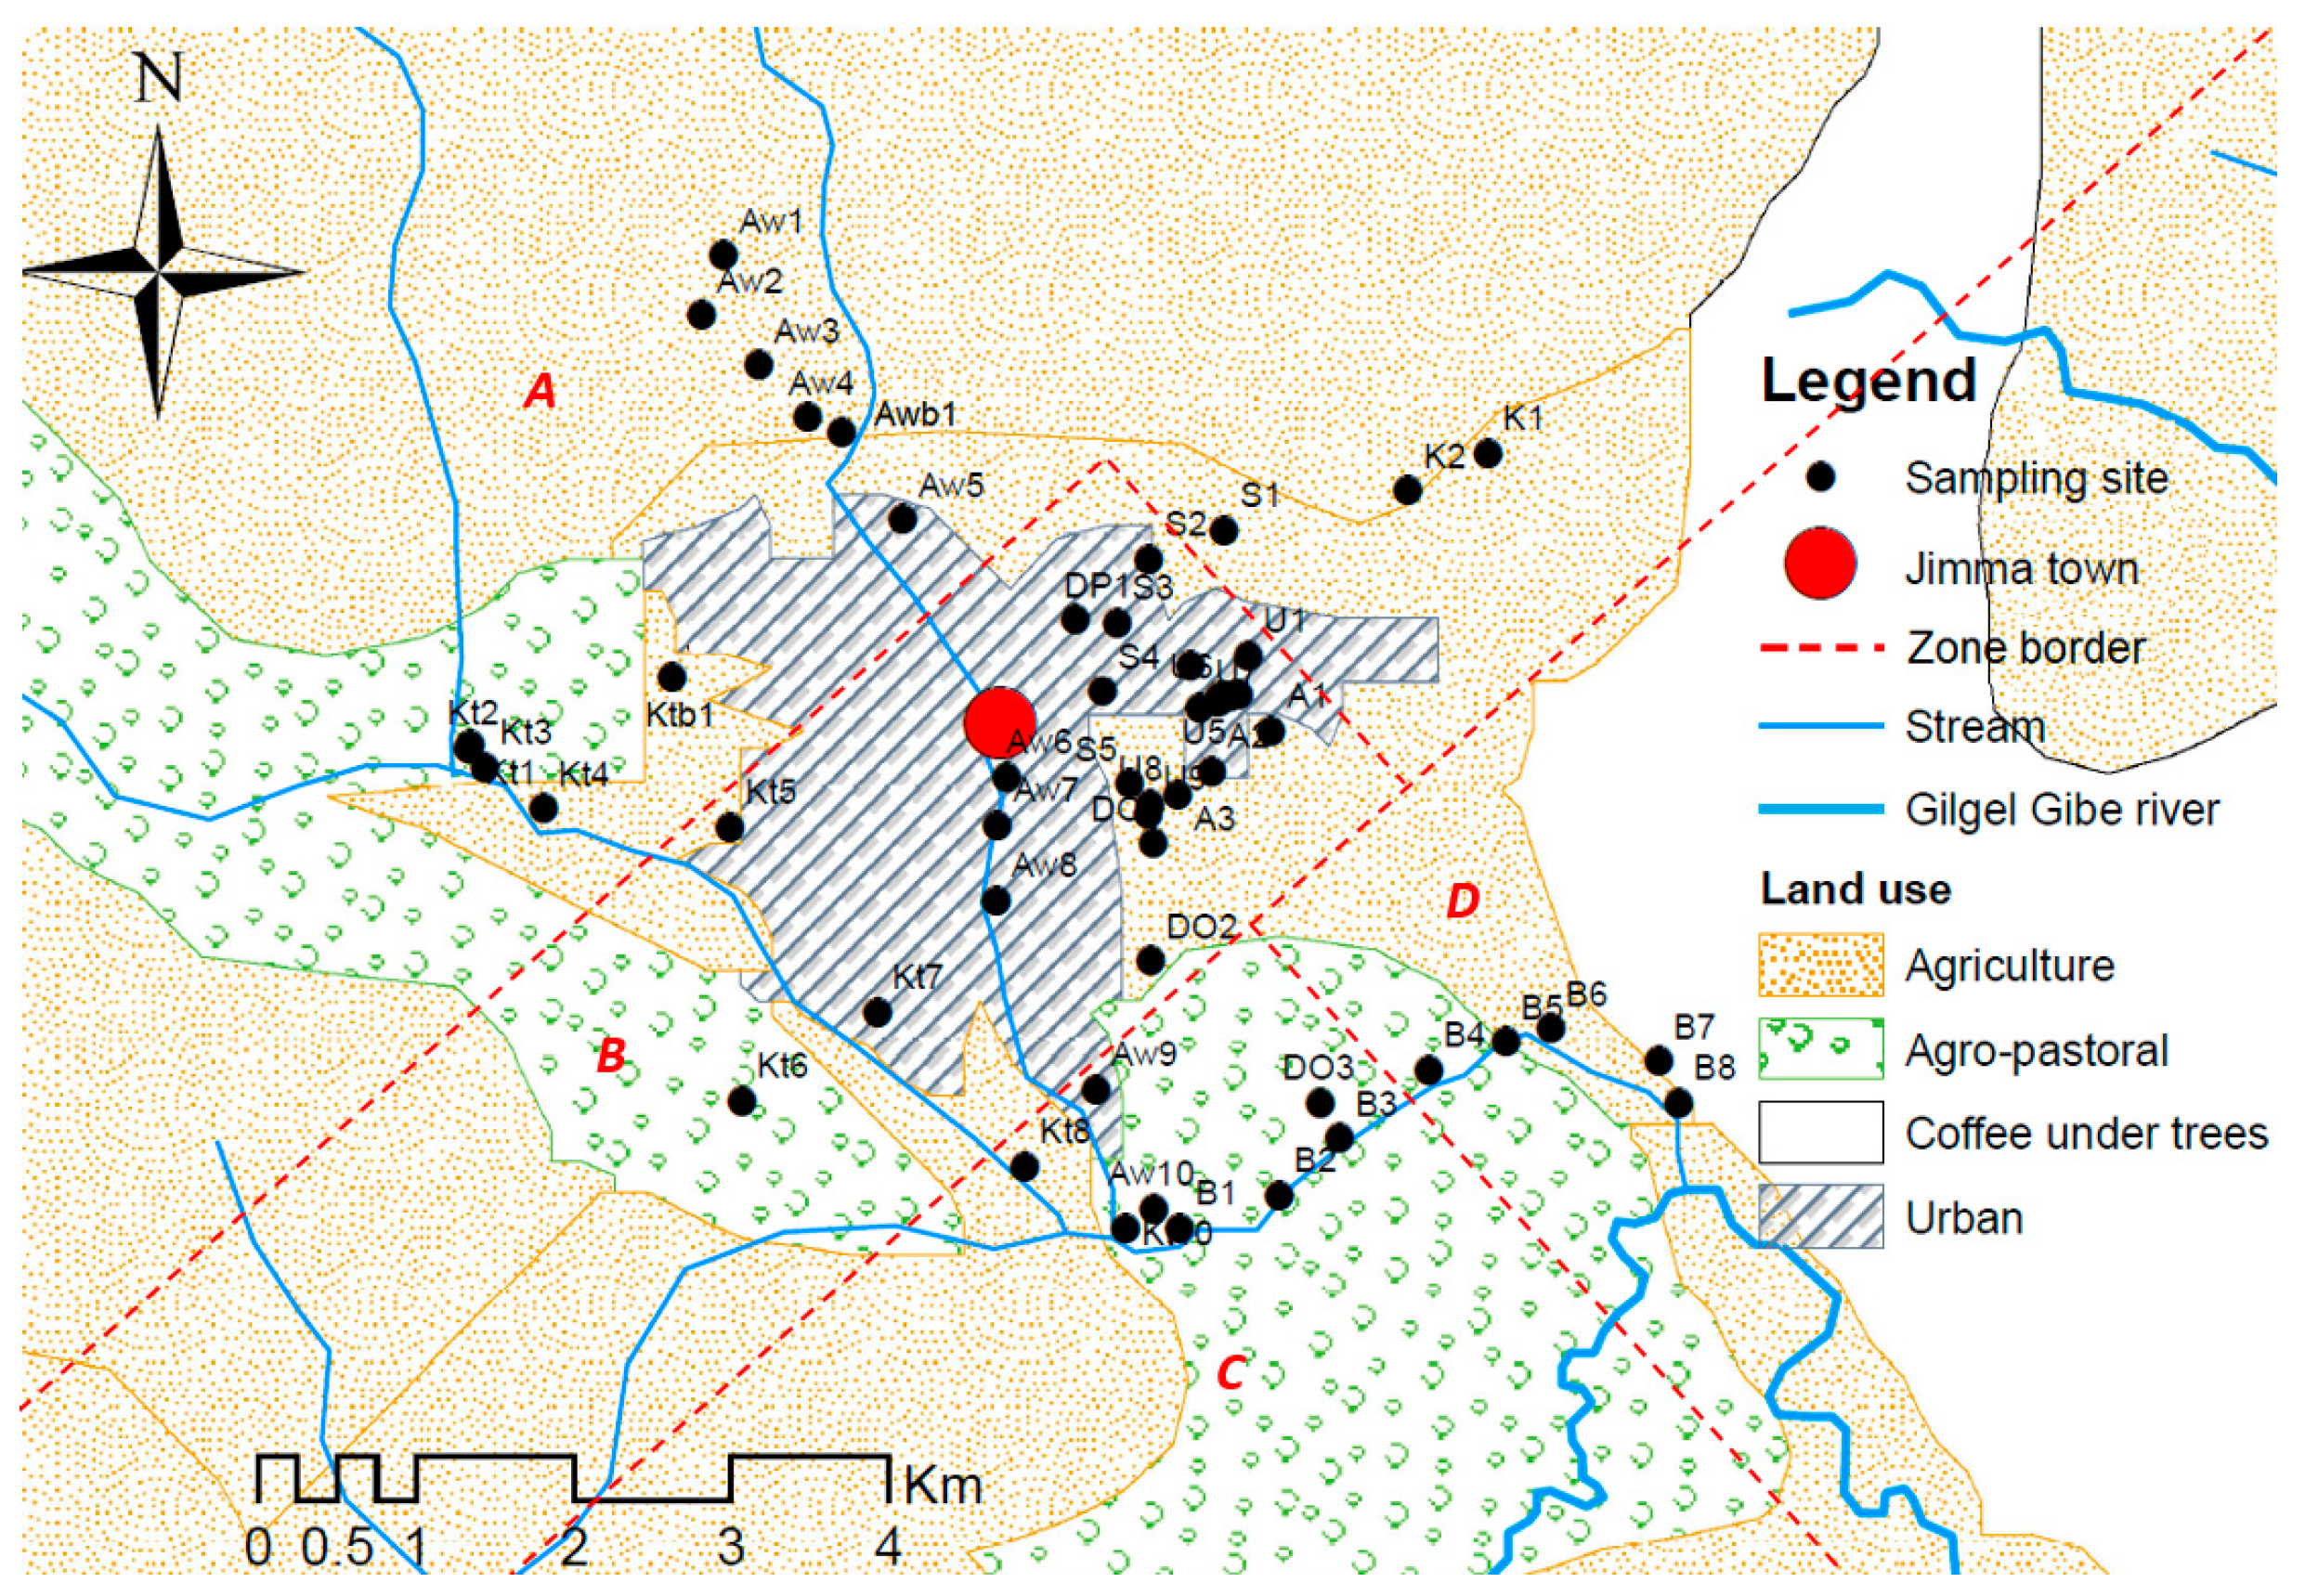
Our results show that the rivers in Jimma receive pollutants from different (diffuse and point) sources contributing to a significant decrease in dissolved oxygen along the rivers’ continuum. The upstream reaches are mainly characterized by agriculture and agro-pastoralism; thus, runoff from land is considered to be the major diffuse source of pollution in that area. Lencha & Moges [36] showed that land with crop production in Jimma is more susceptible for erosion, and that changes in land use during the past years have increased the erosion potential. Deforestation, overgrazing, and cultivation of slopes unsuitable for agriculture significantly enhance land degradation in Jimma [37]. Four catchments in Jimma with very high erosion susceptibility drain to the Gilgel Gibe hydropower dam, indicating the need for immediate actions to deal with erosion in order to protect the dam from siltation [38]. The construction of soil bunds and biological stabilization with, e.g., elephant grass or Sesbania sp, have proven to be efficient measures to reduce soil erosion in the Ethiopian highlands [37]. Biological stabilization is an especially promising technique, as it also improves the availability of organics in the soil and provides food for cattle [39].
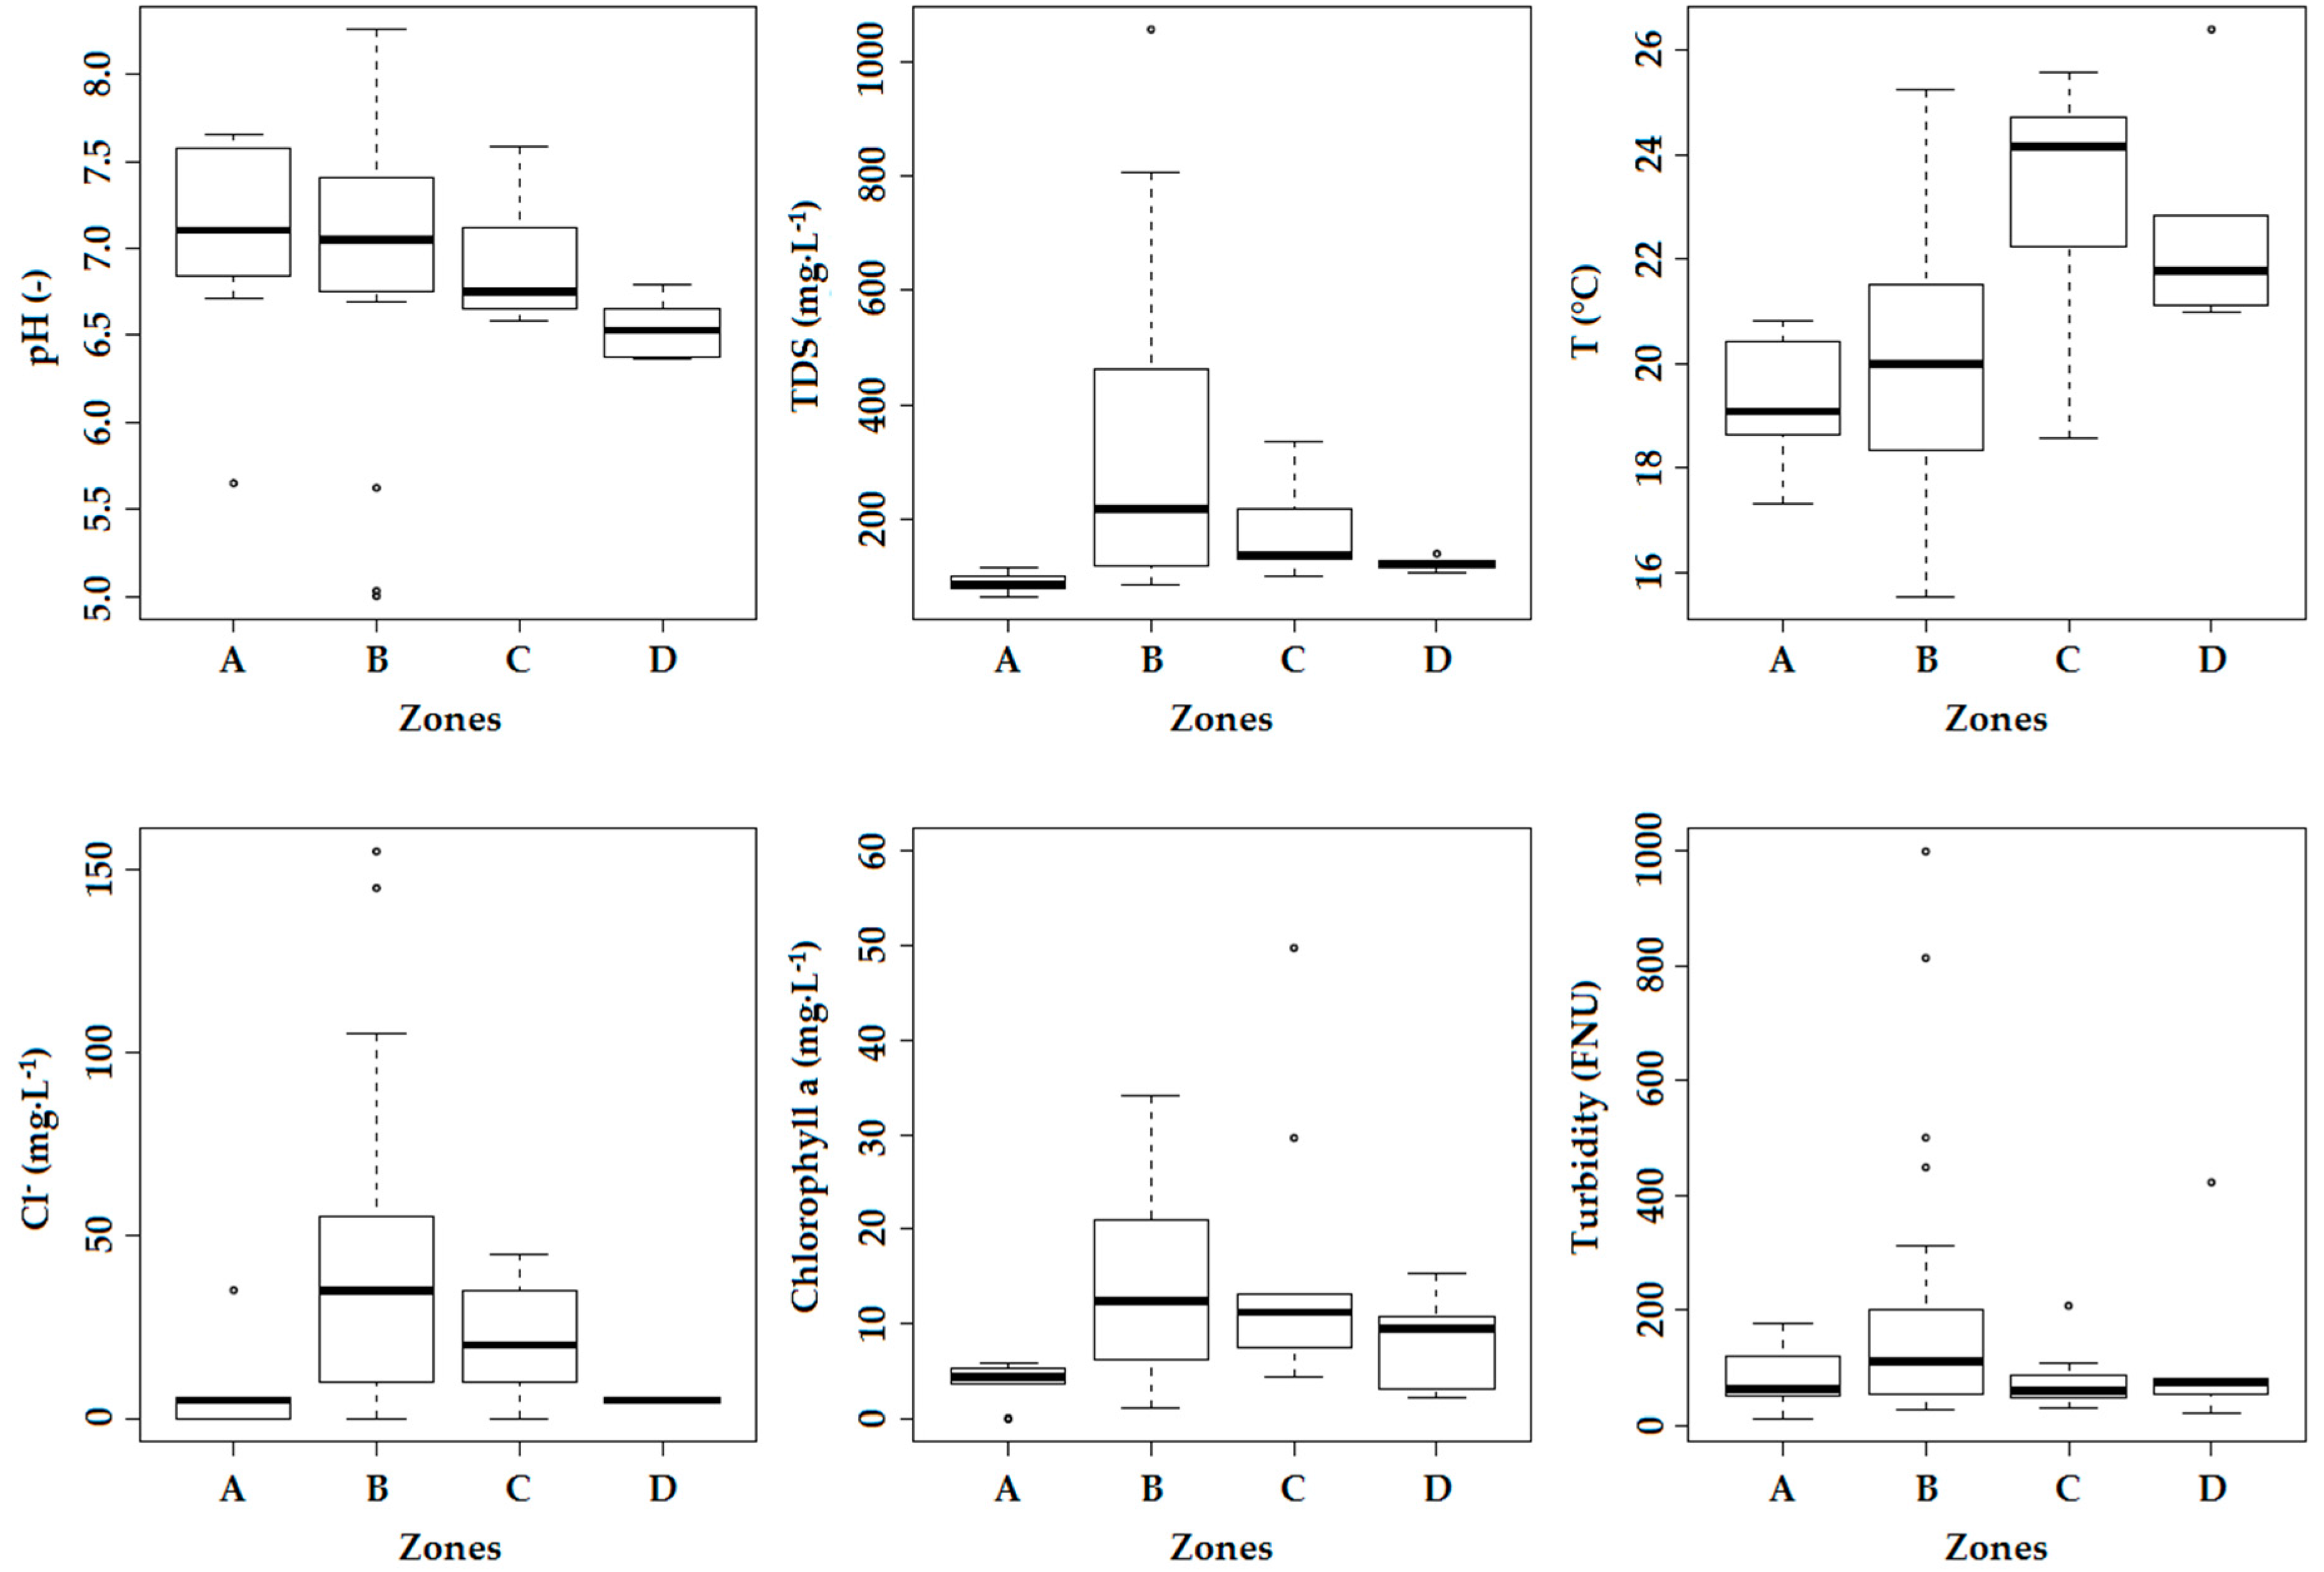
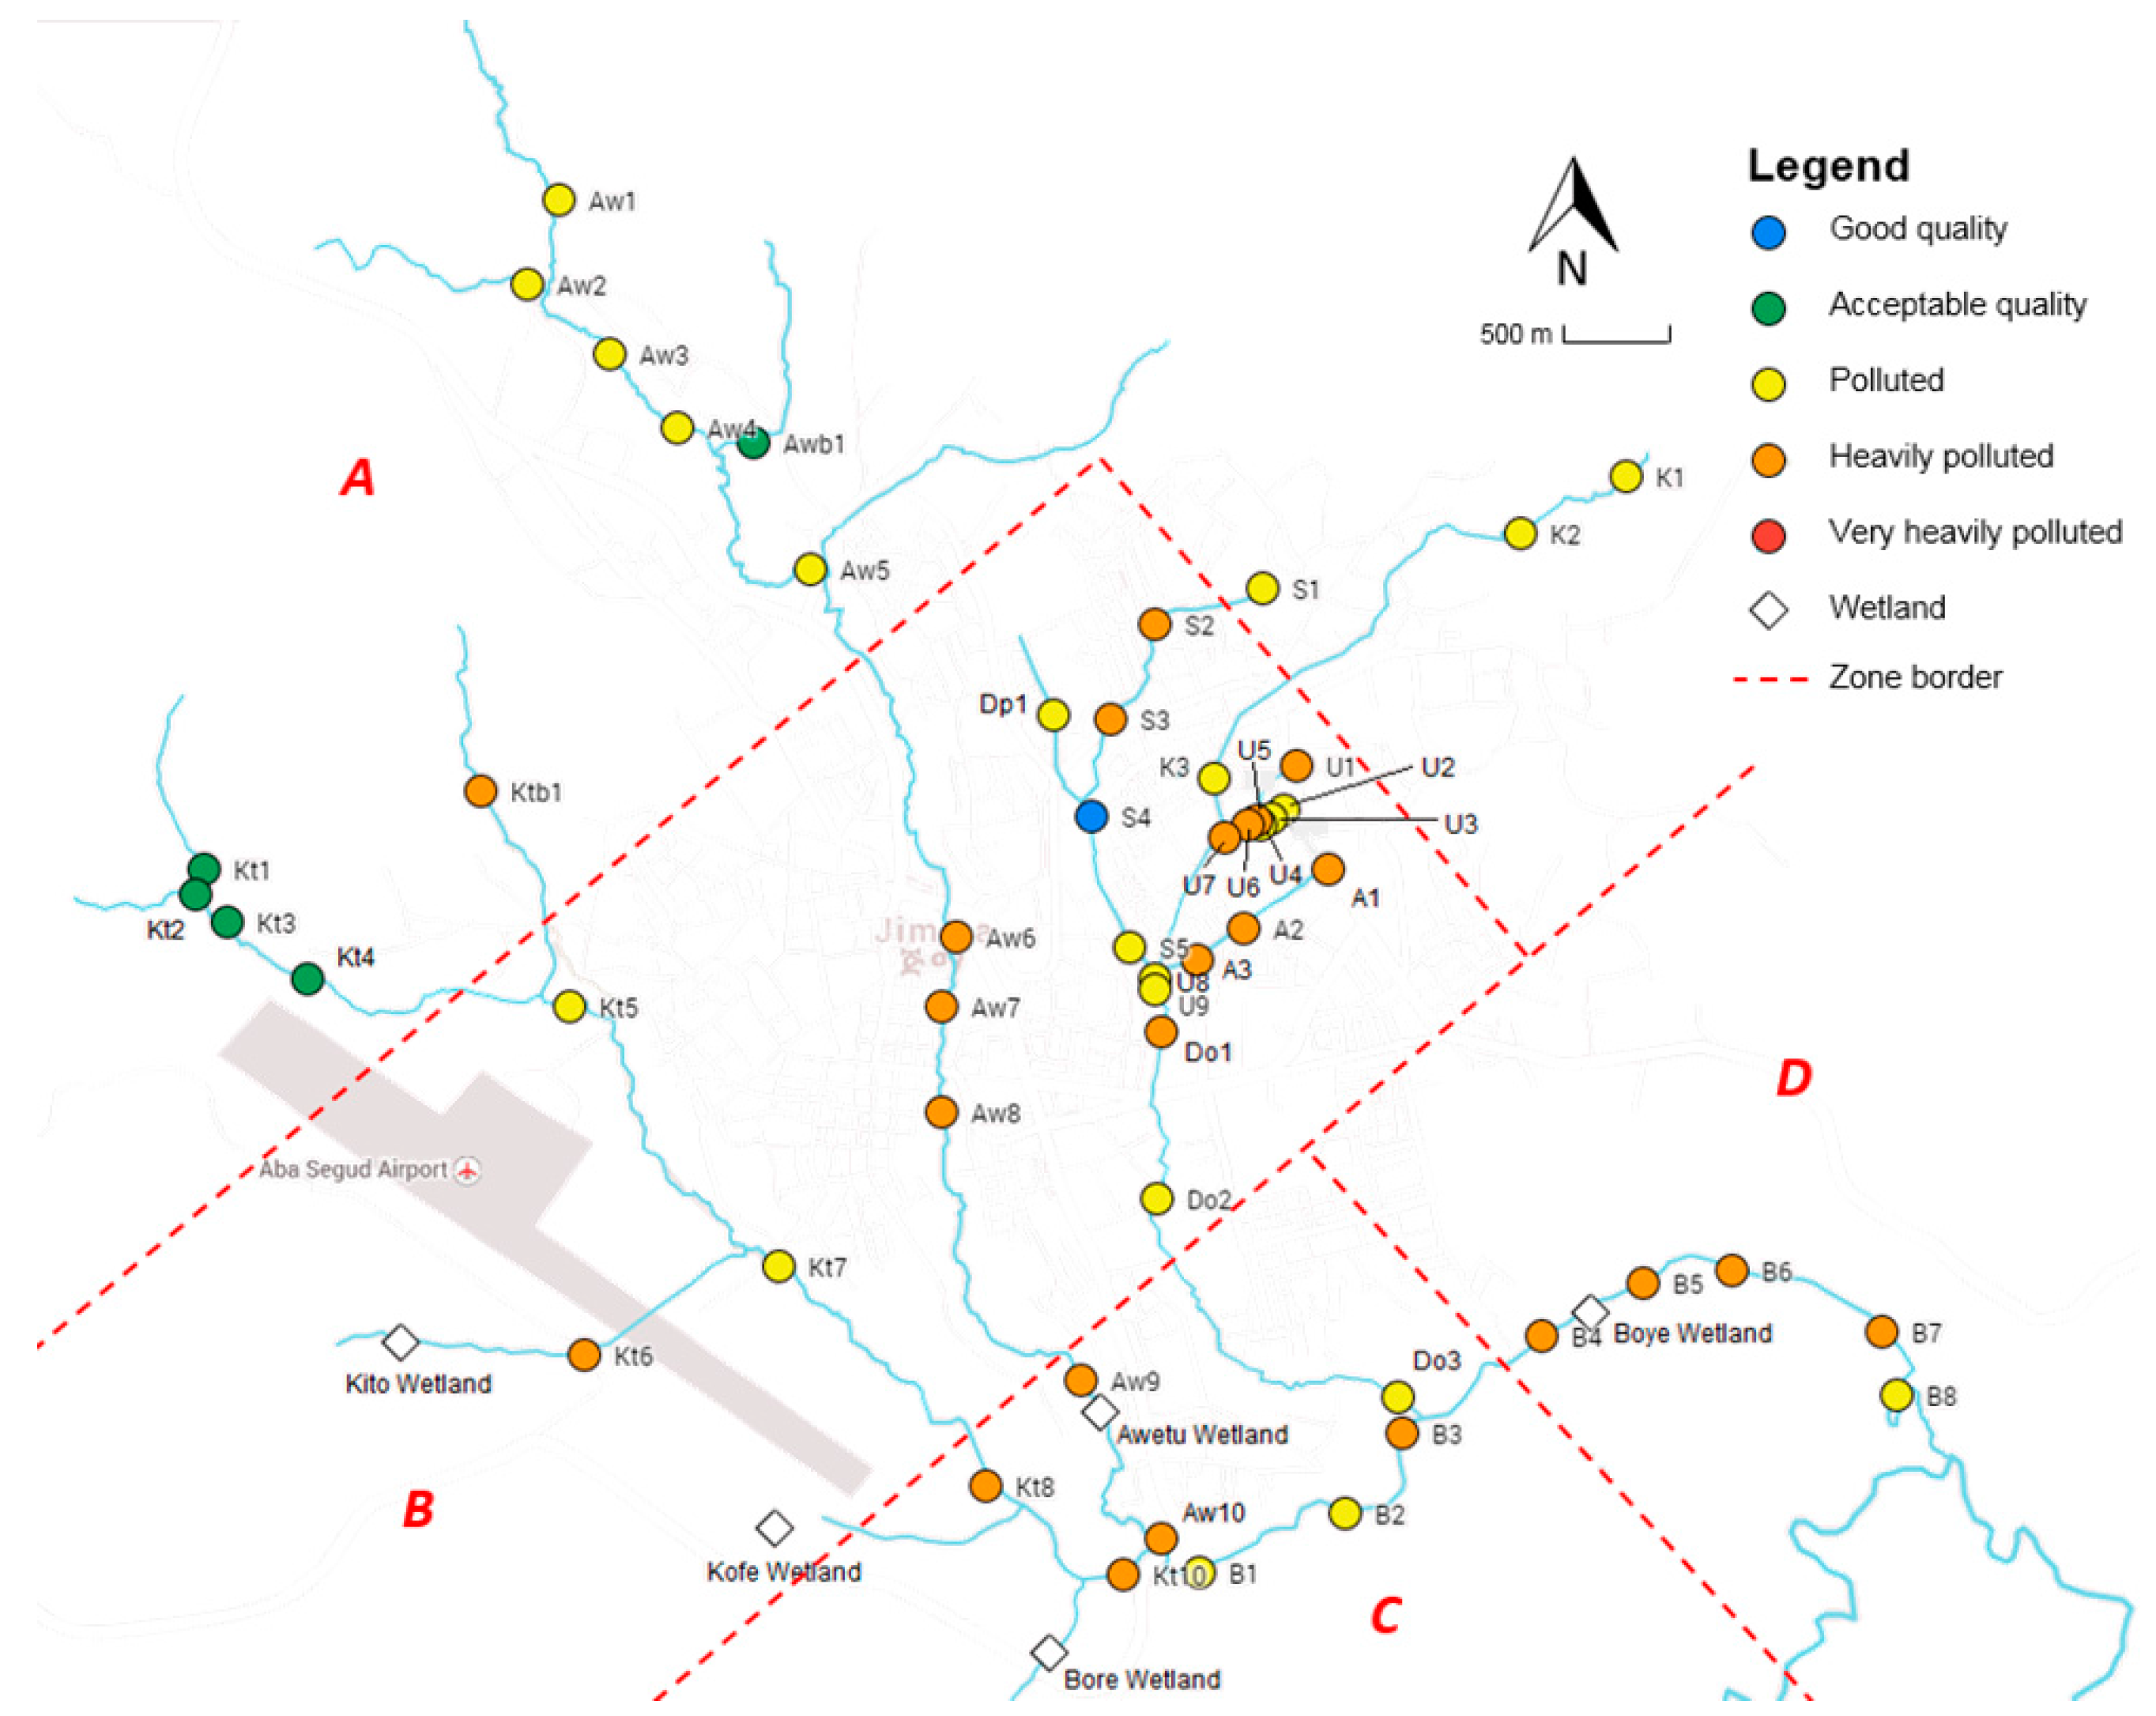
Erosion also promotes the input of nutrients into the rivers, and the frequent usage of pesticides (e.g., DDT, endosulfan, cypermethrin, and permethrin) is expected to have an adverse effect on the water quality. These sources of pollution contribute to the observed significant decrease in chemical and ecological water quality towards the mouth of the rivers. However, major pollution mainly occurs in the midstream reaches located in the urban area of Jimma, as most locations exceeding standards are situated there (78% for oPO43−, 68% for TAN, 52% for DO, 82% for EC, 100% for Cl, and around 60% for TSS). The middle part of the rivers are, next to agriculture, impacted by a broader range of pollution sources: institutional, domestic and industrial wastewater discharge, solid waste (e.g., plastics) and its leachates, Jimma’s prison and the university campus, the newly built slaughterhouse, hotels, carwash and fuel stations, clinics, colleges, and industry (wood and coffee processing). The pollution is reflected by the significant decrease in oxygen, increase in nutrients (TAN and oPO43−), leading to a higher abundance of algae (which require nitrogen and phosphorous for growth) and the increase in electrical conductivity and the related chloride concentration. The latter can be explained by the hide and skin processing of many retailers at different spots or by the usage of potassium-based fertilizers [4]. There is, however, one location where the chemical quality is determined to be good: after the confluence of Seto and Dipo. The distinct abundantly present aquatic vegetation at this site probably explains the relative high level of DO resulting in relatively good chemical water quality. The site is, however, still characterized by poor ecological water quality, indicating that it is not only oxygen that is important to sustain a healthy macroinvertebrate community.
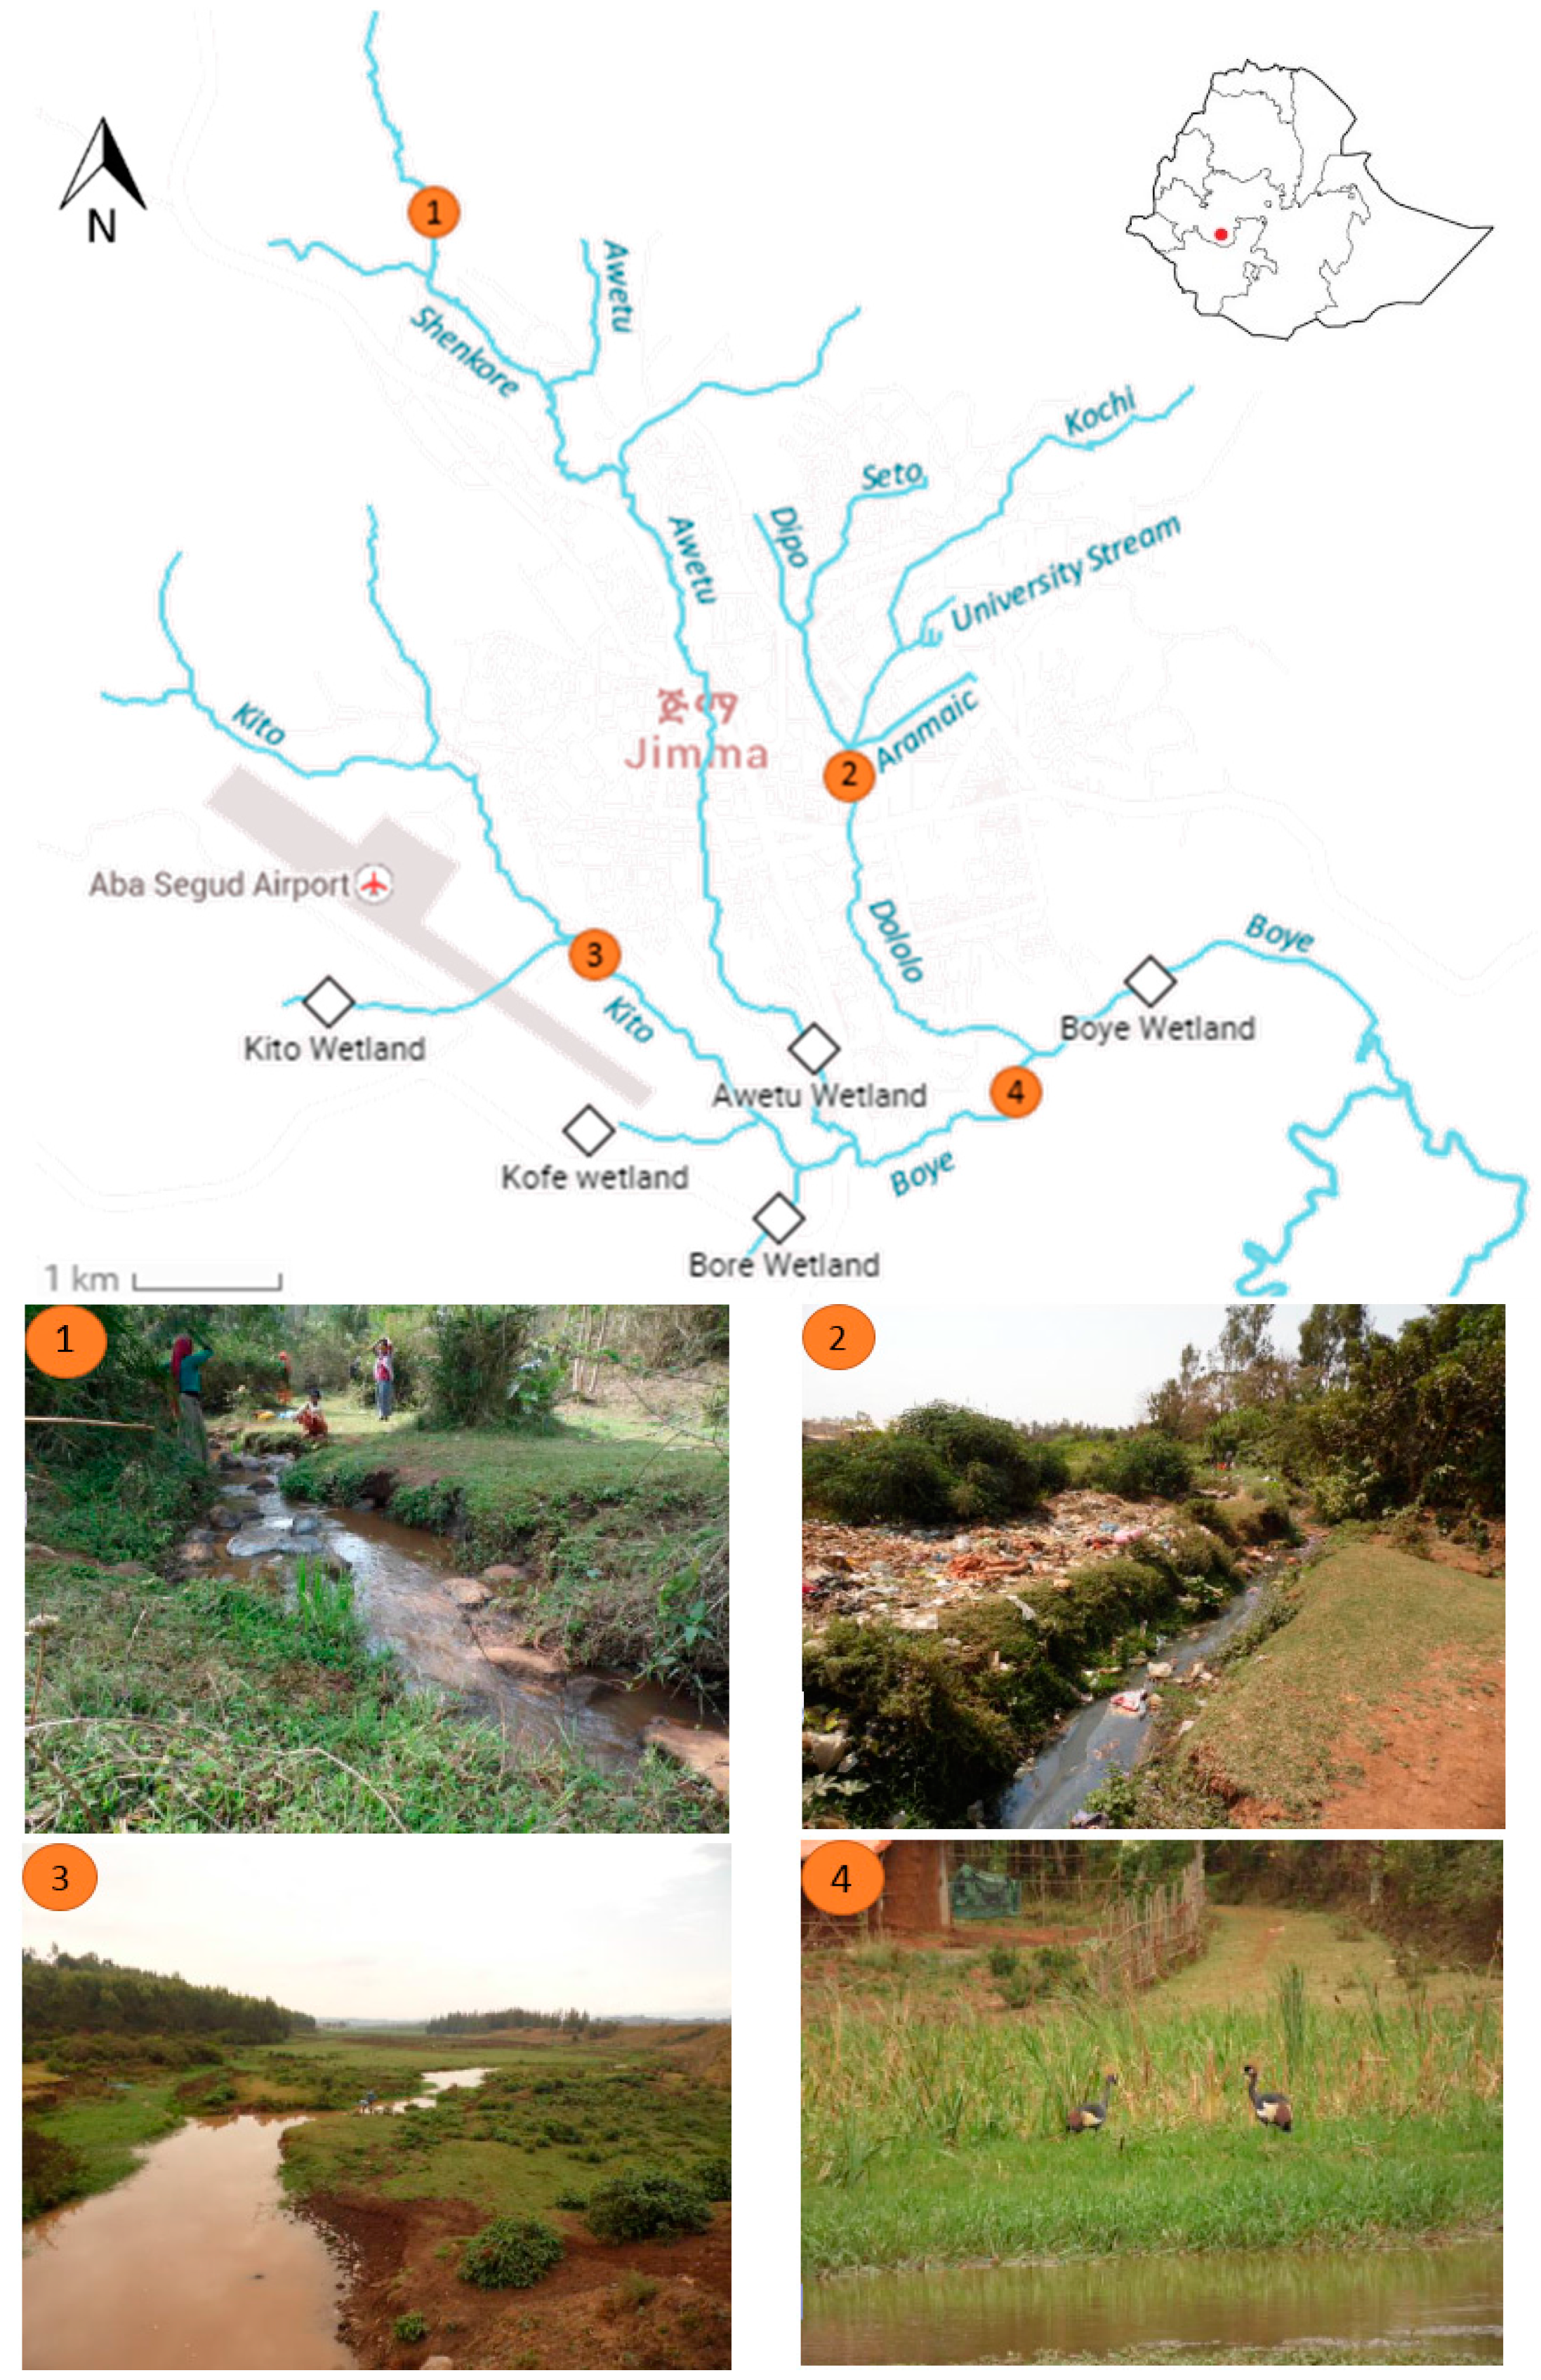
At the technology campus of Jimma University, the water is heavily polluted probably due to the discharge of wastewater originating from the malfunctioning WSP. The relative high nitrate concentration (only 23% of all sampling locations is higher than the measured value of 2.05 mg·L−1) and relative low DO level (40%) are an indication of the bad functioning of this wastewater treatment system. This is due to the fact that the construction of the WSP is not yet finished because of complaints (odor issues) of local communities. Other major point sources of pollution found in this study are Jimma’s prison and Jimma University. The discharge of organic pollutants into the river is reflected by the strongly increased EC (and Cl), the drop in DO (due to nitrification and biological oxidation), and, linked with this, a decline in chemical water quality (from polluted to heavily polluted). Additionally, significant higher amounts of TAN are detected after the discharge point, indicating that wastewater contributes most to the pollution of the rivers. Jimma’s prison has a septic tank to treat its wastewater, which is located approximately 100 m away from the river Seto. During sampling, the septic tank was not functional, as it was under maintenance. This led to a direct discharge of the untreated wastewater into the river, explaining the considerable decrease in water quality after the prison facility. If the septic tank is designed and operated properly, a reduced impact on the riverine environment can be expected. However, a subsurface flow of groundwater contaminated by the effluent can still pollute the river [40].
Surprisingly, the water quality did not change due to the newly built slaughterhouse and the dry coffee processing plant, which were assumed to be important point sources of pollution. Additionally, no significant changes were observed in nutrient status and the level of DO, indicating their limited impact on the freshwater environment. However, this does not mean that the current business management protects the river from pollution. The WSP of the new abattoir was not functional and did not treat the effluent from the factory, indicating its potential of polluting Awetu upstream. The research from Haddis et al. [4] proved that the abattoir and dry coffee processing plants discharge high amounts of organic waste, depleting oxygen levels. The authors found that BOD5 was 11 times higher after the investigated abattoir and 37 times after the dry coffee processing plant, while oxygen levels decreased with a factor 3.5 and 4.5, respectively. Consequently, wastewater treatment is indispensable to minimize deterioration of the natural environment resulting from human activities. Having this in mind, the WSP of the new abattoir needs to be employed and optimized.
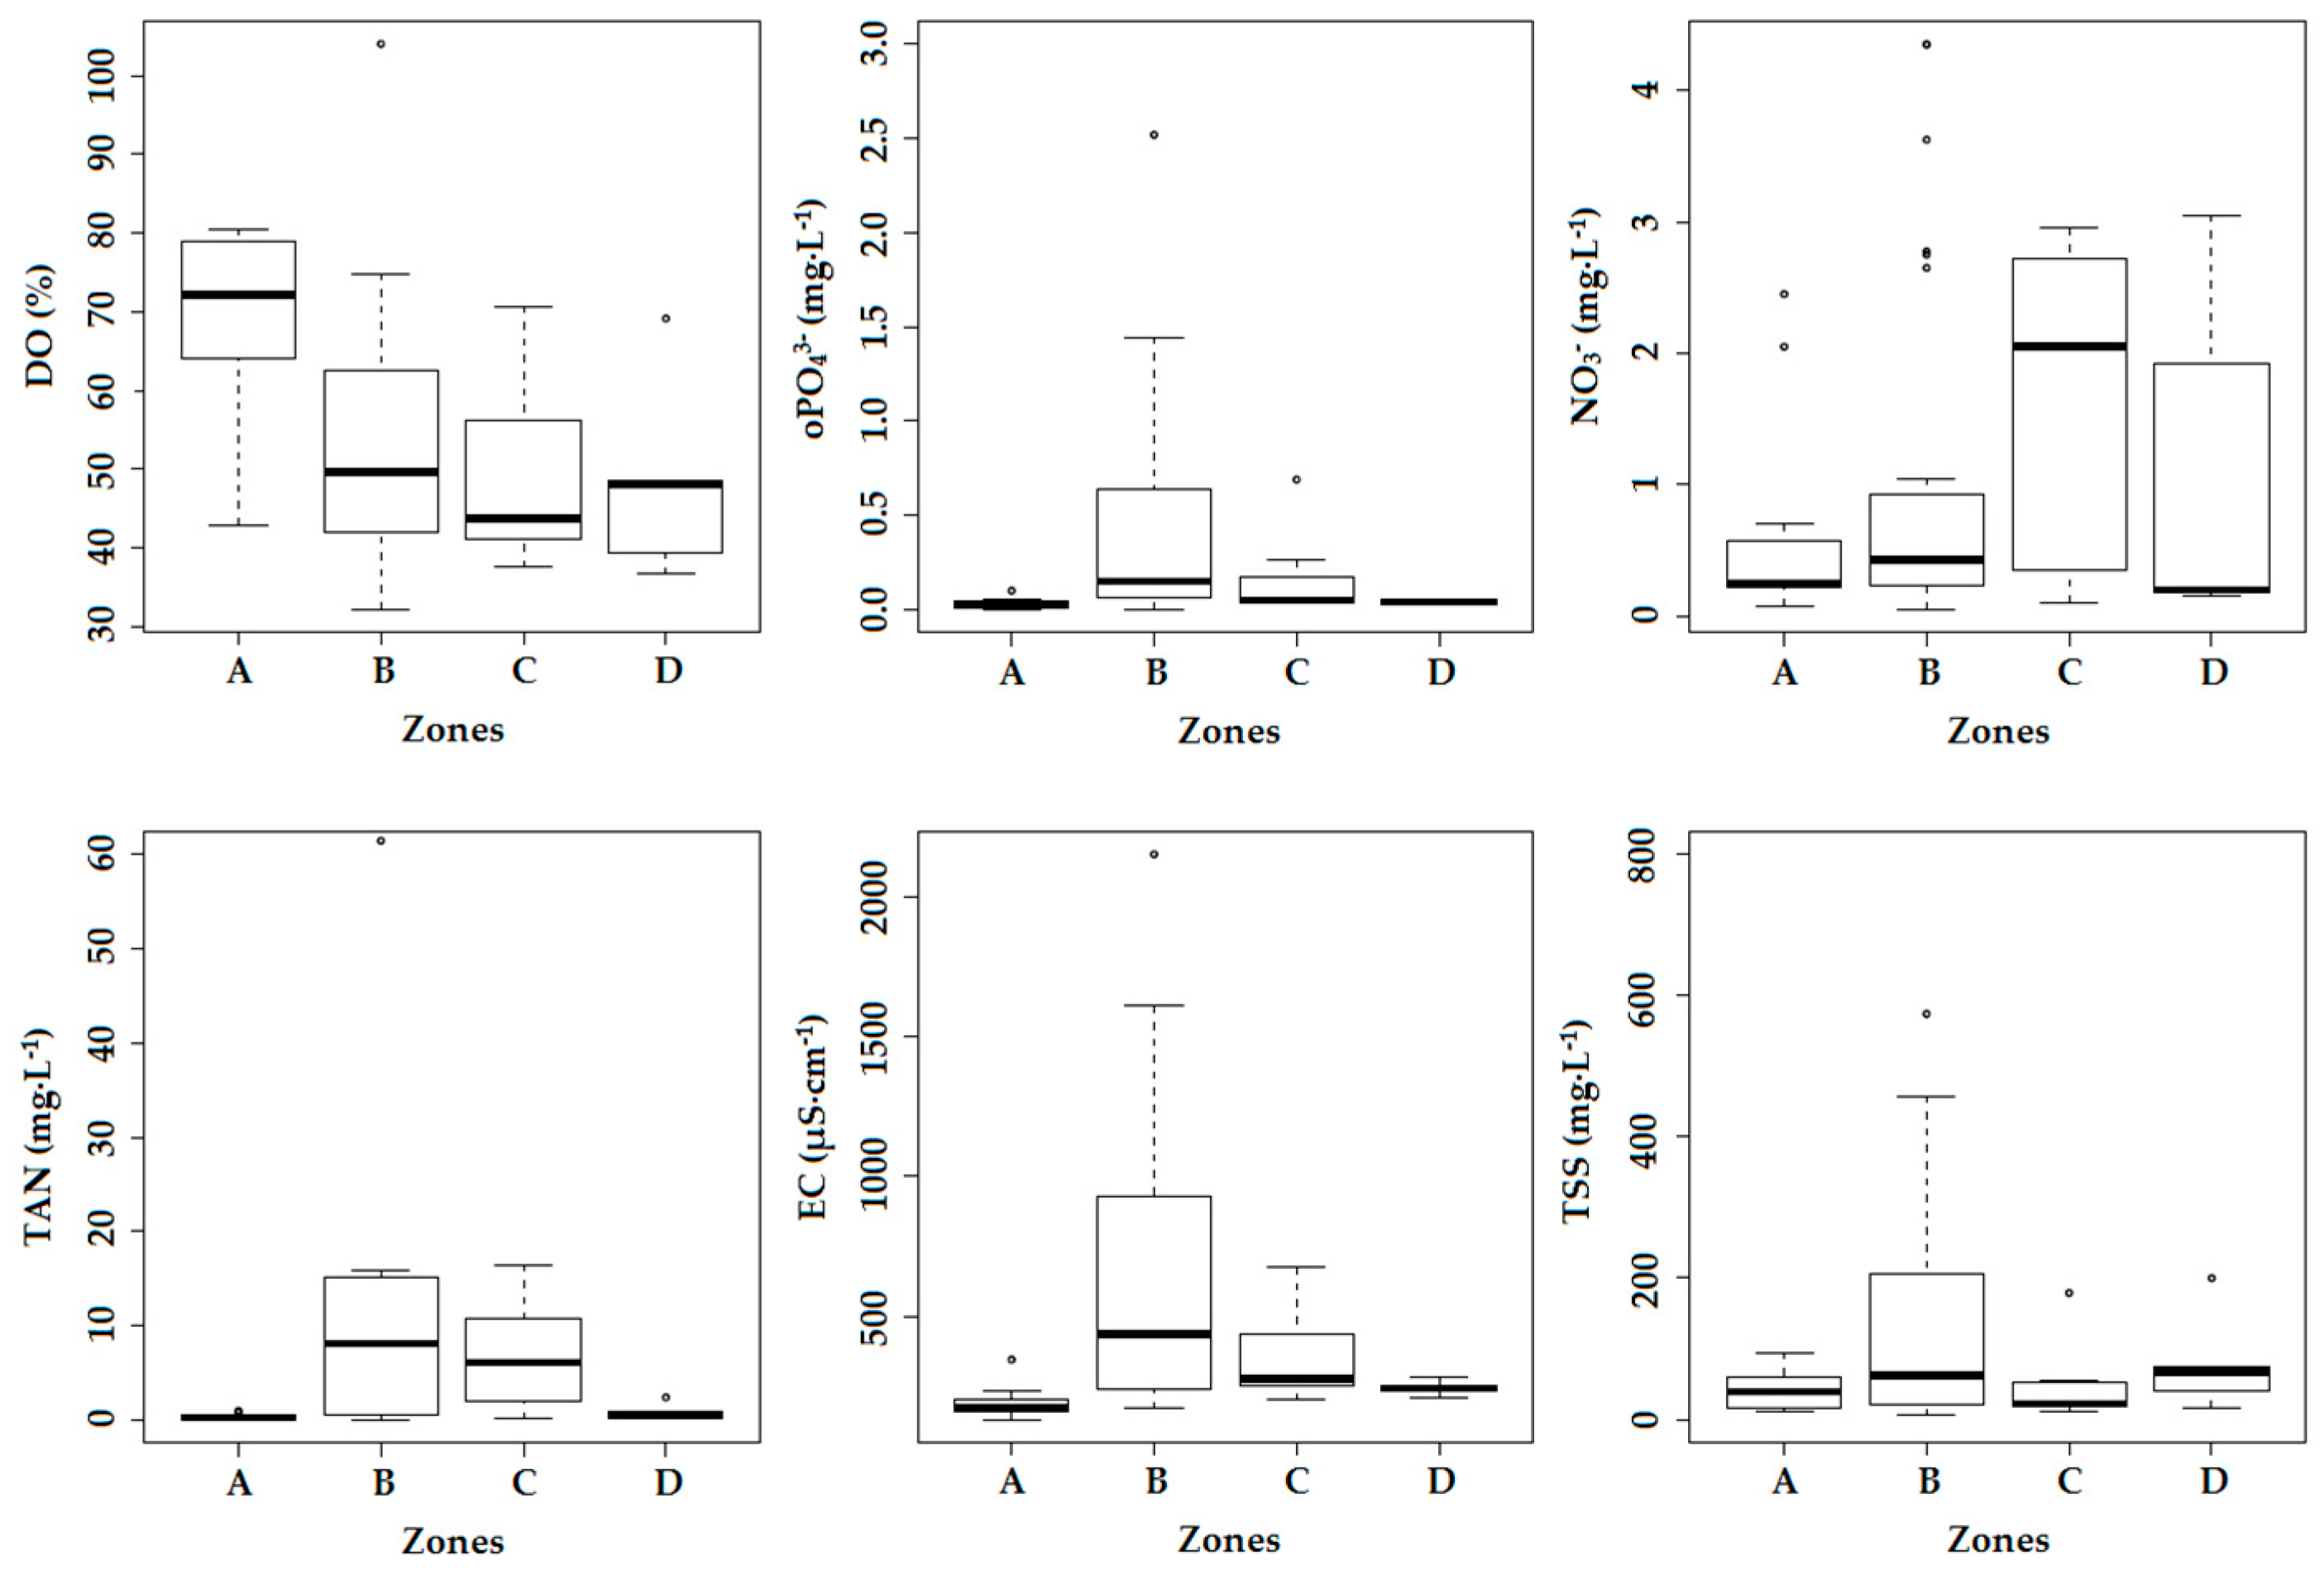
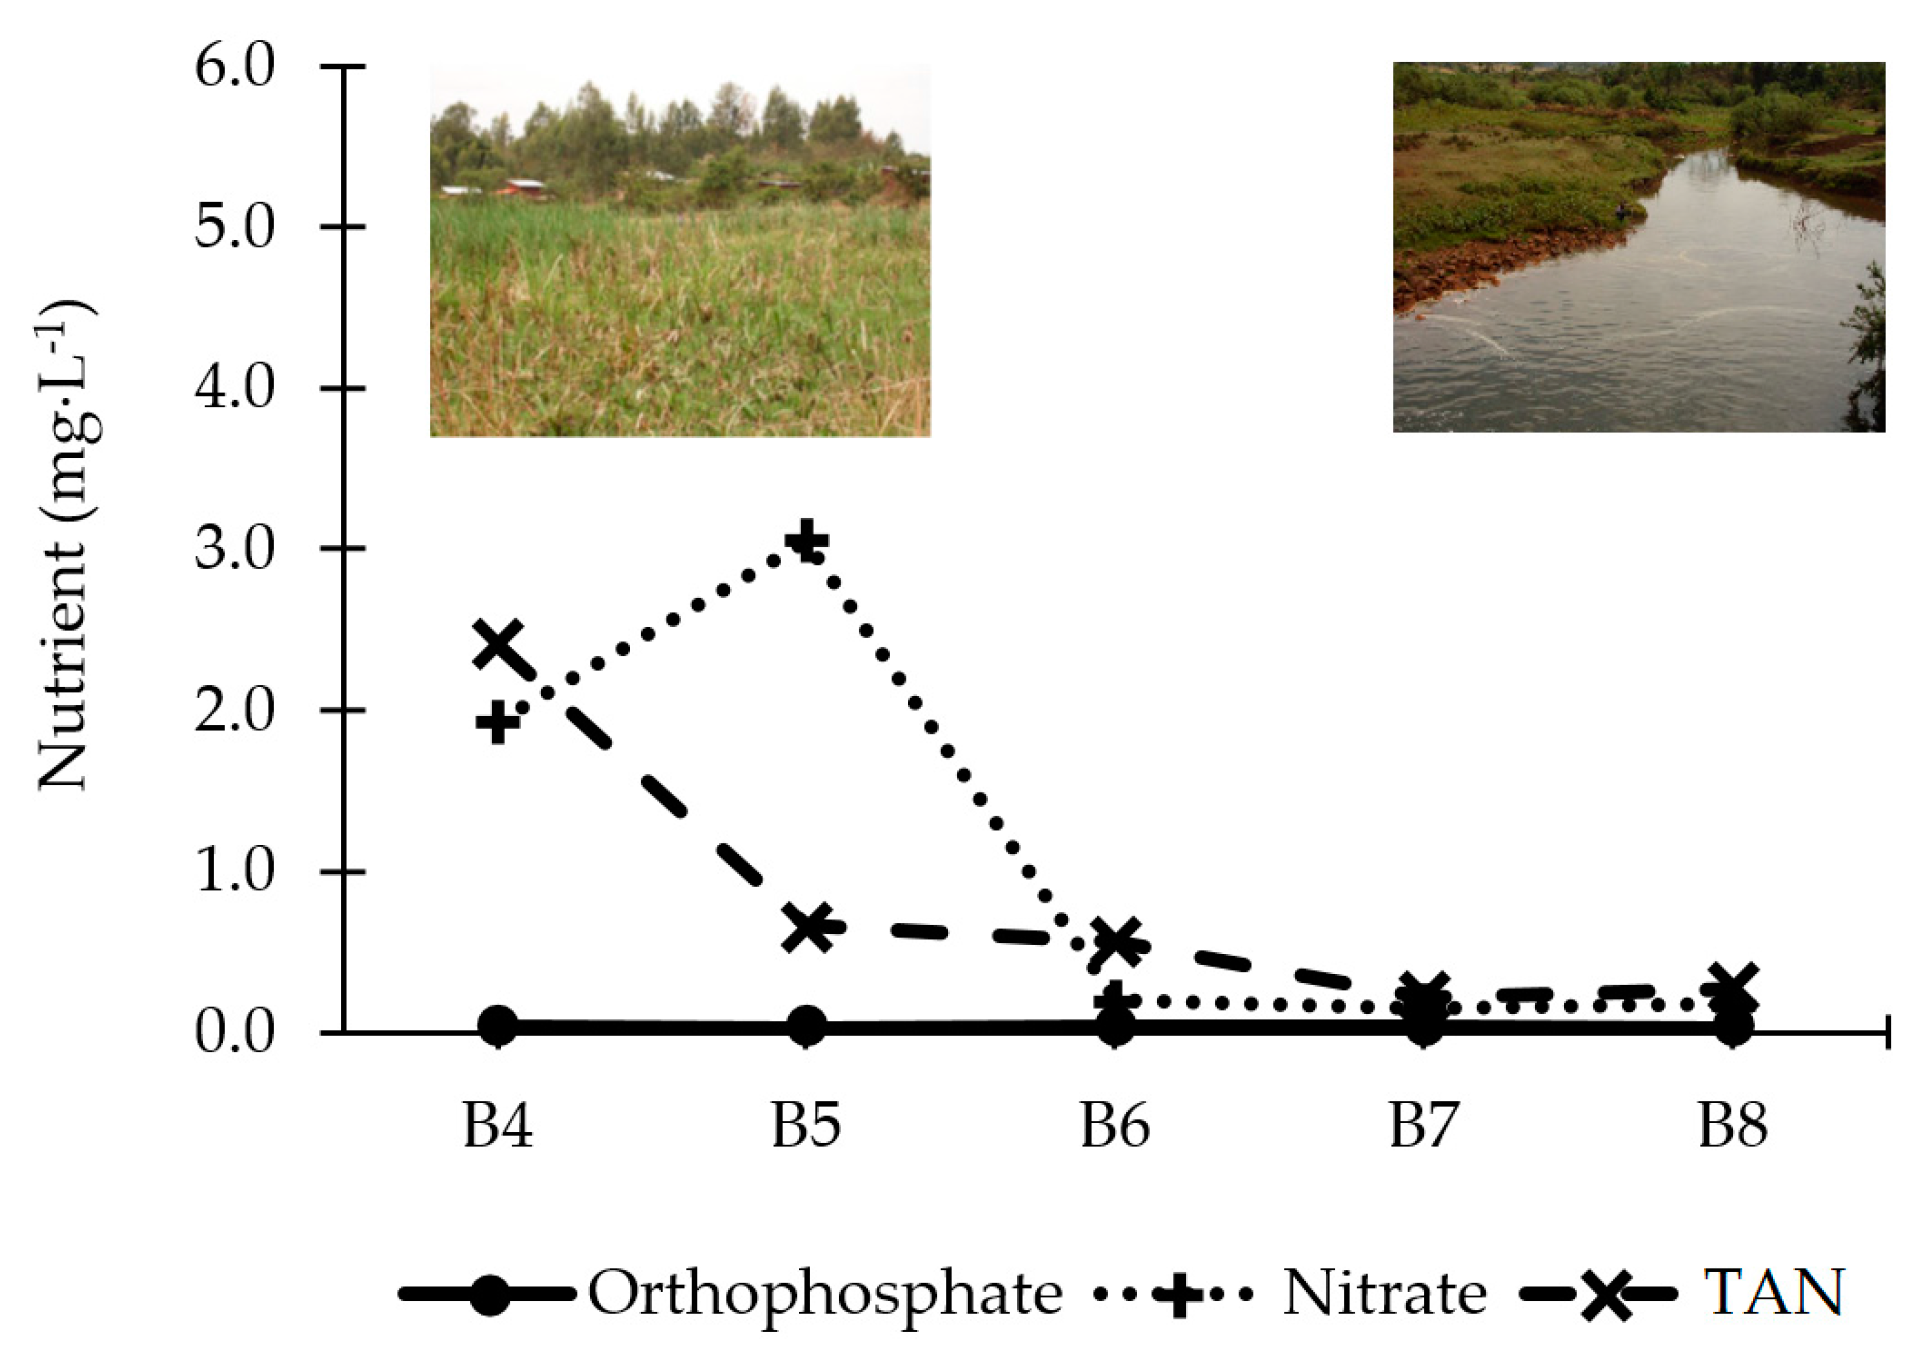
South of Jimma, the highly polluted rivers flow together to the natural wetland of Boye, which is expected to purify the water. However, our results indicate that the ecological and chemical water quality does not significantly improve in Zone D. Nonetheless, there is some evidence that indicates its purification potential. Firstly, a decrease in nitrogen levels is observed along the wetland (Figure 10). This pattern is also verified by Teferi et al. [13], who constructed a physicochemical profile for Boye pond in 2005. The consumption of these nutrients leads to proliferation of vegetation in the wetland and prohibits downstream areas from becoming overgrown by vegetation. Compared to the standards in Table 3, nutrient levels are sufficiently low to protect the natural environment. Secondly, the concentration of fecal and total coliforms is reduced by 68.8% and 91.9% after the water has passed Boye wetland, indicating its removal potential of pathogens.
Fecal contamination of the rivers is a major problem in Jimma, which can considerably affect human health. The assessed rivers are water resources for irrigation and domestic activities, exposing humans to the exceedingly high concentrations of fecal and total coliforms. The major sources of microbial contamination are practices of open defecation, livestock breeding, and the discharge of untreated wastewater [41]. We suspect that, in the upstream areas, cattle is responsible for the fecal contamination, as agriculture is the main activity, while, in the midstream reaches, the poor sanitation mainly pollutes the water with coliforms. This could have been verified by DNA analysis techniques (e.g., qPCR), but this was beyond the scope of the present study.

4.2. Water Quality Improvement Options

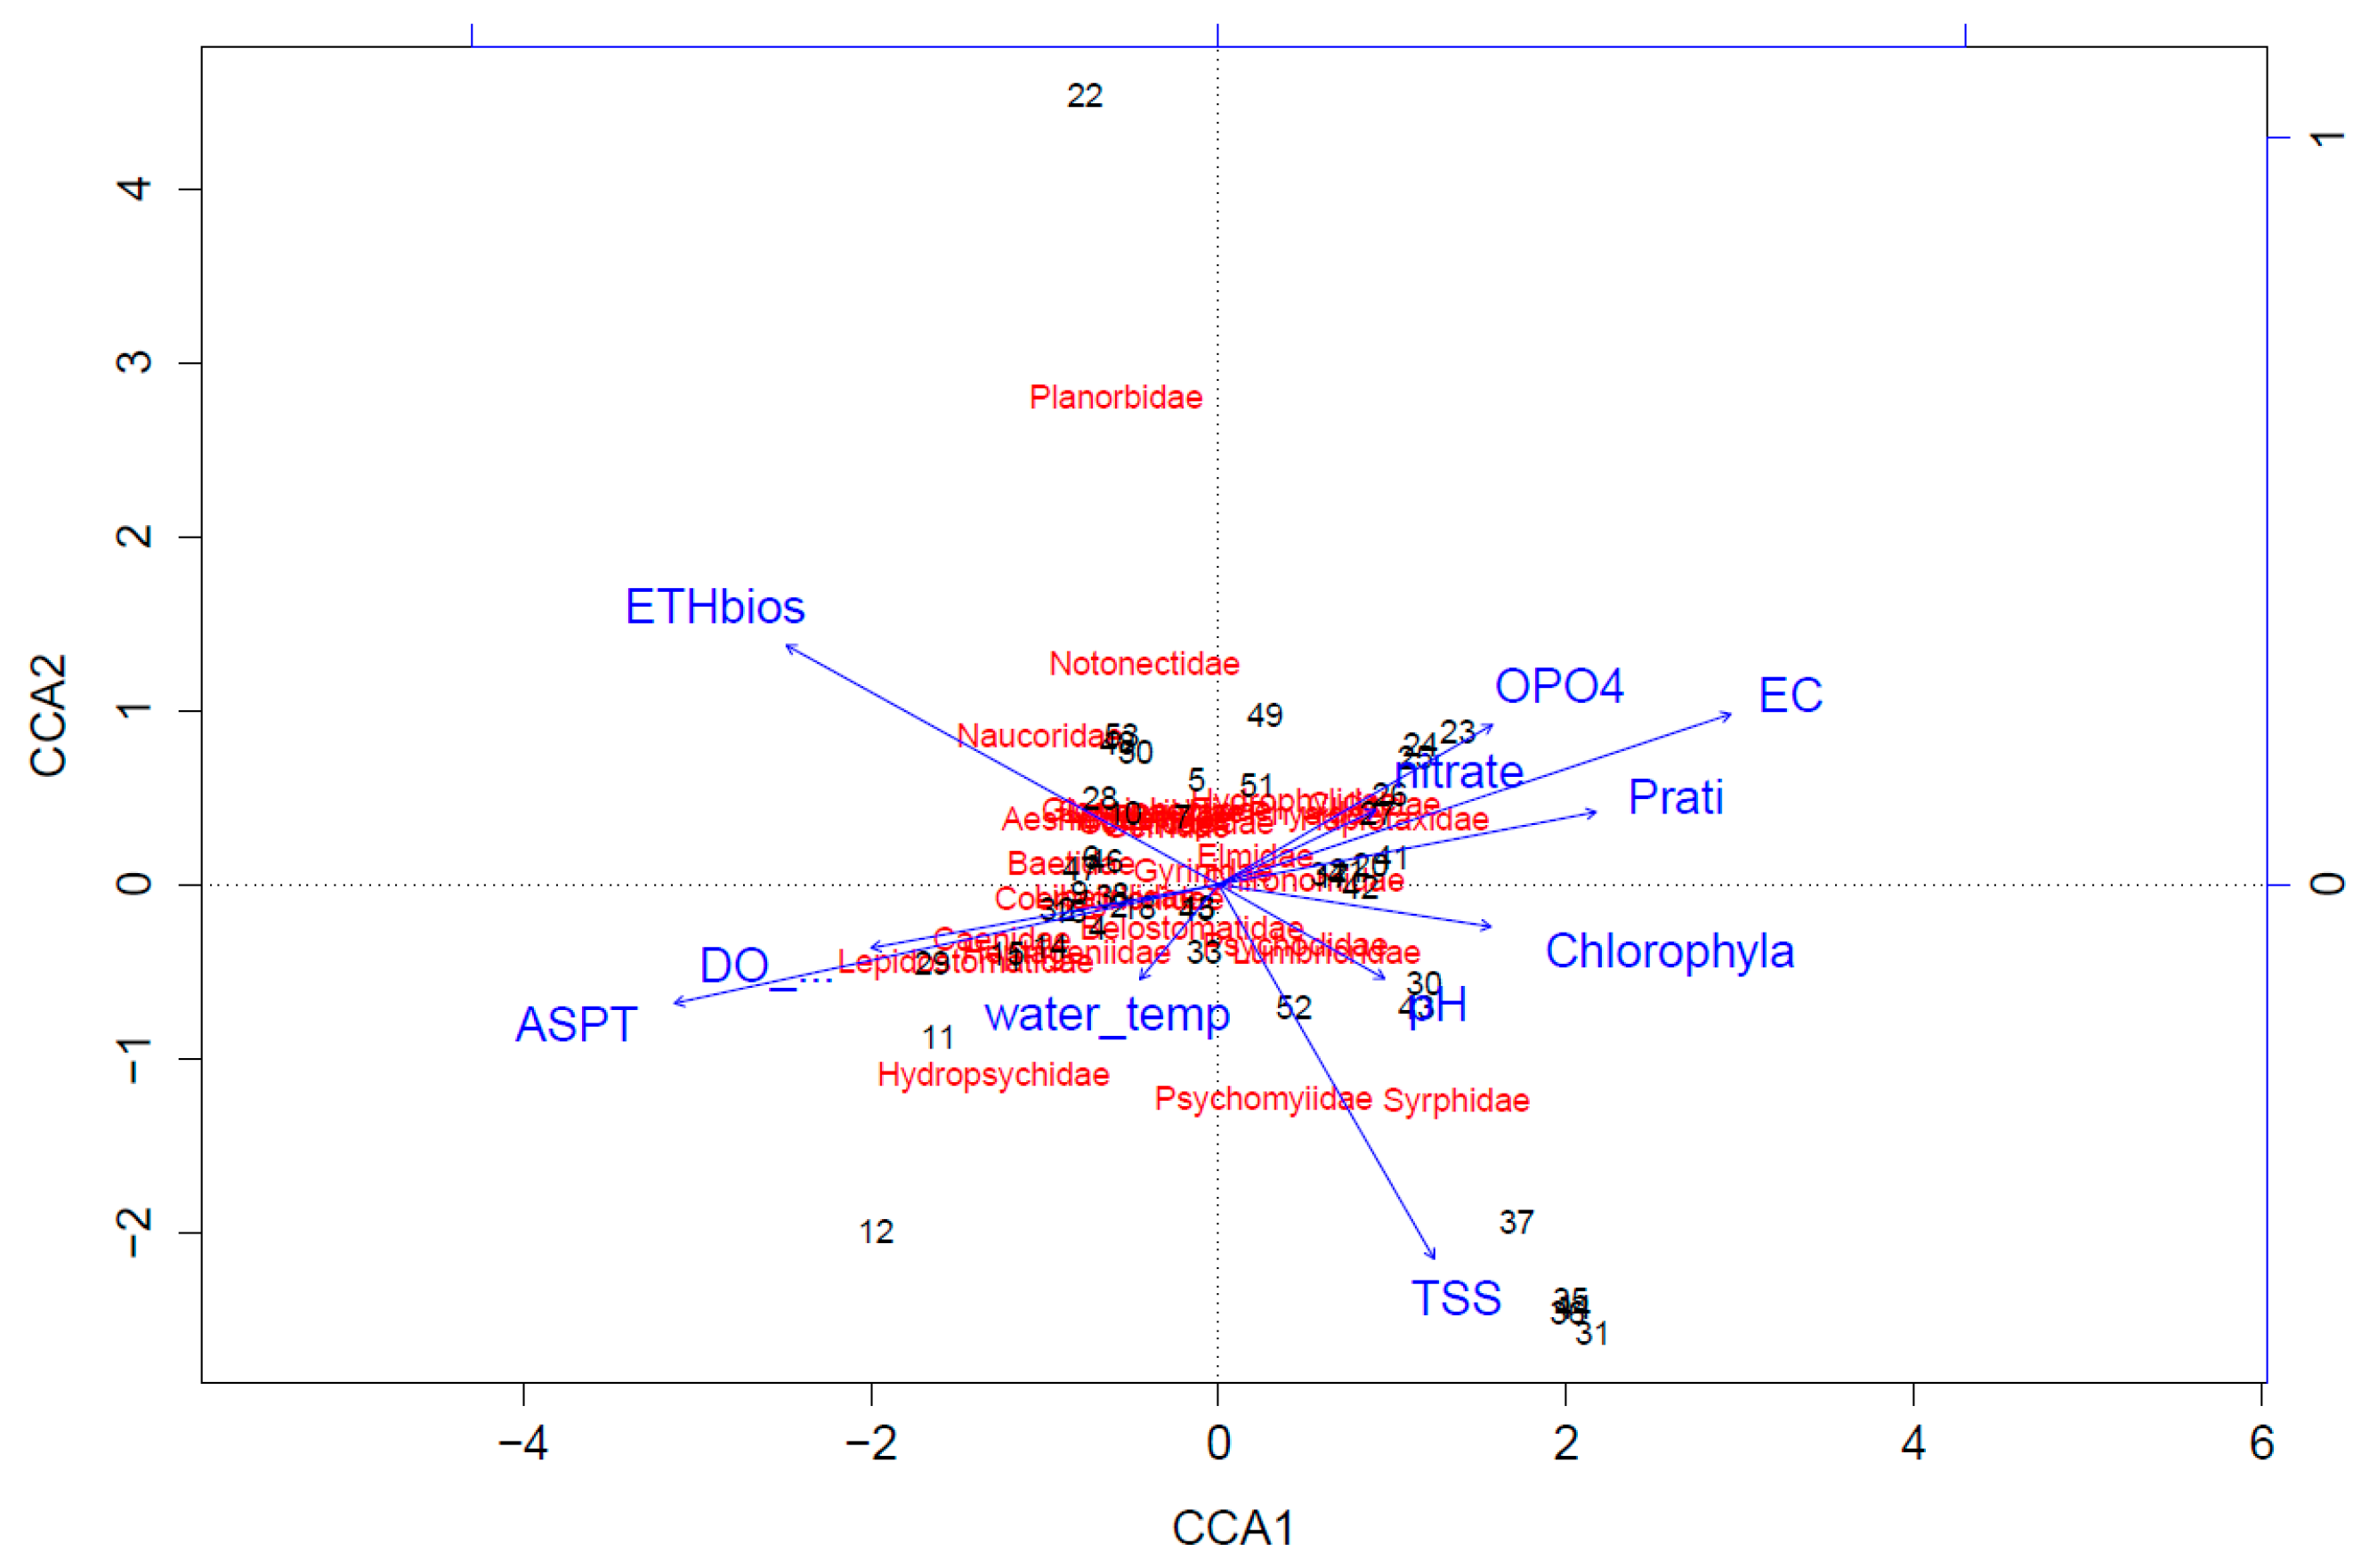
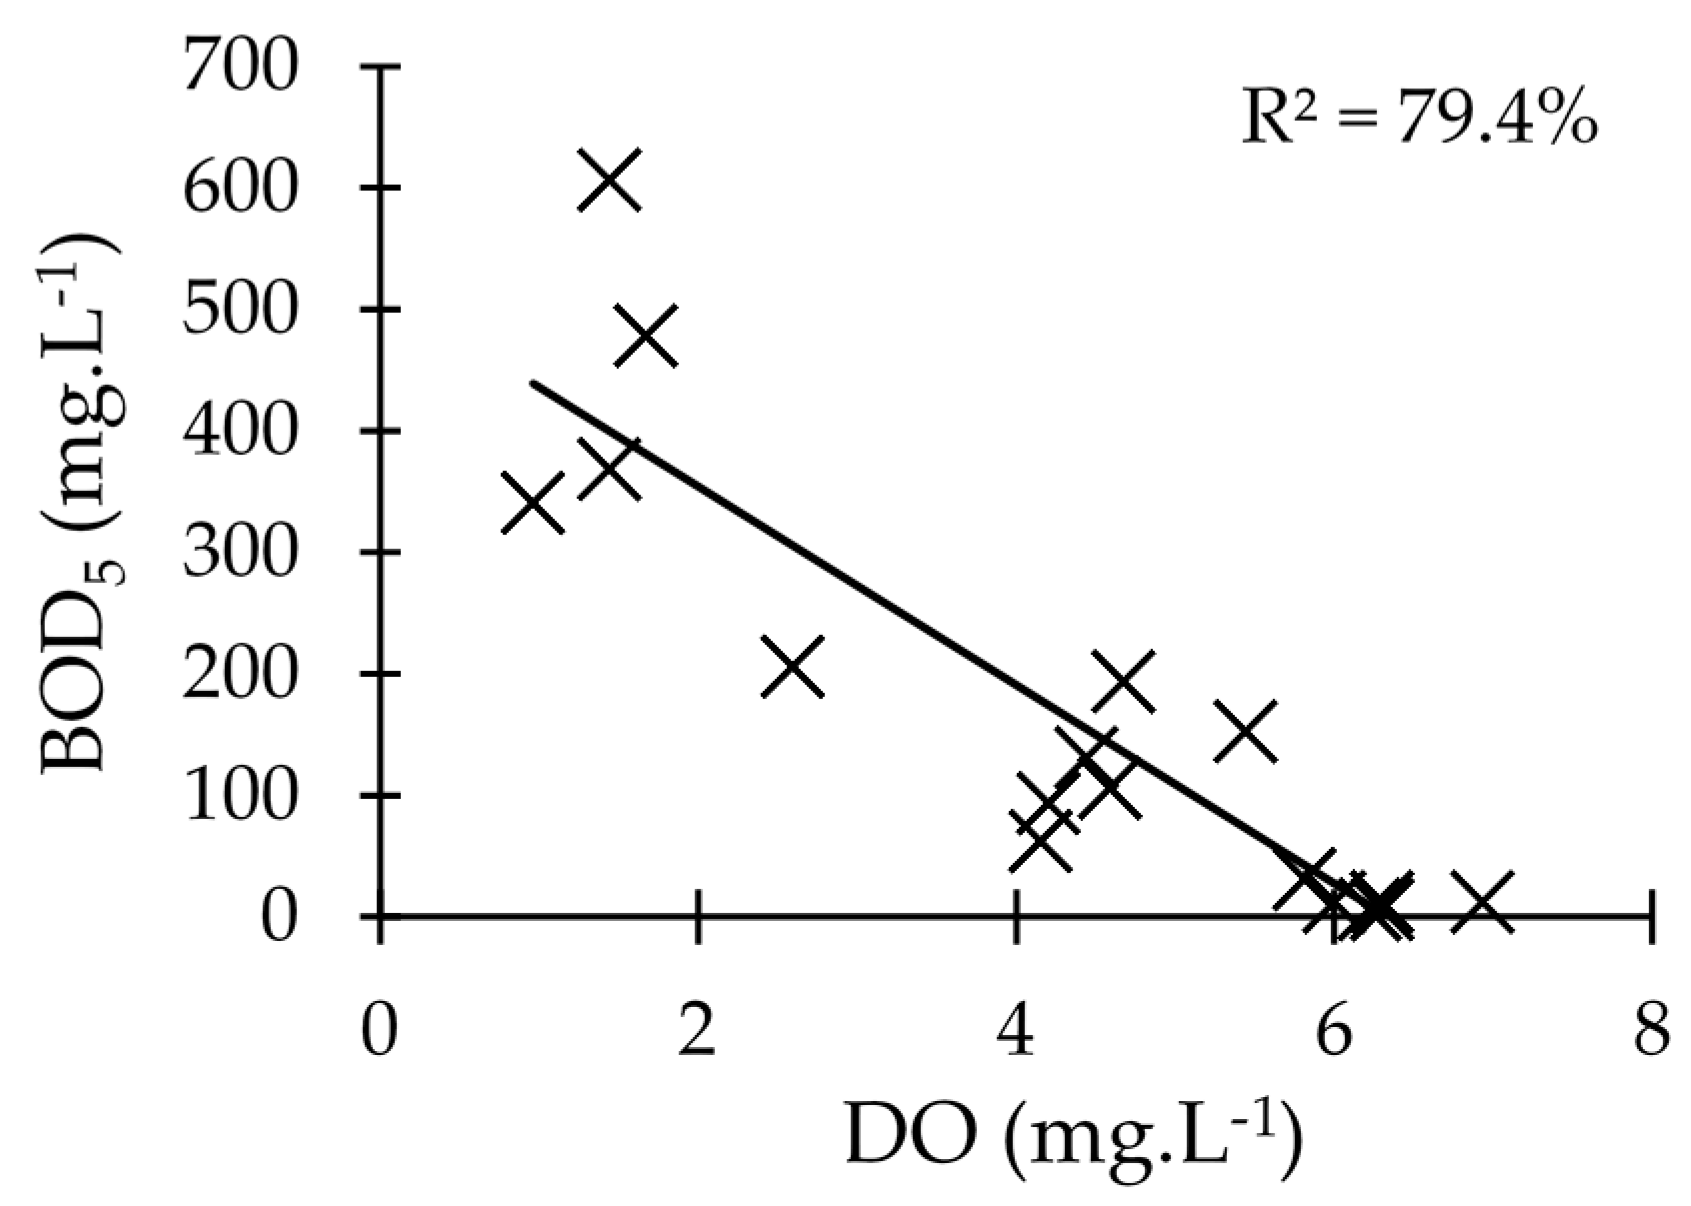
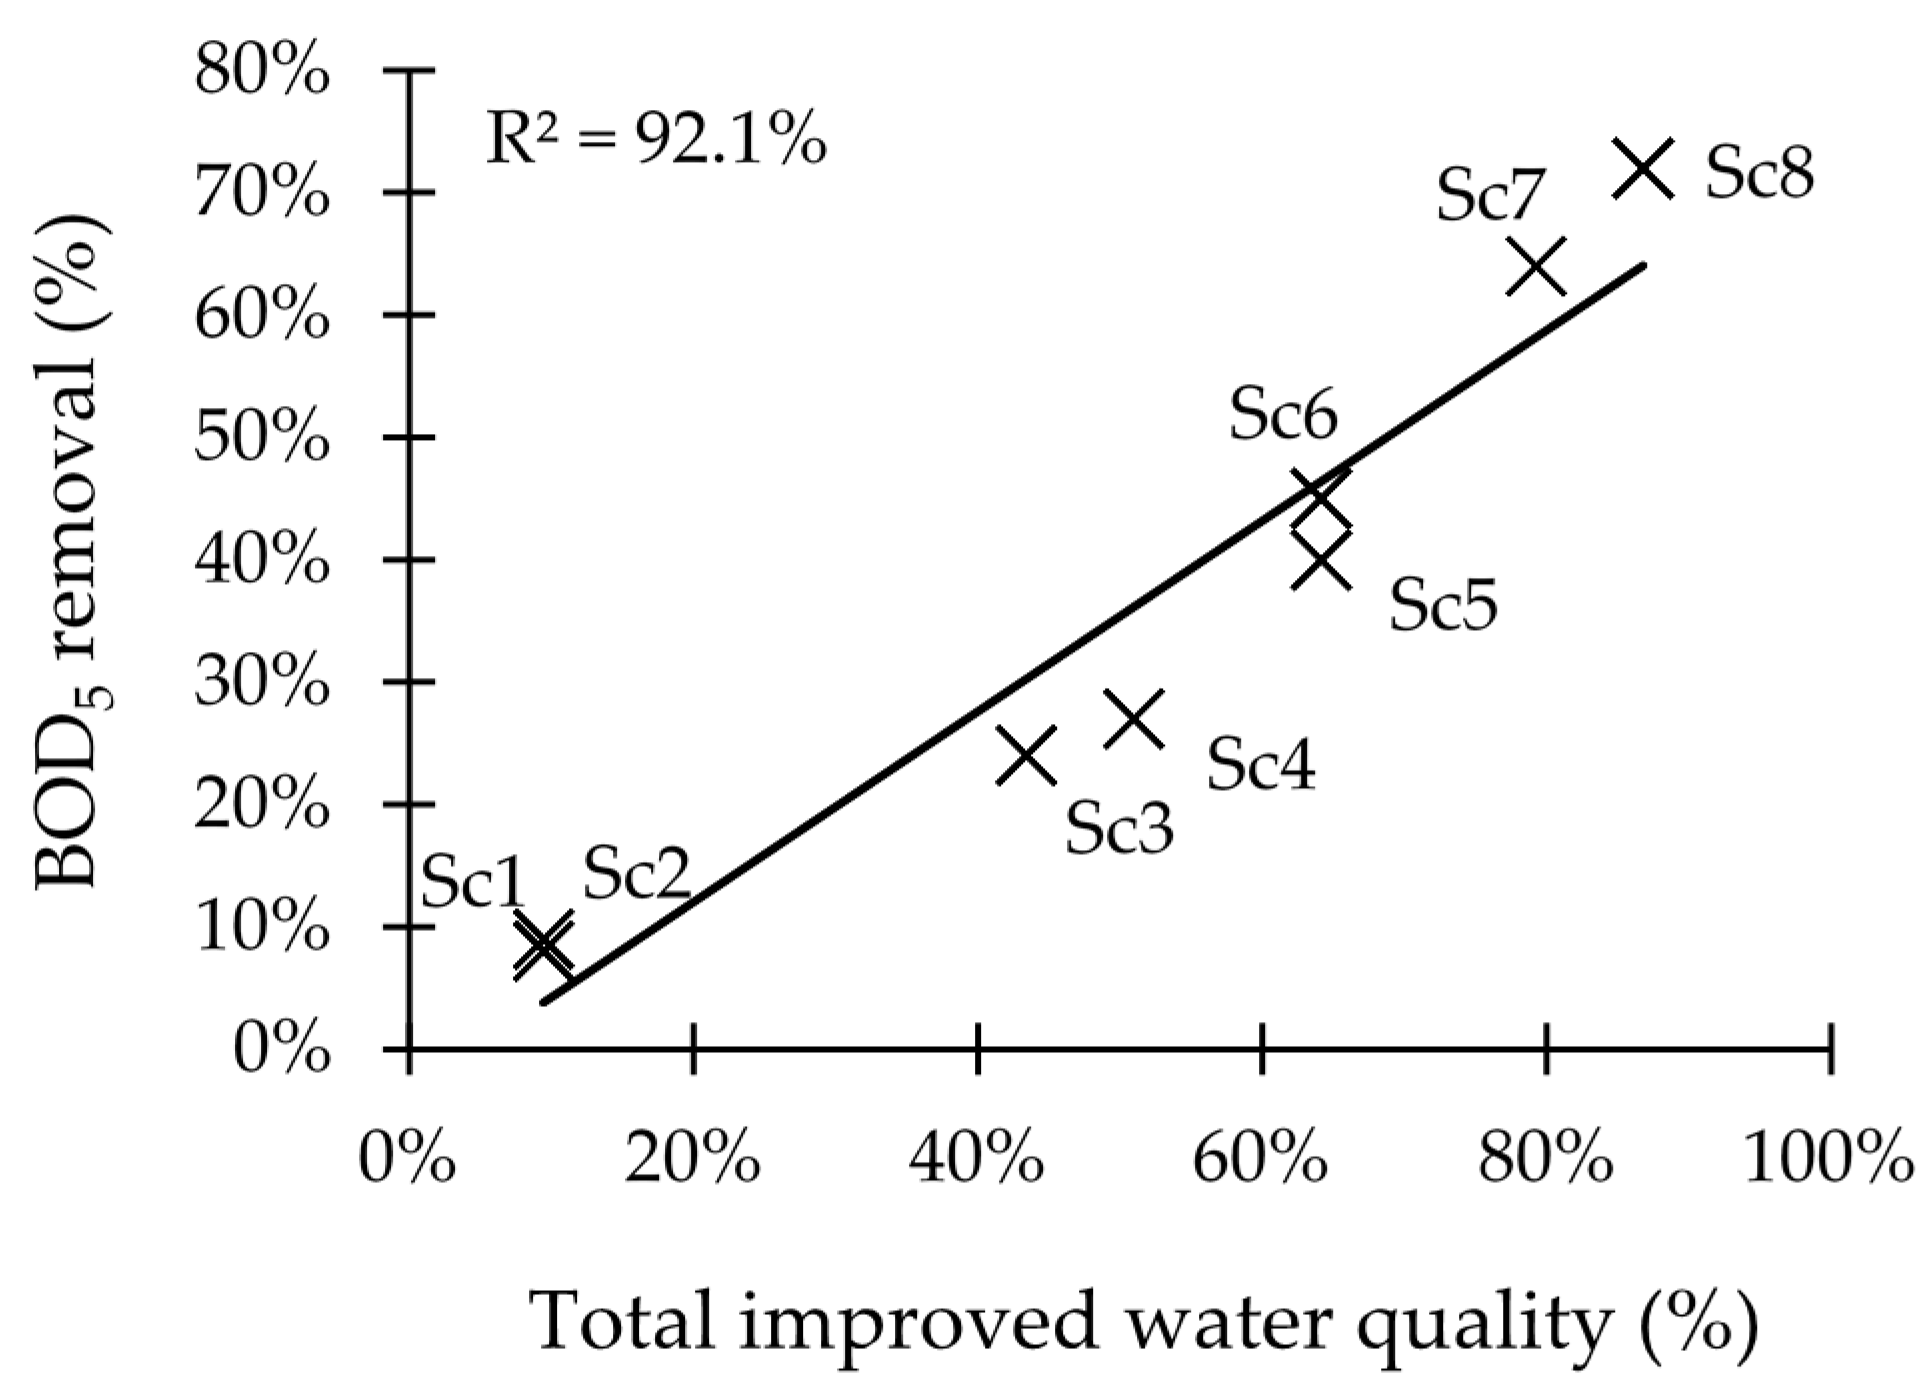
In order to reduce human-induced pollution (e.g., organics, nutrients, and chemicals) and to improve the water quality, it is imperative to tackle the major issues. There is an urgent need to have a proper sanitation infrastructure. The scenario analysis reveals that more locations show better chemical water quality if less organics enter the river ecosystem due to reduced oxygen consumption by biological reactions. This will also have a positive effect on the ecological water quality (ETHbios) according to the CCA plot. The results from this model should be seen as indicative, as it only considers dissolved oxygen and organics while surface water quality depends on several other water characteristics such as nutrient status, pH, heavy metals, EC, turbidity, minerals, temperature, hydromorphology, and biological factors [42]. Nonetheless, efficient protection of the freshwater environment from organic pollution can be achieved via connecting more people to the sewerage system (increase α) that transports sewage to WWTPs with high removal efficiencies (increase ε). After that, the implementation of WWTPs to treat the wastewater from Jimma University, the WSP at Jimma University technology campus, and the prison facility, which are the major point sources of pollution in this research, could lead to a significant improvement of the chemical water quality of the adjacent freshwater ecosystems, indicating the necessity to treat this type of wastewater.
Regarding wastewater treatment technologies, the conventional activated sludge system (CAS) has proven to be very efficient, but from a financial point of view it is more interesting to invest in waste stabilization ponds (WSP) and constructed wetlands (CW) in developing countries. According to Mburu et al. [27], the total cost ranges from 12 to 33 €·PE−1·year−1, of which the highest cost is related to land purchase, whereas the cost for operating a CAS is at least three times higher. A disadvantage of the proposed systems is the area they require: 4 to 25 times more than a CAS does [27]. Mara [43] state that a CW requires more land and is thus more expensive than a WSP, making the latter a more attractive technology. Next to cost and land use, the performance of the treatment systems need to be taken into consideration. Mburu et al. [27], for example, tested the performance of a WSP and a horizontal subsurface flow constructed wetland (HSSF-CW) in Juja town (Kenya). The authors reported removal efficiencies of 91% for BOD5 and TSS, 76% for COD, 56% for NH4+-N, and 21% for TP (total phosphorous), leading to the conclusion that the amount of organics is more reduced in the treatment system than the nutrient level. This is even more pronounced in the results of the unplanted HSSF-CW: 83% reduction for BOD5, 77% for COD, 71% for TSS, and 13% for the TP. The model used for the scenario analyses in this research predicts the chemical water quality based on this high removal efficiency of organics, explaining the strong decrease in oxygen Prati values for the point sources of pollution. However, the discharge of nutrients also has a substantial influence on the water quality, as this may lead to eutrophication, indicating the importance of implementing this factor in the model. This may be particularly important near Jimma University and the prison facility, as the nutrients level in the river increase strongly after passing these point sources of pollution. Additionally, the ecological water quality is affected by the nutrient status. Stronger reduction in nutrients will not only be beneficial for the chemical water quality, but will have a positive effect on the macroinvertebrate community and will probably lead to better ecological water quality [42]. In general, the performance mainly depends on the type of macrophytes used, system configuration, pollutant loading, hydrologic regime, and temperature [44]. Regarding the latter, the tropical climate ensures relatively high temperatures and radiation, allowing year-round plant growth in CW and an increase in the microbiological activity which improves the pollutant removal efficiency [45]. WSPs and CWs are also known to reduce the level of pathogens significantly, making it a promising technology to reduce the fecal contamination of the assessed rivers [46,47,48]. This was observed in our study for the natural wetland of Boye, indicating the importance of these ecosystems for ecosystem services. A final advantage of WSPs and CWs is the high performance reliability, meaning that the probability of malfunctioning is low once they are properly designed, built, operated, and maintained [49]. We recommend treating wastewater first in a WSP before it goes to a CW in order to prevent overloading of the latter [50]. Finally, the combined system should be designed in such a way that the water from the rivers in Jimma can be used at least for agricultural and domestic activities in a safe way.
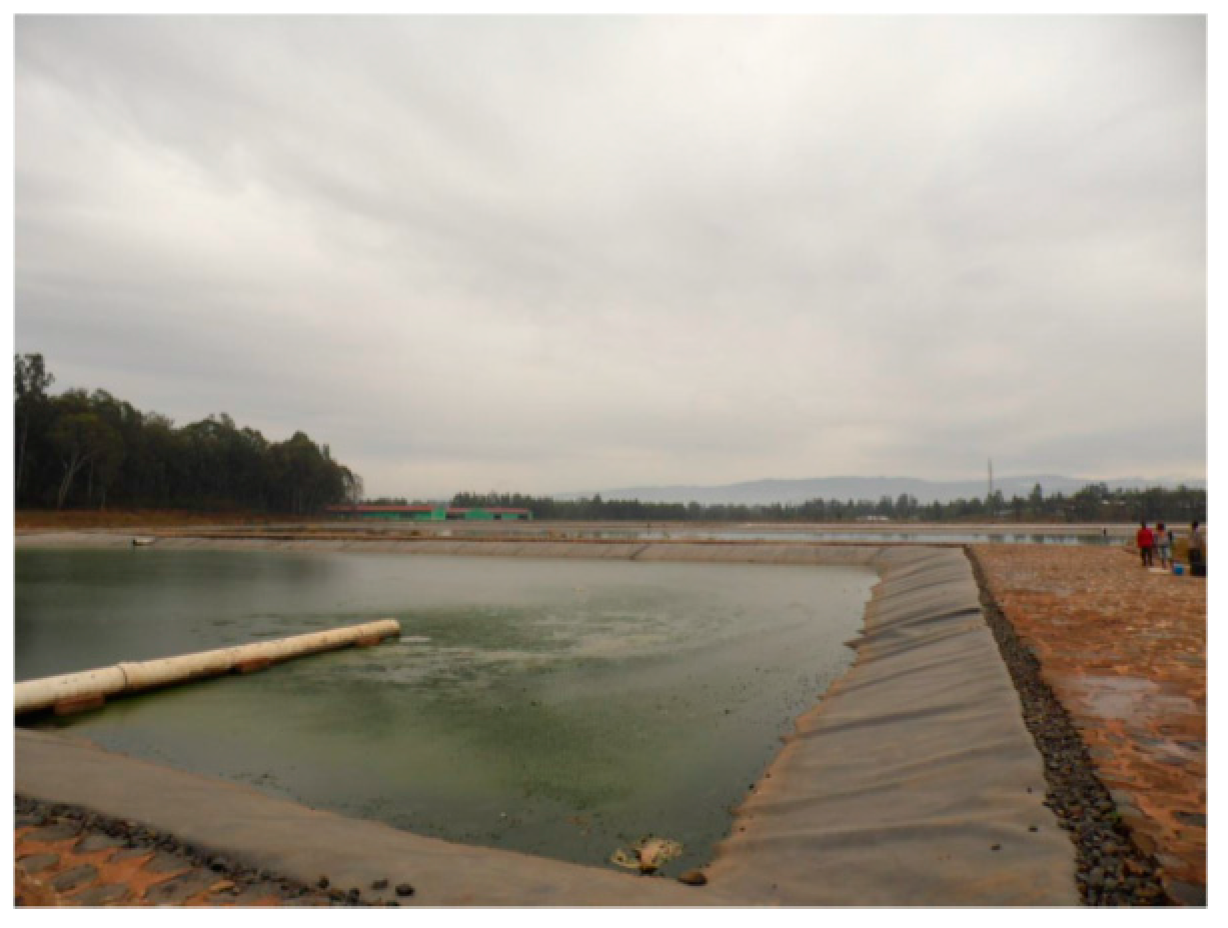
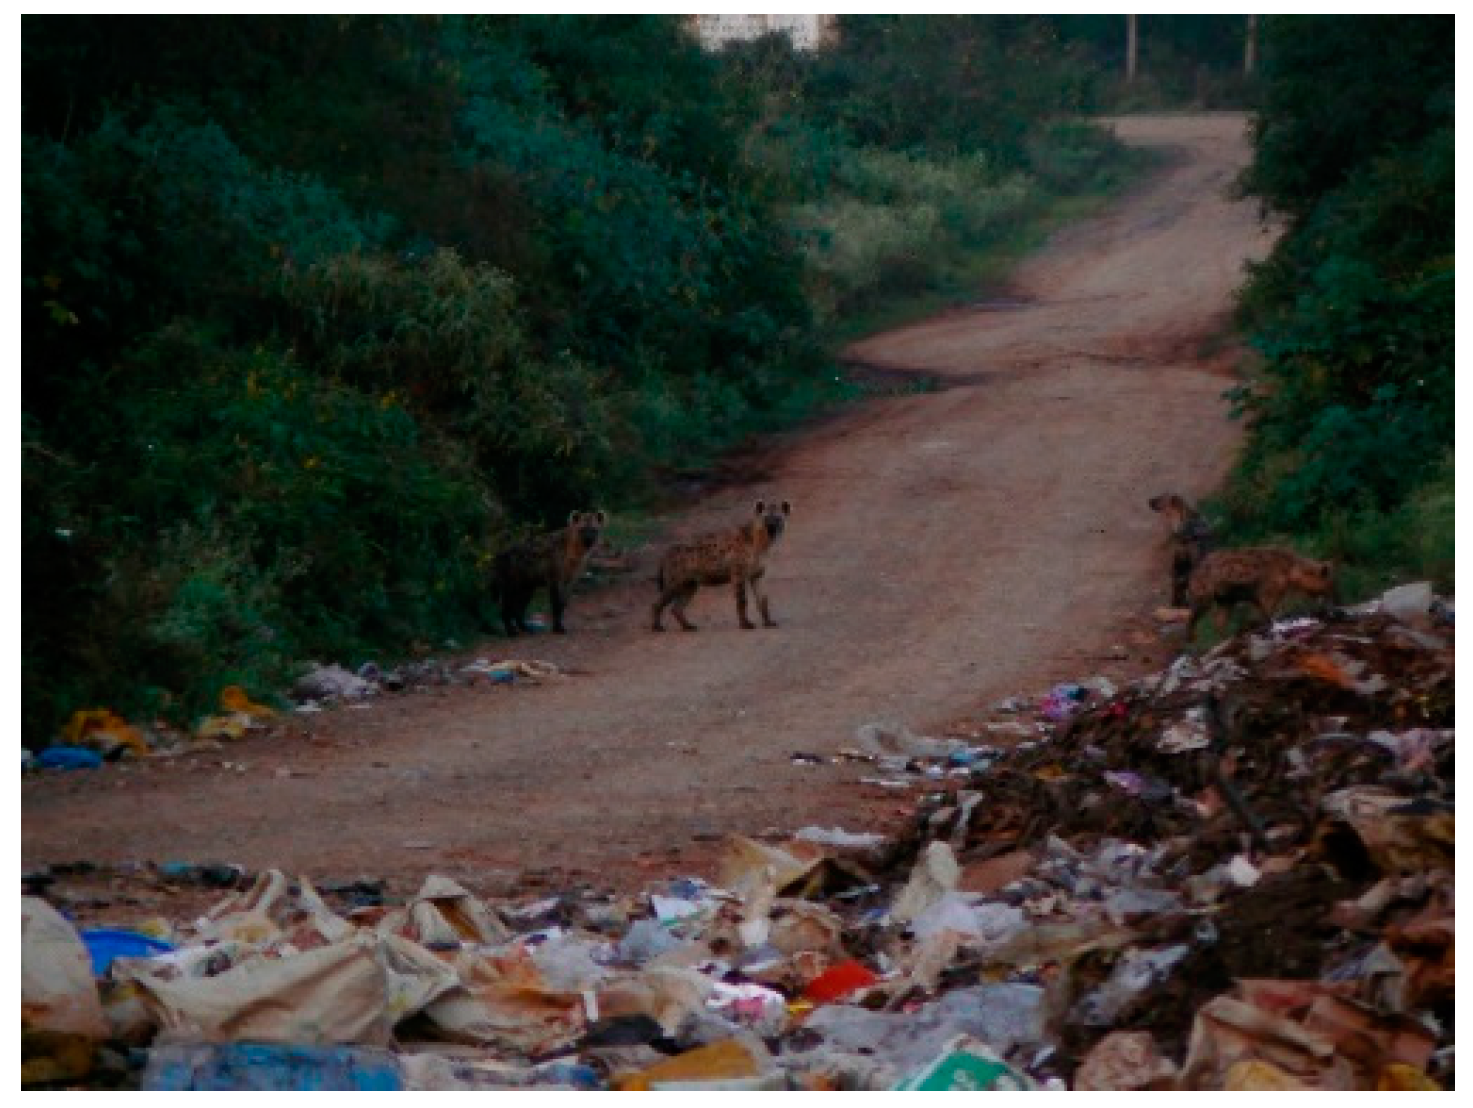
Diffuse sources of pollution are more difficult to address than point sources. In Jimma, there are already some initiatives that deal with solid waste. Containers are placed in overcrowded residential and commercial areas and are emptied by the municipality. Additionally, a few microscale enterprises collect waste from door to door. Afterwards, the garbage is dumped at a site on the road from Jimma to Seka near Kito Wetland (Figure 11). Getahun et al. [51] estimated that only 25% of the community uses the municipal containers, and private waste collection applies to only 2% of the households. The majority of the population (51%) still randomly dumps their waste or incinerates it at an open area (22%).
An improvement of the current waste management is indispensable for sustainable development. Firstly, environmental awareness of the community should be increased. This can be achieved via sensitization of people (e.g., signboards, group discussions, media, posters, and education) and reinforcement of environmental laws, the lack of which currently impedes correct waste management. In general, collaboration between public and private sectors is essential [51]. Next to NGOs and the Ethiopian government, Jimma University is perceived as a centre of excellence regarding this matter [52]. It is Ethiopia’s first innovative community-oriented education institution of higher learning. Teaching, research, extension, and public services are the core tasks of the university. Practical training and education has been given through community-based education (CBE). Students involved in this program learn to assess environmental issues in the community for which an action plan has to be developed. This plan is implemented via mobilization of the community and participation of private and governmental sectors [53].
Secondly, as waste is inevitable, collection and waste treatment should be reconsidered and optimized. In the Waste Framework Directive 2008/98/EC [54], incineration without gas treatment and uncontrolled dumping are detrimental for the environment and should thus be avoided. On the other hand, recycling, composting, and waste incineration with energy recovery are technologies that are very promising in that they treat waste in a sustainable way. Incineration facilities with energy recovery and gas treatment, which are used in many developed countries, imply a relative high financial start-up and operational capital, making it difficult to successfully implement in developing countries [55]. On the contrary, as 30% of the generated waste in Jimma is recyclable and 54% is biodegradable, there is a high potential for material recovery and conversion of waste into an economic valuable product through composting and recycling [51]. However, there are some important factors impeding the implementation of these technologies. According to Troschinetz & Mihelcic [56], socio-economic status is surprisingly not the limiting factor, but personnel education, waste collection and segregation, and government finances are considered to be the three biggest barriers to recycling in developing countries.

5. Conclusions

Jimma’s lack of proper waste management has a huge impact on the freshwater ecosystems in the city. The discharge of solid waste and untreated domestic, institutional and industrial wastewater has led to alarmingly low levels of dissolved oxygen due to organic pollution and high nutrient concentrations at several locations (exceeding standards). Especially Jimma University and the prison facility threaten the rivers’ ecological status via direct discharge of untreated wastewater. Due to this lack of proper sanitation there is a strong fecal contamination of the water. Additionally, erosion is a major problem in the Gilgel Gibe catchment affecting the water quality in an adverse way. In general, the rivers from Jimma have poor ecological water quality and are declared to be polluted according to the used biological and chemical indices, which are useful tools for water quality assessment.
A significant improvement of the water quality can be achieved by connecting households, institutions, and factories to a sewerage system that transports sewage to a wastewater treatment plant. For developing countries, waste stabilization ponds and constructed wetland are among the most feasible options to treat wastewater. Finally, the solid waste management has to be revised to make the current situation more sustainable. Sensitization, education, and law reinforcement is necessary to increase awareness while sustainable technologies for material and energy recovery need to be implemented (composting and recycling). Reduce, reuse, and recycle (3Rs) are key words in the evolution towards a proper solid waste management.

Acknowledgments

This research was funded by the IUC-JU-VLIR partnership programme, which constitutes a collaboration between Jimma University and the different Flemish universities. The authors would like to thank the VLIR-UOS for the financial support, the local staff, Thijs Nouws, and Matthias Desmet who did most of the sampling work. Pieter Boets was supported by a post-doctoral fellowship from the Research Foundation Flanders.

Author Contributions

Niels De Troyer has collected the data and has written the paper. Seid Tiku Mereta has been helping in collecting the data and writing the paper. Peter L. M. Goethals has been helping in data analysis and writing the paper. Pieter Boets conceived the main ideas of the paper and has been helping with data analysis and writing the paper.

Conflicts of Interest

The authors declare no conflict of interest.

Appendix

Table A1. Measured flow velocity on several locations in Zones A, B, C, and D.
LocationRiver flow (m.s−1).
Zone A
 Kt10.48
 Kt20.21
 Kt30.21
 Kt40.39
 Aw10.60
 Aw20.40
 Awb10.48
 Aw40.40
Zone B
 Kt50.43
 Kt70.36
 Aw60.32
 Aw70.04
 Aw80.30
 DP10.30
 U10.40
 U20.27
 U30.50
 U40.40
 U50.60
 U60.80
 U70.22
 A10.30
 A20.10
 A30.26
 U80.37
 U90.35
 DO10.46
Zone C
 Aw100.67
 DO20.32
 B10.11
Zone D
 B80.17
Figure A1. Boxplots of the different zones (A, B, C, and D) for the variables pH, TDS (total dissolved solids), T (temperature), Cl (chloride), chlorophyll a, and turbidity.
Water 08 00123 g012

References

  1. Aylward, B.; Bandyopadhyay, J.; Belausteguigotia, J. Chapter 7: Freshwater Ecosystem Services. In Ecosystems and Human Well-Being: Policy Responses; Island Press: Washington, DC, USA, 2005; pp. 215–255. [Google Scholar]
  2. Montgomery, M.A.; Elimelech, M. Water and Sanitation in Developing Countries: Including Health in the Equation. Environ. Sci. Technol. 2007, 41, 17–24. [Google Scholar] [CrossRef] [PubMed]
  3. WHO/UNICEF. Progress on Sanitation and Drinking Water, 2015 Update and MDG Assessment; UNICEF: New York, NY, USA, 2015. [Google Scholar]
  4. Haddis, A.; Getahun, T.; Mengistie, E.; Jemal, A.; Smets, I.; Van der Bruggen, B. Challenges to Surface Water Quality in Mid-Sized African Cities: Conclusions from Awetu-Kito Rivers in Jimma, South-West Ethiopia. Water Environ. J. 2014, 28, 173–182. [Google Scholar] [CrossRef]
  5. Beyene, A.; Hailu, T.; Faris, K.; Kloos, H. Current State and Trends of Access to Sanitation in Ethiopia and the Need to Revise Indicators to Monitor Progress in the Post-2015 Era. BMC Public Health 2015, 15. [Google Scholar] [CrossRef] [PubMed]
  6. World Bank Group. Ethiopia Poverty Assessment; The World Bank: Washington, DC, USA, 2015. [Google Scholar]
  7. Van der Bruggen, B.; Smets, I.Y.; Haddis, A. Impact of Wastewater Discharge in Jimma, Ethiopia, and Remediation Possibilities. Desalination 2009, 248, 603–609. [Google Scholar] [CrossRef]
  8. Mereta, S.T.; Boets, P.; De Meester, L.; Goethals, P.L.M. Development of a Multimetric Index Based on Benthic Macroinvertebrates for the Assessment of Natural Wetlands in Southwest Ethiopia. Ecol. Indic. 2013, 29, 510–521. [Google Scholar] [CrossRef]
  9. Metcalfe, J.L. Biological Water Quality Assessment of Running Waters Based on Macroinvertebrate Communities: History and Present Status in Europe. Environ. Pollut. 1989, 60, 101–139. [Google Scholar] [CrossRef]
  10. Holguin-Gonzalez, J.E.; Boets, P.; Everaert, G.; Pauwels, I.S.; Lock, K.; Gobeyn, S.; Benedetti, L.; Amerlinck, Y.; Nopens, I.; Goethals, P.L.M. Development and Assessment of an Integrated Ecological Modeling Framework to Assess the Effect of Investments in Wastewater Treatment on Water Quality. Water Sci. Technol. 2014, 70, 1798–1807. [Google Scholar] [CrossRef] [PubMed]
  11. Köppen, W. Das Geographische System Der Klimate. In Handbuch der Klimatologie; Gebrüder Borntraeger: Berlin, Germany, 1936; pp. 1–44. [Google Scholar]
  12. Central Statistical Agency. Statistical Report On the 2015 Urban Employment Unemployment Survey; Central Statistical Agency: Addis Ababa, Ethiopia, 2015.
  13. Abegaz, T.; Legesse, W.; Tiku, S. Determination of Critical Concentration and Diurnal Variation of Dissolved Oxygen (DO) in Relation to Physicochemical Variables in Boye Pond, Southwestern Ethiopia. Afr. J. Environ. Assess. Manag. 2005, 10, 66–76. [Google Scholar]
  14. Asha, A.; Tekola, B.; Gudissa, D.; Demille, H.; Tesfu, M.; Musie, R. Arada Area (Kebele 08/09), Shashemene; Ethiopian Urban Studies; University of Bath: Bath, UK, 2006. [Google Scholar]
  15. Mazumder, D. Scope of BOD, Nitrogen and Phosphorous Removal through Plant-Soil Interaction in the Wetland. Int. J. Environ. Chem. Ecol. Geol. Geophys. Eng. 2013, 7, 82–91. [Google Scholar]
  16. Wandiga, S.O. Rivers in Africa Are in Jeopardy. In Monitoring Water Quality: Pollution Assessment, Analysis and Remediation; Elsevier: Oxford, UK, 2013; pp. 59–80. [Google Scholar]
  17. Clescerl, L.S.; Greenberg, A.E.; Eaton, A.D. Standard Methods for the Examination of Water and Wastewater, 20th ed.; American Public Health Association: Washington, DC, USA, 1999. [Google Scholar]
  18. Randall, D.J.; Tsui, T.K.N. Ammonia Toxicity in Fish. Mar. Pollut. Bull. 2002, 45, 17–23. [Google Scholar] [CrossRef]
  19. Bartram, J.; Ballance, R. Water Quality Monitoring: A Practical Guide to the Design and Implementation of Freshwater Quality Studies and Monitoring Programmes; E. & F.N. Spon: London, UK, 1996. [Google Scholar]
  20. Gabriels, W.; Lock, K.; De Pauw, N.; Goethals, P.L.M. Multimetric Macroinvertebrate Index Flanders (MMIF) for Biological Assessment of Rivers and Lakes in Flanders (Belgium). Limnol. Ecol. Manag. Inland Waters 2010, 40, 199–207. [Google Scholar] [CrossRef]
  21. Bouchard, R.W. Guide to Aquatic Invertebrates of the Upper Midwest: Identification Manual for Students, Citizen Monitors, and Aquatic Resource Professionals; University of Minnesota, Water Resources Research Center: St Paul, MN, USA, 2004. [Google Scholar]
  22. McCafferty, W.P. Aquatic Entomology: The Fishermen’s and Ecologists’ Illustrated Guide to Insects and Their Relatives; Jones & Bartlett Learning: Burlington, MA, USA, 1983. [Google Scholar]
  23. Tachet, H. Invertébrés D’eau Douce: Systématique, Biologie, écologie; Centre National de la Recherche Scientifique: Paris, France, 2010.
  24. Aschalew, L.; Moog, O. Benthic Macroinvertebrates Based New Biotic Score “ETHbios” for Assessing Ecological Conditions of Highland Streams and Rivers in Ethiopia. Limnologica 2015, 52, 11–19. [Google Scholar]
  25. Steinskog, D.J.; Tjøstheim, D.B.; Kvamstø, N.G. A Cautionary Note on the Use of the Kolmogorov–Smirnov Test for Normality. Am. Meteorol. Soc. 2007, 135, 1151–1157. [Google Scholar] [CrossRef]
  26. The R Core Team. R: A Language and Environment for Statistical Computing; R Foundation for Statistical Computing: Vienna, Austria, 2015. [Google Scholar]
  27. Mburu, N.; Tebitendwa, S.M.; van Bruggen, J.J.A.; Rousseau, D.P.L.; Lens, P.N.L. Performance Comparison and Economics Analysis of Waste Stabilization Ponds and Horizontal Subsurface Flow Constructed Wetlands Treating Domestic Wastewater: A Case Study of the Juja Sewage Treatment Works. J. Environ. Manag. 2013, 128, 220–225. [Google Scholar] [CrossRef] [PubMed]
  28. Kivaisi, A.K. The Potential for Constructed Wetlands for Wastewater Treatment and Reuse in Developing Countries: A Review. Ecol. Eng. 2001, 16, 545–560. [Google Scholar] [CrossRef]
  29. Getahun, A.H. Performance of Horizontal Subsurface Flow Constructed Wetlands for Treating Irregular Wastewater Flow in a Tropical Climate. Ph.D. Thesis, KU Leuven, Leuven, Belgium, 2014. [Google Scholar]
  30. Vlaamse Milieumaatschappij (VMM). Riolerings—En Zuiveringsgraden per Gemeente; VMM: Aalst, Belgium, 2016. [Google Scholar]
  31. Baum, R.; Luh, J.; Bartram, J.; Rica, C. Sanitation: A Global Estimate of Sewerage Connections without Treatment and the Resulting Impact on MDG Progress. Environ. Sci. Technol. 2013, 47, 1994–2000. [Google Scholar] [CrossRef] [PubMed]
  32. United Nations Environment Programme (UNEP). Review of Existing Water Quality Guidelines for Freshwater Ecosystems and Application of Water Quality Guidelines on Basin Level to Protect Ecosystems; UNEP: Nairobi, Kenya, 2014. [Google Scholar]
  33. Ministry of Water Resources (MOWR). Standards for Effluent Discharge Regulations; MOWR: Addis Ababa, Ethiopia, 2003.
  34. Departement Leefmilieu voor Natuur en Energie (LNE). Bijlagen Titel II van Het VLAREM; LNE: Brussel, Belgium, 2015. [Google Scholar]
  35. Dancey, C.P.; Reidy, J. Statistics without Maths for Psychology: Using SPSS for Windows; Pearson Education: Harlow, UK, 2004. [Google Scholar]
  36. Lencha, B.K.; Moges, A. Identification of Soil Erosion Hotspots in Jimma Zone (Ethiopia) Using GIS Based Approach. Ethiop. J. Environ. Stud. Manag. 2015, 8, 926–938. [Google Scholar] [CrossRef]
  37. Ayalew, A. Construction of Soil Conservation Structures for Improvement of Crops and Soil Productivity in the Southern Ethiopia. J. Environ. Earth Sci. 2011, 1, 21–29. [Google Scholar]
  38. Devi, R.; Tesfahune, E.; Legesse, W.; Deboch, B.; Beyene, A. Assessment of Siltation and Nutrient Enrichment of Gilgel Gibe Dam, Southwest Ethiopia. Bioresour. Technol. 2008, 99, 975–979. [Google Scholar] [CrossRef] [PubMed]
  39. Amede, T. Restoring Soil Fertility in the Highlands of East Africa through Participatory Research; African Highlands Initiative: Kampala, Uganda, 2003. [Google Scholar]
  40. Wicklein, S.M. Evaluation of Water Quality for Two St. Johns River Tributaries Receiving Septic Tank Effluent, Duval County, Florida; DIANE Publishing: Collingdale, PA, USA, 2004. [Google Scholar]
  41. Demissie, S.; Kebede, G.; Muleta, D.; Dabassa, A. Microbiological Analysis of Aweturiver and the Proteolytic and Lipolytic Activities of the Microbial Isolates. J. Med. Sci. 2013, 13, 141–145. [Google Scholar] [CrossRef]
  42. Abbasi, T.; Abbasi, S.A. Water Quality Indices; Elsevier: Oxford, UK, 2012. [Google Scholar]
  43. Mara, D.D. Constructed Wetlands and Waste Stabilization Ponds for Small Rural Communities in the United Kingdom: A Comparison of Land Area Requirements, Performance and Costs. Environ. Technol. 2006, 27, 753–757. [Google Scholar] [CrossRef] [PubMed]
  44. Zhang, C.; Zeng, G.; Yuan, L.; Yu, J.; Li, J.; Huang, G.; Xi, B.; Liu, H. Aerobic Degradation of Bisphenol A by Achromobacter Xylosoxidans Strain B-16 Isolated from Compost Leachate of Municipal Solid Waste. Chemosphere 2007, 68, 181–190. [Google Scholar] [CrossRef] [PubMed]
  45. Kaseva, M.E. Performance of a Sub-Surface Flow Constructed Wetland in Polishing Pre-Treated Wastewater—A Tropical Case Study. Water Res. 2004, 38, 681–687. [Google Scholar] [CrossRef] [PubMed]
  46. Awuah, E. Pathogen Removal Mechanisms in Macrophyte and Algal Waste Stabilization Ponds. Ph.D. Thesis, Wageningen University, Wageningen, The Netherlands, November 2006. [Google Scholar]
  47. Thurston, J.A.; Foster, K.E.; Karpiscak, M.M.; Gerba, C.P. Fate of Indicator Microorganisms, Giardia and Cryptosporidium in Subsurface Flow Constructed Wetlands. Water Res. 2001, 35, 1547–1551. [Google Scholar] [CrossRef]
  48. Reinoso, R.; Torres, L.A.; Bécares, E. Efficiency of Natural Systems for Removal of Bacteria and Pathogenic Parasites from Wastewater. Sci. Total Environ. 2008, 395, 80–86. [Google Scholar] [CrossRef] [PubMed]
  49. Rousseau, D.P.L.; Lesage, E.; Story, A.; Vanrolleghem, P.A.; De Pauw, N. Constructed Wetlands for Water Reclamation. Desalination 2008, 218, 181–189. [Google Scholar] [CrossRef]
  50. Mairi, J.P.; Lyimo, T.J.; Njau, K.N. Performance of Subsurface Flow Constructed Wetland for Domestic Wastewater Treatment. Tanzan. J. Sci. 2012, 38, 66–79. [Google Scholar]
  51. Getahun, T.; Mengistie, E.; Haddis, A.; Wasie, F.; Alemayehu, E.; Dadi, D.; Van Gerven, T.; Van der Bruggen, B. Municipal Solid Waste Generation in Growing Urban Areas in Africa: Current Practices and Relation to Socioeconomic Factors in Jimma, Ethiopia. Environ. Monit. Assess. 2012, 184, 6337–6345. [Google Scholar] [CrossRef] [PubMed]
  52. Filaba, M. Waste Management Problems in Jimma, Southern Ethiopia. Ethiop. J. Environ. Stud. Manag. 2008, 1, 8–15. [Google Scholar] [CrossRef]
  53. Jimma University. Guidelines and Procedures for Community Based Education; Jimma University: Jimma, Ethiopia, 2013. [Google Scholar]
  54. European Commision. Directive 2008/98/EC of the European Parliament and of the Council of 19 November 2008 on Waste and Repealing Certain Directives; European Commision: Brussels, Belgium, 2008. [Google Scholar]
  55. Rand, T.; Haukohl, J.; Marxen, U. Municipal Solid Waste Incineration, A Decision Maker’s Guide; The World Bank: Washington, DC, USA, 2000. [Google Scholar]
  56. Troschinetz, A.M.; Mihelcic, J.R. Sustainable Recycling of Municipal Solid Waste in Developing Countries. Waste Manag. 2009, 29, 915–923. [Google Scholar] [CrossRef] [PubMed]
Figure 1. Map of the study area with the rivers (blue lines) and wetlands (white squares) of Jimma. The orange dots represent four locations that visualize the area: (1) the upstream part of the river Shenkore is regarded as an area with little human disturbance; (2) the river banks of the streams around the university are highly polluted with solid waste; (3) short vegetation around the river Kito reveals agricultural activity (cattle grazing) impacting its ecological status; (4) Boye wetland, which is threatened by euthrophication, is home to many birds, such as the Black Crowned Crane.
Water 08 00123 g001
Figure 2. Map of the study area with the four different zones, the respective sampling points and the land use. Zones A, B, C, and D respectively represent the upstream, midstream, downstream, and recovery zones. The samplings points are indicated by Kt (Kito), Aw (Awetu), K (Kochi), S (Seto), A (Aramaic), U (University Stream), DP (Dipo), DO (Dololo), and B (Boye).
Water 08 00123 g002
Figure 3. Picture of the wastewater stabilization pond (WSP) that treats the wastewater from Jimma University Technology campus.
Water 08 00123 g003
Figure 4. Boxplots of the different zones (A, B, C, and D) for the variables DO (dissolved oxygen), oPO43− (orthophoshate), NO3 (nitrate), TAN (total ammoniacal nitrogen), EC (electrical conductivity), and TSS (total suspended solids).
Water 08 00123 g004
Figure 5. Visualization of the oxygen Prati index at every sampling location in Zones A, B, C, and D.
Water 08 00123 g005
Figure 6. Visualization of the ETHbios index at every sampling location in Zones A, B, C, and D.
Water 08 00123 g006
Figure 7. Canonical Correspondence Analysis (CCA) diagram showing the different macroinvertebrate taxa (red) and their correlation with environmental variables (blue vectors). The numbers indicate the sampling locations.
Water 08 00123 g007
Figure 8. Result of the linear regression analysis for BOD5 and DO. Data from Haddis et al. [4] was used to construct the regression line.
Water 08 00123 g008
Figure 9. The effect of BOD5 removal (i.e., αε according to Equation (1)) on the chemical water quality. The total improved water quality, which represents the latter, is the percentage of locations that were categorized in a higher chemical water quality class.
Water 08 00123 g009
Figure 10. Evolution of nutrient levels in Boye wetland.
Water 08 00123 g010
Figure 11. The uncontrolled dumping site of Jimma attracts scavenging hyenas. During the field visit on 3 November 2015, a bad smell was noticeable (due to sulphides and ammonia) and leachates from the heap were observed.
Water 08 00123 g011
Table 1. Water quality classes for the chemical and ecological assessments of the rivers of Jimma based on the Prati and ETHbios index, respectively.
ClassColorIndex ScoreInterpretation
PratiETHbiosPratiETHbios
1Blue0–1>115Good quality, not pollutedHigh quality, low level of degradation
2Green]1, 2]65–144Acceptable qualityGood quality, slight ecological degradation
3Yellow]2, 4]45–64PollutedModerate quality, significant ecological disturbance
4Orange]4, 8]12–44Heavily pollutedPoor quality, major degradation
5Red]8, 16]<12Very heavily pollutedBad water quality; heavily degraded
Table 2. Overview of the scenarios that resulted from the combination of the proposed sewerage connections (10%, 30%, 50%, and 80%) and the removal efficiencies of both a constructed wetland (80%) and a waste stabilization pond (90%).
ScenarioSewerage Connection (α)Removal Efficiency (ε)
Sc110%80%
Sc210%90%
Sc330%80%
Sc430%90%
Sc550%80%
Sc650%90%
Sc780%80%
Sc880%90%
Table 3. Statistical data (minimum, maximum, average, and standard deviation) of every measured variable for all locations, the standard guidelines from the Ethiopian Ministry of Water Resources (MOWR) [33], and the basic environmental water quality standards for a small river in Flanders [34].
Variable (unit)Min.Max.Average ± Standard DeviationMOWRFlanders
pH (-)58.37.0 ± 0.65–96.5–8.5
Temperature (°C)15.526.420.5 ± 2.6≤40≤25
EC (µS·cm−1)129.92155450.4 ± 425.3-≤600
TDS (mg·L−1)65.01056.9223.3 ± 211.7--
DO (mg·L−1)2.67.64.2 ± 1.2-≥6
DO (%)32.3104.156.2 ± 15.8-≤120
Turbidity (FNU)11.2>1000128.1 ± 144.3--
Chlorophyll a (mg·L−1)1.127316.6 ± 37.9--
TSS (mg·L−1)6.05232184.1 ± 716.1≤35≤50
oPO43− (mg·L−1)017.60.9 ± 2.9-≤0.12
Cl (mg·L−1)0155.027.4 ± 35.1≤750≤120
NO3 (mg·L−1)0.054.41.0 ± 1.2≤10≤5.65
TAN (mg·L−1)0.0718312.8 ± 33.1≤1-
NH3 (mg·L−1)05.690.37 ± 1.24-≤0.1
Table 4. Measurements of the variables DO, NO3, TAN, oPO43−, EC, and TSS before and after the considered point sources of pollution. These include the waste stabilization pond of the technology campus of Jimma University (WSPJU), Jimma University (JU), Jimma’s prison facility (Prison), the newly built abattoir (Snew), and the dry coffee processing plant (CP). The asterisks indicate large differences.
Point Sources of PollutionDO (%)NO3 (mg·L−1)TAN (mg·L−1)oPO43− (mg·L−1)
WSPJU
 Before (-)----
 After (Ktb1)432.10.40
JU
 Before (A1)42.83.615.66.6
 After (A2)32.3*4.4183*5
Prison
 Before (S1)59.20.50.80
 After (S2)39.2*0.8150*17.6*
Snew
 Before (Aw1)71.60.30.20
 After (Aw2)72.70.70.10.1
CP
 Before (Aw6)42.70.20.90.1
 After (Aw7)44.60.320
Table 5. Microbiological data of twelve sites. The upper detection limit of the analysis method was 320 MP·mL−1.
Locations (-)Total Coliforms TC (MPN·mL−1)Fecal Coliforms FC (MPN·mL−1)
Zone A
Kt1320>320
Aw2180320
K1320>320
Zone B
Aw6>320320
Kt7100180
U1>320>320
U7>320>320
U9>320>320
A1>320>320
Zone C
DO3320>320
B1>320>320
Zone D
B810026
Table 6. Prati values (and associated classes) near three point sources of pollution in the absence and presence of wastewater treatment systems.
Point SourcesOxygen Prati Index (-)
No TreatmentConstructed Wetland (α = 80%)Waste Stabilization Pond (α = 90%)
WSP Jimma University technology campus4.68 (class 4)1.97 (class 2)1.64 (class 2)
Prison5.10 (class 4)2.30 (class 3)1.97 (class 2)
Jimma University5.99 (class 4)2.39 (class 3)2.01 (class 3)

