Article

Salts Removal from Synthetic Solution-Potash Brine by Non-Planted Constructed Wetlands

Environmental Systems Engineering, Faculty of Engineering and Applied Science, University of Regina, 3737 Wascana Parkway, Regina, SK S4S 0A2, Canada
*
Author to whom correspondence should be addressed.
These authors contributed equally to this work.
Water 2016, 8(4), 113; https://doi.org/10.3390/w8040113
Submission received: 8 February 2016 / Revised: 13 March 2016 / Accepted: 21 March 2016 / Published: 24 March 2016
(This article belongs to the Special Issue Constructed Wetlands Systems and Management)

Abstract

:
Four pilot-scale non-planted constructed wetlands (CWs) were employed to study the fate and transport of the two dominant chloride salts contained in brine resulting from solution mining activities in the potash industry. The simulated brine contained a 10:1 ratio of NaCl:KCl based on authentic brine characteristics. The multi-layer soils functioned as a main salt filtering component comprising of Regina Clay, sand and gravels. The CW systems were operated in three batches of 16 days (experiments 1–3). K+ ions were removed by 92% (4.6 mg/L) from the effluent, while Cl and Na+ were removed in lower proportions of 51% (85.3 mg/L) and 45% (53.2 mg/L), respectively. Over time, the retained quantities of the three target salt ions decreased, indicating that clay sorption capacity may have been reached. This study demonstrated that Regina Clay has substantial sorbent capacity for salt ions contained in simulated potash brine solution.

1. Introduction

Solution mining techniques are employed for extraction of minerals from potash (potassium bearing) deposits at several locations in Saskatchewan, Canada. Water is used to dissolve and extract the relatively deep potash salts for subsequent surface-level refining. Such methods produce large volumes of salt-affected waters (brines) that must be stored in surface impoundments prior to their release to the environment. Given the climate (winter extremes in −30 °C range and summer extremes in 30+ °C) prevalent in the area (that precludes plant life for approximately 1/2 of the year), the containment facilities are mostly non-vegetated constructed wetland (CW) systems that utilize local materials. For the purposes of this research, experiments were conducted at ambient room temperature ranging between 19 and 21 °C, which does not accurately reflect the winter temperatures in constructed wetlands, but does recognize the above −0 °C (4–10 °C in-field range) that is experienced during winter containment.
The ready availability of an active clay in Regina, Saskatchewan, make CW systems an attractive approach for salt removal (otherwise causing soil salinity and groundwater contamination). The clay has been used as a compacted liner for various applications: wastewater treatment plant [1], livestock manure storage [2], and municipal landfill [3]. The high specific surface area (50 m2/g) along with a high cation exchange capacity (40 cmol(+)/kg) of Regina clay [4] are useful in retaining several ionic species present in salt-rich water. A combination of physical and chemical processes are operative in active clay media such as ion exchange, filtration, settling, precipitation, volatilization, and adsorption [5].
Recent research reports that the application of non-planted CWs receiving landfill leachate results in high heavy metal removal efficiency [6]. Unlike planted CWs, the sensitivities of biological systems to such factors as temperature changes and toxic chemicals are not as significant for the function of soil and other mineral media in non-planted CWs. The treatment mechanics and efficiency are less affected by these factors, as are their planted counterparts. However, the alterations of soil particles such as desiccation and creaking are reported to cause failures to the clay liner in landfills [7]. Therefore, the application of a compacted clay layer as the primary pollutant filter bed in non-planted CWs might experience the same issue. Because of the desiccation cracks of soil, the hydraulic conductivity of clays may be changed and increase [8], meaning that the contact time between the clay bed and contaminated inflow is dramatically decreased. Seepage also may occur, resulting in the rapid migration of pollutants and short-circuiting of the soil layers resulting in high outflow contaminant concentrations. CWs technology with no application of plants is likely to contribute minimally to the removal of soluble organics, phosphorous, and nitrogen as well as pathogens due to lack of microbial activities and plant uptake mechanisms present in the system [5]. However, such non-planted systems are well-suited to assessments of soil-contaminant interactions for the removal of potash extraction−related salts and constituent ions. Wetland plants typically contain sufficient concentrations of Na+, K+ and Cl in their cells, and thus the requirement for biological uptake of these three ions is sufficiently low so that non-planted systems represent the majority of ion-exchange and sorption removal from the aqueous phase.
The main objective of this paper was to understand the fate and transport of two dominant chloride salts (NaCl and KCl) present in solution-potash brines in constructed wetland. Four pilot-scale CW setups were operated in three batches over 16 days using simulated brine.

2. Materials and Methods

2.1. Synthetic Brine Preparation

The synthetic brine was prepared to produce a concentration of chloride salts at a ratio of 10:1 for NaCl:KCl. The concentration ratio was determined from field data obtained from a typical solution potash mine [9]. The brine concentrations used in experiments within the 10:1 ratio are presented in Table 1.
The experimental design takes into consideration that the two dominant salt compounds are not completely dissociated, especially the Na+ ion. The standard deviation (sd) reflects the gap between theoretical expectation (Eq) and actual laboratory data using ion selective electrodes (ISE) instrumentation and analyses.

2.2. Instrumentation and Analysis

Both influent and effluent samples collected during batch experiments 1−3 were analyzed for salt ions concentration using ISEs. To obtain precise and accurate results, each ISE was conditioned and stored in recommended solutions (Table 2) before performing a daily calibration test. The two point slopes check as recommended by the manufacturer was used to inspect the ISE functioning. Therefore each salt parameter was provided in three different proportions which are 1000, 100 and 10 mg/L. The calibration test succeeded when two slope values as shown on a WTW ph/ION 3400i meter were recorded between 56 and 58 mV. All calibration solutions were prepared biweekly from a WTW sodium standard solution 10 g/L Na+ (NaCl), WTW potassium standard solution 10 g/L K+ (KCl) and WTW chloride standard solution 10 g/L Cl(NaCl).
To perform Na+ ion measurements, both Type 10-205-3064 Na electrode and R-503/D reference electrode must be connected to the pH/ION 3400i meter at the same time. The reference probe was not required in order to operate the K-800 and Cl-800 electrodes. All ISEs, the pH/ION 3400i meter and the standard solutions were purchased from Hoskin Scientific, Vancouver, BC, Canada.

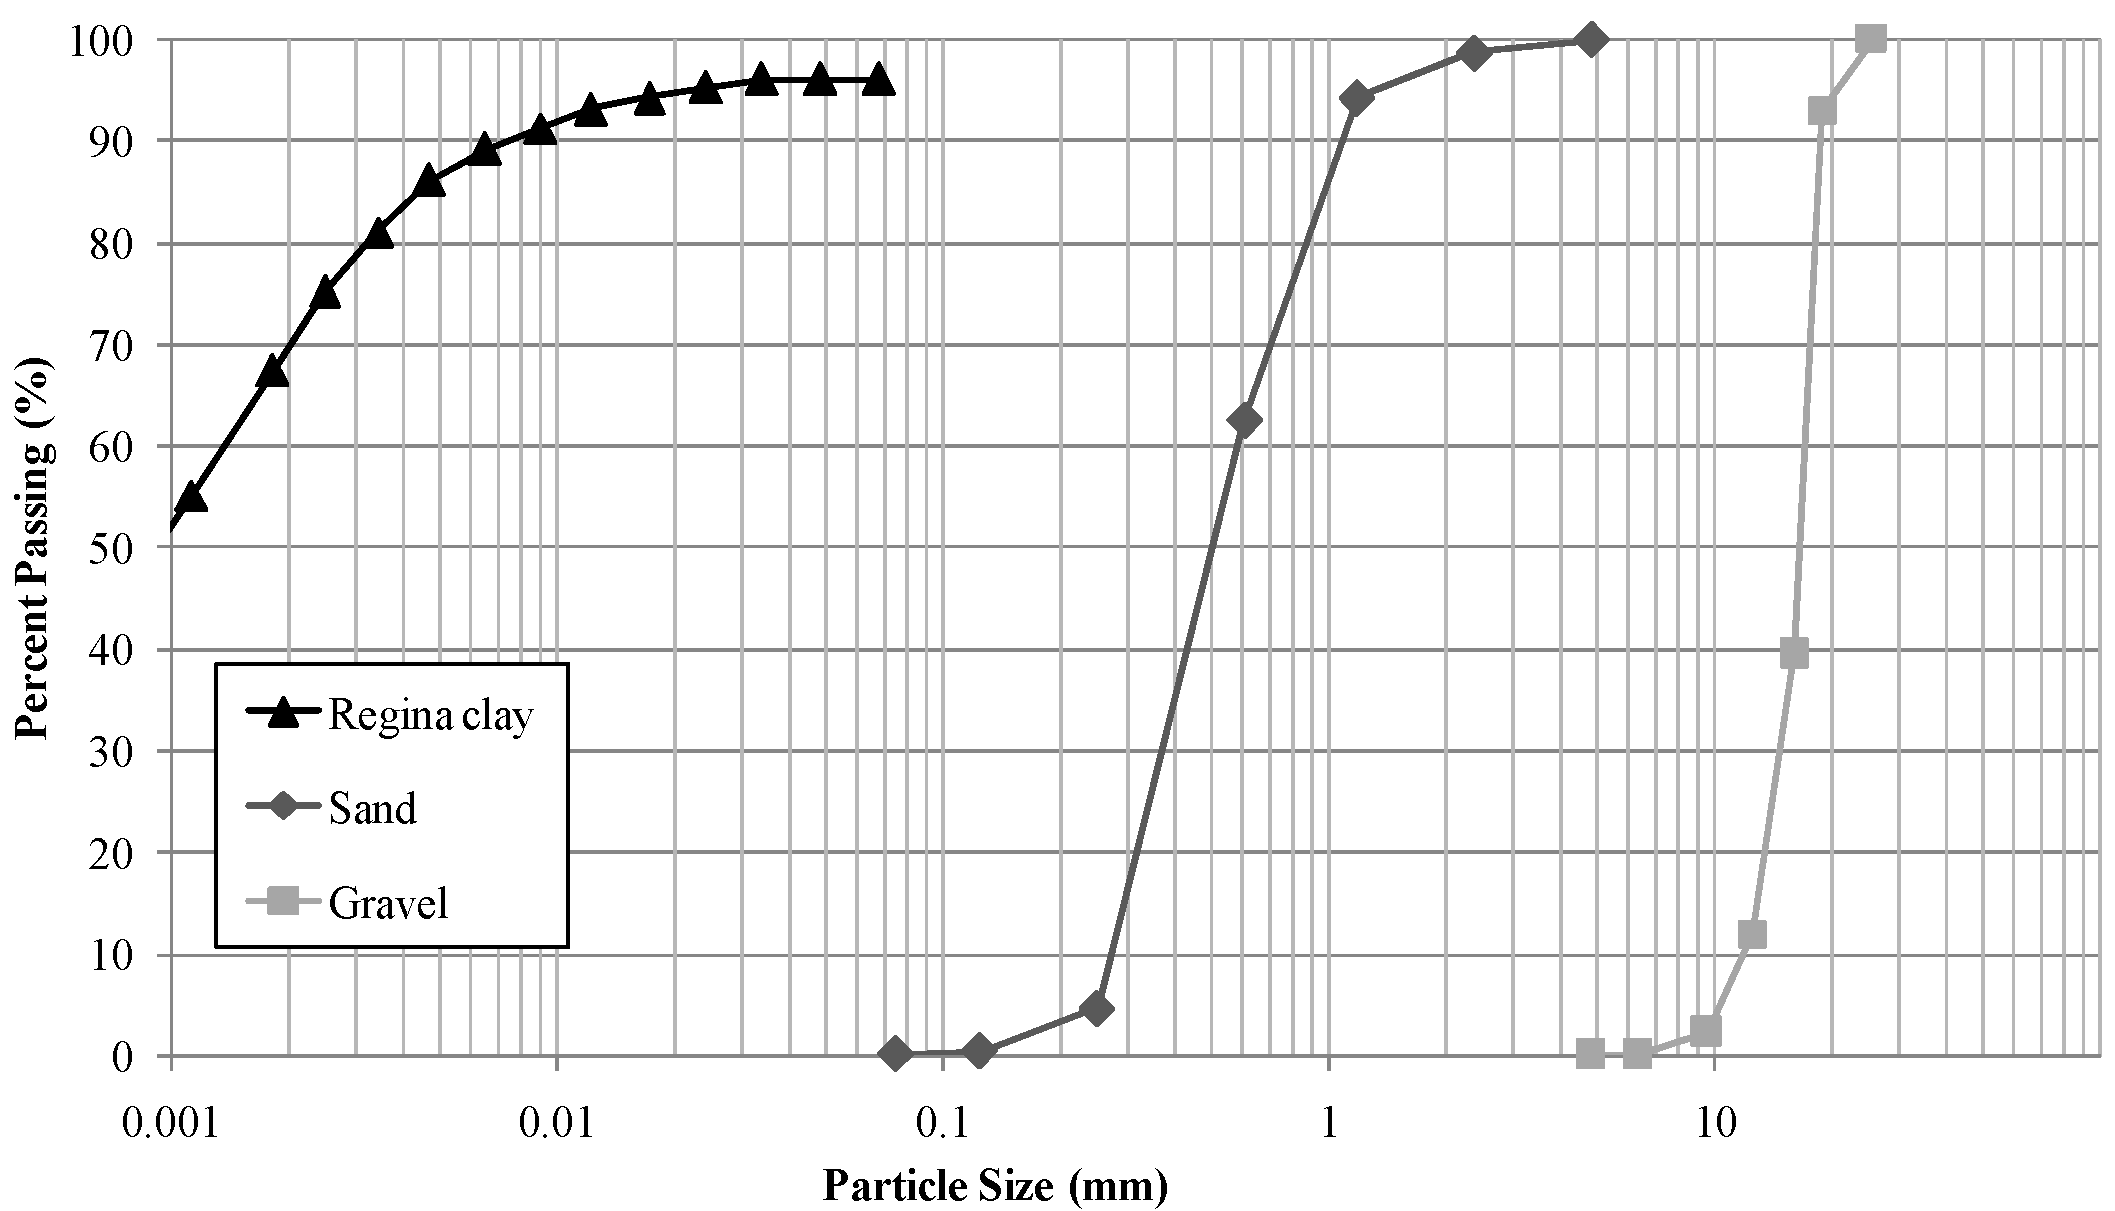
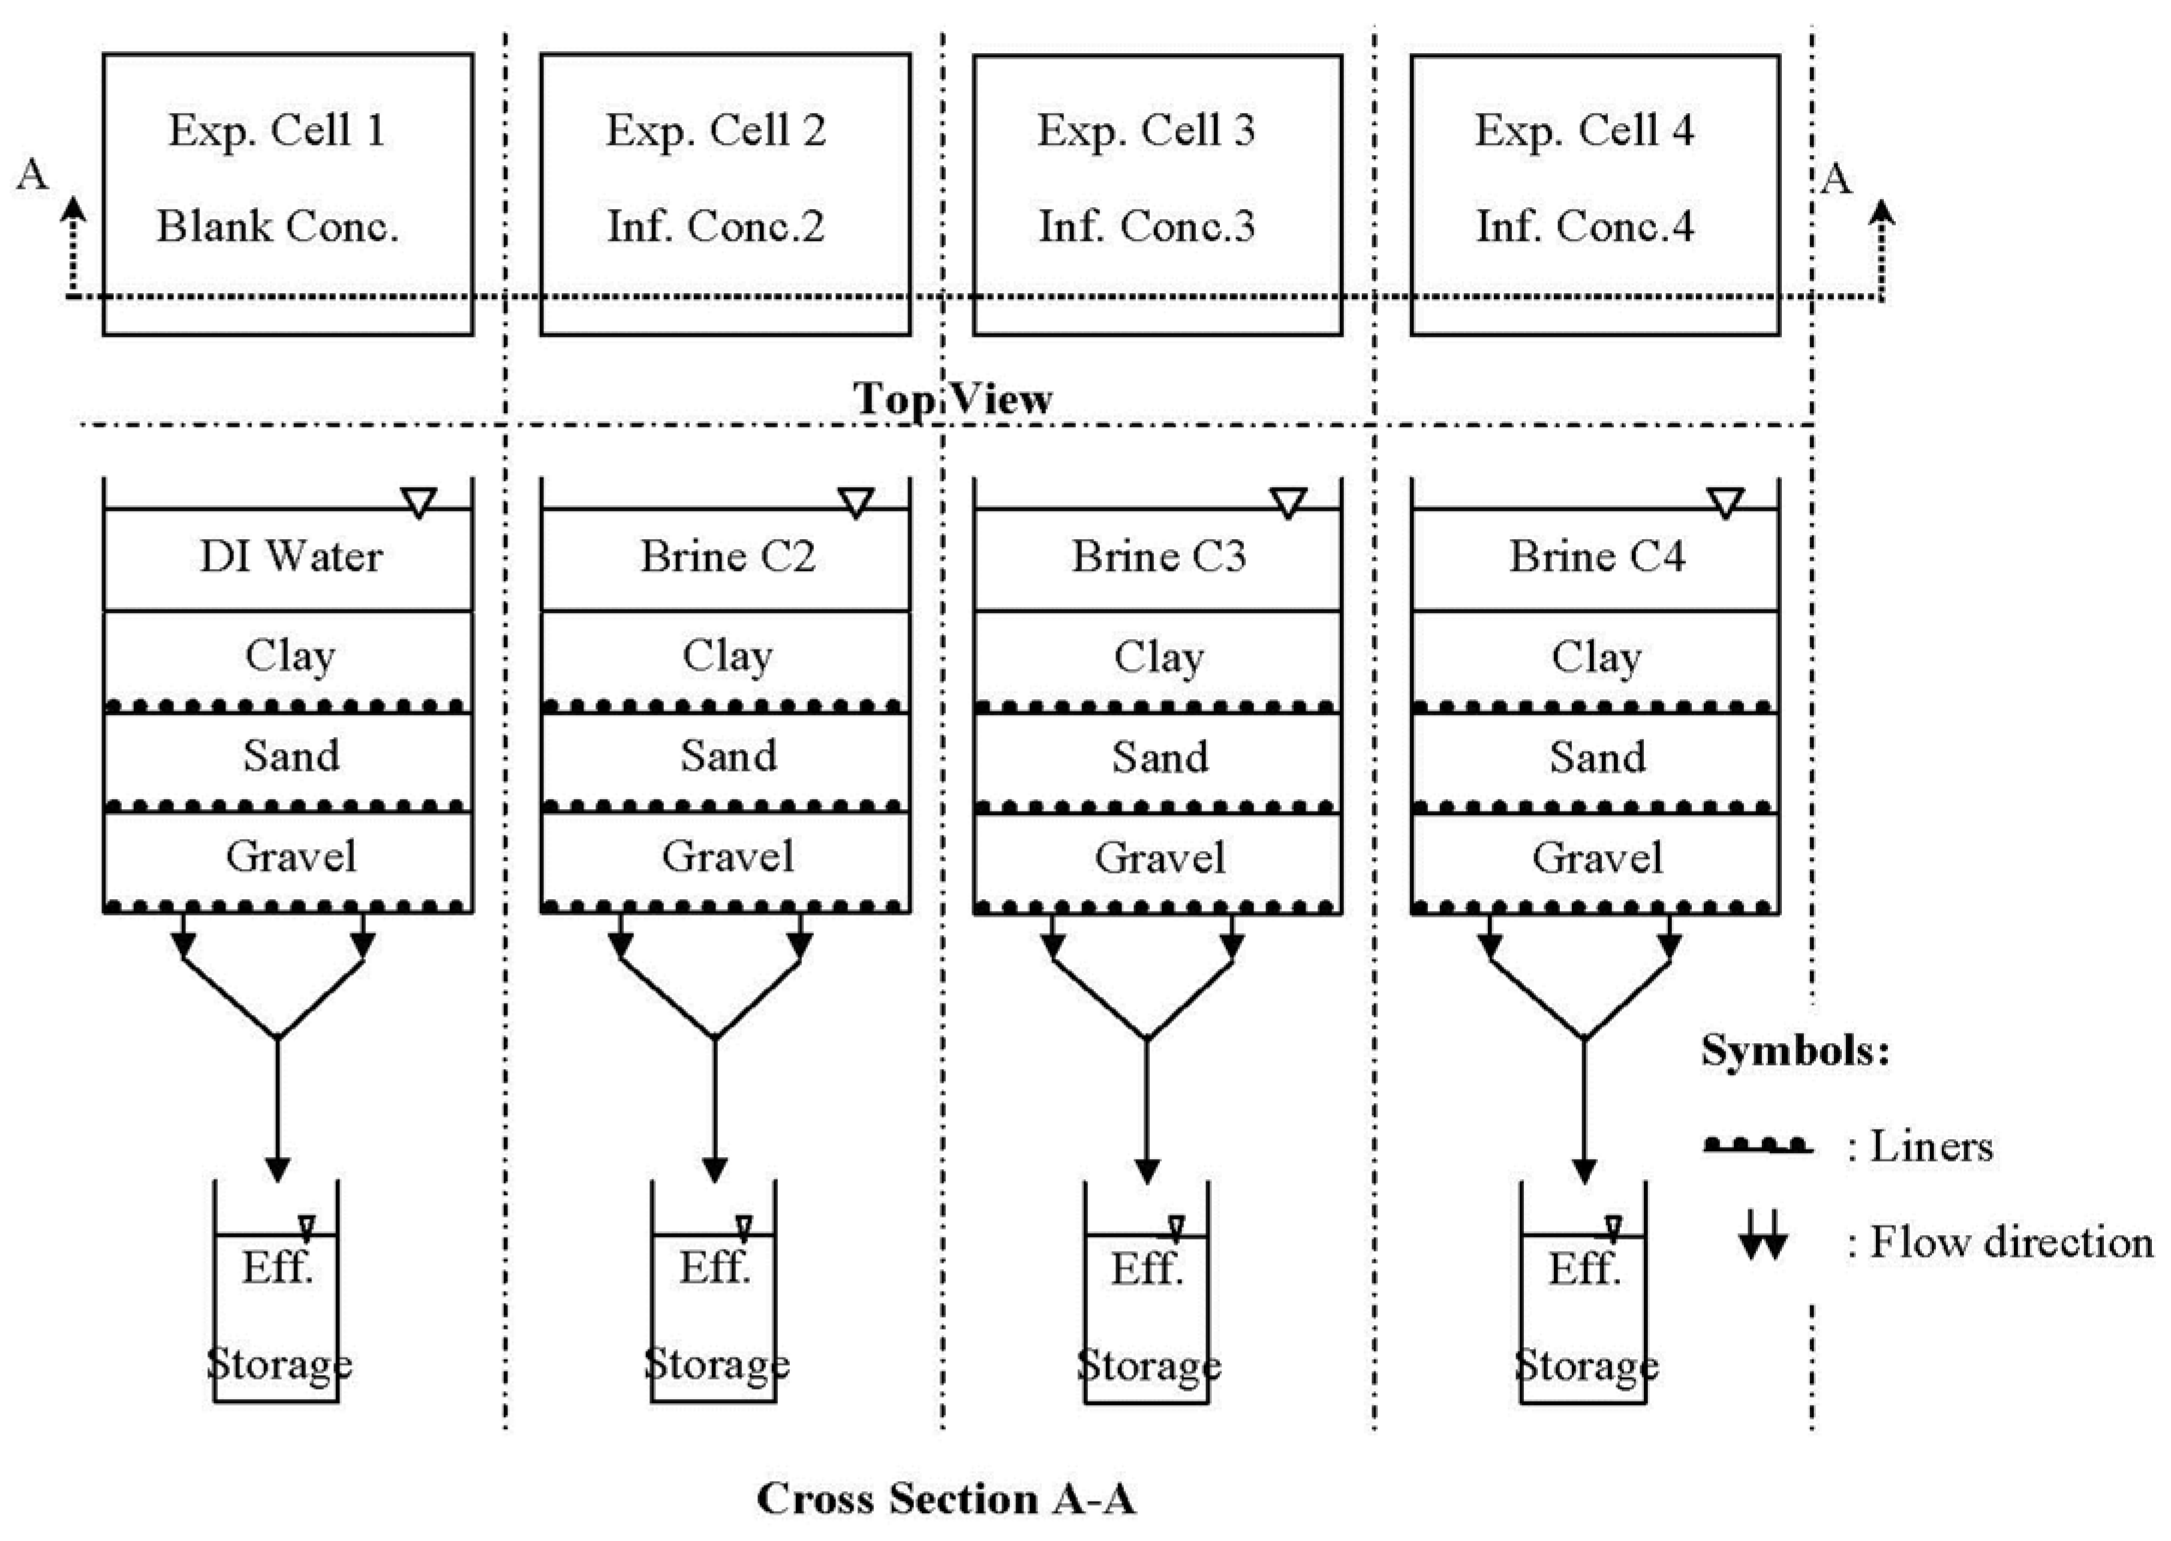
2.3. Experimental Cell Design and Multi-Layer Soils

All experimental cells were identically designed as non-plug flow systems (simulating constructed wetlands) using clay, sand and gravel. Based on vertical flow theory, the synthetic brine was fed on top of the CW cells. Then, it gradually flowed down through the multi-layer soil media, and effluents were collected at the bottom of CW cells. The study also intended to simulate the experiment cells as tailing ponds, so the application of plants was not required within this research. The clay was collected from a construction site in Regina (Saskatchewan, Canada) whereas sand and gravel were purchased from a retail location that sources materials locally.
Material gradation was determined using sieve analysis [10] and hydrometer analysis [11] (Figure 1). The clay was found to contain 95% grains finer than 0.075 mm and 70% materials finer than 0.002 mm. The D10 (grain size pertaining to 10% material) of sand was found to be 0.27 mm and this number fit well in the design criteria (0.1 mm to 0.4 mm) for primary substrate in subsurface flow [12] as the gravel was sized between 6.3 mm to 9.1 mm.
The CW system was installed in clear rectangular plastic containers comprising about 50 mm thick layers of clay, sand and gravel for the upper, middle, and bottom layers, respectively. The top layer functioned as the salt filtering layer while the sand and gravel provided water pathways for drainage. The porosity (ɳ) was measured as 0.3 and 0.4 for sand and gravel layers, respectively. Compaction loads were applied to the clay in order to form a compacted layer with hydraulic conductivity closer to that expected in a full-scale CW. About 10 kg of dried clay was moistened with deionized water and filled into the rectangular wooden frame which was placed on top of a geo-synthetic fabric (35 cm × 55 cm). A round rubber hammer was used to produce a point load and compact the clay layer as desired. A well-graded and fine leveling surface was achieved using a marble roller and a bubble level. The pilot-scale CWs consisted of a cell tube, multi-layers soils, an effluent storage and drainage pipes (Figure 2).
The geotechnical properties of the clay are shown in Table 3. The high liquid limit and plastic limit indicate a high water adsorption and retention capacity of the clay. Likewise, the bulk density was measured as 1.4 g/cm3 indicating that the sample did not achieve fully compacted status (i.e., Db ≥ 1.6 g/cm3). Thus, the clay layer permitted higher transmission of water through the upper layer than ideally present under field conditions.

2.4. Experiments

Three batch experiments were completed in which each of the four experimental cells were fed 5 L/day influents (synthetic brine and deionized water). Synthetic brine influent was introduced over a period of 13 days and then cleansed with deionized water for three days to facilitate salt removal from the clay media.
Effluents from each experimental cell in batch experiments 1−3 were collected once every 24 hours. The concentrations of salt ions, Na+, K+ and Cl, were measured for each 24 h sample in all three sets of experiments. A summary of the experimental design and operation is described in Table 4.
All laboratory data were compiled in a Microsoft Excel spreadsheet for statistical and mathematic calculations. Trend data were plotted on time-sequence figures to illustrate changes in all key parameters over time.

3. Results and Discussion

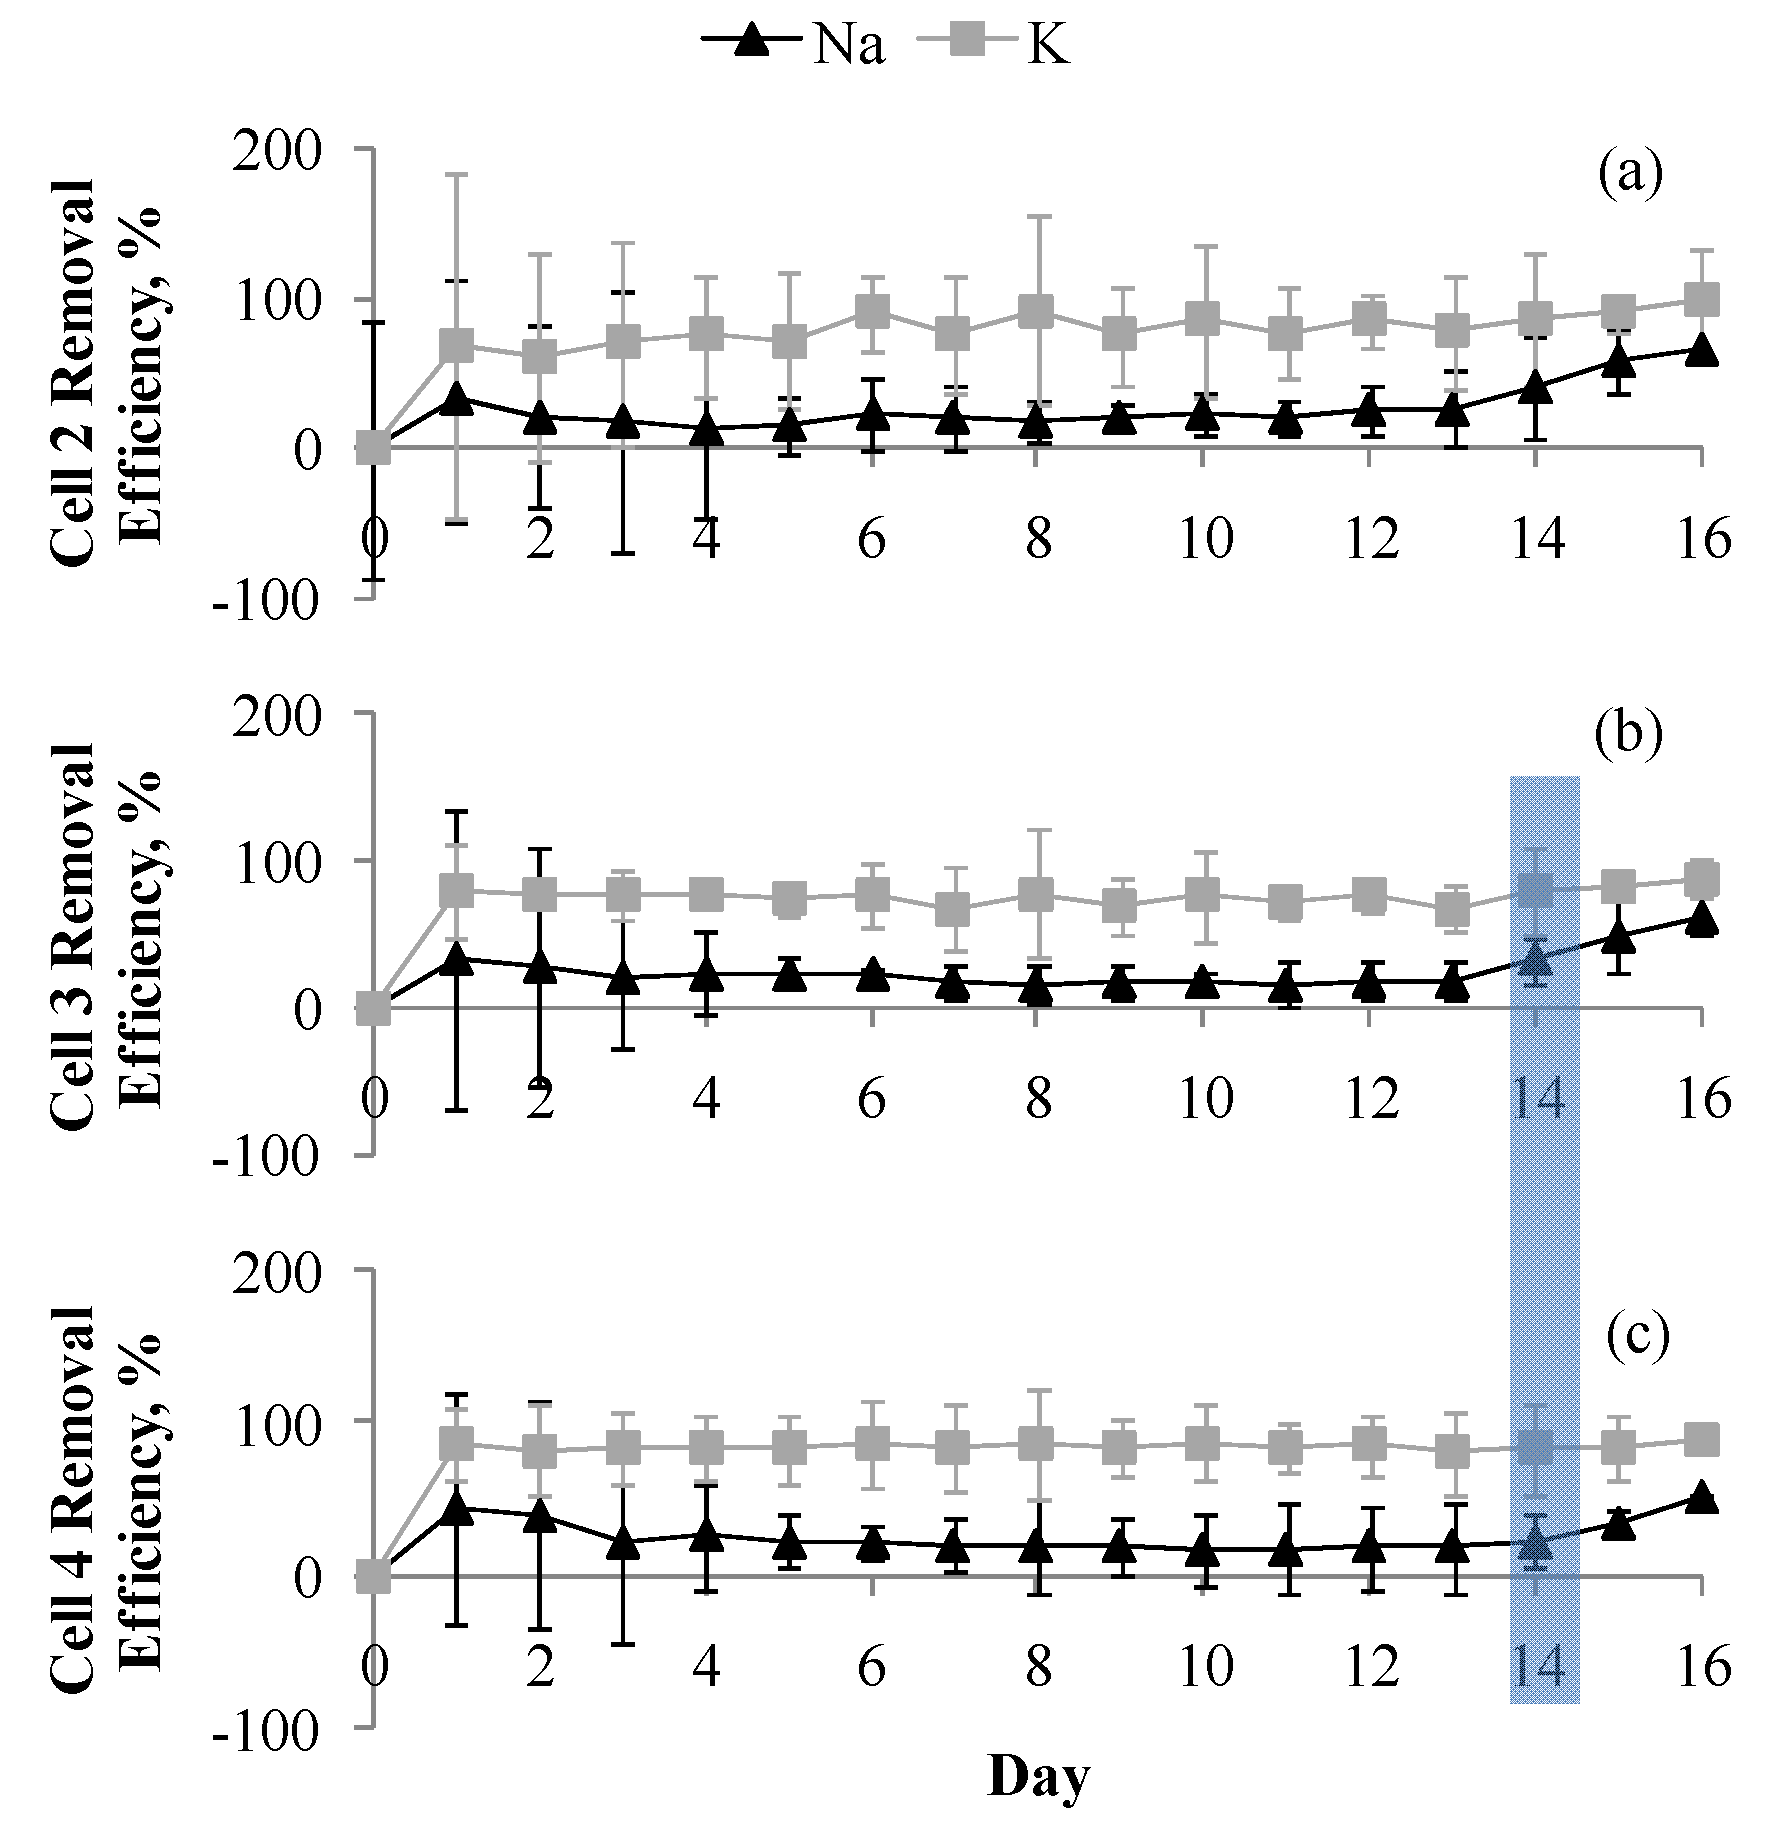
3.1. CW System Performance and Removal Efficiencies
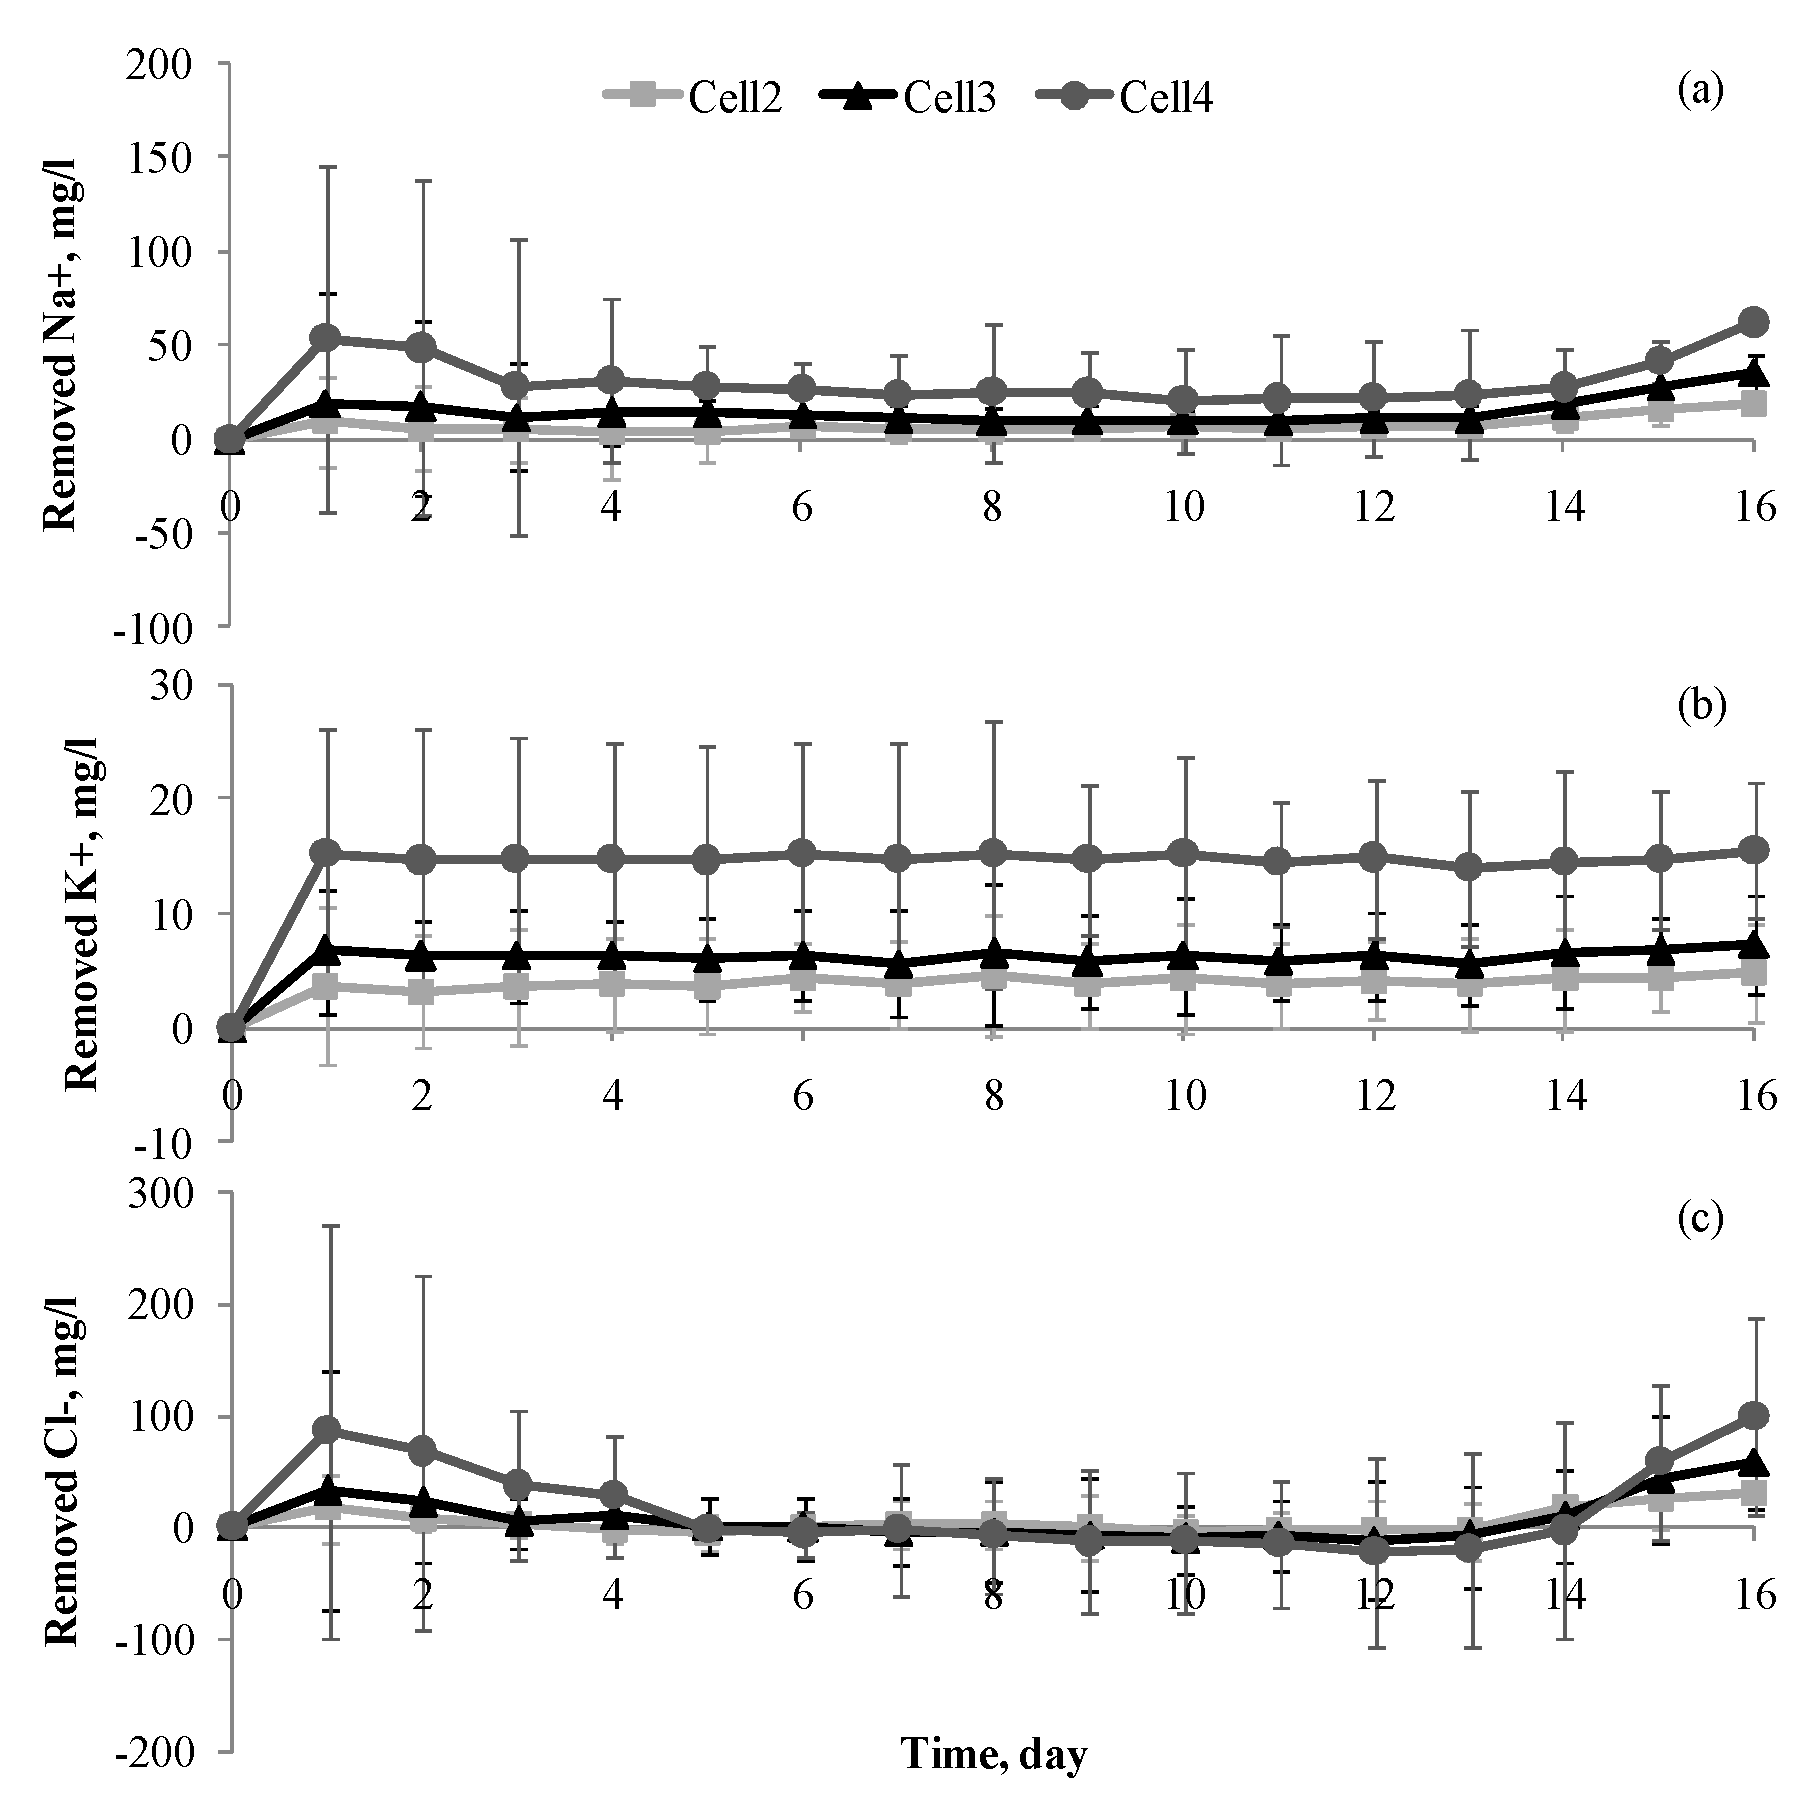
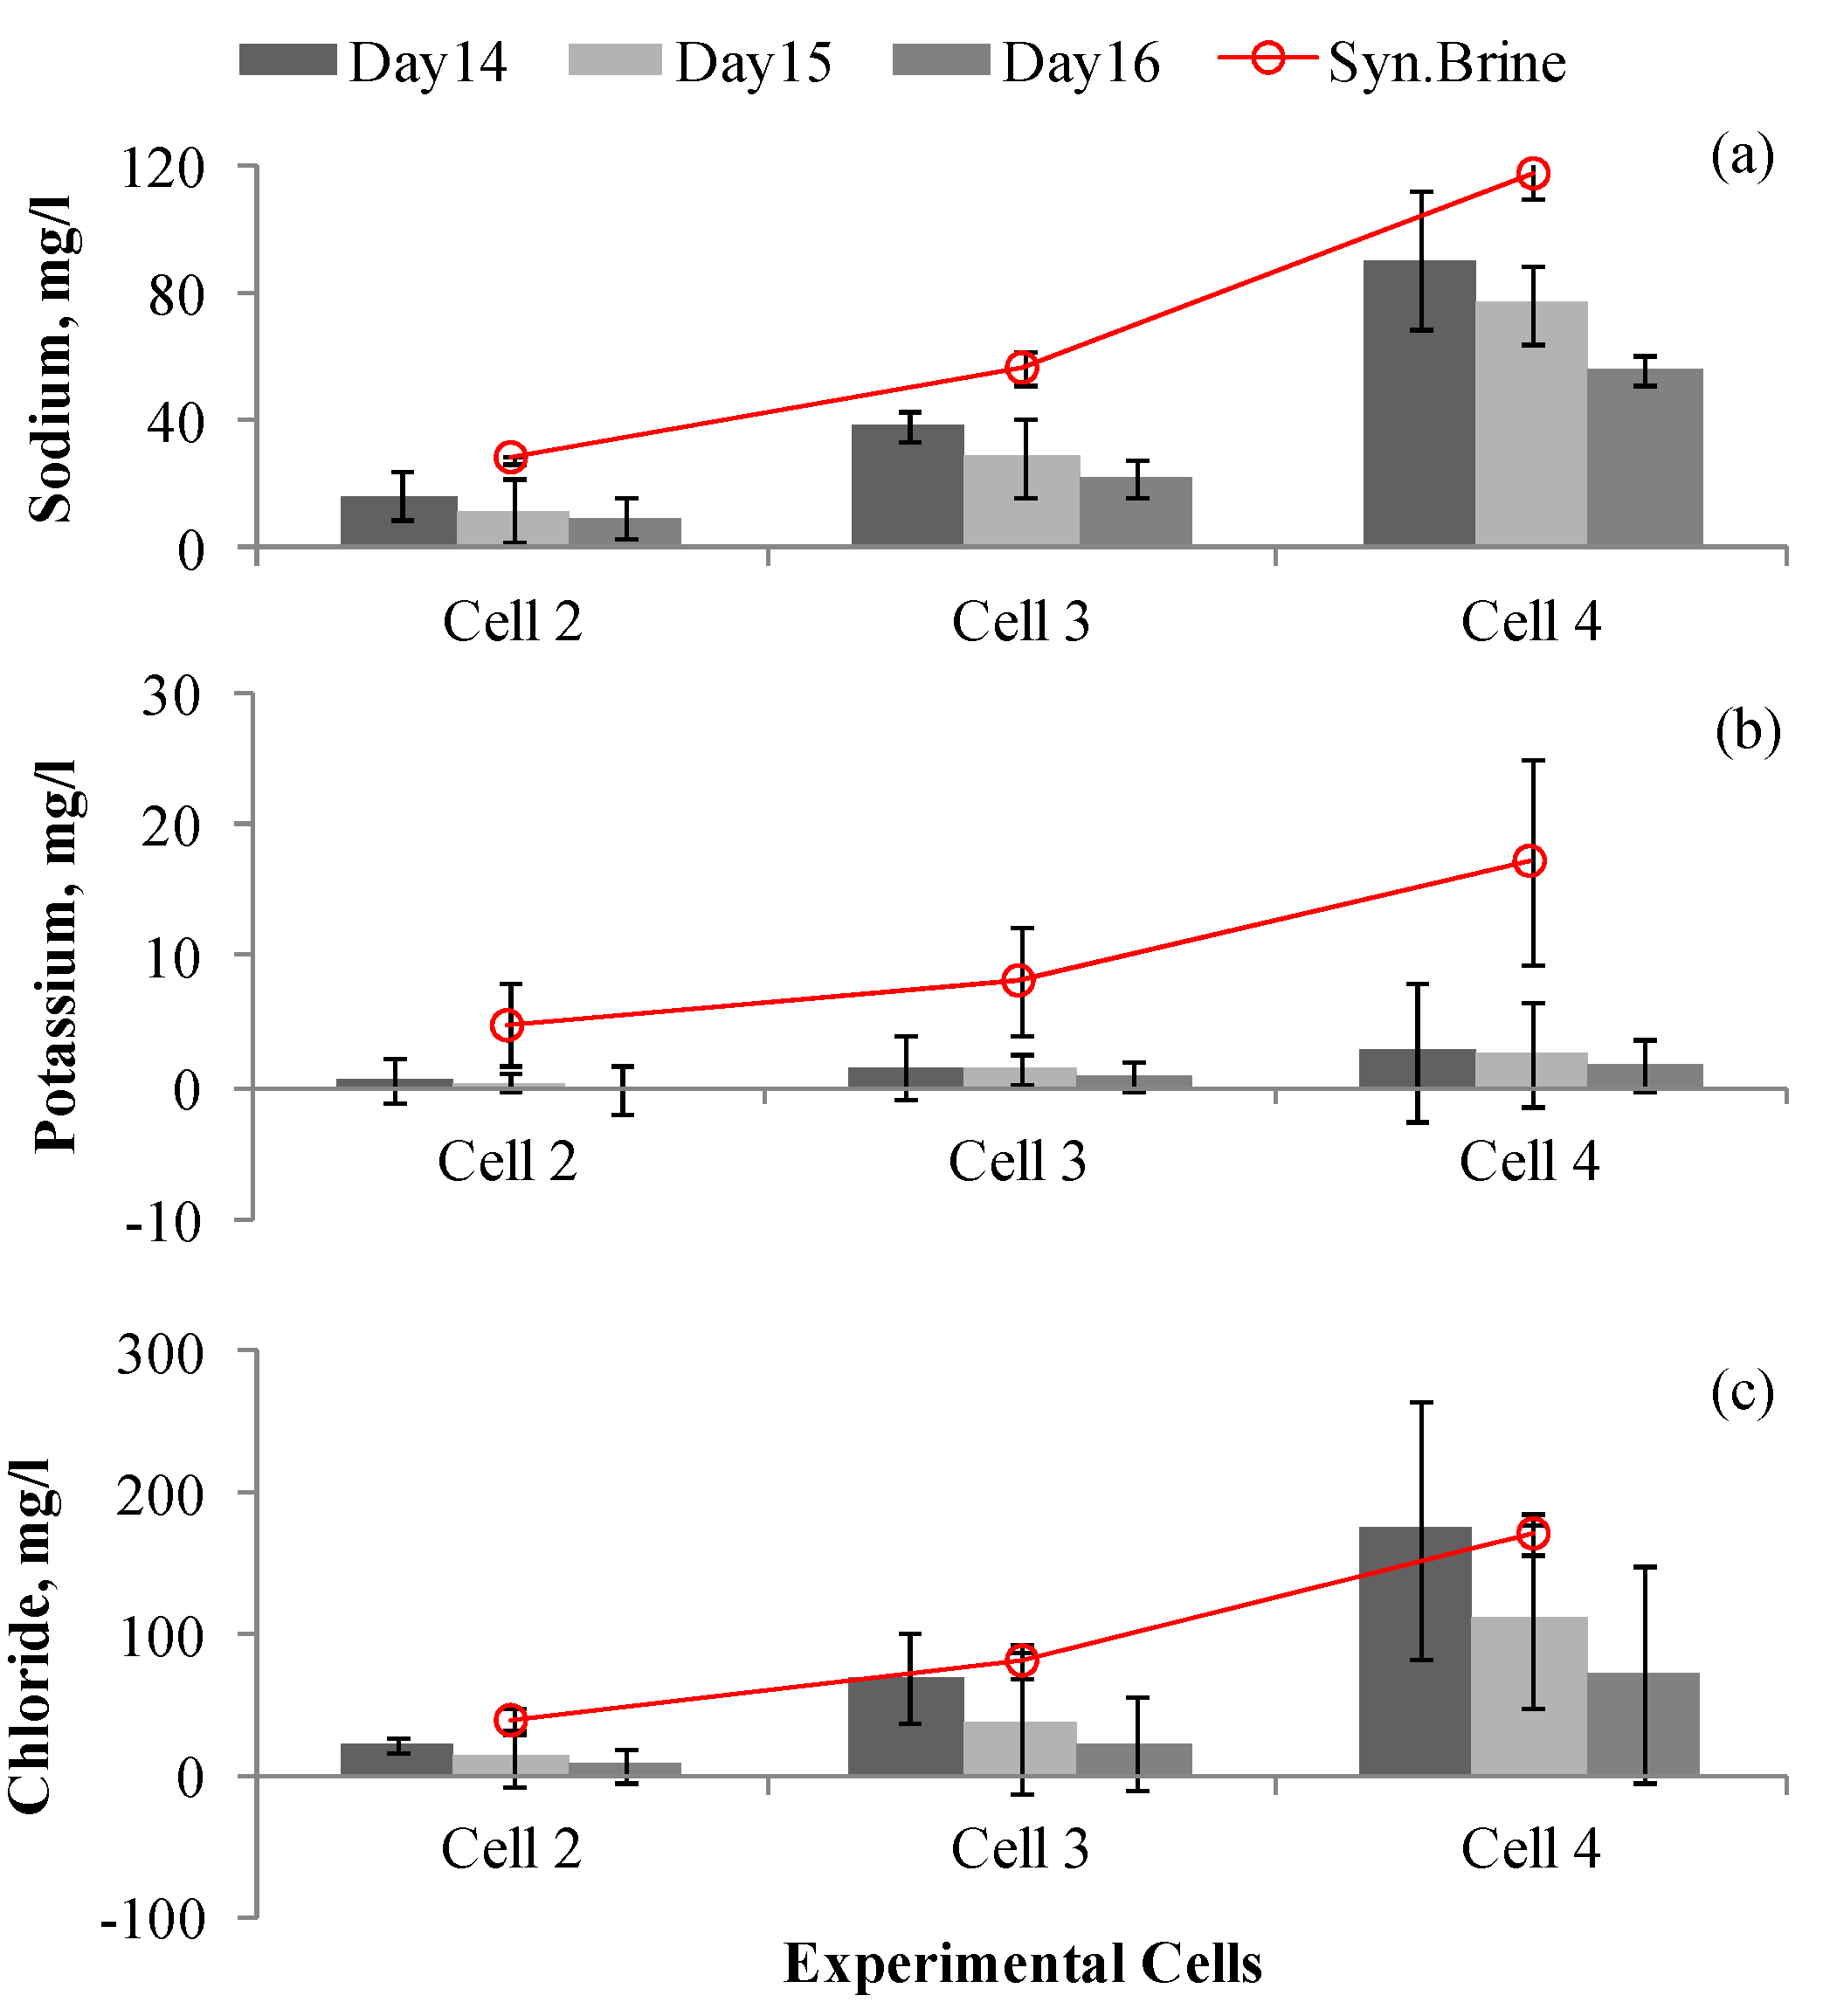
The CW systems demonstrated promising results for cation removal, especially the K+ ions. Each experimental cell system was able to maintain a consistent removal effectiveness of K+ ions throughout the 13 day exposure to the synthetic brine feed, while the ability to remove Na+ ions decreased from Day 1 forward, resulting in minimal treatment potential by Day 13. The majority of Cl ion removal was achieved during Day 1 to Day 4. The daily variations of average quantities removed in Cells 2, 3 and 4 are presented in Figure 3.
Figure 3 also draws attention to the fact that cations are more highly attracted to the clay versus the anions due to the high CEC of the natural clay. In other words, clay media had ability to remove the anion in a short period, but also becomes quickly exhausted. Despite both cations having equal positive charge, the K+ ion was more highly favored in uptake kinetics vs. the Na+ ion, most likely due to their atomic size in the lyotropic series. Therefore, the CW system would potentially contribute maximum and consistent removal efficiency of K+ > Na+ > Cl ions.
The results of maximum removal efficiency calculations for each of the three key salt ions investigated (Table 5) during the three brine-fed batch operations of the CW systems clearly support the above statements regarding K+ ion removal efficacy, with lower and less consistent removal of Na+ and Cl.
The highest removal efficiency was recorded at nearly 92% for clay uptake of the K+ ion while the maximum removal percentages for Na+ and Cl ions were substantially lower at 45% and 50%, respectively. It is apparent that, although small quantities of K+ ions were present in the effluents, the removal percentage was still nearly twice as high as compared to the other two salt ions examined. This result indicates that the clay medium demonstrated a higher affinity to attract and remove the larger atomic cations present in the influent brine.

3.2. Cation Removal

According to the lyotropic series (Al3+ > Ca2+ > Mg2+ > K+ > Na+ > H+), cations that carry a significant positive charge along with being of large atomic size are more likely to be attracted to and absorbed by the negatively charged surfaces of clay [16]. If the degree of the valence is equal, the larger ion size will contribute to producing a stronger substitution power [17]. For the purposes of this study, it is important to note that the ionic radii of K+, reported as 1.38 Å and 1.51 Å in the structures of alumina (octahedral) and silica (tetrahedral), respectively, are bigger than those of Na+ at 1.02 and 1.18 Å, respectively [18]. Therefore, at the point at which the availability of negatively charged surface area on clays becomes limited, the K+ ion will bond preferentially over Na+ to an ion-exchange site.
Figure 4 presents the daily deviations of cation removal including the three-day flushing stage, during which deionized water was applied to extricate the sorbed ions from the Regina Clay exchange sites. Each experimental cell system was able to maintain a consistent removal effectiveness of the K+ ion throughout the 13-day exposure to the synthetic brine feed, while the ability to remove the Na+ ion decreased from Day 1 forward, resulting in minimal treatment potential by Day 13. Therefore, this result confirms that the daily K+ ion elimination percentage in all experimental cells is approximately double that for Na+.

3.3. Chloride Ion Removal

The amount of Cl ions was dramatically reduced in the early stages of experimental cell operation due to formations of insoluble salt compounds with available cations and precipitation on clay surfaces via anion exchange processes [16]. Clays naturally exhibit very low anion exchange capacity (AEC). By Day 4 of the experiments, the process of insoluble salt formation was significantly decreased from that originally observed, as recorded by reduced Cl removal efficiency. At this point in time, it is likely that accessibility to both the cations and AEC-related processes, which were limited from the start, became fully exhausted or depleted. In Days 5 through 13 of the experiments, the amount of free Cl ions that had accumulated in the clay solution was leached out on a daily basis by the introduction of fresh synthetic brine that forced any accumulated Cl through the system.

3.4. Flushing Stage

A flushing or cleaning process was completed using deionized water feed for all experimental cells to allow the time and opportunity to leach bonded ions from the clays. The effluents were collected and the concentration of all three key salt ions monitored through the three-day flushing process. Through this process, the quantity of all three ions was dramatically reduced (Figure 5). Additionally, all experimental cells contained minimal quantities of retained salt ions that had been accumulated into the Regina Clay media and, thus, were carried forward to the subsequent experiment as compared to the initial concentrations by Day 16.
Due to the weakness of the Van der Waals’ forces of the silica sheet, hydrogen ions (H+) from water can enter across the edge of the silica layers located on top of the alumina layer in the 2:1 structure of smectite to affect hydrogen bonds with groups of oxygen or hydroxyl [17]. The separation and defection of the silica layer may then occur. This action, known as broken edge, releases a large quantity of negative charges to the clay surface because of the incomplete structural formation of the silica sheet. In addition, the clay mineral itself may recharge the negatively charged surfaces by substitution of cations in the alumina layer. This process increases the negative charges available during replacement of a lower valence cation with a higher valence one [14].

4. Conclusions

The experimental CW systems were found to serve as a satisfactory treatment method for overall salt ion removal from the synthetic solution-potash brine containing a 10:1 ratio of NaCl:KCl. The data obtained from three batch experiments indicate systems removal efficiencies that demonstrate promising applications for non-vegetated CWs under the conditions tested. The removal percentage for each ion investigated in the experimental cells increased with increasing initial concentrations. The experimental results clearly identified that K+ ions were most readily removed in significant quantities (in the range of 92% removal) in the Regina Clays media. Both Na+ and Cl ions were removed at no more than 45% and 50%, respectively, throughout the experiments. Across the experiments, the retained amounts of K+, Na+ and Cl ions decreased in the outflow with increasing operational time. Therefore, this study has proven that Regina Clay has significant application potential to serve as adsorbent media for the removal of salt ions from solution-potash brine.

Acknowledgments

The authors gratefully acknowledge financial support from the Natural Sciences and Engineering Research Council of Canada to Dena W. McMartin (2015-04296). Further funding was received from the University of Regina.

Author Contributions

Warawut Chairawiwut designed and carried out the experiments, conducted the data analysis and led the authorship of the resulting paper; Dena W. McMartin and Shahid Azam conceived of the research and experiments, and provided academic reviews and technical comments during manuscript preparation.

Conflicts of Interest

The authors declare no conflict of interest.

References

  1. Saskatchewan Power Corporation. An Operating Manual and Performance Evaluation Guide for the Biological Aspects of the Sask Power Constructed Wetlands; Lakshman, G., Ed.; Saskatchewan Power Corporation: Regina, SK, Canada, 1994. [Google Scholar]
  2. Saskatchewan Ministry of Agriculture Regulation of Intensive Livestock Operations in Saskatchewan. Available online: https://www.saskatchewan.ca/business/agriculture-natural-resources-and-industry/agribusiness-farmers-and-ranchers/livestock/livestock-and-the-environment/regulation-of-intensive-livestock-operations-in-saskatchewan (accessed on 1 February 2016).
  3. AMEC. Environmental Impact Statement City of Regina Expansion of Fleet Street Solid Waste Disposal and Recovery Facility; City of Regina, Public Works Division: Regina, SK, Canada, 2009. [Google Scholar]
  4. Azam, S.; Shah, I.; Raghunandan, M.E.; Ito, M. Study on swelling properties of an expansive soil deposit in Saskatchewan, Canada. Bull. Eng. Geol. Environ. 2013, 72, 25–35. [Google Scholar] [CrossRef]
  5. Kadlec, R.H.; Wallace, S.D. Treatment Wetlands, 2nd ed.; CRC Press: Boca Raton, FL, USA, 2009. [Google Scholar]
  6. Dawi, N.H.; Tawfik, A. Non-Vegetated Constructed Wetland with Graded Sand Bed System for Hazardous Landfill Leachate Treatment and Heavy Metals Removal. Available online: http://webcache.googleusercontent.com/search?q=cache:Vw6DoYE6zpsJ:waset.org/pdf/books/%3Fid%3D40018%26pageNumber%3D1407+&cd=1&hl=en&ct=clnk&gl=ca (accessed on 22 March 2016).
  7. Yesiller, N.; Miller, C.J.; Inci, G.; Yaldo, K. Desiccation and cracking behavior of three compacted landfill liner soils. Eng. Geol. 2000, 57, 105–121. [Google Scholar] [CrossRef]
  8. He, J.; Wang, Y.; Li, Y.; Ruan, X. Effects of leachate infiltration and desiccation cracks on hydraulic conductivity of compacted clay. Water Sci. Eng. 2015, 8, 151–157. [Google Scholar] [CrossRef]
  9. MDH Engineering Solution Corp. Environment Impact Statement Mosaic Potash Belle Plaine Expansion Main Document; MDH Engineering Solution Corp.: Saskatoon, SK, Canada, 2009. [Google Scholar]
  10. ASTM COMPASS® 04.02. Standard Test Method for Sieve Analysis of Fine and Coarse Aggregates; ASTM C136—06; ASTM COMPASS: West Conshohocken, PA, USA, 2006. [Google Scholar]
  11. ASTM COMPASS® 04.08. Standard Test Method for Particle-Size Analysis of Soils; ASTM D422—63(2007); ASTM COMPASS: West Conshohocken, PA, USA, 2007. [Google Scholar]
  12. Hoffmann, H.; Platzer, C.; Winker, M.; Muench, E. Von Technology Review of Constructed Wetlands—Subsurface Flow Constructed Wetlands for Greywater and Domestic Wastewater Treatment; Deutsche Gesellschaft für Internationale Zusammenarbeit (GIZ) GmbH: Eschborn, Germany, 2011. [Google Scholar]
  13. Ito, M. Effect of seasonal climate on volume change behaviour of Regina clay. Masters Abst. Int. 2009, 49, 2. [Google Scholar]
  14. ASTM COMPASS® 04.08. Standard Test Methods for Laboratory Determination of Water (Moisture) Content of Soil and Rock by Mass; ASTM D2216—10; ASTM COMPASS: West Conshohocken, PA, USA, 2010. [Google Scholar]
  15. ASTM COMPASS® 04.08. Standard Test Methods for Liquid Limit, Plastic Limit, and Plasticity Index of Soils; ASTM D4318—10; ASTM COMPASS: West Conshohocken, PA, USA, 2010. [Google Scholar]
  16. Bergaya, F.; Lagaly, G.; Vayer, M. Cation and Anion Exchange. In Developments in Clay Science; Handbook of Clay Science; Elsevier: Amsterdam, The Netherlands, 2006; Chapter 12.10; Volume 1, pp. 979–1001. [Google Scholar]
  17. Holtz, R.D. An Introduction to Geotechnical Engineering, 2nd ed.; Pearson: Upper Saddle River, NJ, USA, 2011. [Google Scholar]
  18. Giese, R.F. Colloid and Surface Properties of Clays and Related Minerals; Surfactant Science Series; M. Dekker: New York, NY, USA, 2002. [Google Scholar]
Figure 1. Grain size distribution of selected materials.
Water 08 00113 g001
Figure 2. Schematic of pilot-scale CWs.
Water 08 00113 g002
Figure 3. The variation of average quantities of (a) Na+; (b) K+; and (c) Cl removed in the three experimental CW cells with 95% confidence intervals (n = 3) provided. All data are corrected per control CWs.
Water 08 00113 g003
Figure 4. Na+ and K+ removal efficiencies in (a) Cell 2; (b) Cell 3; and (c) Cell 4 throughout the three experimental CW cells with 95% confidence intervals (n = 3) provided. All data are corrected per control CWs. Highlighted areas represented data obtained from three-day flushing stage.
Water 08 00113 g004
Figure 5. Mean daily effluent concentrations of (a) Na+; (b) K+; and (c) Cl in the flushing stage including 95% confidence interval error bars for n = 3. All data are corrected per control CWs.
Water 08 00113 g005
Table 1. 10:1 brine concentrations used in batch experiments.
Syn. BrineNaCl:KClDissociation
Na+, mg/LK+, mg/LCl, mg/L
Concentrationmg/L:mg/LEqISEsdEqISEsdEqISESd
C1DI water01.91.300.40.3010.7
C275:7.537.528.16.73.84.90.841.338.61.9
C3150:157556.912.87.58.20.582.581.20.9
C4300:30105117.822.81517.31.6165171.64.6
Table 2. Conditioning and storing solutions for ISE Calibration.
ISEsReference ElectrodepH/Ion 3400iConditioningStoringStandard Solution (STD)Calibration
Series (mg/L)Slope Check (mV)
Type 10-205-3064NaR-503/DRequired103 mg/L of STD Na+1 mg/L of STD Na+10 g/L Na+(NaCl)10, 102, 10356–58
K-800Not requiredRequired103 mg/L of STD K+1 mg/L of STD K+10 g/L K+ (KCl)10, 102, 10356–58
Cl-800Not requiredRequired103 mg/L of STD Cl1 mg/L of STD Cl10 g/L Cl (NaCl)10, 102, 10356–58
Table 3. Geotechnical properties of the clay media.
ParameterUnitValueTest Method
Field dry densityg/cm31.37[13]
Specific gravity, Gs -2.71[13]
Dry density, ɤdg/cm31.02ɤd = ɤ/(1 + w)
Bulk density, ɤ, Dbg/cm31.4Core Method
Particle density, Dρg/cm32.21Core Method
Porosity, ɳ-0.4ɳ = 1 − (Db/Dρ)
Bed volumecm32740ɳ = VV/VT, VV = BV
Water content, w%37[14]
Liquid limit, LL%74.5[15]
Plastic limit, PL%28.3[15]
Dimension of CW cells (length × width)cm262 × 38
Table 4. Batch experiments.
BatchOperationalFeedingCleaningHRTEffluent Sampling
ExperimentsFormatsCellsStage (Day)Stage (Day)(h)FrequencyTotal
B 1, 2, 316-day413324at 24 h192
Note: HRT = Hydraulic Retention Time of CW cells.
Table 5. Mean concentration values and removal efficiencies for three key salt ions exposed to synthetic brine (n = 3). All data are corrected per control CWs.
IonDayInfluent ConcentrationOutflow ConcentrationRemoval Efficiency
(mg/L)(mg/L)(%)
Na+1117.8 ± 7.664.5 ± 87.145
K+84.9 ± 3.20.3 ± 3.192
Cl1171.6 ± 15.486.2 ± 19550

