3. Materials and Methods
3.1. Experimental Site
The conceptual model, described in the following section, was built and validated with the measured data retrieved from an experimental green roof located at the University of Calabria, Italy. The test site, situated on a fifth-floor terrace of a campus’s building, is located in a Mediterranean climate region, characterized by hot-dry summers and cool-wet winters with an annual average of 850 mm. High temperatures during the summer average 27 °C.
The green roof, with an area of around 50 m2 and a slope of 1%, is characterized by the following stratigraphy: (1) a soil substrate of 8 cm; (2) an “egg box” drainage and storage layer of 4 cm in pe-ad (with a storage capacity of 8.7 L/m2). A fine fibrous membrane was also placed between the substrate and the underlying drainage layer. The entire package is 12 cm.
The soil, consisting of volcanic lapillus, pumice, broken bricks and zeolites, enriched with organic matter, including peat and composted plant residues, is extremely draining and clay-free, with a good resistance to compaction and volume reduction. This mineral terrain substrate is built to: (1) anchor the root; (2) prevent standing water on the surface; (3) ensure water and nutritional supply; (4) guarantee the respiration of the root and the survival of micro-organisms.
Rainfall depth was measured every one minute using a 0.2 mm resolution tipping bucket rain gauge. With regard to the hydraulic parameters, flow meter devices, installed at the outlet of each compartment, were used to measure the effluent flow rates. The flow meter device was
ad hoc, designed to measure a large range of flow rates (0.1–2 L/s), and was based on a stage-flow rate relationship through an opening. The water level was measured by a level sensor [
36].
3.2. Data Analysis
The following study, as previously mentioned, was carried out in two phases. In the first phase, daily rainfall data from Thessaloniki (Greece) and Cosenza (Italy) were used; the two cities are both located in the Mediterranean area, characterized by similar meteorological conditions. The rainfall data relating to Cosenza where recorded from a rain gauge installed at the experimental green roof site at University of Calabria, with a resolution of 0.2 mm. The data set included 69 rainy days, collected between June 2013 and June 2014 (precisely from 21 June 2013 to 2 June 2014), with a total rainfall depth of 856.82 mm. The rainfall data from Thessaloniki were collected by the rain gauge at the Makedonia Airport for one year, in the period from 1 January 2014 to 31 December 2014; this period includes 66 rainy days, with a total rainfall of 726.70 mm.
In the second phase of the study the rainfall data with one minute time resolution, recorded only on the green roof experimental site for the whole period (21 June 2013 to 20 June 2014), were considered.
For both phases, only events with rainfall depth greater than 2 mm were selected, based on the assumption that events with rainfall depth < 2 mm unlikely produce runoff from a conventional roof [
15]. Moreover, during the second phase, it was needed to estimate the specific inter-event time to define each independent rainfall event.
The study focused on the analysis of the following hydrological parameters: rainfall or precipitation depth (PD); rainfall duration (RD); rainfall intensity (i); and antecedent dry weather period (ADWP).
In particular, the antecedent dry weather period (ADWP) is the dry weather period between two independent rainfall events.
To isolate an individual storm event from a dataset, it is necessary to apply a suitable criterion to determine when an event begins and ends. A typical criterion used to distinguish between rainfall events is the definition of a minimum inter-event time. If the antecedent dry weather period between storm events (period with no rain) is higher than the minimum inter-event time, then two events can be considered independent.
In this study, the minimum inter-event period is hypothesized to be equal to the residence time that a fluid element spends in a given system. Residence time begins when a fluid element enters the system and ends when the same element leaves the system. The residence time strongly depends on the characteristics of the unit. In the case of a green roof, the residence time represents the time that a fluid particle spends to go across the surface, substrate and storage/aeration layers and finally to reach the outlet section. When the antecedent dry weather period between two storms is greater than the residence time, this means that the water volume from the first storm event is completely drained before that the consequent storm begins. If such a condition occurs, the two storm events can be considered independent.
3.3. Conceptual Model for the Hydraulic Design of a Green Roof
Few literature studies have developed models which accurately predict the hydraulic efficiency of green roofs [
2,
13,
26]. In this study the conceptual model developed by Carbone
et al. (2014) for the green roof described in the previous section was used [
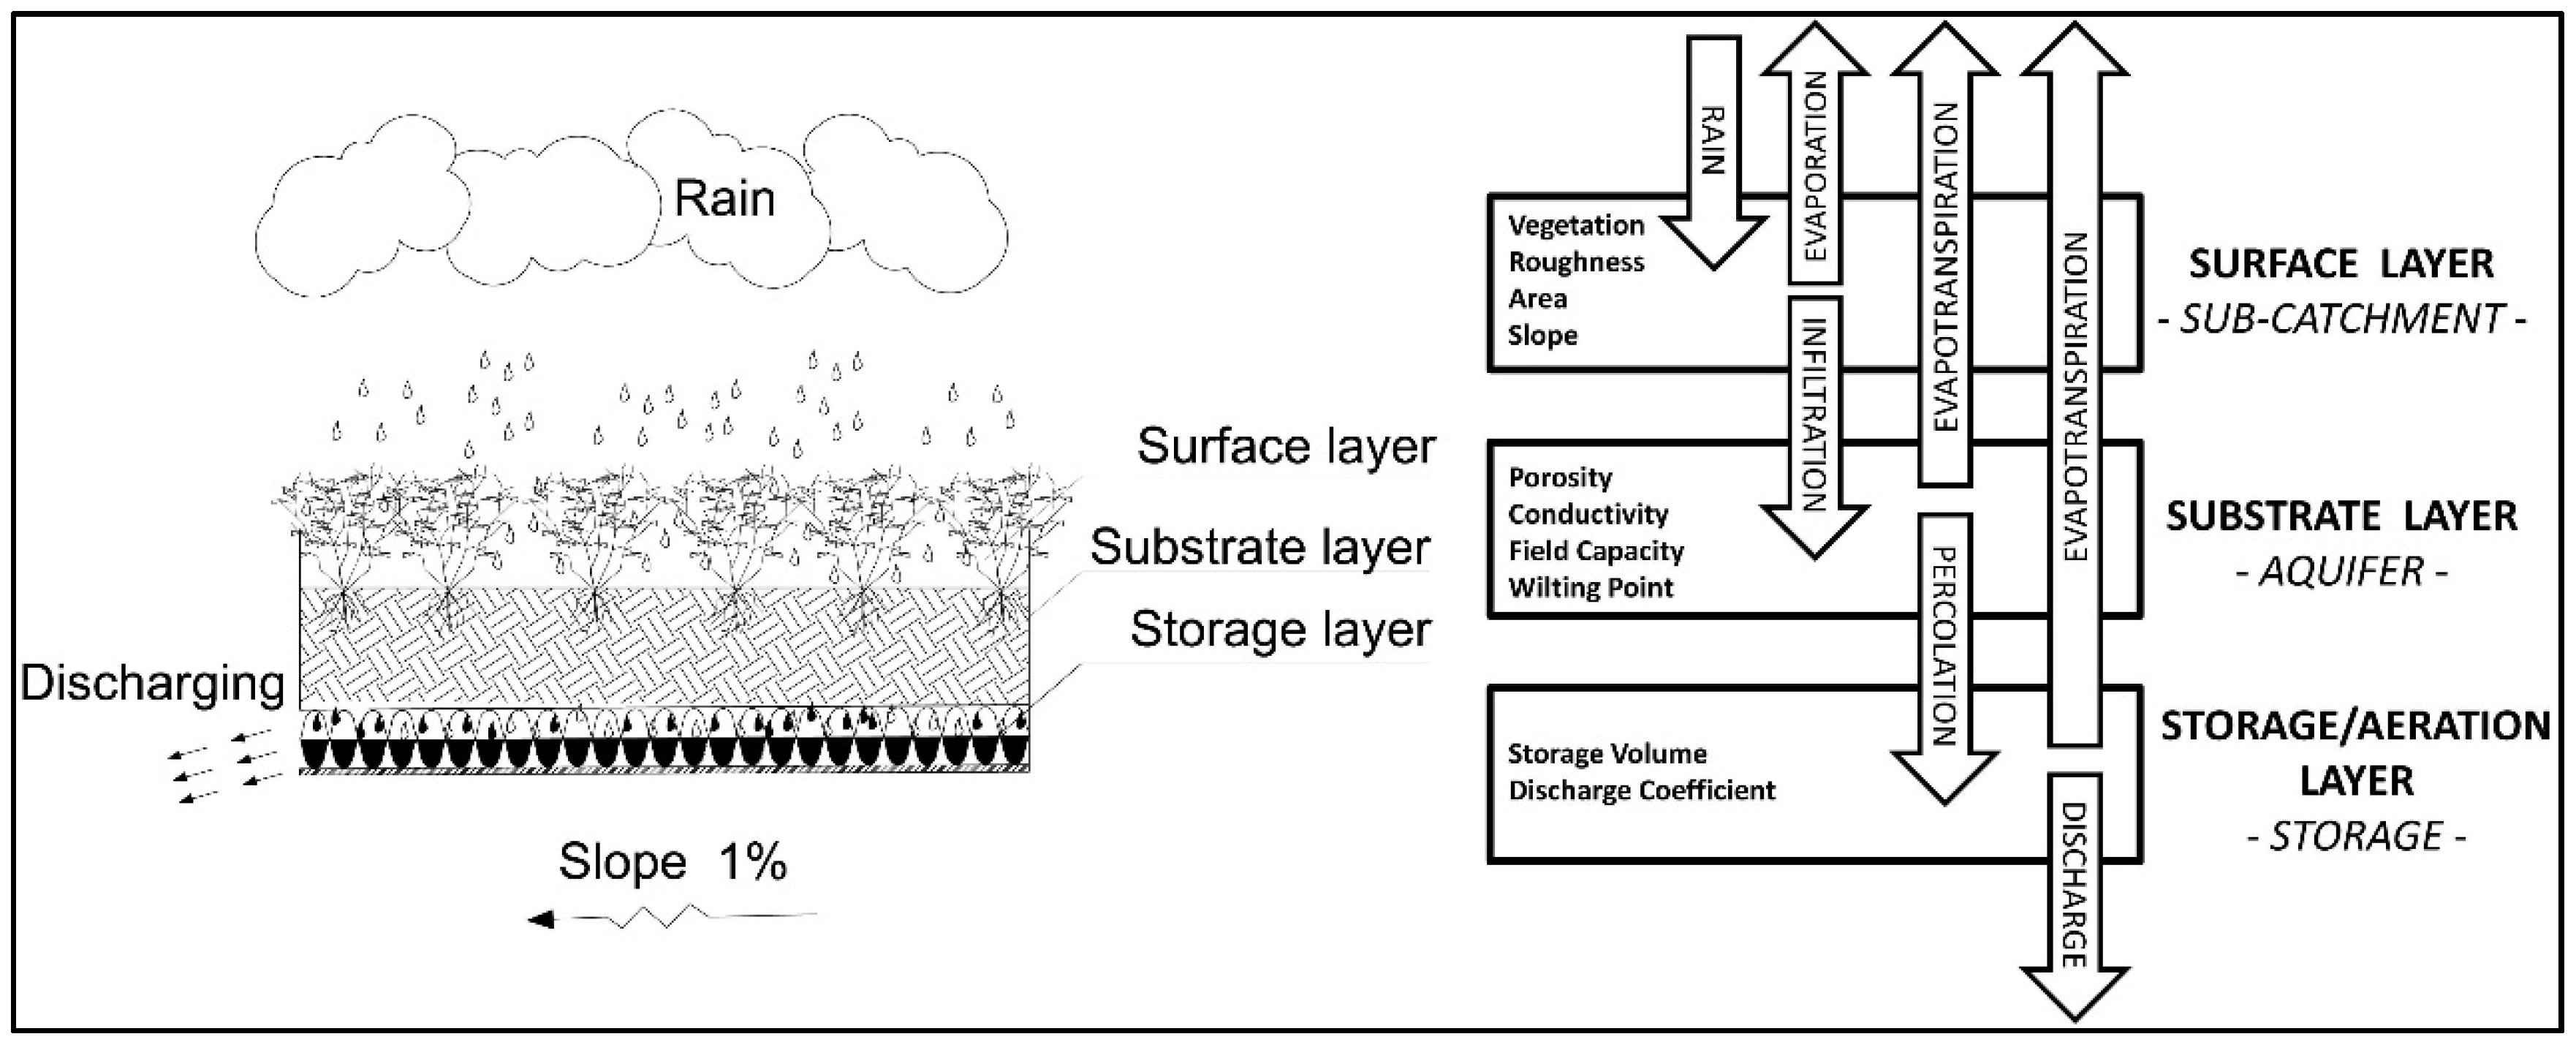
2]. This model conceptually represents a green roof into a series of three individual elements: (1) surface layer; (2) substrate layer; (3) storage/aeration; and storage layer (
Figure 1). Each component of the model, which was built in order to exploit the basic elements of SWMM model (EPA, 2002), is subjected to a specific hydrologic and hydraulic process.
Figure 1.
Vegetated roof stratigraphy and structure of the conceptual model.
Figure 1.
Vegetated roof stratigraphy and structure of the conceptual model.
The top layer exposed to the atmosphere and covered by vegetation is modeled as sub-catchment, where infiltration, evaporation processes, and runoff generation occur. The sub-catchment is defined by the area and the slope of the vegetated roof, the roughness, and the typology of vegetation. Rainfall is the input of the surface layer, while the output are evapotranspiration and infiltration flow; the latter, in turn, becomes the only input of the substrate layer. Green–Ampt equations are used to describe the infiltration process.
The substrate layer is modeled as an aquifer. The flow from the substrate layer to the storage layer is controlled by a percolation equation, which was formulated from Darcy’s Law for unsaturated flow, in which the hydraulic conductivity (K) is a function of the moisture content (θ). For calculation of percolation, Carbone
et al. assumed that the gradient, Δθ/Δz, is the difference between moisture content θ in the substrate and field capacity (FC) at the boundary with the storage layer, divided by the average depth of the substrate, dz/2. Thus:
The percolation rate is the input for the third module, relating to the storage/aeration layer, which is represented by a storage tank with geometrical characteristics dependent on the particular technology used. The relationships used to describe the hydraulic behavior of the storage tank are the balance Equation (2) and the discharging Equation (3), written as follows:
where
Qu is the flow rate eluted from the vegetated roof;
Qe is the flow percolation rate; μ is the discharging coefficient;
B is the width of the storage and
h is the water level in the storage over the weir. In this model Carbone
et al. assumed, for pe-ad drainage layer, a value of μ equal to 1.45.
Finally the output of the system is introduced into the last module represented by a conduit, governed by flow routing equations.
To take into account the influence of the initial moisture of the soil, Carbone
et al. [
2] considered a model parameter which varies according to the antecedent dry weather period. The calibration of this parameter was carried out in Carbone
et al. [
2]. The evapotranspiration process was modeled with the Thornthwaite’s equation based on daily temperature data.
In this study, the conceptual model, previously validated by Carbone
et al. [
2], was used with the aim of estimating the runoff from the experimental green roof. Specifically, through the conceptual model provided, the subsurface runoff coefficient is evaluated at both daily and event-time scales. The model was loaded with the daily rainfall data from Cosenza, Italy and Thessaloniki, Greece, to obtain the daily coefficient and the one-minute rainfall data from Cosenza, Italy to obtain the event-based coefficient.
3.4. Multiple Linear Regression Analysis
The multiple linear regression analysis is used to assess the correlation between two or more independent variables and a single continuous dependent variable. The multiple linear regression equation is:
where
Y is the predicted or expected value of the dependent variable,
X1 through
Xp are p distinct independent or predictor variables, β
0 is the value of Y when all of the independent variables (
X1 through
Xp) are equal to zero, β
1 through β
P are the estimated regression coefficients, and ε is the residual term which translates the inability of the model to accurately reproduce the observed reality. In this study the independent variables are the hydrological parameters, such as precipitation depth, rainfall intensity, rainfall duration, and antecedent dry weather period, while the dependent variable is the runoff depth.
In order to evaluate the significance of each regression coefficient a t-test was used. A p-value of 0.05 was considered in this study. To define how closely the data are fit by the regression line, the R2 coefficient is evaluated. In this study the multiple linear regression analysis was carried out to statistically define the most influencing hydrological factors on the hydraulic efficiency of a given green roof.
This analysis is carried out by firstly defining the subsurface runoff coefficient at a daily scale, by using daily rainfall data as input data in the conceptual model. The daily subsurface runoff coefficient is computed as the ratio between the total runoff depth and the total rainfall depth during a day. The data set from Cosenza, Italy is used to obtain the multi-regression relationships, which were, then, validated with the data set from Thessaloniki, Greece. Secondly, the subsurface runoff coefficient is evaluate at event-time scale by using one-minute data and the multi-regression analysis is carried out again for this dataset.
4. Results and Discussion
First of all, the minimum interevent time period specific for the green roof studied is defined. Based on the assumptions made in
Section 3.2, the minimum interevent time period corresponds to the maximum residence time that occurs in the system. In this study, to obtain the maximum residence time of the green roof, the conceptual model, described in
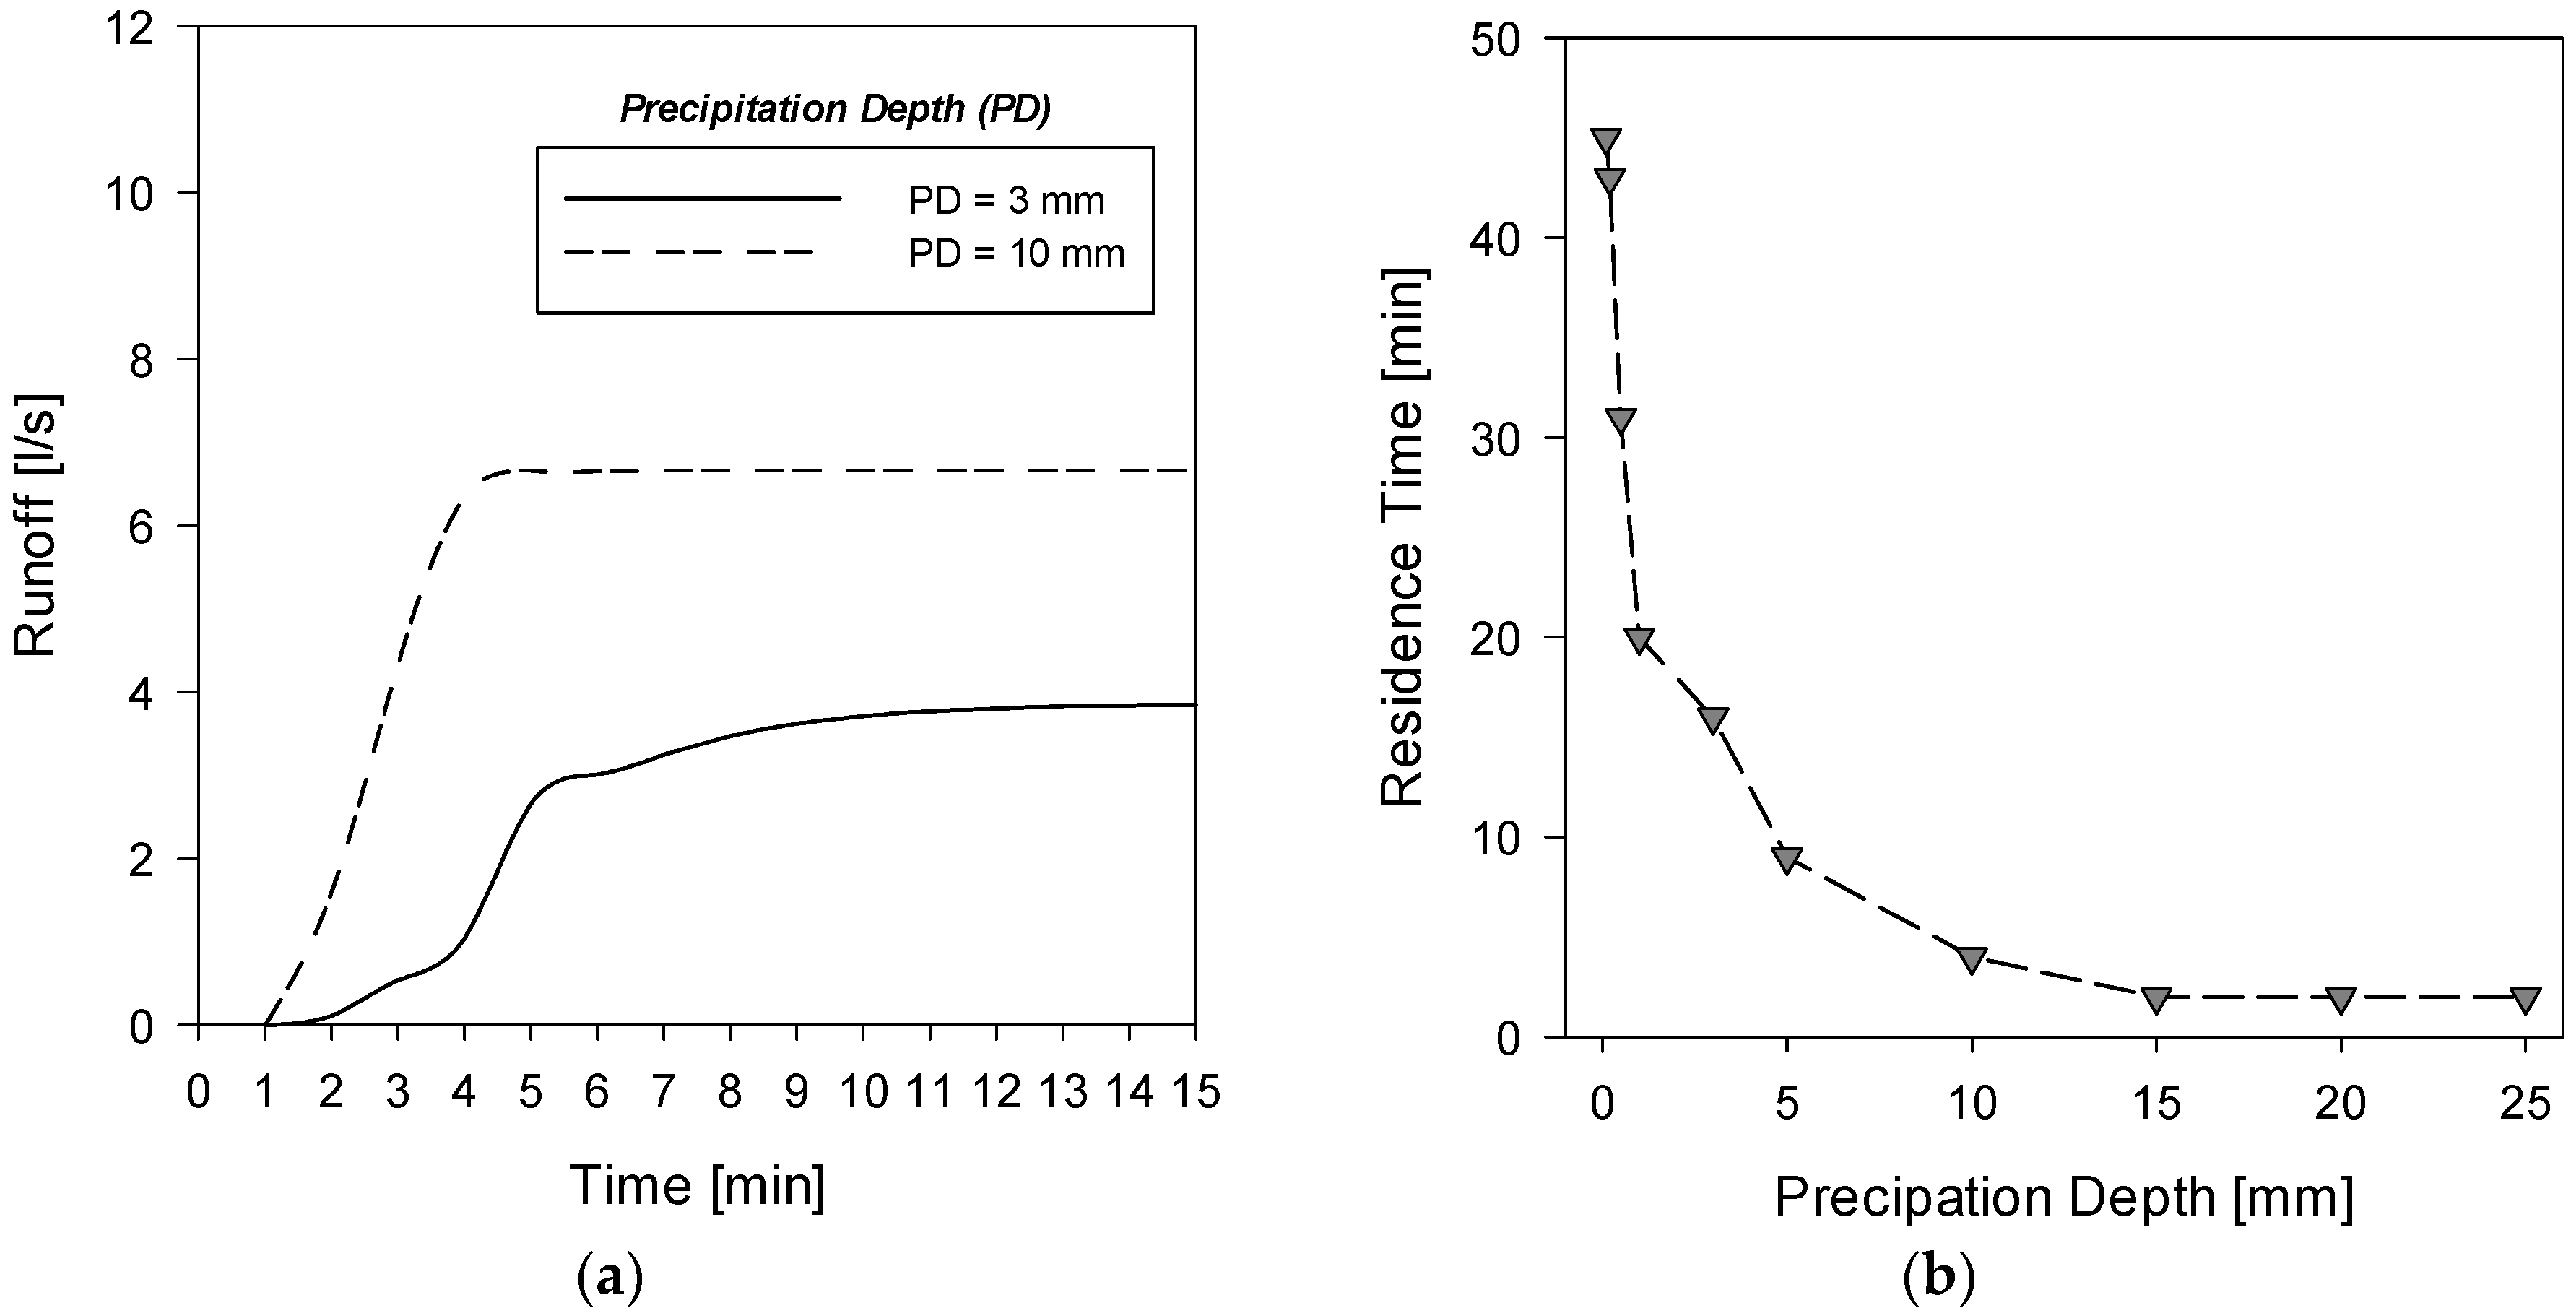
Section 3.2, is loaded with a series of constant rainfall depths, varying from 0.1 mm (corresponding to a rainfall intensity of 0.05 mm/h) to 25 mm (corresponding to a rainfall intensity of 12.5 mm/h). In
Figure 2a, the distributions of flow rate delivered at the outlet section of the green roof are reported for the different rainfall inputs. As can be observed, for each constant rainfall event, the flow rate increases, until it reaches an asymptotic value. The asymptotic value occurs when all the fluid particles reach the outlet section and represents the residence time of the system for the given rainfall input.
In
Figure 2b the residence time values obtained for the different rainfall events are reported. It can be observed that the residence time decreases as the rainfall depth increases. While the residence time reaches a constant value of around 5 min for precipitation depth higher than 5 mm, the residence time varies from 8 min to 45 min, for low rainfall depths (<5 mm). Based on the assumption described in section 3.2, it is possible to establish that the minimum inter-event period of the green roof of interest is 40 min.
Figure 2.
(a) Runoff from the green roof for two constant precipitation depths (3 mm, 10 mm); and (b) residence time of the system as a function of constant precipitation depth.
Figure 2.
(a) Runoff from the green roof for two constant precipitation depths (3 mm, 10 mm); and (b) residence time of the system as a function of constant precipitation depth.
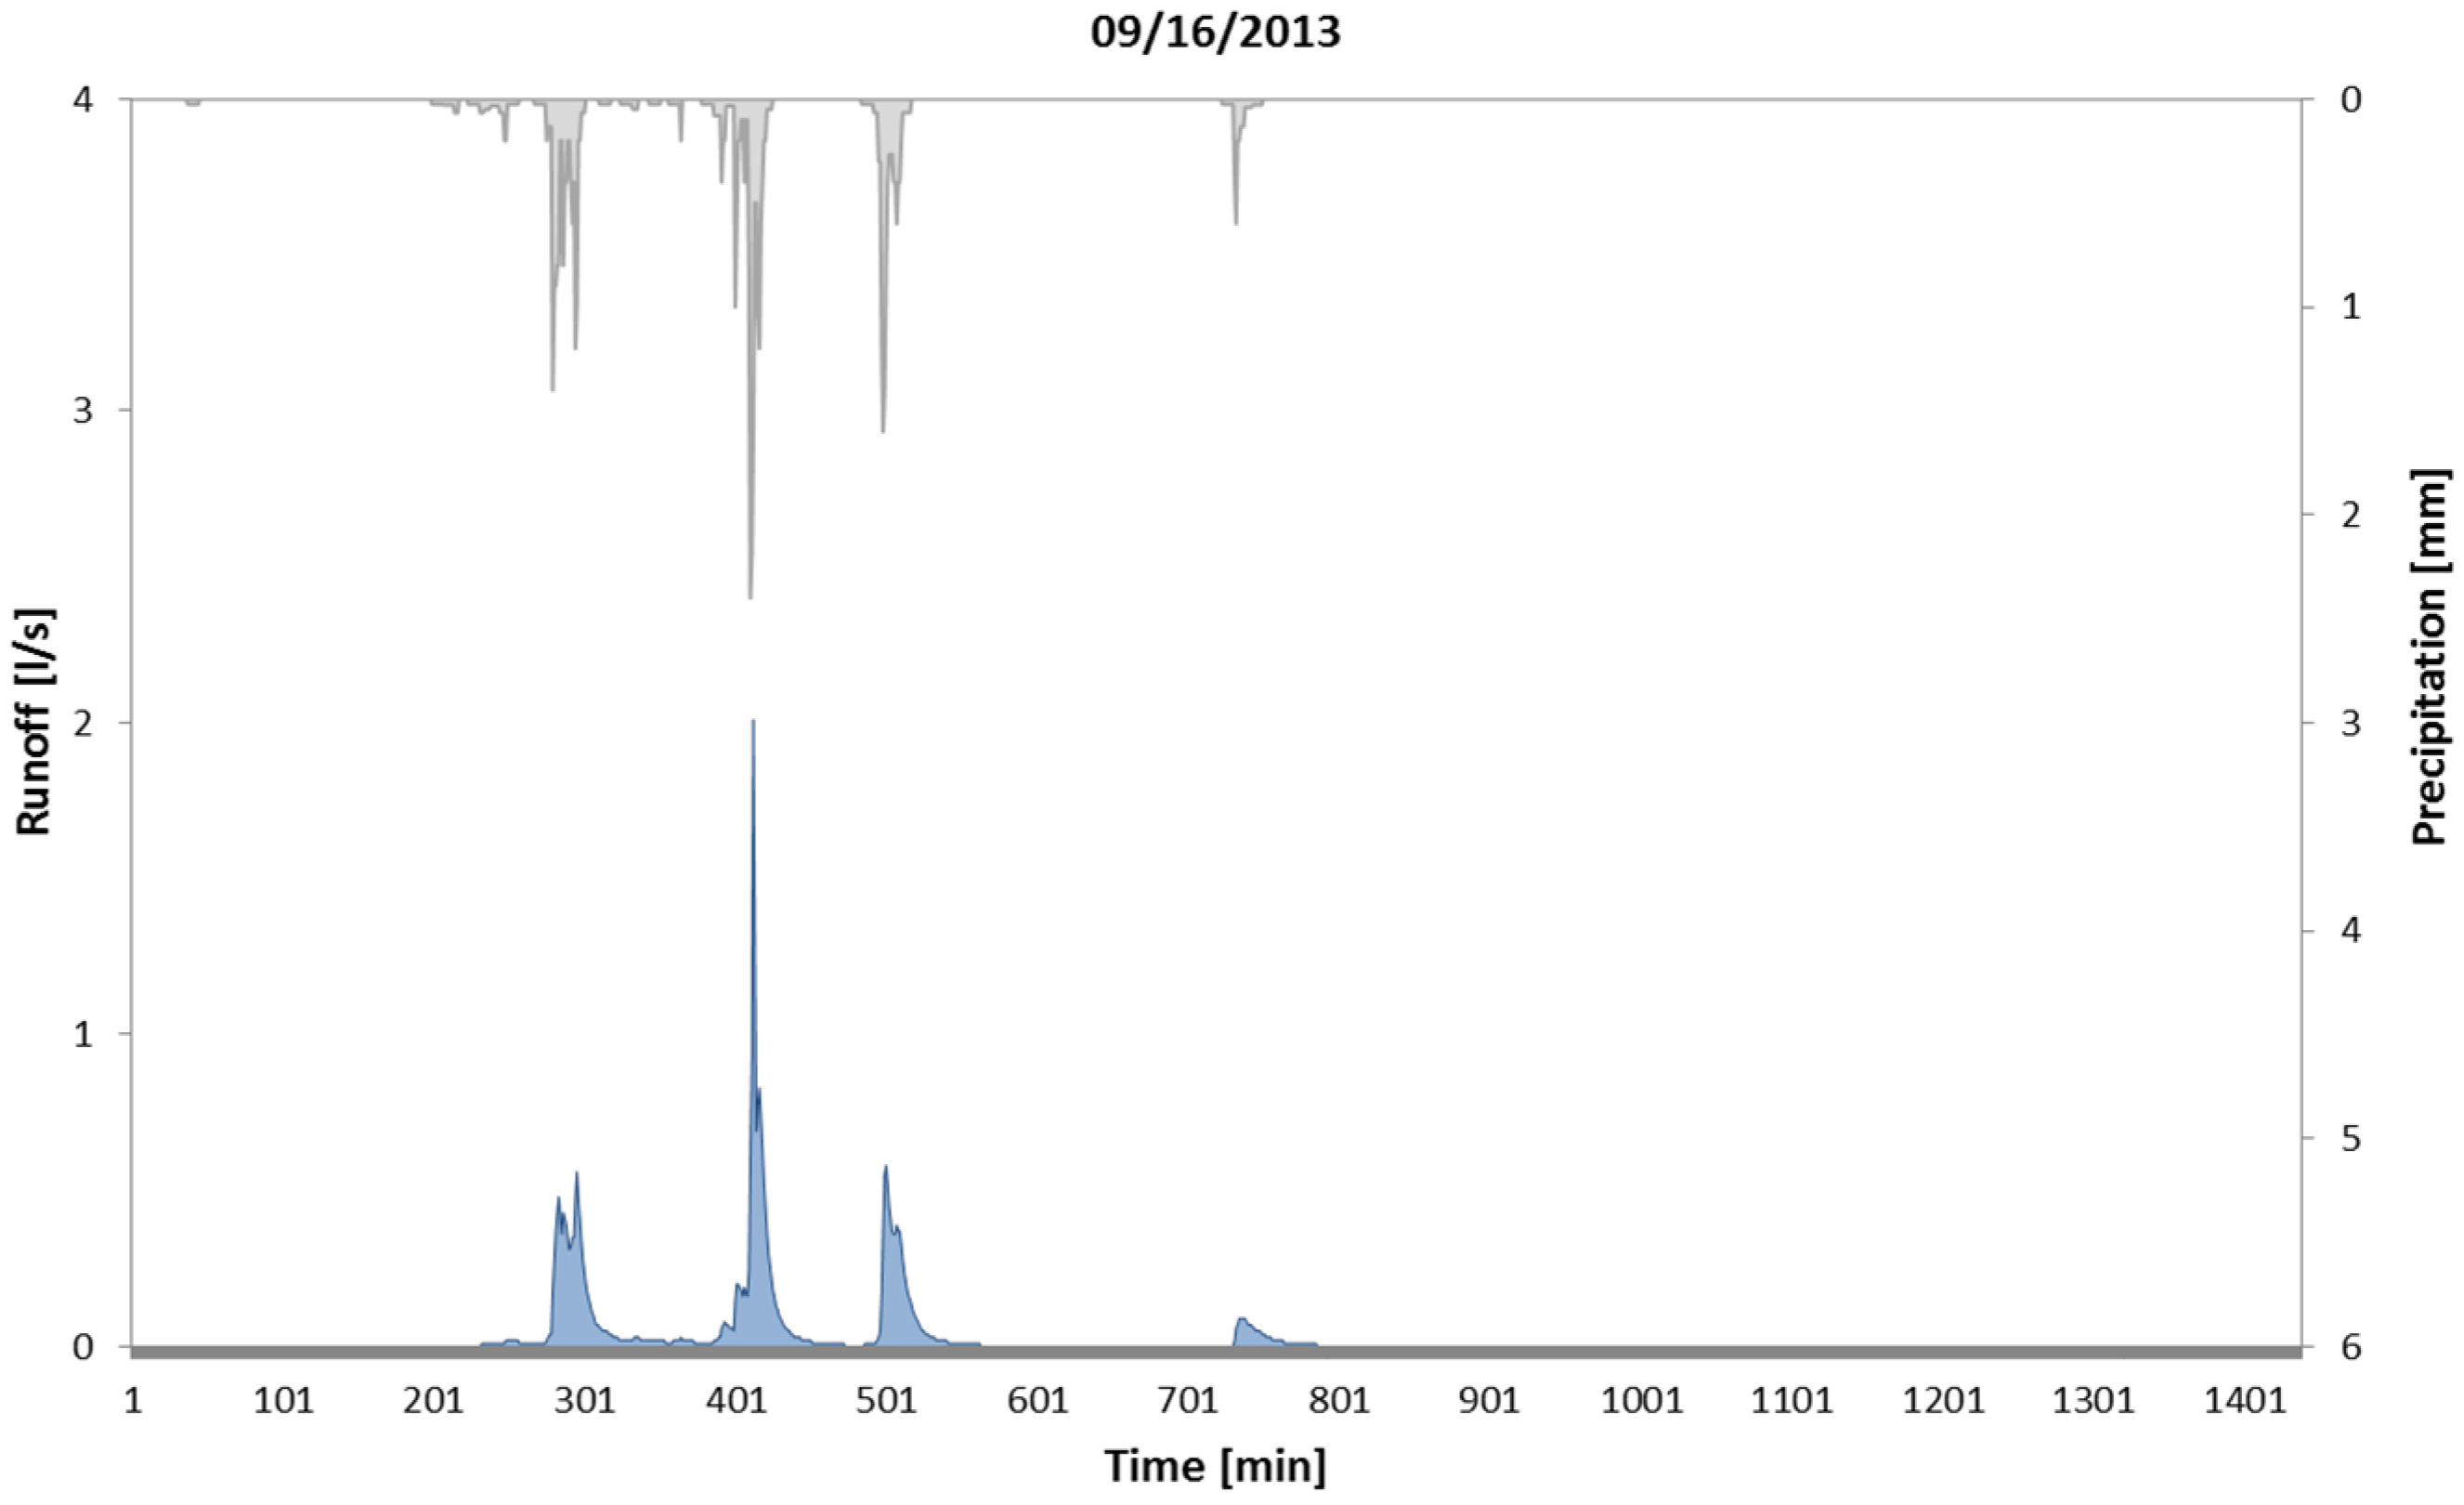
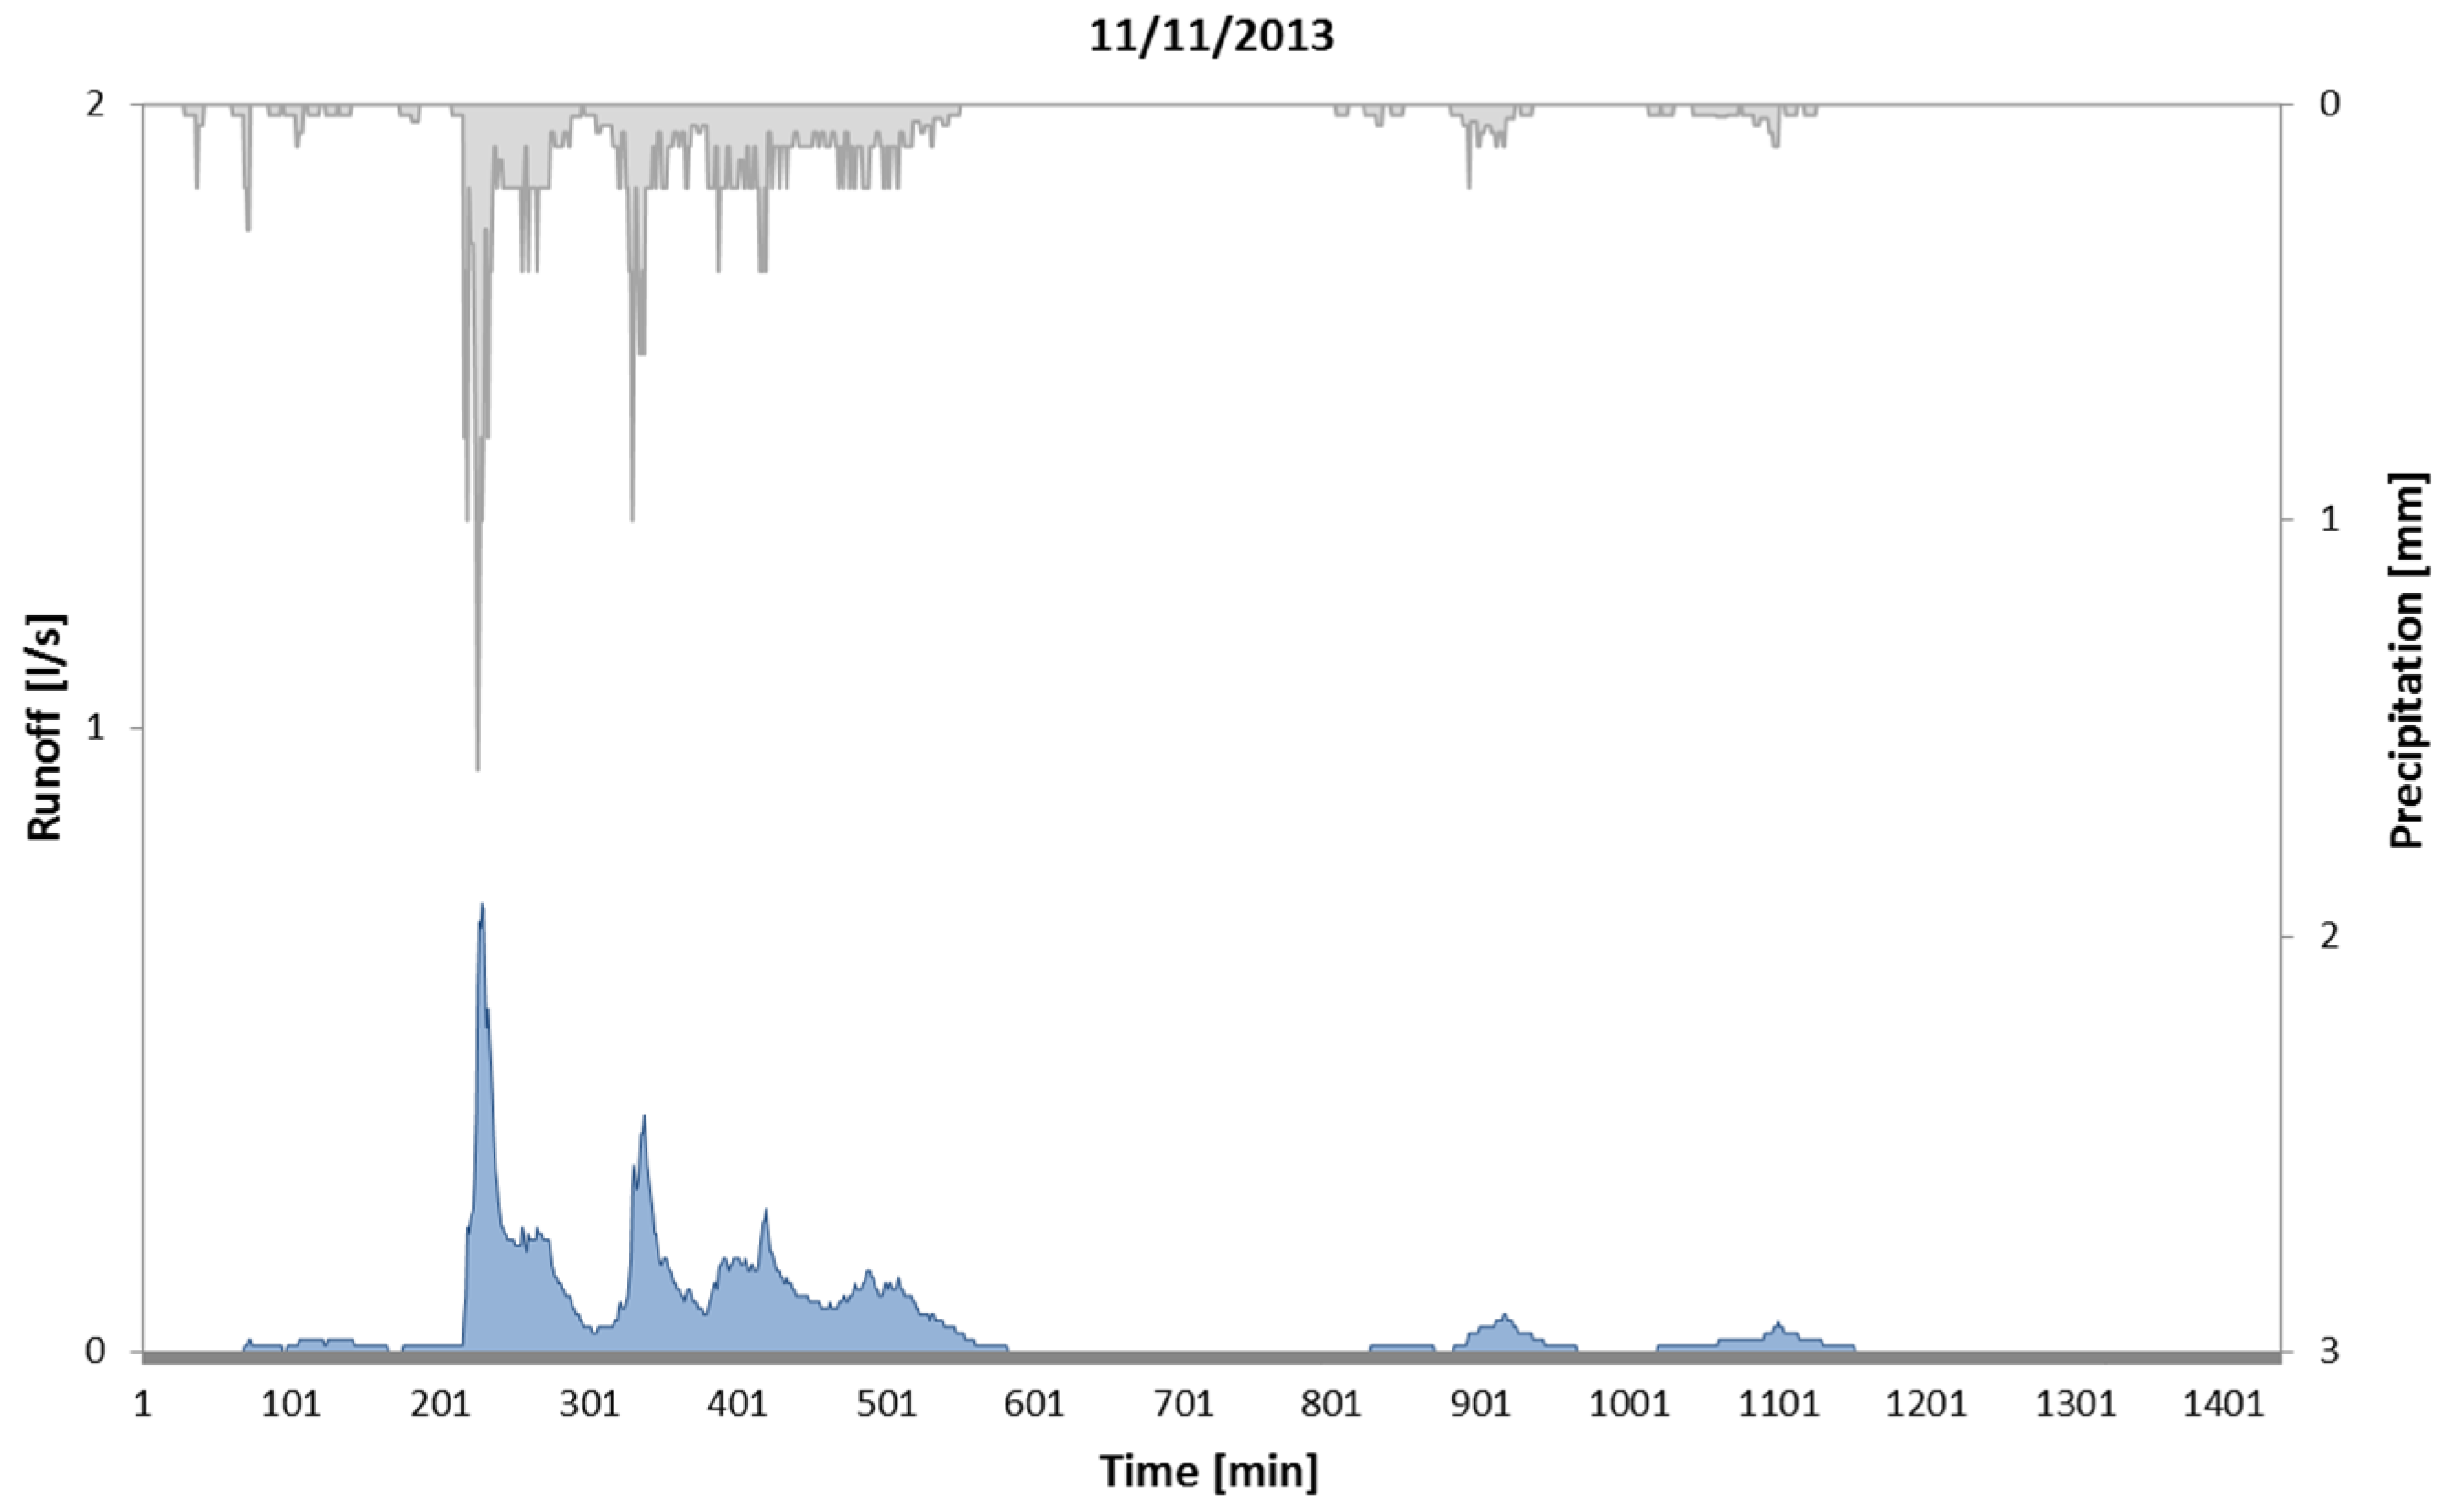
Through the conceptual model provided, the runoff volumes generated from the 69 rainfall events recorded in Cosenza (Italy) and the 66 rainfall events in Thessaloniki (Greece) were obtained. In the
Figure A1 the hydrographs modeled for two selected rainfall-runoff events are reported. In
Table 2 and
Table 3 the results obtained in terms of total runoff volumes and subsurface runoff coefficients on daily basis are shown. As it can be observed the subsurface runoff coefficient exhibits a high variability. For example, two events with different rainfall depths, such as the event 12/09/2013, with a total rainfall depth of 2.40 mm, and the event 02/01/2014, with a total rainfall depth of 30.70 mm, produced runoff volumes of 0.85 mm and 29.15 mm, respectively. The subsurface runoff coefficient is equal to 0.35 for the first event and 0.95 for the second one. In
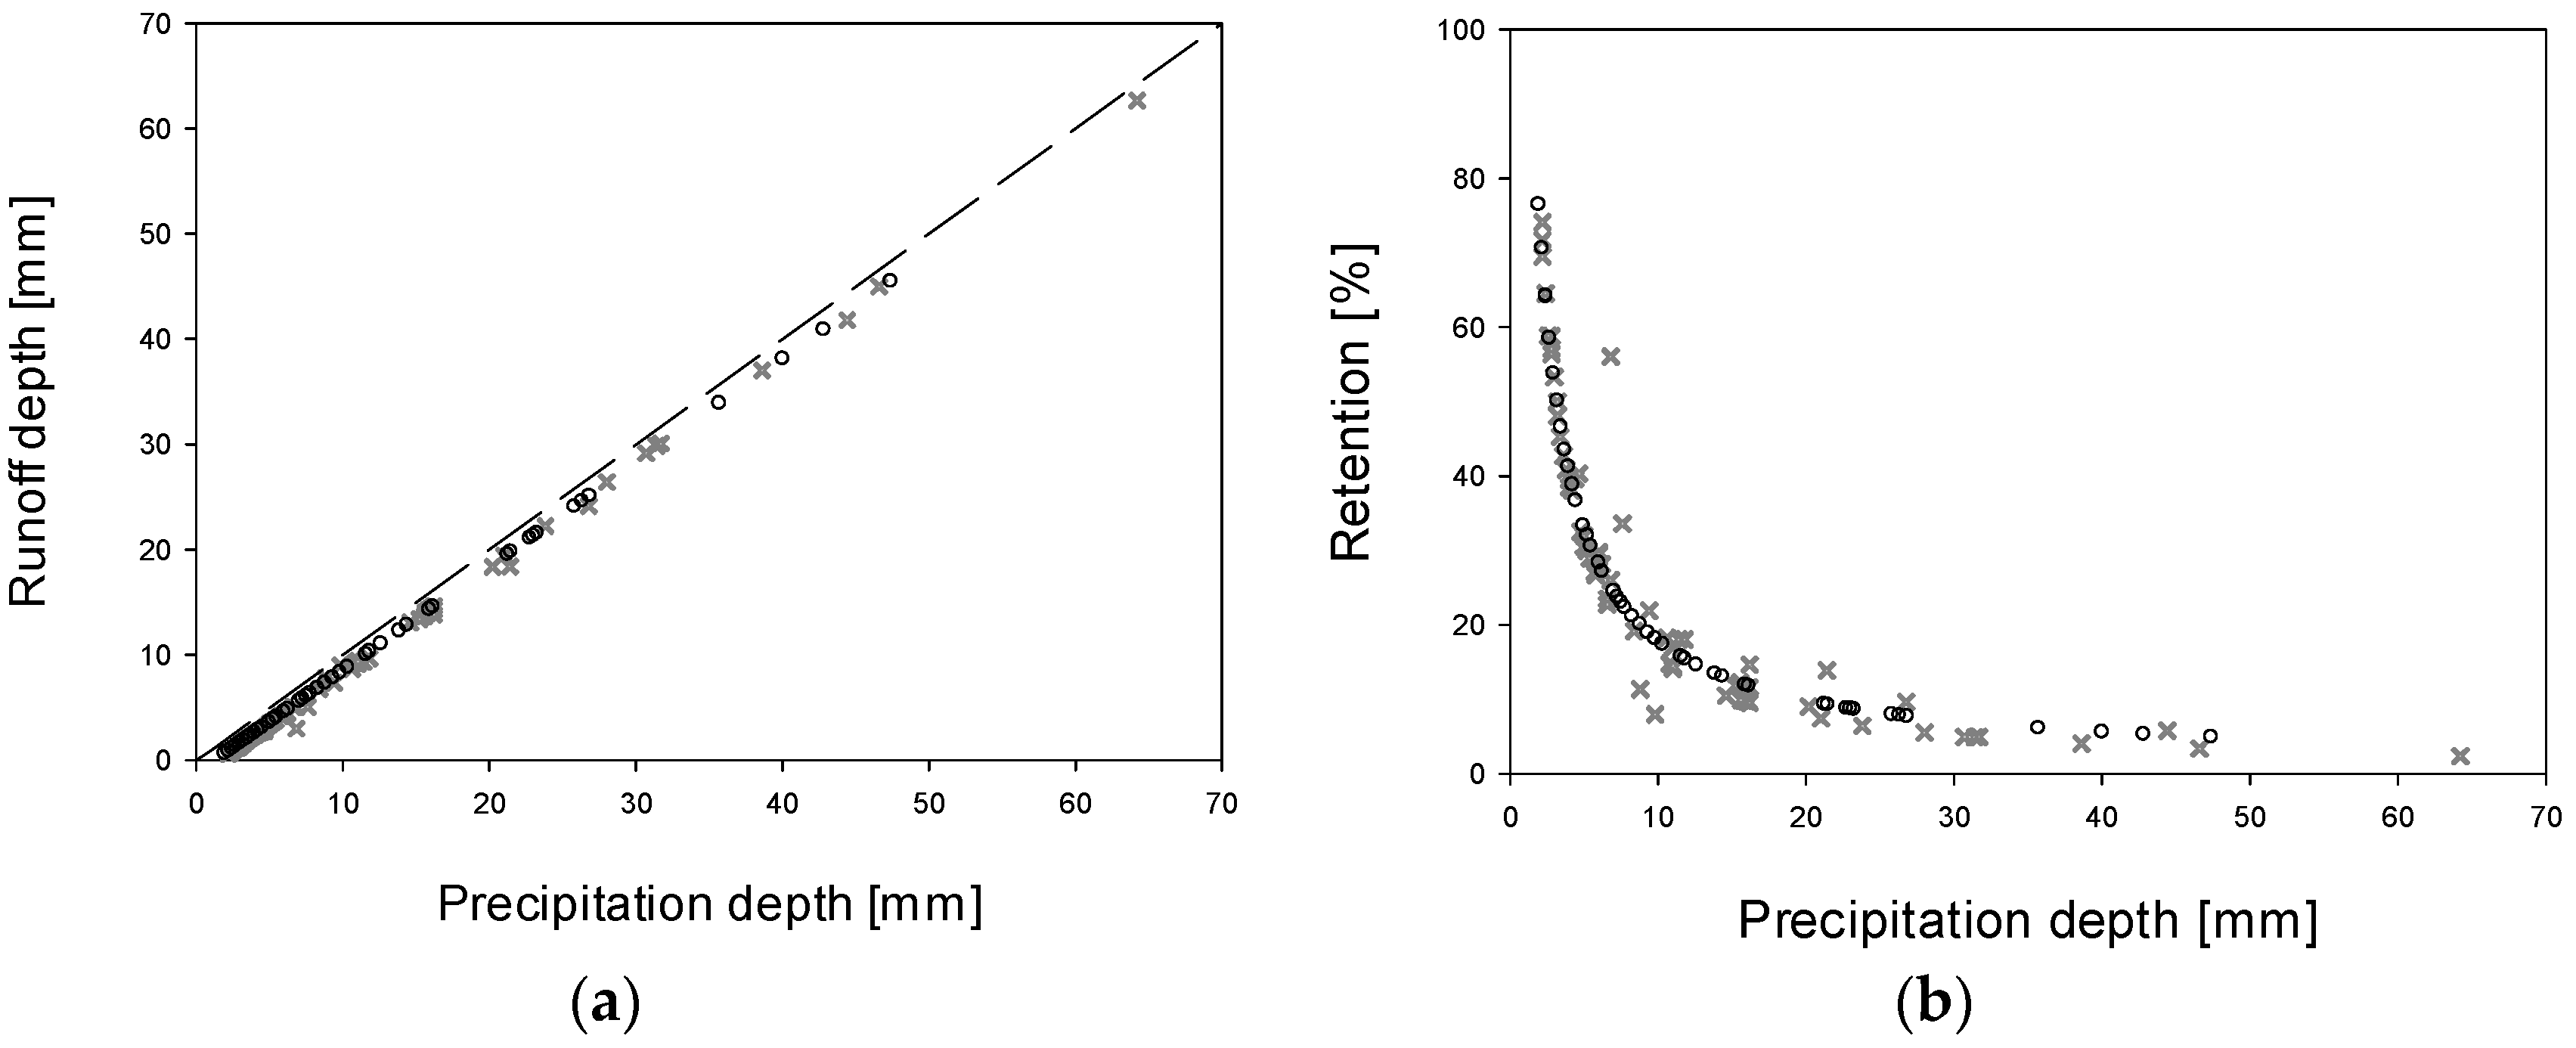
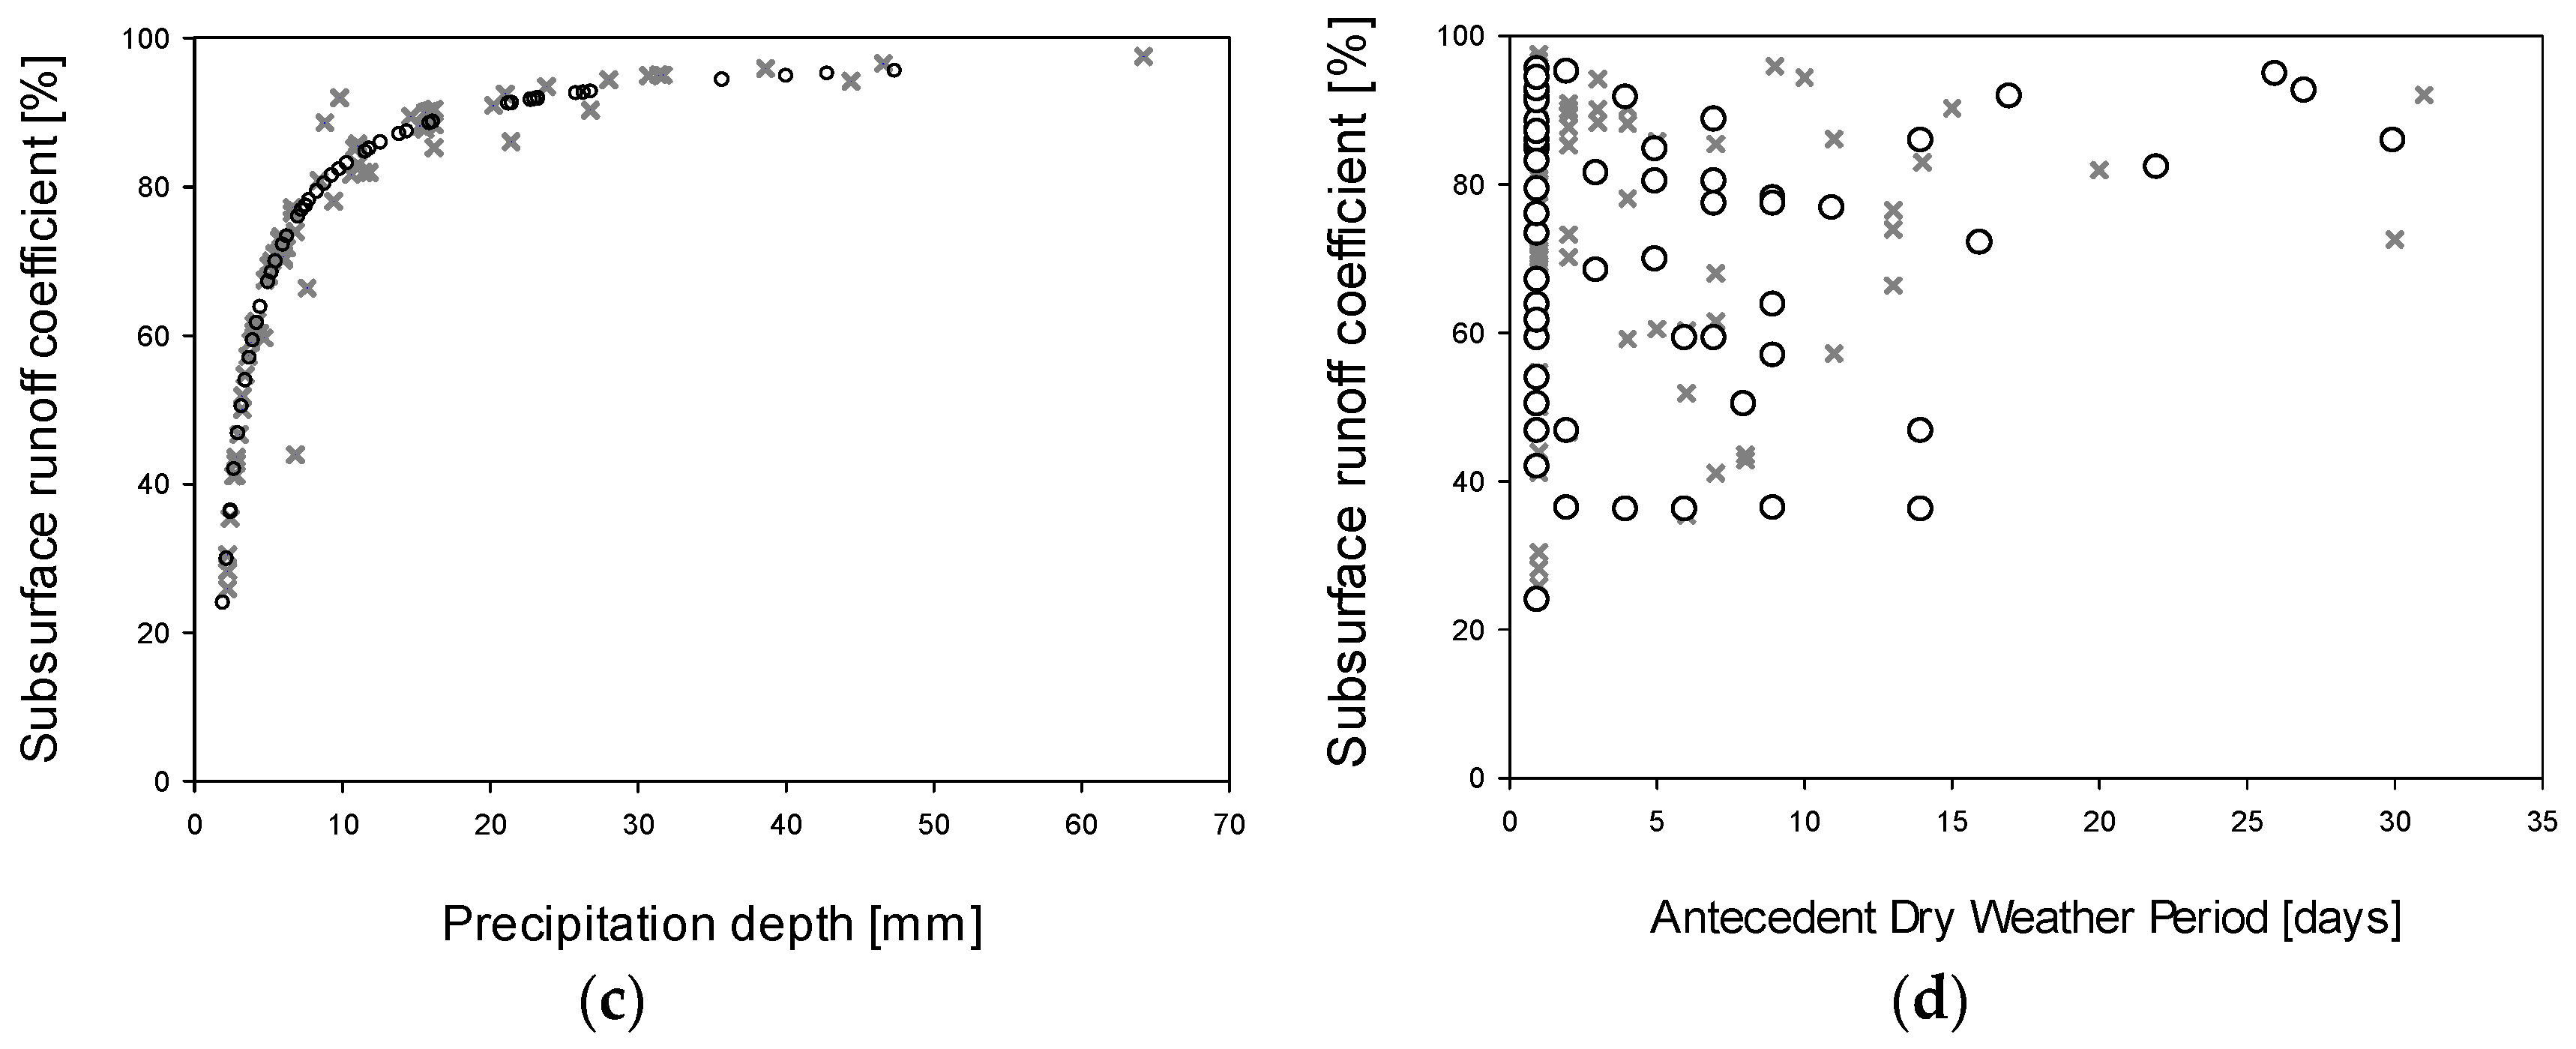
Figure 3a, the runoff depth is reported as a function of the precipitation depth for the two sites. The data closely lay on the bisector, thus demonstrating the strong relationship between rainfall and runoff values for both rainfall datasets. The same consideration can be drawn from
Figure 3b, in which the retention percent is strongly related to the precipitation depth. In fact, the retention percent is the inverse of the subsurface runoff coefficient and it represents the amount of water that the green roof retains after a rainfall event. Specifically,
Figure 3b shows that the retention percent exponentially drops as the rainfall depth increases. The maximum retention capacity is 80%. When the precipitation depth is greater than 10 mm, the retention capacity varies from 20% to 0%. In
Figure 3c the subsurface runoff coefficient is reported as a function of the precipitation depth. As expected, the two parameters are strongly correlated and exhibit an opposite trend of the results in
Figure 3b. Indeed, the surfurface runoff coefficient values rise as the rainfall increases, until an asymptotic value of around 95% is reached. This suggests that the hydraulic performance of the green roof is fairly high for small rainfall events; indeed, for precipitation lower than 5 mm, the green roof releases up to 60% of the rainfall volumes, while for precipitation higher than 5 mm, the system reatains at most 35%. In
Figure 3d the subsurface runoff coefficient, as a function of the antecedent dry weather period, is reported. In this case, the results in terms of the subsurface runoff coefficient are scattered and seem to not be strongly related to the antecedent dry weather period. All of the plots in
Figure 3 show that the results from the two sites in Mediterreanean area follow the same trend, suggesting that the climate condition impacts the hydraulic performance of a green roof.
Table 2.
Precipitation depth (PD), runoff depth (RD), and subsurface runoff coefficient (SRC) for daily rainfall data of Cosenza, Italy.
Table 2.
Precipitation depth (PD), runoff depth (RD), and subsurface runoff coefficient (SRC) for daily rainfall data of Cosenza, Italy.
| Event Data | PD (mm) | RD (mm) | SRC (%) |
|---|
| 07/07/2013 | 8.8 | 7.8 | 0.89 |
| 08/09/2013 | 9.8 | 9.02 | 0.92 |
| 08/10/2013 | 6.6 | 5.1 | 0.77 |
| 09/09/2013 | 6 | 4.36 | 0.73 |
| 09/12/2013 | 15.8 | 14.24 | 0.9 |
| 09/13/2013 | 3.4 | 1.86 | 0.55 |
| 09/16/2013 | 44.4 | 41.82 | 0.94 |
| 09/30/2013 | 11 | 9.13 | 0.83 |
| 10/01/2013 | 5.2 | 3.64 | 0.7 |
| 10/16/2013 | 16 | 14.44 | 0.9 |
| 11/05/2013 | 11.4 | 9.34 | 0.82 |
| 11/10/2013 | 4 | 2.42 | 0.61 |
| 11/11/2013 | 64.2 | 62.65 | 0.98 |
| 11/13/2013 | 6 | 4.21 | 0.7 |
| 11/15/2013 | 16.2 | 13.82 | 0.85 |
| 11/24/2013 | 46.6 | 45.02 | 0.97 |
| 11/25/2013 | 21 | 19.43 | 0.93 |
| 11/26/2013 | 6.81 | 2.99 | 0.44 |
| 11/27/2013 | 5.73 | 4.18 | 0.73 |
| 11/30/2013 | 16.2 | 14.31 | 0.88 |
| 12/01/2013 | 31.4 | 29.86 | 0.95 |
| 12/03/2013 | 15.6 | 14.05 | 0.9 |
| 12/09/2013 | 2.4 | 0.85 | 0.35 |
| 12/15/2013 | 3.2 | 1.66 | 0.52 |
| 12/26/2013 | 21.4 | 18.43 | 0.86 |
| 12/27/2013 | 4.75 | 3.21 | 0.67 |
| 12/31/2013 | 3.8 | 2.25 | 0.59 |
| 01/13/2014 | 6.6 | 5.05 | 0.77 |
| 01/14/2014 | 6.2 | 4.45 | 0.72 |
| 01/15/2014 | 3.2 | 1.6 | 0.5 |
| 01/19/2014 | 9.4 | 7.34 | 0.78 |
| 01/20/2014 | 11.8 | 9.67 | 0.82 |
| 01/21/2014 | 31.68 | 30.11 | 0.95 |
| 01/22/2014 | 5.4 | 3.83 | 0.71 |
| 01/28/2014 | 4.4 | 2.65 | 0.6 |
| 02/01/2014 | 30.7 | 29.16 | 0.95 |
| 02/02/2014 | 6 | 4.23 | 0.71 |
| 02/03/2014 | 23.8 | 22.26 | 0.94 |
| 02/04/2014 | 2.2 | 0.62 | 0.28 |
| 02/06/2014 | 5.8 | 4.25 | 0.73 |
| 02/08/2014 | 3 | 1.4 | 0.47 |
| 02/12/2014 | 26.76 | 24.17 | 0.9 |
| 02/13/2014 | 2.2 | 0.67 | 0.3 |
| 02/21/2014 | 2.8 | 1.22 | 0.44 |
| 03/01/2014 | 2.8 | 1.2 | 0.43 |
| 03/02/2014 | 5 | 3.47 | 0.69 |
| 03/04/2014 | 20.2 | 18.37 | 0.91 |
| 03/05/2014 | 4.68 | 2.79 | 0.6 |
| 03/06/2014 | 15.7 | 13.89 | 0.88 |
| 03/07/2014 | 2.2 | 0.57 | 0.26 |
| 03/08/2014 | 4.2 | 2.6 | 0.62 |
| 03/15/2014 | 5 | 3.4 | 0.68 |
| 03/24/2014 | 38.6 | 37.03 | 0.96 |
| 03/25/2014 | 2.8 | 1.15 | 0.41 |
| 03/27/2014 | 15.57 | 13.66 | 0.88 |
| 03/28/2014 | 16.2 | 14.65 | 0.9 |
| 04/04/2014 | 2.6 | 1.07 | 0.41 |
| 04/05/2014 | 10.6 | 8.66 | 0.82 |
| 04/06/2014 | 10.8 | 9.2 | 0.85 |
| 04/16/2014 | 28 | 26.44 | 0.94 |
| 04/23/2014 | 4 | 2.46 | 0.62 |
| 04/28/2014 | 11 | 9.44 | 0.86 |
| 04/29/2014 | 8.4 | 6.79 | 0.81 |
| 05/03/2014 | 15.23 | 13.43 | 0.88 |
| 05/16/2014 | 6.8 | 5.03 | 0.74 |
| 05/29/2014 | 7.61 | 5.05 | 0.66 |
| 06/01/2014 | 14.6 | 13.07 | 0.89 |
| 06/12/2014 | 3.6 | 2.06 | 0.57 |
| 06/19/2014 | 11 | 9.4 | 0.85 |
| | 856.82 | 737.64 | 0.73 |
Table 3.
Precipitation depth (PD), runoff depth (RD), and subsurface runoff coefficient (SRC) for daily rainfall data of Thessaloniki, Greece.
Table 3.
Precipitation depth (PD), runoff depth (RD), and subsurface runoff coefficient (SRC) for daily rainfall data of Thessaloniki, Greece.
| Event Data | PD (mm) | RD (mm) | SRC (%) |
|---|
| 01/02/2014 | 2.29 | 0.68 | 0.3 |
| 01/16/2014 | 3.05 | 1.42 | 0.46 |
| 01/25/2014 | 7.87 | 6.14 | 0.78 |
| 01/26/2014 | 4.32 | 2.65 | 0.61 |
| 01/29/2014 | 5.33 | 3.64 | 0.68 |
| 02/07/2014 | 7.62 | 5.88 | 0.77 |
| 02/13/2014 | 2.54 | 0.91 | 0.36 |
| 02/23/2014 | 11.68 | 9.87 | 0.84 |
| 02/24/2014 | 2.79 | 1.17 | 0.42 |
| 02/25/2014 | 6.35 | 4.64 | 0.73 |
| 03/02/2014 | 8.89 | 7.12 | 0.8 |
| 03/03/2014 | 11.68 | 9.87 | 0.84 |
| 03/04/2014 | 14.48 | 12.62 | 0.87 |
| 03/05/2014 | 8.38 | 6.63 | 0.79 |
| 03/06/2014 | 22.86 | 20.9 | 0.91 |
| 03/07/2014 | 3.05 | 1.42 | 0.46 |
| 03/11/2014 | 2.54 | 0.91 | 0.36 |
| 03/28/2014 | 23.37 | 21.4 | 0.92 |
| 04/08/2014 | 7.37 | 5.64 | 0.77 |
| 04/17/2014 | 4.57 | 2.91 | 0.64 |
| 04/18/2014 | 7.11 | 5.39 | 0.76 |
| 04/25/2014 | 8.89 | 7.12 | 0.8 |
| 04/26/2014 | 7.11 | 5.39 | 0.76 |
| 04/27/2014 | 5.08 | 3.4 | 0.67 |
| 04/28/2014 | 2.03 | 0.48 | 0.24 |
| 04/29/2014 | 11.94 | 10.13 | 0.85 |
| 04/30/2014 | 12.7 | 10.88 | 0.86 |
| 05/30/2014 | 12.7 | 10.88 | 0.86 |
| 06/04/2014 | 5.59 | 3.89 | 0.7 |
| 06/05/2014 | 4.06 | 2.4 | 0.59 |
| 06/19/2014 | 12.7 | 10.88 | 0.86 |
| 07/15/2014 | 40.13 | 37.98 | 0.95 |
| 07/16/2014 | 21.34 | 19.4 | 0.91 |
| 08/07/2014 | 9.91 | 8.13 | 0.82 |
| 09/03/2014 | 26.42 | 24.4 | 0.92 |
| 09/07/2014 | 23.11 | 21.15 | 0.91 |
| 09/08/2014 | 4.32 | 2.65 | 0.61 |
| 09/09/2014 | 4.57 | 2.91 | 0.64 |
| 09/16/2014 | 4.06 | 2.4 | 0.59 |
| 09/17/2014 | 16 | 14.13 | 0.88 |
| 09/18/2014 | 25.91 | 23.91 | 0.92 |
| 09/19/2014 | 13.97 | 12.13 | 0.87 |
| 09/26/2014 | 7.62 | 5.88 | 0.77 |
| 09/27/2014 | 3.3 | 1.66 | 0.5 |
| 10/06/2014 | 3.81 | 2.16 | 0.57 |
| 10/07/2014 | 3.56 | 1.91 | 0.54 |
| 10/23/2014 | 6.1 | 4.38 | 0.72 |
| 10/24/2014 | 8.38 | 6.63 | 0.79 |
| 10/25/2014 | 47.5 | 45.27 | 0.95 |
| 11/08/2014 | 2.54 | 0.91 | 0.36 |
| 11/09/2014 | 21.59 | 19.64 | 0.91 |
| 11/15/2014 | 4.06 | 2.4 | 0.59 |
| 11/17/2014 | 3.05 | 1.42 | 0.46 |
| 11/20/2014 | 9.4 | 7.63 | 0.81 |
| 11/28/2014 | 3.3 | 1.66 | 0.5 |
| 12/03/2014 | 11.68 | 9.87 | 0.84 |
| 12/04/2014 | 5.08 | 3.4 | 0.67 |
| 12/06/2014 | 42.93 | 40.74 | 0.95 |
| 12/07/2014 | 10.41 | 8.62 | 0.83 |
| 12/08/2014 | 3.3 | 1.66 | 0.5 |
| 12/09/2014 | 26.92 | 24.92 | 0.93 |
| 12/10/2014 | 35.81 | 33.7 | 0.94 |
| 12/17/2014 | 16.26 | 14.38 | 0.88 |
| 12/18/2014 | 4.32 | 2.65 | 0.61 |
| 12/27/2014 | 2.54 | 0.92 | 0.36 |
| 12/29/2014 | 2.54 | 0.92 | 0.36 |
| | 726.69 | 609.71 | 0.71 |
Figure 3.
Modeled results from Cosenza (Italy) and Thessaloniki (Greece) by using daily rainfall data: (a) runoff as a function of precipitation depth; (b) retention as a function of precipitation depth; (c) subsurface runoff coefficient as a function of precipitation depth; and (d) subsurface runoff coefficient as a function of antecedent dry weather period.
In order to statistically investigate the significance of hydrological parameters, a multiple linear regression analysis was performed by using daily rainfall data collected in the city of Cosenza, Italy.
Based on the assumption that a longer antecedent dry period provides more time for the substrate to recharge its storage capacity [
16], a relationship between runoff depth
(RD), rainfall or precipitation depth
(PD) and antecedent dry weather period (
ADWP) was found.
The results of the multiple linear regression analysis are summarized in
Table 4, where the
t-statistics (significant at
p = 0.05) are presented in the same order as the parameters in the equation. Equation (5) demonstrates a strong correlation between the runoff depth and the precipitation depth, showing a
R2 of 0.99. These findings are in agreement with the results previously obtained in
Figure 3a, which shows the linear relationship between these parameters. However, to investigate the effect of the antecedent dry weather period on the hydraulic performance of the green roof, a forward regression analysis was carried out to verify its significance.
Table 4.
Multiple linear regression analysis for daily rainfall data.
Table 4.
Multiple linear regression analysis for daily rainfall data.
| Regression Equation | ADWP (days) | R2 | t-Statistic |
|---|
| RD = 0.06 + 1.16 PD | (5) | - | 0.99 | 436.88 |
| RD = −6.95 + 11.08 lnPD − 2.90 lnADWP | (6) | >4 | 0.86 | 11.06, −1.89 NS |
| RD = −4.33 + 11.52 lnPD − 4.24 lnADWP | (7) | >5 | 0.86 | 11.62, −2.59 |
This investigation has led to Equations (6) and (7) reported in
Table 4 with a good
R2 value of 0.86. However, the antecedent dry weather period (ADWP) turns out to be statistically significant, when it is longer than 5 days. In fact, when this parameter is less than five days (see Equation (6)), the
t-statistic value is not significant.
Stovin
et al. [
16] identified the antecedent dry weather period as a significant determinant of hydrological performance. However, based on the results obtained from the multi-regression analysis, they concluded that it is not possible to predict the likely retention depth associated with a particular rainfall depth or return period, even when antecedent dry weather period and rainfall intensity or other antecedent weather parameters are taken into consideration. In the present study, instead, the correlation between the runoff depth and the parameters, precipitation depth, and antecedent dry weather period showed good R
2 values. This may be due to the differences in the rainfall data sets used, green roof features and the climate conditions, since Cosenza (Italy) and Sheffield (UK) are located in Mediterranean and temperate climates, respectively.
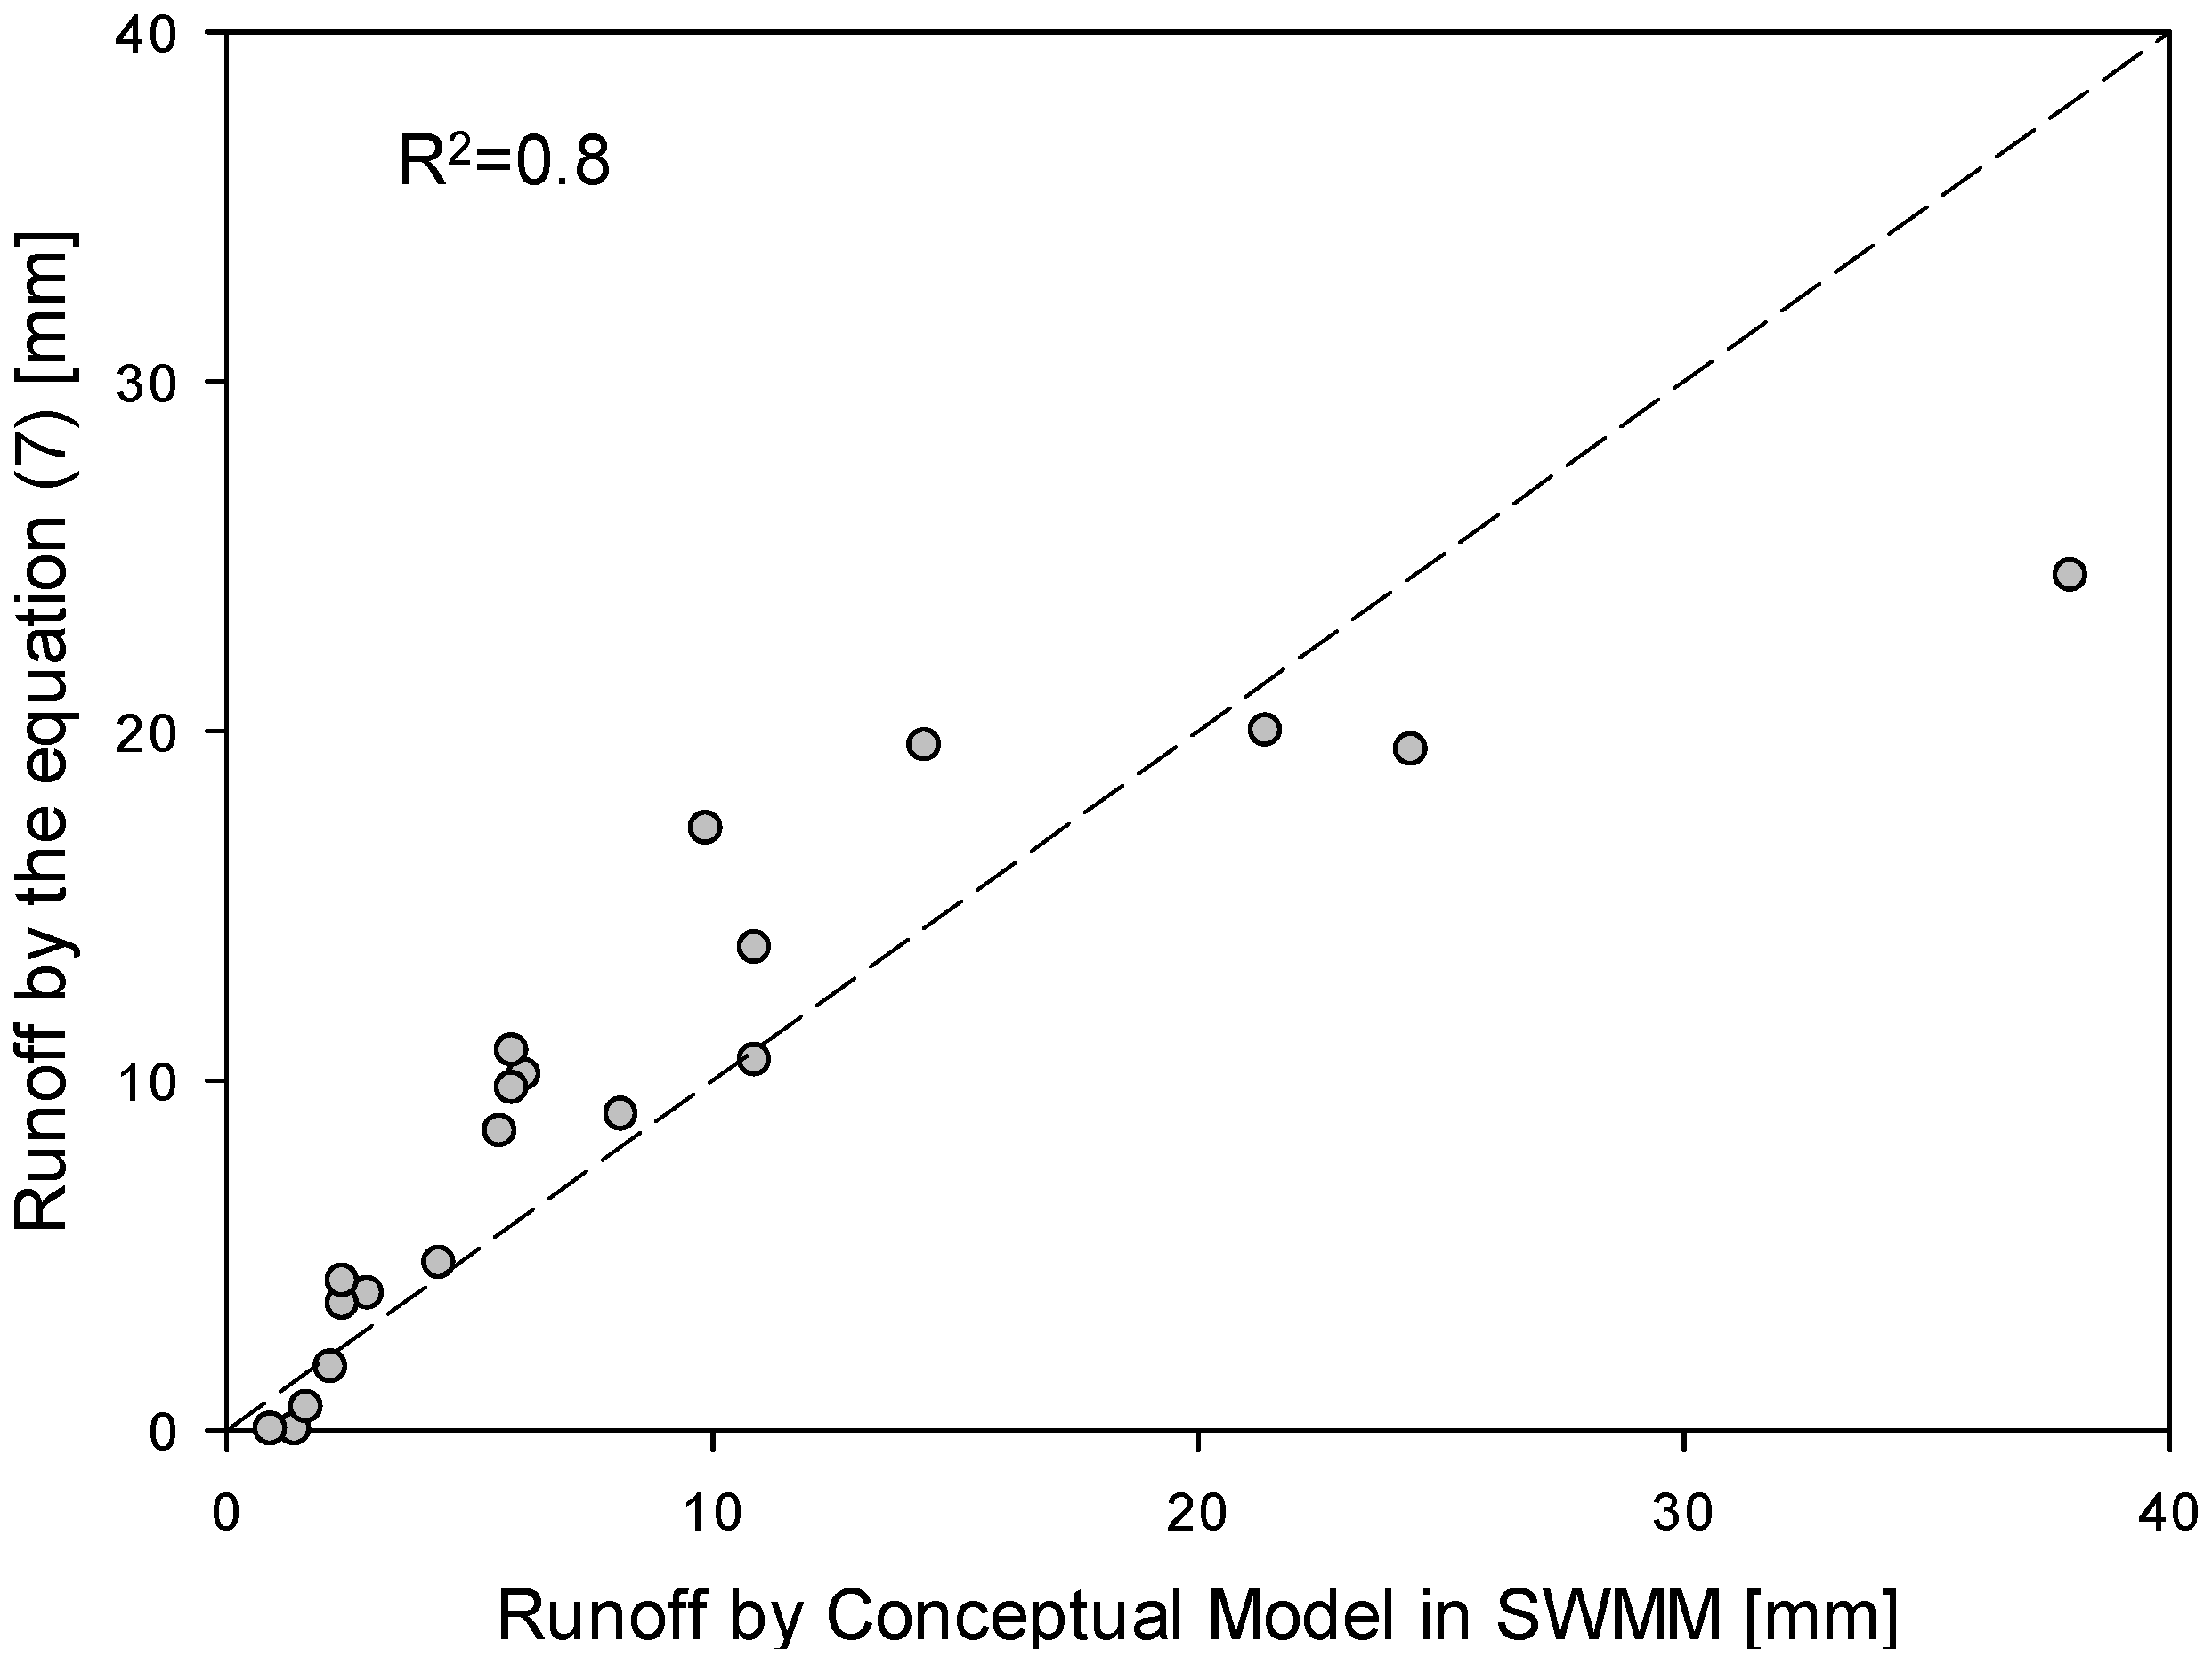
The multi-regression Equation (7) (IT > 5 days), reported in
Table 4, is validated with the daily rainfall data from Thessaloniki, Greece. In the validation process, the SWMM model is used as a reference to verify the soundness of the data obtained from the statistical relationship. The runoff depth evaluated with the Equation (7)
vs. the runoff depth obtained from the SWMM model are reported in
Figure 4. The scattering of the data is closely on the bisector, shown in
Figure 4, and a R
2 equal to 0.8 was obtained in the validation process, confirming how the Equation (7) is able to predict the hydrologic behavior of green roof in a Mediterranean climate for events with antecedent dry weather period greater than five days.
Figure 4.
Runoff depth predicted by the Equation (7) vs. runoff modeled with the conceptual model in SWMM for all rainfall events from Thessaloniki (Greece).
Figure 4.
Runoff depth predicted by the Equation (7) vs. runoff modeled with the conceptual model in SWMM for all rainfall events from Thessaloniki (Greece).
So far, the subsurface runoff coefficient based on a daily scale was obtained by using daily rainfall data as model input. The results, obtained in the previous phase, are then compared with the findings from the following analysis, which refers, instead, to the subsurface runoff coefficient evaluated on an event-time scale by using one-minute data.
Considering only the events with the rainfall depth higher than 2 mm and a minimum inter-event period of 40 min, 97 rainfall events (
Table 5) were identified during the entire period.
Using the conceptual model developed in SWMM, for each rain event, the runoff depth from the green roof was modeled as well as the subsurface runoff coefficient and the retention.
Table 5.
Rainfall events characteristics by using one-minute data from Cosenza.
Table 5.
Rainfall events characteristics by using one-minute data from Cosenza.
| Event Data | D (h) | PD (mm) | i (mm/h) | ADWP (h) | Event Data | D (h) | PD (mm) | i (mm/h) | ADWP (h) |
|---|
| 07/07/2013 | 0.32 | 8.8 | 27.79 | - | 02/01/2014 | 9.9 | 15.4 | 1.56 | 3.85 |
| 08/10/2013 | 2.03 | 6.6 | 3.25 | 801 | 02/02/2014 | 2.23 | 3.8 | 1.7 | 24.32 |
| 09/09/2013 | 0.17 | 6 | 36 | 750.18 | 02/03/2014 | 6.07 | 12.6 | 2.08 | 3.33 |
| 09/12/2013 | 1.9 | 11.8 | 6.21 | 67.97 | 02/03/2014 | 2.35 | 2.6 | 1.11 | 0.82 |
| 09/13/2013 | 0.48 | 3.4 | 7.03 | 15.07 | 02/03/2014 | 6.03 | 8.4 | 1.39 | 1.77 |
| 09/16/2013 | 3.77 | 31.8 | 8.44 | 68.28 | 02/06/2014 | 2.42 | 3.8 | 1.57 | 59.75 |
| 09/16/2013 | 0.55 | 10 | 18.18 | 0.98 | 02/11/2014–02/12/2014 | 1.68 | 2.23 | 1.32 | 144.22 |
| 09/16/2013 | 0.45 | 2.4 | 5.33 | 3.43 | 02/12/2014–02/13/2014 | 1.88 | 4 | 2.12 | 11.18 |
| 09/30/2013 | 0.88 | 7.2 | 8.15 | 336.05 | 02/21/2014 | 1.07 | 2.6 | 2.44 | 200.82 |
| 10/01/2013 | 0.62 | 3.4 | 5.51 | 16.05 | 03/01/2014 | 2.47 | 2.2 | 0.89 | 196.1 |
| 10/16/2013 | 3.15 | 13.6 | 4.32 | 366.02 | 03/02/2014 | 5.3 | 5 | 0.94 | 7.25 |
| 10/16/2013 | 1.58 | 2.4 | 1.52 | 3.93 | 03/04/2014 | 5.27 | 10.6 | 2.01 | 45.95 |
| 11/05/2013 | 1.17 | 4.2 | 3.6 | 467.13 | 03/04/2014 | 2.95 | 7.8 | 2.64 | 6.35 |
| 11/05/2013 | 3.08 | 2.4 | 0.78 | 4.68 | 03/06/2014 | 3.38 | 11.8 | 3.49 | 48.93 |
| 11/05/2013 | 2.75 | 2.6 | 0.95 | 4.58 | 03/08/2014 | 1.33 | 2.2 | 1.65 | 39.12 |
| 11/11/2013 | 8.7 | 58 | 6.67 | 129.35 | 03/15/2014 | 1.27 | 2.8 | 2.21 | 157.42 |
| 11/11/2013 | 3.2 | 3.4 | 1.06 | 4.22 | 03/15/2014 | 1.83 | 2.2 | 1.2 | 1.25 |
| 11/11/2013 | 1.88 | 2.8 | 1.49 | 1.3 | 03/24/2014 | 7.88 | 21.6 | 2.74 | 210.18 |
| 11/13/2013 | 0.85 | 2.4 | 2.82 | 33.05 | 03/24/2014 | 1.6 | 8.4 | 5.25 | 3.02 |
| 11/15/2013 | 7.07 | 14.8 | 2.09 | 60.23 | 03/24/2014 | 1.17 | 3.4 | 2.91 | 1.52 |
| 11/22/2013–11/23/2013 | 3.65 | 15.8 | 4.33 | 167.57 | 03/24/2014 | 0.57 | 2.2 | 3.88 | 2.28 |
| 11/23/2013 | 2.78 | 11.2 | 4.02 | 1.05 | 03/27/2014 | 5.02 | 11.2 | 2.23 | 53.42 |
| 11/23/2013 | 2.4 | 9.6 | 4 | 1.1 | 03/28/2014 | 3.47 | 10.2 | 2.94 | 18.73 |
| 11/23/2013 | 3.27 | 4.6 | 1.41 | 2.23 | 03/28/2014 | 2.93 | 5.6 | 1.91 | 1.02 |
| 11/23/2013 | 1.52 | 5.6 | 3.69 | 4.27 | 04/04/2014 | 1.62 | 2.6 | 1.61 | 172.85 |
| 11/24/2013 | 2.9 | 15.4 | 5.31 | 11.25 | 04/05/2014 | 3.93 | 6.4 | 1.63 | 17.18 |
| 11/24/2013 | 0.82 | 36.2 | 44.33 | 2 | 04/05/2014 | 2.27 | 3.6 | 1.59 | 7.13 |
| 11/25/2013–11/26/2013 | 1.35 | 7.4 | 5.48 | 32.05 | 04/06/2014 | 4.78 | 8.2 | 1.71 | 3.53 |
| 11/26/2013 | 1.27 | 4 | 3.16 | 7.38 | 04/16/2014 | 3.23 | 22.2 | 6.87 | 232 |
| 11/30/2013–12/1/2013 | 21.27 | 38.4 | 1.81 | 98.17 | 04/16/2014 | 0.93 | 5.4 | 5.79 | 10.45 |
| 12/01/2013 | 3.3 | 7.2 | 2.18 | 1.52 | 04/23/2014 | 0.9 | 3.4 | 3.78 | 167.25 |
| 12/03/2013 | 3.37 | 9 | 2.67 | 38.85 | 04/28/2014 | 0.85 | 2.4 | 2.82 | 110.78 |
| 12/03/2013 | 4.47 | 6.6 | 1.48 | 0.72 | 04/28/2014 | 1.37 | 2.4 | 1.76 | 0.85 |
| 12/15/2013 | 2.03 | 3.2 | 1.57 | 292.72 | 04/28/2014 | 4.55 | 3.2 | 0.7 | 0.75 |
| 12/26/2013 | 3.57 | 8 | 2.24 | 257.35 | 04/29/2014 | 1.47 | 4.6 | 3.14 | 18.22 |
| 12/26/2013–12/27/2013 | 5.05 | 17 | 3.37 | 3.78 | 04/29/2014 | 1.25 | 2.2 | 1.76 | 6.65 |
| 12/31/2013 | 2.08 | 2.8 | 1.34 | 105.35 | 05/03/2014 | 3.32 | 11.2 | 3.38 | 85.67 |
| 01/13/2014 | 1.15 | 3.8 | 3.3 | 309.82 | 05/03/2014 | 0.8 | 3.6 | 4.5 | 7.38 |
| 01/13/2014 | 0.32 | 2.8 | 8.84 | 0.77 | 05/16/2014 | 0.97 | 2.6 | 2.69 | 297.07 |
| 01/14/2014 | 0.47 | 6 | 12.86 | 21.42 | 05/16/2014 | 3.22 | 4.2 | 1.31 | 16.42 |
| 01/19/2014 | 5.52 | 7.8 | 1.41 | 116.23 | 05/29/2014–05/30/2014 | 3.43 | 7.8 | 2.27 | 308.97 |
| 01/20/2014 | 1.33 | 2.4 | 1.8 | 29.2 | 06/01/2014 | 3.5 | 14.6 | 4.17 | 49.78 |
| 01/20/2014 | 0.75 | 3.8 | 5.07 | 1.67 | 06/12/2014 | 0.68 | 3.6 | 5.27 | 275.97 |
| 01/20/2014 | 1.13 | 5.4 | 4.76 | 1.18 | 06/19/2014 | 1.22 | 4.2 | 3.45 | 154.55 |
| 01/21/2014 | 0.45 | 3.6 | 8 | 0.73 | 06/19/2014 | 0.82 | 4.8 | 5.88 | 12.33 |
| 01/21/2014 | 3.77 | 8.4 | 2.23 | 0.83 | | | | | |
| 01/21/2014 | 2.7 | 7.4 | 2.74 | 6.13 | |
| 01/21/2014 | 2.15 | 2.2 | 1.02 | 1.05 | |
| 01/21/2014 | 2.6 | 5.6 | 2.15 | 2.85 | |
| 01/22/2014 | 4.12 | 4.6 | 1.12 | 1.37 | |
| 01/28/2014 | 0.18 | 2.2 | 12 | 152.93 | |
| 01/31/2014–02/01/2014 | 6.08 | 14.8 | 2.43 | 81.98 | |
In
Table 6, the seasonal distribution of rainfall events and the results obtained from the conceptual model in terms of total runoff depth, retention, and subsurface runoff coefficient are shown. This analysis is carried out to highlight the seasonal variability of the hydraulic response of the green roof of interest. In particular, it is possible to observe that the retention coefficient ranges from 15% in Summer, when the total rainfall depth is equal to 80 mm, to 30% in Winter, with a total rainfall depth of 208.63 mm. These results show that the retention capacity of a green roof is lower in Summer than it is in Winter, unlike expected. This behavior can be explained considering the fact that the rainfall events during Summer are intense and very short in the Mediterranean climate conditions. Hence, despite the high temperatures, which should favor the storage of water, in the case of heavy rainfall with short duration, the green roof quickly reaches its field capacity, thus draining a large amount of the rainfall volumes.
Table 6.
Seasonal distribution of rainfall events from Cosenza and the model results (RD, runoff depth; SRC, subsurface runoff coefficient; VR, retention).
Table 6.
Seasonal distribution of rainfall events from Cosenza and the model results (RD, runoff depth; SRC, subsurface runoff coefficient; VR, retention).
| Season | Number of Events | PD (mm) | RD (mm) | SRC (%) | VR (%) |
|---|
| Summer (06/21/2013–09/20/2013) | 9 | 80.80 | 74.58 | 84.92 | 15.08 |
| Autumn (09/21/2013–12/20/2013) | 27 | 291.40 | 261.12 | 86.02 | 13.98 |
| Winter (12/21/2013–03/20/2014) | 35 | 208.63 | 170.22 | 71.78 | 28.22 |
| Spring (03/21/2014–06/20/2014) | 27 | 185.80 | 159.22 | 81.02 | 18.98 |
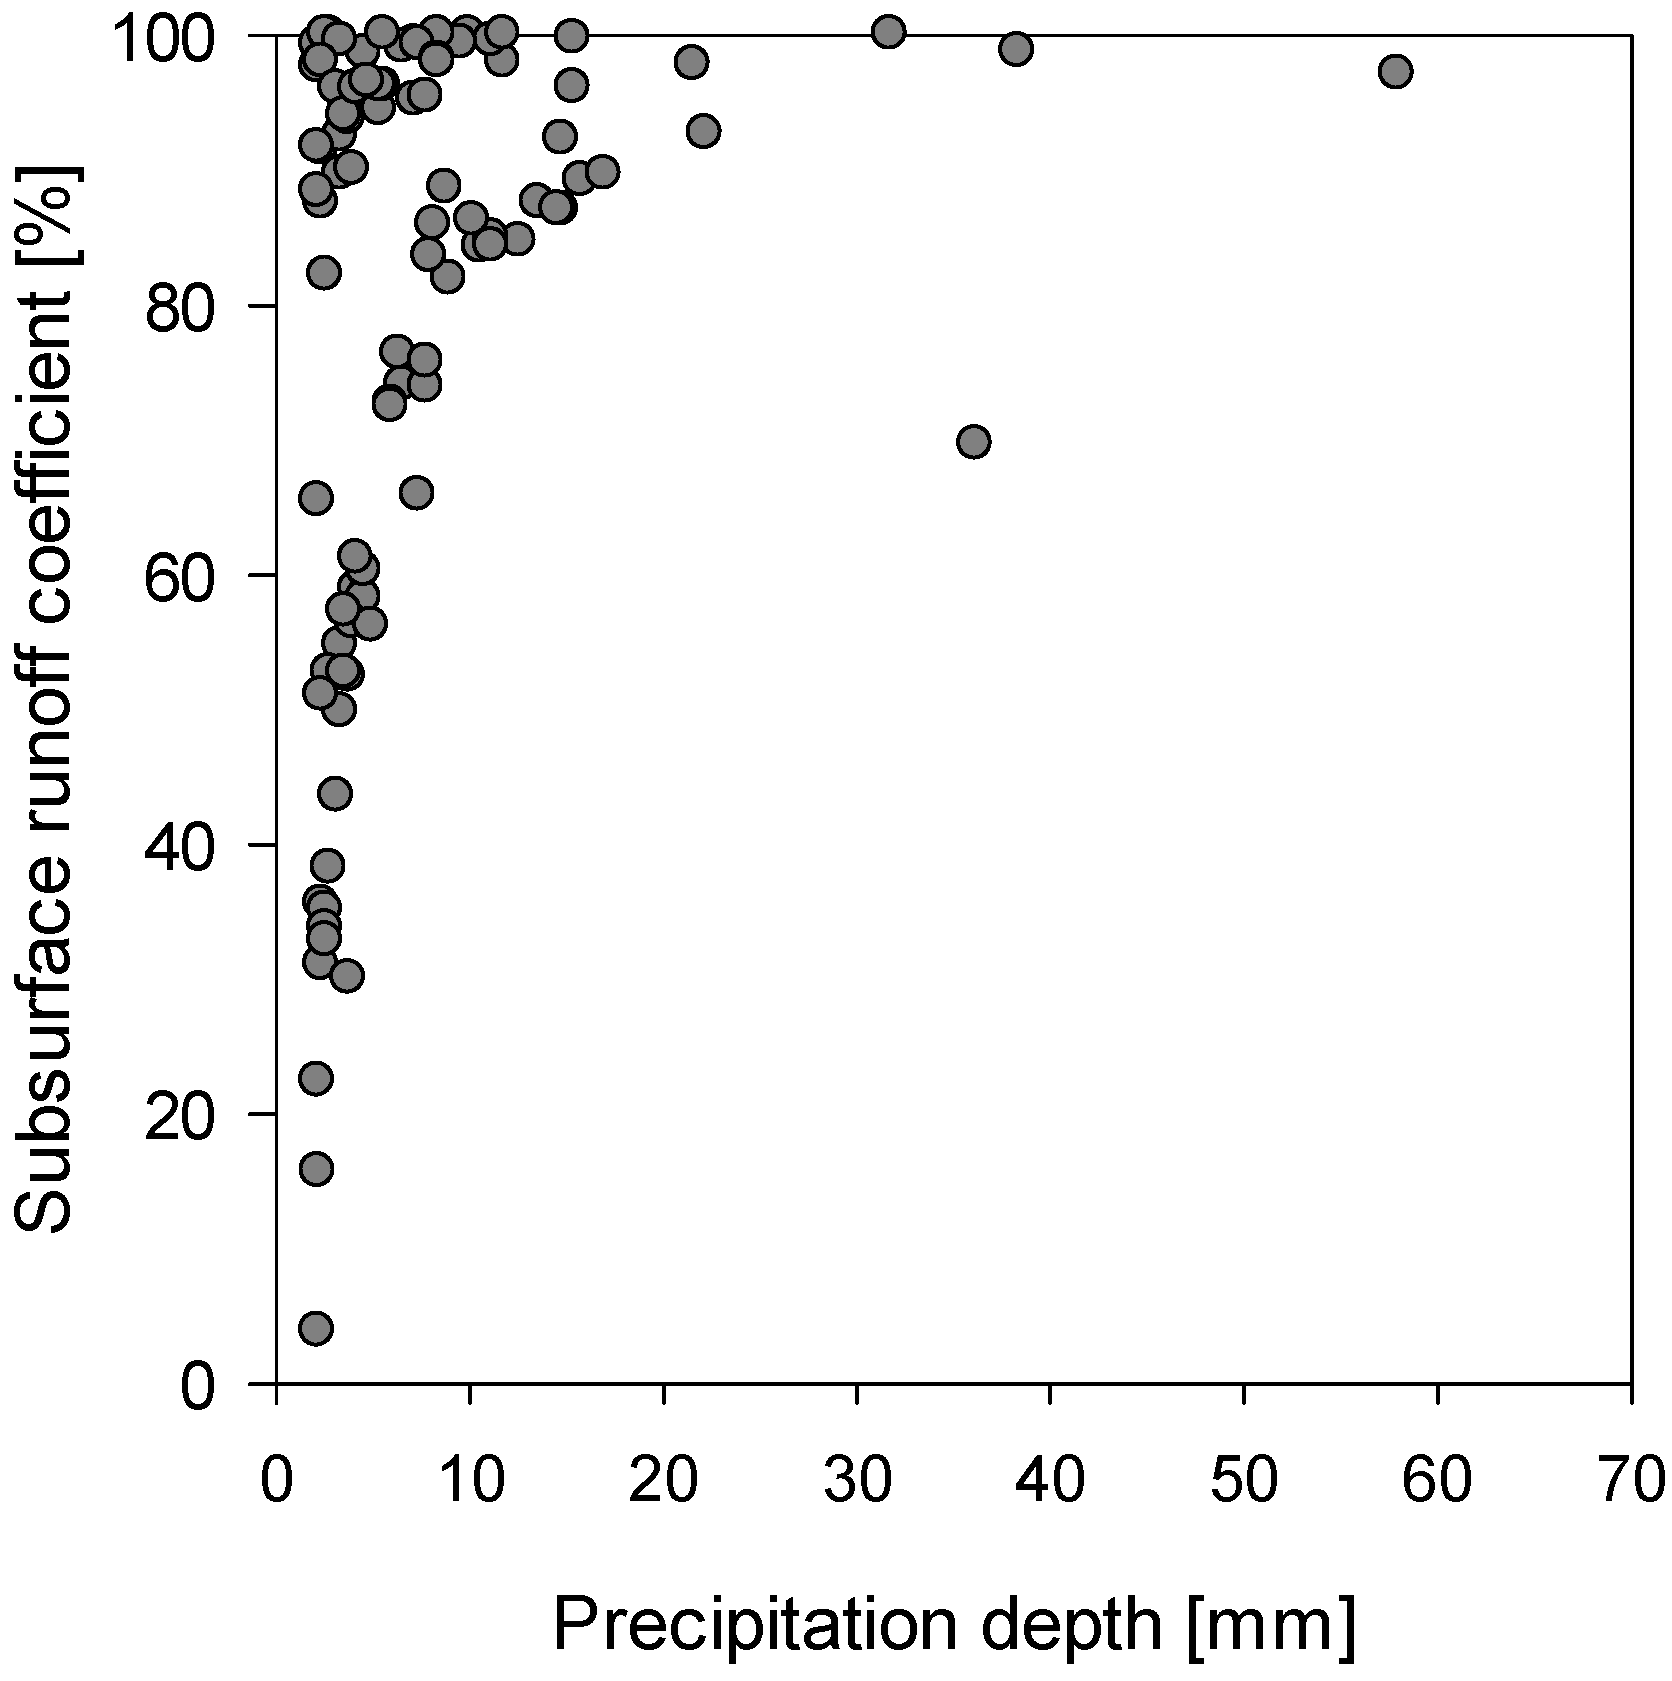
The results obtained for the entire year with 1-min time step, precipitation, and runoff exhibits the same proportionality, previously observed for daily data. From
Figure 5, it is possible to notice how the subsurface runoff coefficient is close to 100% for events with high rainfall depths, while for rainfall depth <10 mm there is a significant variation depending on the antecedent dry weather period. For example, as shown in
Table 5, for the two events of 01/21/2014 and 03/01/2014 with the same rainfall depth of 2.20 mm there are two different subsurface runoff: 99.24% and 35.08%; this can be explained by considering the antecedent dry weather period for the two events, 1.05 h and 196.10 h, respectively. A longer antecedent dry weather period between two rainfall events allows the substrate to completely dry out, so as to increase its retention capacity for the consequent storm.
Figure 5.
Modeled subsurface runoff coefficient, on an event-time scale, as a function of precipitation depth, by using one-minute rainfall data from Cosenza.
Figure 5.
Modeled subsurface runoff coefficient, on an event-time scale, as a function of precipitation depth, by using one-minute rainfall data from Cosenza.
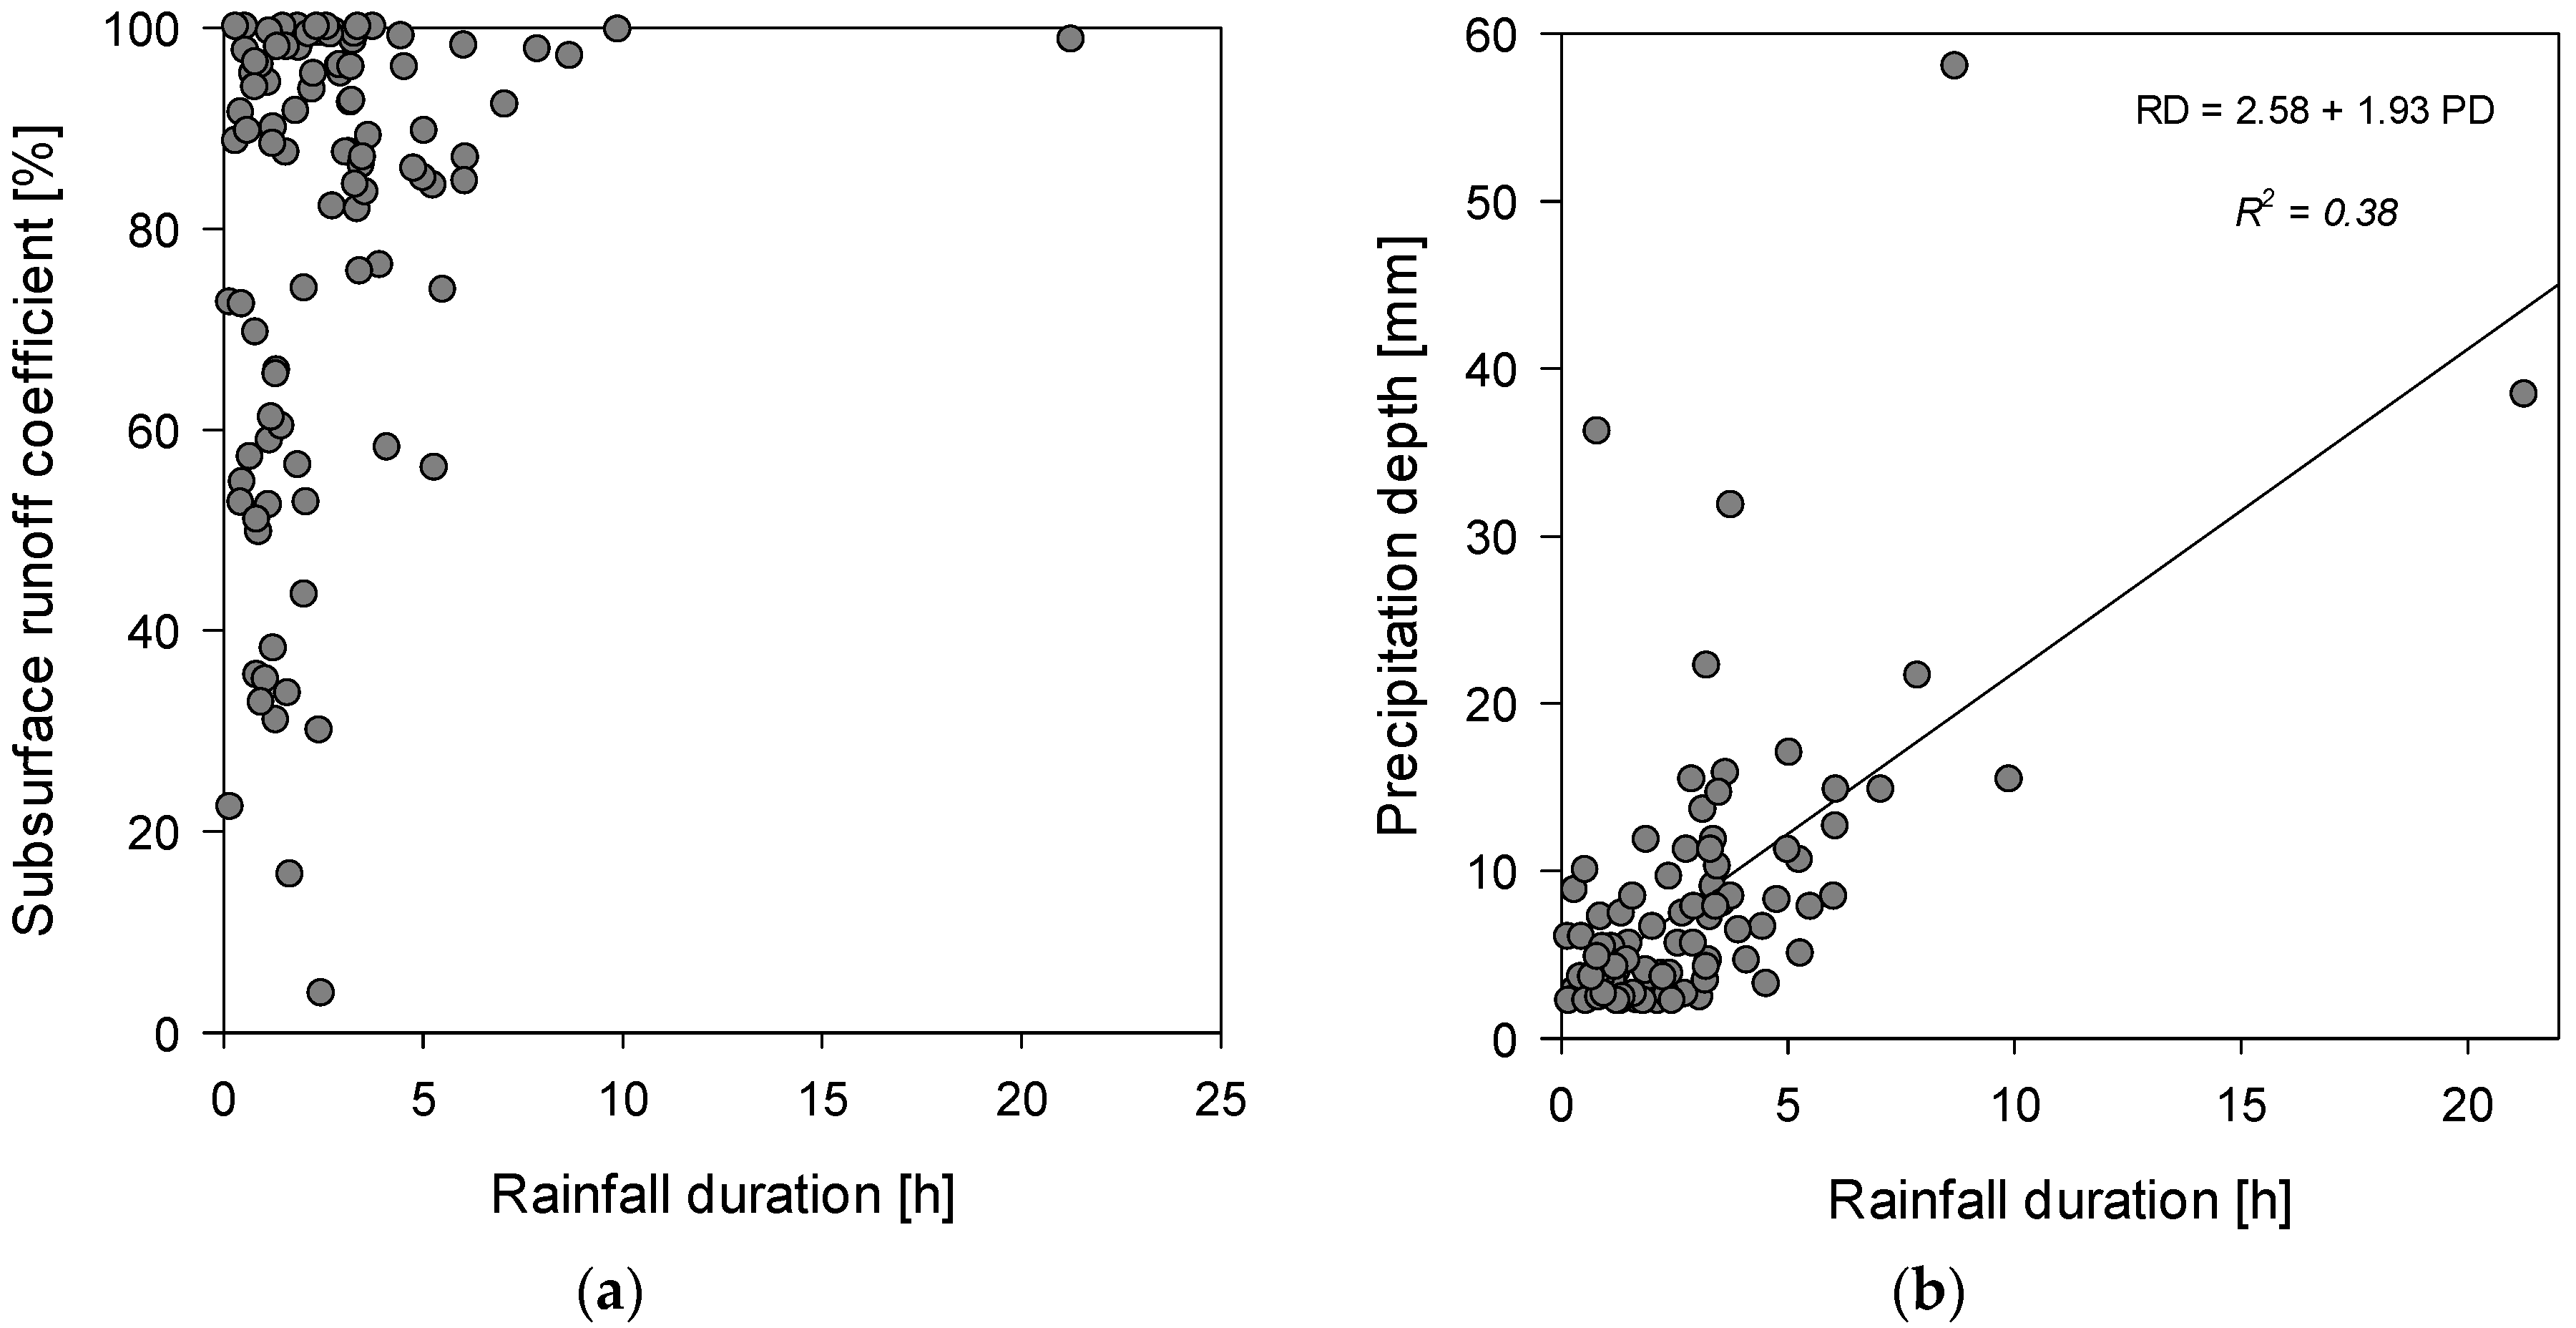
Additionally, in this part of the study the influence of the rainfall duration on the subsurface runoff coefficient was also investigated (
Figure 6a). It is observed that for rainfall events with duration less than 5 h, the subsurface runoff coefficient is significantly variable, while for rainfall duration greater than 5 h, the runoff coefficient is consistently above 80%. The phenomenon that a longer precipitation generates a higher subsurface runoff coefficient is justified by the fact that under those circumstances the substrate, once it reaches the field capacity, will not retain the rainfall volume and will completely dry out. However, for high rainfall events with lower duration, the substrate behavior is mainly influenced by the initial moisture condition, suggesting that the antecedent dry weather period is an important influencing factor. Despite the fact that the duration may be considered a secondary variable, strongly related to rainfall volume, the two parameters are not statistically dependent, as shown in
Figure 6b.
Figure 6.
(a) Subsurface runoff coefficient as a function of rainfall duration for event-time data from Cosenza; and (b) the correlation between precipitation depth and rainfall duration.
Figure 6.
(a) Subsurface runoff coefficient as a function of rainfall duration for event-time data from Cosenza; and (b) the correlation between precipitation depth and rainfall duration.
Furthermore, to statistically determine the significance of the hydrologic parameters on the event runoff coefficient, the multiple linear regression analysis is applied. Since six rainfall events were considered for the validation process and the first event was not take into account, because the information about its antecedent dry weather period is missing, only 90 rainfall events of the 97, were used.
Based on the observations previously made about the influence of antecedent dry weather periods, a relationship between runoff depth (
RD), rainfall or precipitation depth (
PD), antecedent dry weather period (ADWP), duration (
D), and intensity (
i) of rainfall, was obtained. The results of the multiple linear regression analysis are summarized in
Table 7, where the t-statistics (significant at
p = 0.05) are presented in the same order as the parameters in the equation.
Table 7.
Multiple linear regression analysis, by using one-minute data from Cosenza.
Table 7.
Multiple linear regression analysis, by using one-minute data from Cosenza.
| Regression Equation | R2 | t-Statistic |
|---|
| RD = −0.89 + PD | (8) | 0.99 | 91.30 |
| RD = −8.70 + 7.84 lnPD + 0.68 D | (9) | 0.76 | 10.28, 3.89 |
| RD = −0.24 + 1.01 PD – 0.27 lnADWP | (10) | 0.99 | 120.62, −8.30 |
| lnRD = −0.56 + 1.32 lnD − 0.13 lnIT + 1.40 lnADWP | (11) | 0.88 | 23.13, −6.74, 20.10 |
Equation (8) correlates the runoff depth with the rainfall depth and exhibits a
R2 equal to 0.99. Equation (9) was defined by adding an additional parameter, the rainfall duration. Although Equation (9) exhibits a
R2 equal to 0.76, the
t-statistic of the duration is characterized by a low significance level. In the regression Equations (10) and (11) in
Table 7 the antecedent dry weather period is considered, as well. In particular, in Equation (10), the runoff is obtained by considering precipitation depth and antecedent dry weather period, with
R2 equal to 0.99 and all the parameters present a significant t-statistic. The Equation (11) correlates the runoff with rainfall event duration and intensity and the antecedent dry weather period with a
R2 equal to 0.88. From this analysis, Equation (10) seems to be the most significant one, since it provides a high
R2 value and a good statistic level for the antecedent dry weather period.
The multi-regression relationships, reported in
Table 7, are validated by using a set of 1-min rainfall data from Cosenza, Italy. Six representative rainfall events, reported in
Table 8, with varying total depth were selected from 97 rainfall events. The results from the statistical relationships are then compared with the runoff depth obtained from the SWMM model, loaded with the one-minute rainfall data as well. In the validation process, the SWMM model is used as a reference to verify the soundness of the data obtained from the statistical relationship.
Table 8.
Selected rainfall events for validation process of Equations (8)–(11).
Table 8.
Selected rainfall events for validation process of Equations (8)–(11).
| No. | Events | PD (mm) | RD (mm) | i (mm/h) | d (h) | ADWP (h) |
|---|
| 1 | 09/13/2013 | 3.40 | 1.86 | 7.03 | 0.48 | 15.07 |
| 2 | 11/13/2013 | 2.40 | 0.85 | 2.82 | 0.85 | 33.05 |
| 3 | 11/24/2013 | 36.20 | 25.20 | 44.33 | 0.82 | 2.00 |
| 4 | 12/27/2013 | 17.00 | 15.24 | 3.37 | 5.05 | 3.73 |
| 5 | 01/10/2014 | 7.80 | 5.76 | 1.41 | 5.52 | 116.23 |
| 6 | 04/16/2014 | 22.20 | 20.57 | 6.87 | 3.23 | 232.00 |
The results of the validation analysis, in which the runoff depth obtained with the regression equations is compared to the runoff depth modelled in SWMM, are reported in
Figure 7. In this figure, for the entire datasets, a good scattering close to the bisector is shown. In particular, for Equation (9) a value of R
2 equal to 0.90 was obtained, while a value of 0.80 for the remaining regression Equations (8), (10), and (11). By observing each rainfall events in
Figure 7, it is possible to see that Equations (8), (10), and (11) constantly overestimate the value of the runoff modeled in SWMM. More in detail, for the third rainy event (dated 24 November 2013) it is found an higher overestimation of runoff than the other events. This result can be explained by analyzing the rainfall event’s characteristics, as shown in
Table 8, as well as the dataset used for regression analysis in
Table 5. Indeed, the rainfall event No. 3 (on 24 November 2013) presents a precipitation depth of 36.20 mm and an intensity of 44.33 mm/h; instead, the regression equations were obtained from the dataset listed in
Table 5, in which only two rainy events exhibit precipitation depth greater than 35 mm and only one event shows an intensity exceeding 30 mm/h.
Figure 7.
Runoff depth predicted by the Equations (8)–(11) vs. the runoff depth with the conceptual model in SWMM for six rainfall events from Cosenza.
Figure 7.
Runoff depth predicted by the Equations (8)–(11) vs. the runoff depth with the conceptual model in SWMM for six rainfall events from Cosenza.
The statistical analysis does not only allow the identification of the most influencing parameters on the hydraulic performance, but also to produce a series of validated multi-regression relationships for the specific green roof studied. Those equations can be used to preliminarily predict the runoff depth, for a given rainfall event, when more advanced model are not available.
5. Conclusions
Green roofs may represent a solution for minimizing the impact of urbanization on the hydrologic cycle and for sustainably managing water resources in urban environments. Several studies have shown that green roofs effectively control surface runoff in urban drainage systems reducing overall stormwater volumes and peak flow rates.
From the studies found in literature, the hydraulic efficiency of a green roof strongly depends on the hydrological parameters of the rainfall events, such as precipitation depth, antecedent dry weather period, duration, and intensity of the event. Most of the studies provided an annual or a seasonal subsurface runoff coefficient, varying from 0.32 to 0.89.
In this study, firstly, the subsurface runoff coefficient at daily and event-time scales for a given green roof, through a conceptual model implemented in SWMM, was evaluated. The model was loaded with both daily and 1-minute rainfall data from two Mediterranean-climate sites, one in Thessaloniki, Greece and one in Cosenza, Italy, respectively. Then, the most influencing hydrological parameters were examined through a statistical regression analysis. The findings show that the daily subsurface runoff coefficient is on average 0.70 for both sites, while the event-based one is on average 0.79 with a standard deviation of 0.23 for the site in Cosenza, Italy. A specific inter-event time of about 40 min, was defined for the green roof studied, as opposed to use an inappropriate value of 6–12 h used in previous scientific studies.
The modeled results, obtained with daily rainfall data recorded in Cosenza, Italy and in Thessaloniki, led to the following considerations: (1) there is a direct proportionality between precipitation and runoff; (2) the retention percent drops as the rainfall depth exponentially increases and the maximum retention capacity is 80%. When the precipitation depth is greater than 10 mm, the retention capacity varies from 20% to 0%. Through a multiple linear regression analysis, a relationship that correlates the runoff with precipitation and antecedent dry weather period was obtained and, consequently, validated.
The results, obtained in the previous phase, were then compared with an event-time scale analysis by using one-minute data. From this analysis precipitation and runoff exhibit the same proportionality, previously observed for daily data.
Furthermore, to statistically determine the significance of the hydrologic parameters on the event runoff coefficient, the multiple linear regression analysis was applied. Indeed, the investigation revealed that the influencing parameters are the rainfall depth and antecedent dry weather period with a confidence level of 95%. This study demonstrated that, due to the high variability of the subsurface runoff coefficient, the use of a unique value for design purposes is inappropriate. A preliminary estimation for designing purposes could be obtained as a function of the total rainfall depth and the antecedent dry weather period by using the validated multi-regression relationship which is site-specific.
To generalize the multi regression relationships found in this work and let them suitable for different typologies of green roofs, the influence of physical parameters will be further investigated in future research studies.


 ,
, 