1. Introduction
Drought is a natural temporary imbalance of water availability, consisting of a persistent lower-than-average precipitation, of uncertain frequency, duration and severity, and of unpredictable or difficult-to-predict occurrence, resulting in diminished water resource availability and carrying capacity of ecosystems [
1]. The importance of early warning to water users for timely implementation of preparedness and mitigation measures is well known and has been widely addressed by several authors [
1,
2,
3]. Developing prediction tools appropriate for the climatic and agricultural conditions prevailing in different drought-prone areas constitutes a research challenge. Drought prediction is a major concern for water managers, farmers and other water end-users because it constrains their decisions. Since droughts have a slow initiation, it is possible to release a timely prediction so that measures and policies can be taken in order to mitigate the effects of the drought [
3,
4]. Short-term drought predictions, from one to three months, may be used to alert farmers and water managers about the initiation, continuation or end of a drought and about the need for preparedness measures before a drought is effectively installed or for a post-drought period. However, forecasting when a drought is likely initiating or to coming to an end is a difficult task.
Drought severity is usually identified through indices such as the Standardized Precipitation Index (SPI), the Palmer Drought Severity Index (PDSI) and the MedPDSI [
5,
6,
7]. However, in the Interregional Workshop on Indices and Early Warning Systems for Drought 2009, several organizations, including the World Meteorological Organization (WMO) and the United States National Oceanic and Atmospheric Administration (NOAA), recommended that the SPI be used by all national meteorological and hydrological services around the world to characterize meteorological droughts as well as agricultural and hydrological droughts because the SPI is an index that is simple to understand, is easy to calculate and is statistically relevant and meaningful [
8]. In fact, precipitation is the only required input parameter and it considers in its conception the different impacts on groundwater, reservoir storage, soil moisture, snowpack and stream-flow through the different time scales of computation [
5,
8]. The SPI is based on the probability of precipitation for any time scale. The probability of observed precipitation is then transformed into an index that supports assessing drought severity and may provide early warning of drought.
The precipitation occurrence and/or its inhibition leading to drought on different time and spatial scales is driven by atmospheric forcings which may range from the mesoscale (hundreds of km) up to the planetary scale (tens of thousands of km). The large-scale atmospheric state may roughly be described by a time-varying state vector filled with a few numbers of leading principal components of the sea-level pressure (SLP) field. That state vector either exhibits a transient behavior or persists near certain states, the so-called weather regimes (WRs) or atmospheric circulation patterns, which are detectable by cluster analysis [
9]. Therefore, the projection or pattern correlation of the SLP field onto the main WRs acts as large-scale atmospheric circulation indices, which are useful indicators of the rainfall field. In particular, several large-scale indices of the Euro-Atlantic and Northern Hemisphere SLP field [
10,
11] are well correlated with the cumulated precipitation in certain target regions, namely Portugal [
12]. We recall the main four Euro-Atlantic atmospheric WRs as: (1) the blocking regime, with a large anomalous high pressure over Scandinavia; (2) the zonal regime (positive phase of the North Atlantic Oscillation: NAO
+), characterized by an intense zonal flow crossing the North Atlantic area, reinforcing the Icelandic low and the Azores’ high pressure centers; (3) the Atlantic Ridge regime, exhibiting a positive anomaly over the North Atlantic and low pressure over northern Europe; and (4) the Greenland anticyclone pattern (negative phase of the North Atlantic Oscillation: NAO
−), showing a strong positive pressure anomaly centered over western Greenland. Since some of the WRs display nearly symmetric anomalies, the corresponding projections of the SLP field are not independent. The overall main features of the Euro-Atlantic large-scale atmospheric field are then well captured by a set of large-scale indices: the North Atlantic Oscillation (NAO) index [
13], the EAP (East-Atlantic Pattern) index, the SCAND (Scandinavian Pattern) index [
14] and the East-Atlantic Western Russia (EAWR) index, all available at the National Centers for Environmental Prediction (NCEP) website.One of the main patterns governing wet and dry rainfall regimes in most of Europe is the NAO [
14]. The NAO index is commonly given by the difference in normalized SLP anomalies between a southern node, located in continental Iberia or the Azores, and a northern node, usually in southwest Iceland [
13,
15]. Strong positive phases of the NAO (
i.e., NAO
+) tend to be associated with above-average temperatures in the eastern United States and across northern Europe and below-average temperatures in Greenland and oftentimes across southern Europe and the Middle East. The NAO
+ regime is also associated with above-average precipitation over northern Europe and Scandinavia in the winter, and below-average precipitation or drought over southern and central Europe, Mediterranean regions and the north of Africa. Opposite patterns of temperature and precipitation anomalies are typically observed during strong negative phases of the NAO available at the National Centers for Environmental Prediction (NCEP) website.
Pires and Perdigão [
16] have shown high levels of correlation between the NAO index and the SPI reaching the negative value −0.60 for the winter months for some locations in northern Portugal, which convert the NAO in an interesting tool for the improvement of drought predictions. The NAO influences on the precipitation regimes and droughts in Portugal and the Iberian Peninsula are also reported by other researchers [
17,
18]. Santos
et al. [
12] have shown that dry weather conditions prevail when the NAO index is positive (NAO
+). The drought frequency in Portugal has been increasing as a consequence of a drying signal in the Mediterranean region attributable to a trend in the atmospheric circulation forcing, namely a decadal scale enhancement of the positive phase of the North Atlantic Oscillation [
19].
Several statistical and physical-based techniques as well as the combination of both (hybrid techniques) have been proposed for the forecasting of droughts and the cumulated precipitation on a monthly basis. The state-of-the-art physical models used for weather and climate prediction such as that of the European Center for Medium Range Weather Forecasts (ECMWF) have been used for obtaining probabilistic ensemble-based forecasts up to six months in advance of the SPI worldwide on scales of three, six and 12 months [
20]. Since the computational burden of those predictions is very high and they depend on the availability of a physical model, a reasonable alternative for the meteorological community started by developing simple statistical models of the monthly and seasonal cumulated precipitation [
21,
22]. Those models often apply multivariate statistical techniques such as the Canonical Correlation Analysis (CCA), robust multilinear regression, and Singular Spectrum Analysis (SSA), among others [
23], and they rely on a set of previously well-chosen physical predictors that are able to capture the main boundary layer’s forcing of the atmospheric dynamics (e.g., the sea surface temperature (SST), the snow cover and land moisture fields) and the intrinsic predictable features such as the internal (not externally forced) oscillations of the climatic system. In regard to hybrid predictions, we must refer to several techniques. On one hand, we have the mixing by Bayesian probabilistic averaging, either of different physical-based predictions [
24] or of physical and statistical models [
25]. On the other hand, we may use the optimal regression of physical precursors and dynamical forecasts of drought indices [
26].
Hereby we will focus on statistical methods of drought prediction only. Combining the stochastic properties of the SPI with weather pattern indices such as NAO is a challenge for the short-term prediction of droughts by statistical methods. The stochastic properties of the SPI time series have been explored for analyzing and predicting drought class transitions in the Portuguese context [
27,
28,
29,
30,
31,
32].
The methodologies include regression analysis [
33], time series modeling such as ARIMA and seasonal ARIMA [
34,
35], artificial neural network models (ANN) [
36,
37] and stochastic and probability models such as Markov chains [
38,
39,
40], log-linear models [
31,
41] and others [
42,
43]. Also, hybrid models combining two techniques have been used, for instance wavelet transforms and neural networks [
44], stochastic and neural network modeling [
45], wavelet and fuzzy logic models [
46], adaptive neuro-fuzzy inference [
47] and data mining and ANFIS techniques [
48]. Each methodology, independently of its complexity, has advantages and limitations. Mishra and Singh [
49] recently reviewed and discussed the methodologies used so far for drought modeling.
Approaches to drought forecasting using drought indices associated with atmospheric-oceanic anomaly indices have been suggested for predictions on monthly and seasonal scales. Examples include the use of artificial neural networks and time series of drought indices additionally driving the NAO index [
37], and the use of probabilistic models that result from evaluating conditional probabilities of future SPI classes with respect to current SPI and NAO classes [
43].
Three-dimensional (3D) log-linear models allow modeling the state of a variable at time
t + 1 knowing its state at time
t and
t − 1 [
50]. Those models were used to predict SPI drought class transitions one and two months ahead, knowing the drought class of the last two months [
31]. In this approach, log-linear models are fitted to 3D contingency tables of drought class transitions counts, corresponding to two time-step transitions relative to the SPI drought classes at months
t − 1,
t and
t + 1 obtained from categorical time series of SPI drought classes. Then, ratios of expected frequencies (
odds) relative to the most probable transition for the next month and their confidence intervals are computed. This approach allows predictions with a leading time of two or more months and has shown potential to be improved, namely with the inclusion of new categories in the contingency tables. Recently, the introduction of a new variable representing the wet or the dry season of the year was tested in order to improve the predictions [
41].
Considering the advances in drought predictions reviewed above and the reported NAO influence on precipitation and drought in Portugal, the objectives of this work consist of improving log-linear modeling of the SPI drought class transitions when driven by the negative or positive phases of the NAO index. This approach is an advance relative to the previous study [
31] since it was based uniquely on the assessment of SPI drought classes. In the current study, long series of monthly precipitation of more than 100 years were used, which brings advantages in model-fitting and allows better estimates for the transition probabilities.
3. Results and Discussion
Both contingency tables for NAO
− and NAO
+, either relative to the SPI6 (
Table 2) or the SPI12 (
Table 3), present higher frequency values for the transitions that imply the maintenance of the precedent drought classes and smaller frequencies for the transitions that imply the increase/decrease of the drought classes, particularly when changing by two or three values. As for previous studies [
31,
41], this maintenance trend results from the fact that droughts (of six- and 12-month temporal scales) install slowly, tend to remain for a relatively long time, and have a slow dissipation. These maintenance characteristics are less evident when using the SPI6 since it responds quickly to increases or decreases in the precipitation because the computation cumulative period is shorter than for SPI12. Data in
Table 2 and
Table 3 show that NAO
− favors the transitions from drought class 1 to itself,
i.e., maintaining a non-drought condition, while the NAO
+ favors transitions from drought class 3 and 4 to themselves, although not significantly,
i.e., the maintenance of moderate and severe drought classes, particularly when considering the SPI6.
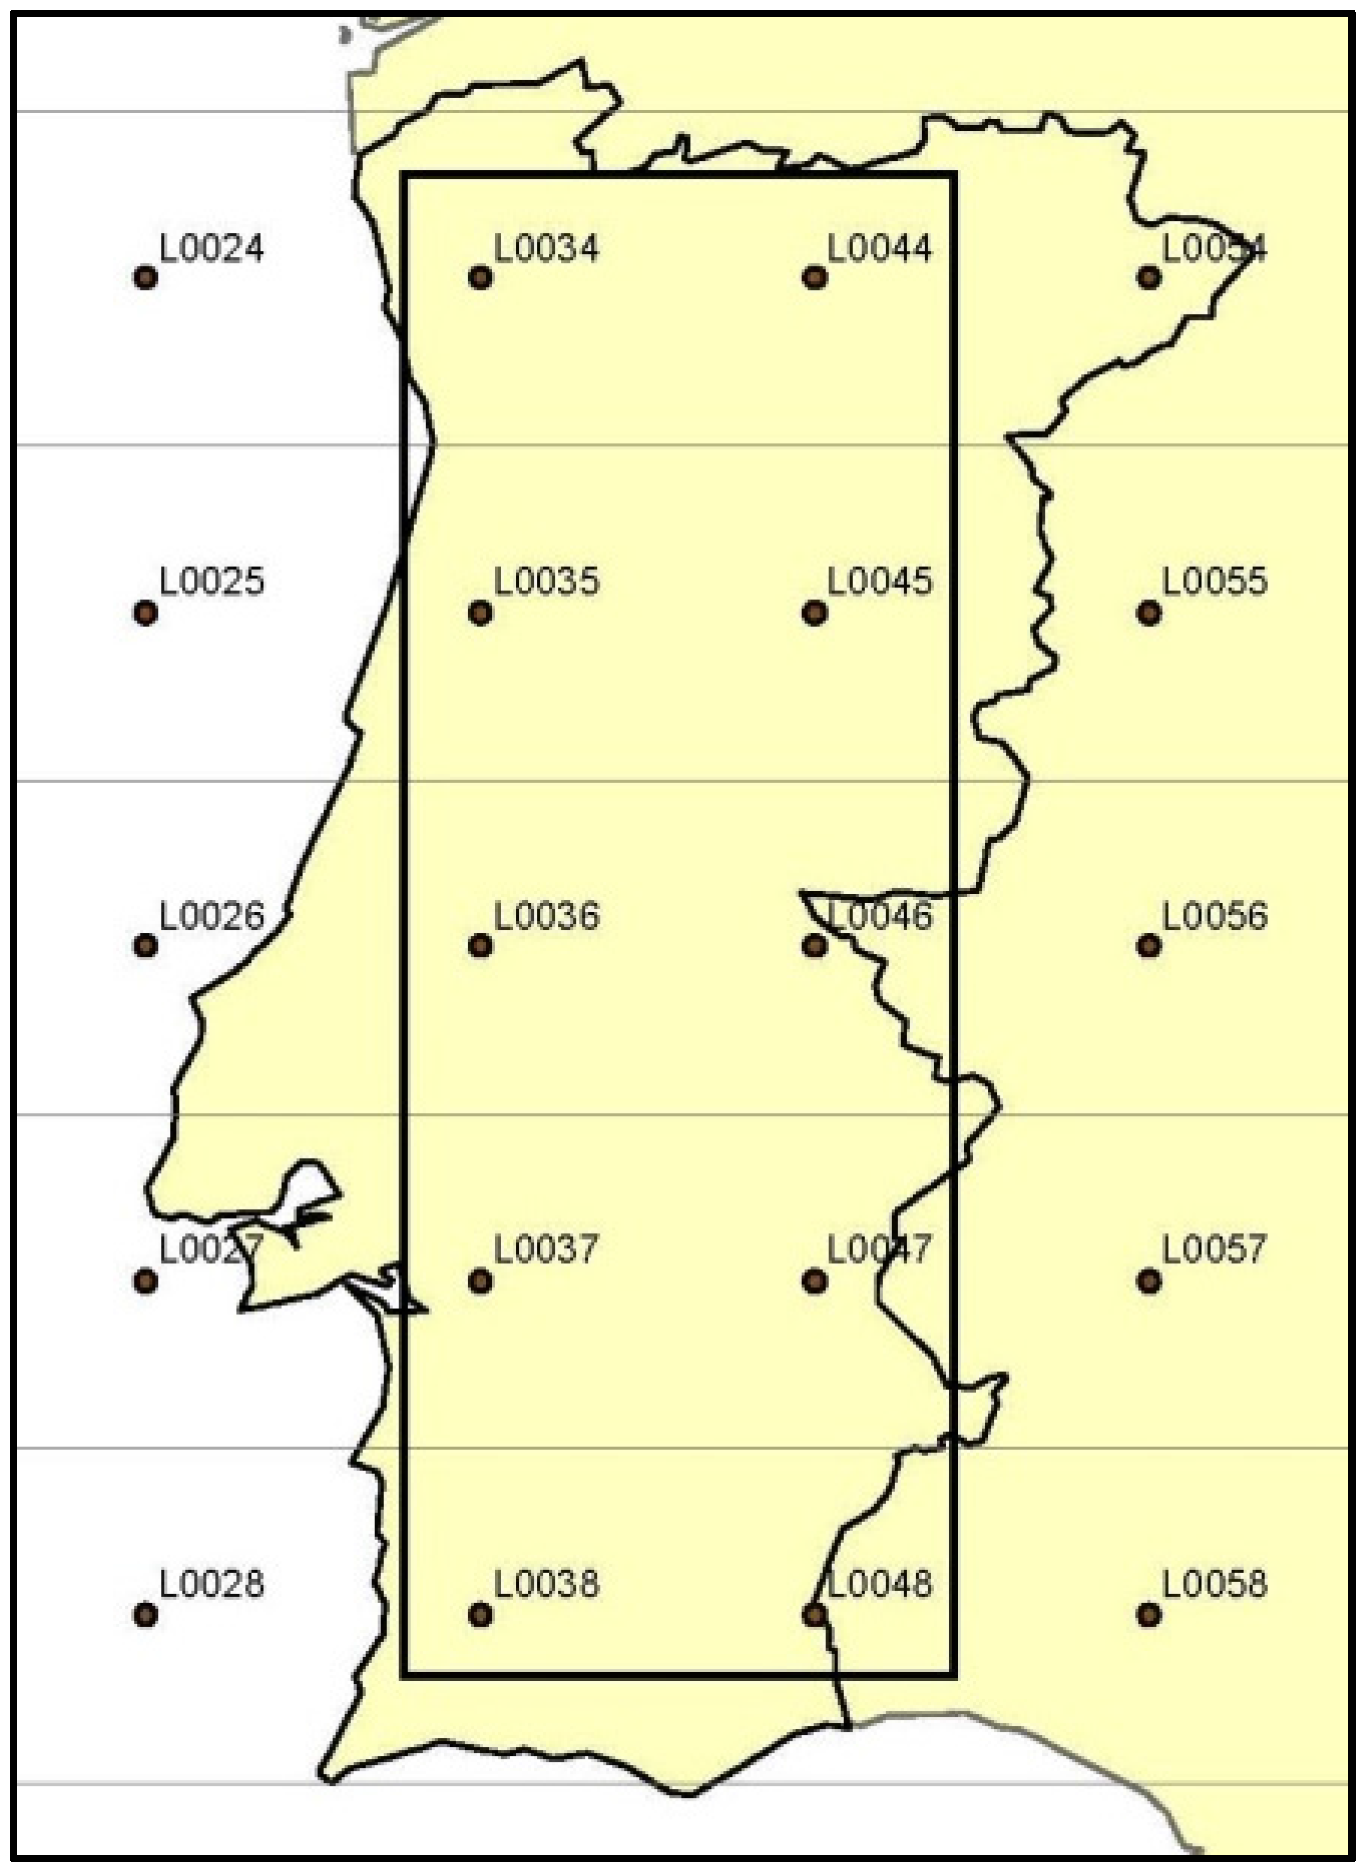
Table 5 and
Table 6 present results for four out of the 10 locations using, respectively, SPI6 and SPI12 data (L0035, L0038, L0045 and L0048). These tables allow us to compare the drought classes “OBS” when calculated from observed data and predicted with the log-linear modeling driven and not driven by NAO, respectively referred to as “predicted w/NAO” and “predicted”. The period selected for the comparison, October 2011 to February 2013, refers to a drought event, therefore including its initiation, development and dissipation. For each site, the observed SPI6 (SPI12) drought class at months
t − 1 and
t are presented, as well as the classes at month
t + 1 “observed” and “predicted w/NAO” and “Predicted”. In addition, the NAO index values at month
t − 4 (
t − 10) are also presented. When two or three drought classes are equally probable, then the predicted drought class is identified as “1 or 2” or “2 or 3 or 4”, for instance, which means that probabilities for the transitions into classes 1 or 2 or into classes 2 or 3 or 4 are similar. The cells in
Table 5 and
Table 6 are highlighted in grey when the predictions do not match the observations.
Results in
Table 5 and
Table 6 show that the model performs very well in predicting the maintenance of the drought class, but generally does not perform well when a decrease or increase of the drought class category occurs which breaks with the drought class established in the preceding two months. Because of the negative correlation between the NAO index and precipitation in Iberia [
12,
16,
17], the wet and less dry classes,
i.e., classes 1 and 2 (see
Table 1), tend to occur when the NAO index is negative. However, with the log-linear model driven by NAO, some cases of class change could be predicted better, namely those in the negative NAO regime (NAO
−) (e.g., 13 February and 12 August for SPI6 in L0035), leading to wet conditions in western Iberia. That is because the sensitivity of precipitation to the NAO index is generally stronger in the wetter regimes, in accordance with the asymmetric correlations between NAO and SPI presented by Pires and Perdigão [
16].
From comparing predictions relative to SPI6 (
Table 5) with those of SP12 (
Table 6), it could be observed that the number of disagreements is large for SPI6. This behavior is likely due to the larger number of class changes in the case of SPI6, since this index denotes a shorter time span of the cumulated precipitation than SPI12 and therefore produces a quicker response to the variability of precipitation which results in more frequent changes of drought classes. Results for the other locations and for other drought events simulated have shown behaviors similar to those referred above.
Table 5.
SPI6: comparison between observed (OBS) and predicted drought class transitions (“Predicted w/NAO” and “Predicted” for four locations during the period October 2011 to February 2013).
Table 5.
SPI6: comparison between observed (OBS) and predicted drought class transitions (“Predicted w/NAO” and “Predicted” for four locations during the period October 2011 to February 2013).
| L0035 | NAO | Drought Class at | Drought Class at Month t + 1 | L0038 | Drought Class at | Drought Class at Month t + 1 |
| Date | Month t − 4 | Month t − 1 | Month t | OBS | Predicted w/NAO | Predicted | date | Month t − 1 | Month t | OBS | Predicted w/NAO | Predicted |
| October-2011 | −1.58 | 3 | 3 | 2 | 2 or 3 or 4 | 2 or 3 or 4 | October-2011 | 1 | 1 | 1 | 1 | 1 |
| November-2011 | −3.39 | 3 | 2 | 2 | 1 or 2 | 2 | November-2011 | 1 | 1 | 2 | 1 | 1 |
| December-2011 | −0.18 | 2 | 2 | 3 | 2 | 2 | December-2011 | 1 | 2 | 2 | 2 | 2 |
| January-2012 | 2.97 | 2 | 3 | 4 | 2 or 3 or 4 | 2 or 3 or 4 | January-2012 | 2 | 2 | 2 | 2 | 2 |
| February-2012 | 1.45 | 3 | 4 | 4 | 4 | 4 | February-2012 | 2 | 2 | 2 | 2 | 2 |
| March-2012 | 0.74 | 4 | 4 | 4 | 4 | 4 | March-2012 | 2 | 2 | 2 | 2 | 2 |
| April-2012 | 3.2 | 4 | 4 | 4 | 4 | 4 | April-2012 | 2 | 2 | 3 | 2 | 2 |
| May-2012 | 2.05 | 4 | 4 | 4 | 4 | 4 | May-2012 | 2 | 3 | 2 | 2 or 3 | 2 or 3 |
| June-2012 | 1.28 | 4 | 4 | 3 | 4 | 4 | June-2012 | 3 | 2 | 2 | 2 | 2 |
| July-2012 | 1.78 | 4 | 3 | 2 | 2 or 3 or 4 | 2 | July-2012 | 2 | 2 | 2 | 2 | 2 |
| August-2012 | −2.36 | 3 | 2 | 1 | 1 or 2 | 2 | August-2012 | 2 | 2 | 2 | 2 | 2 |
| September-2012 | −0.83 | 2 | 1 | 1 | 1 | 1 | September-2012 | 2 | 2 | 2 | 2 | 2 |
| October-2012 | −2.58 | 1 | 1 | 2 | 1 | 1 | October-2012 | 2 | 2 | 1 | 2 | 2 |
| November-2012 | −1.31 | 1 | 2 | 2 | 1 or 2 | 2 | November-2012 | 2 | 1 | 1 | 1 | 1 |
| December-2012 | −0.44 | 2 | 2 | 1 | 2 | 2 | December-2012 | 1 | 1 | 1 | 1 | 1 |
| January-2013 | −1.44 | 2 | 1 | 2 | 1 | 1 | January-2013 | 1 | 1 | 1 | 1 | 1 |
| February-2013 | −3.21 | 1 | 2 | 1 | 1 or 2 | 2 | February-2013 | 1 | 1 | 1 | 1 | 1 |
| L0045 | NAO | Drought Class at | Drought Class at Month t + 1 | L0048 | Drought Class at | Drought Class at Month t + 1 |
| Date | Month t − 4 | Month t − 1 | Month t | OBS | Predicted w/NAO | Predicted | date | Month t − 1 | Month t | OBS | Predicted w/NAO | Predicted |
| October-2011 | −1.58 | 3 | 4 | 2 | 2 or 3 or 4 | 4 | October-2011 | 1 | 1 | 1 | 1 | 1 |
| November-2011 | −3.39 | 4 | 2 | 3 | 2 | 2 | November-2011 | 1 | 1 | 2 | 1 | 1 |
| December-2011 | −0.18 | 2 | 3 | 4 | 2 or 3 or 4 | 2 or 3 or 4 | December-2011 | 1 | 2 | 2 | 2 | 2 |
| January-2012 | 2.97 | 3 | 4 | 4 | 3 or 4 | 4 | January-2012 | 2 | 2 | 3 | 2 | 2 |
| February-2012 | 1.45 | 4 | 4 | 4 | 4 | 4 | February-2012 | 2 | 3 | 3 | 2 or 3 | 2 or 3 |
| March-2012 | 0.74 | 4 | 4 | 4 | 4 | 4 | March-2012 | 3 | 3 | 3 | 2 or 3 | 2 or 3 |
| April-2012 | 3.2 | 4 | 4 | 4 | 4 | 4 | April-2012 | 3 | 3 | 4 | 2 or 3 | 2 or 3 |
| May-2012 | 2.05 | 4 | 4 | 4 | 4 | 4 | May-2012 | 3 | 4 | 4 | 3 or 4 | 4 |
| June-2012 | 1.28 | 4 | 4 | 3 | 4 | 4 | June-2012 | 4 | 4 | 4 | 3 or 4 | 4 |
| July-2012 | 1.78 | 4 | 3 | 2 | 2 or 3 or 4 | 2 or 3 | July-2012 | 4 | 4 | 2 | 3 or 4 | 4 |
| August-2012 | −2.36 | 3 | 2 | 1 | 1 or 2 | 2 | August-2012 | 4 | 2 | 2 | 1 or 2 | 2 |
| September-2012 | −0.83 | 2 | 1 | 2 | 1 | 1 | September-2012 | 2 | 2 | 2 | 2 | 2 |
| October-2012 | −2.58 | 1 | 2 | 1 | 1 or 2 | 2 | October-2012 | 2 | 2 | 1 | 2 | 2 |
| November-2012 | −1.31 | 2 | 1 | 1 | 1 | 1 | November-2012 | 2 | 1 | 1 | 1 | 1 |
| December-2012 | −0.44 | 1 | 1 | 1 | 1 | 1 | December-2012 | 1 | 1 | 1 | 1 | 1 |
| January-2013 | −1.44 | 1 | 1 | 1 | 1 | 1 | January-2013 | 1 | 1 | 2 | 1 | 1 |
| February-2013 | −3.21 | 1 | 1 | 1 | 1 | 1 | February-2013 | 1 | 2 | 1 | 2 | 2 |
Table 6.
SPI12: comparison between observed (OBS) and predicted drought class transitions (“Predicted w/NAO” and “Predicted” for four locations during the period October 2011 to February 2013).
Table 6.
SPI12: comparison between observed (OBS) and predicted drought class transitions (“Predicted w/NAO” and “Predicted” for four locations during the period October 2011 to February 2013).
| L0035 | NAO | Drought Class at | Drought Class at Month t + 1 | L0038 | Drought Class at | Drought Class at Month t + 1 |
| Date | Month t − 10 | Month t − 1 | Month t | OBS | Predicted w/NAO | Predicted | date | Month t − 1 | Month t | OBS | Predicted w/NAO | Predicted |
| October-2011 | −4.62 | 2 | 2 | 2 | 2 | 2 | October-2011 | 1 | 1 | 1 | 1 | 1 |
| November-2011 | −1.38 | 2 | 2 | 3 | 2 | 2 | November-2011 | 1 | 1 | 1 | 1 | 1 |
| December-2011 | 2.79 | 2 | 3 | 4 | 2 or 3 or 4 | 3 | December-2011 | 1 | 1 | 1 | 1 | 1 |
| January-2012 | −0.44 | 3 | 4 | 4 | 4 | 3 or 4 | January-2012 | 1 | 1 | 1 | 1 | 1 |
| February-2012 | 2.39 | 4 | 4 | 4 | 4 | 4 | February-2012 | 1 | 1 | 2 | 1 | 1 |
| March-2012 | 1.08 | 4 | 4 | 4 | 4 | 4 | March-2012 | 1 | 2 | 2 | 2 | 2 |
| April-2012 | −1.58 | 4 | 4 | 4 | 4 | 4 | April-2012 | 2 | 2 | 2 | 2 | 2 |
| May-2012 | −3.39 | 4 | 4 | 4 | 4 | 4 | May-2012 | 2 | 2 | 2 | 2 | 2 |
| June-2012 | −0.18 | 4 | 4 | 4 | 4 | 4 | June-2012 | 2 | 2 | 2 | 2 | 2 |
| July-2012 | 2.97 | 4 | 4 | 4 | 4 | 4 | July-2012 | 2 | 2 | 2 | 2 | 2 |
| August-2012 | 1.45 | 4 | 4 | 4 | 4 | 4 | August-2012 | 2 | 2 | 2 | 2 | 2 |
| September-2012 | 0.74 | 4 | 4 | 3 | 4 | 4 | September-2012 | 2 | 2 | 2 | 2 | 2 |
| October-2012 | 3.2 | 4 | 3 | 4 | 2 or 3 or 4 | 2 or 3 or 4 | October-2012 | 2 | 2 | 2 | 2 | 2 |
| November-2012 | 2.05 | 3 | 4 | 4 | 3 or 4 | 3 or 4 | November-2012 | 2 | 2 | 2 | 2 | 2 |
| December-2012 | 1.28 | 4 | 4 | 2 | 4 | 4 | December-2012 | 2 | 2 | 2 | 2 | 2 |
| January-2013 | 1.78 | 4 | 2 | 2 | 2 | 2 | January-2013 | 2 | 2 | 1 | 2 | 2 |
| February-2013 | −2.36 | 2 | 2 | 1 | 2 | 2 | February-2013 | 2 | 1 | 1 | 1 | 1 |
| L0045 | NAO | Drought Class at | Drought class at Month t + 1 | L0048 | Drought Class at | Drought Class at Month t + 1 |
| Date | Month t − 10 | Month t − 1 | Month t | OBS | Predicted w/NAO | Predicted | date | Month t − 1 | Month t | OBS | Predicted w/NAO | Predicted |
| October-2011 | −4.62 | 2 | 2 | 2 | 2 | 2 | October-2011 | 1 | 1 | 1 | 1 | 1 |
| November-2011 | −1.38 | 2 | 2 | 3 | 2 | 2 | November-2011 | 1 | 1 | 1 | 1 | 1 |
| December-2011 | 2.79 | 2 | 3 | 4 | 3 | 3 | December-2011 | 1 | 1 | 1 | 1 | 1 |
| January-2012 | −0.44 | 3 | 4 | 4 | 4 | 3 or 4 | January-2012 | 1 | 1 | 1 | 1 | 1 |
| February-2012 | 2.39 | 4 | 4 | 4 | 4 | 4 | February-2012 | 1 | 1 | 2 | 1 | 1 |
| March-2012 | 1.08 | 4 | 4 | 4 | 4 | 4 | March-2012 | 1 | 2 | 2 | 2 | 2 |
| April-2012 | −1.58 | 4 | 4 | 4 | 4 | 4 | April-2012 | 2 | 2 | 3 | 2 | 2 |
| May-2012 | −3.39 | 4 | 4 | 4 | 4 | 4 | May-2012 | 2 | 3 | 3 | 2 or 3 | 2 or 3 |
| June-2012 | −0.18 | 4 | 4 | 4 | 4 | 4 | June-2012 | 3 | 3 | 3 | 3 | 3 |
| July-2012 | 2.97 | 4 | 4 | 4 | 4 | 4 | July-2012 | 3 | 3 | 3 | 3 | 3 |
| August-2012 | 1.45 | 4 | 4 | 4 | 4 | 4 | August-2012 | 3 | 3 | 3 | 3 | 3 |
| September-2012 | 0.74 | 4 | 4 | 4 | 4 | 4 | September-2012 | 3 | 3 | 3 | 3 | 3 |
| October-2012 | 3.2 | 4 | 4 | 4 | 4 | 4 | October-2012 | 3 | 3 | 3 | 3 | 3 |
| November-2012 | 2.05 | 4 | 4 | 3 | 4 | 4 | November-2012 | 3 | 3 | 2 | 3 | 3 |
| December-2012 | 1.28 | 4 | 3 | 2 | 2 or 3 or 4 | 2 or 3 or 4 | December-2012 | 3 | 2 | 2 | 2 | 2 |
| January-2013 | 1.78 | 3 | 2 | 2 | 2 | 2 | January-2013 | 2 | 2 | 2 | 2 | 2 |
| February-2013 | −2.36 | 2 | 2 | 1 | 2 | 2 | February-2013 | 2 | 2 | 1 | 2 | 2 |
In order to have a true picture of the performance of the model driven by the NAO compared to the model that is not driven by the NAO, the proportion of corrects (PC) and the Heidke skill score (HSS) were computed for the entire period of the time series. PC and HSS results are shown in
Table 7 and
Table 8, respectively, for the SPI6 and the SPI12. These results show that improvements in the predictions occur when using the model with the NAO driven compared to the model without that driven: relative to SPI6, improvements of the PC score range from 1% to 5.6%, averaging 3%, while the HSS shows improvements ranging from 1.3% to 8.5% with an average of 4.5% (
Table 7); for SPI12, three locations did not show any improvement when using modeling driven by the NAO, while the other seven locations’ improvements were quite small, ranging from 0.4% to 2% for PC and 0.7% to 3.2% for HSS (
Table 8).
Table 7.
SPI6: results for the proportion of corrects (PC) and the Heidke skill score (HSS) for the model with the NAO driven (Model w/NAO) and the model without the NAO driven (Model) and the difference between both.
Table 7.
SPI6: results for the proportion of corrects (PC) and the Heidke skill score (HSS) for the model with the NAO driven (Model w/NAO) and the model without the NAO driven (Model) and the difference between both.
| SPI6 | PC | HSS |
|---|
| Model w/NAO | Model | Difference | Model w/NAO | Model | Difference |
|---|
| L0034 | 75.95% | 72.17% | 3.78% | 59.98% | 53.99% | 5.99% |
| L0035 | 77.37% | 74.18% | 3.19% | 62.27% | 57.41% | 4.86% |
| L0036 | 73.94% | 70.83% | 3.10% | 56.96% | 52.08% | 4.88% |
| L0037 | 75.51% | 72.62% | 2.89% | 58.40% | 54.74% | 3.67% |
| L0038 | 75.13% | 74.10% | 1.03% | 58.85% | 57.51% | 1.34% |
| L0044 | 76.55% | 70.91% | 5.64% | 61.02% | 52.49% | 8.53% |
| L0045 | 77.07% | 73.74% | 3.34% | 61.90% | 56.97% | 4.93% |
| L0046 | 74.24% | 73.29% | 0.95% | 57.50% | 55.80% | 1.69% |
| L0047 | 75.36% | 71.95% | 3.41% | 59.06% | 53.69% | 5.36% |
| L0048 | 76.63% | 73.81% | 2.82% | 61.27% | 57.22% | 4.05% |
The application of the log-linear modeling driven by the NAO produces larger improvements of predictions when applied to the SPI6 compared to SPI12,which is likely due to the fact that the correlation between the NAO index (always taken as the monthly value at the beginning of the precipitation accumulation period—PAP) and SPI6 is larger than that with SPI12. This is quite understandable due to the decreasing lagged cross-correlation function between a monthly NAO index value and the forthcoming monthly precipitation values and due to the fact that the PAP of SPI12 is larger compared to that of SPI6. This may also be explained by the slow response to changes in precipitation of SPI12, which produces fewer changes in drought classes compared with SPI6.
The overall modeling performances are good: PC scores ranged from 73.9% to 77.3% and 82.6% to 85.5% when using SPI6 and SPI12, respectively, while HSS scores ranged from 57.0% to 62.3% and 72.3% to 76.4% (HSS) for SPI6 and SPI12, respectively. Those scores normally decrease with the forecast lag (a single month here). Much of the scores are explained by the time overlapping between the SPI precipitation accumulation period of the forecast class and those used as predictors (the previous two months), in our case: five out of six months in SPI6 and 11 out of 12 months in SPI12.
Table 8.
SPI12: results for the proportion of corrects (PC) and the Heidke skill score (HSS) for the model with the NAO driven (Model w/NAO) and the model without the NAO driven (Model) and the difference between both.
Table 8.
SPI12: results for the proportion of corrects (PC) and the Heidke skill score (HSS) for the model with the NAO driven (Model w/NAO) and the model without the NAO driven (Model) and the difference between both.
| SPI12 | PC | HSS |
|---|
| Model w/NAO | Model | Difference | Model w/NAO | Model | Difference |
|---|
| L0034 | 83.90% | 83.11% | 0.79% | 73.84% | 72.62% | 1.22% |
| L0035 | 84.04% | 82.96% | 1.08% | 73.99% | 72.06% | 1.93% |
| L0036 | 83.30% | 84.15% | −0.85% | 72.86% | 74.56% | −1.70% |
| L0037 | 82.55% | 82.14% | 0.41% | 72.27% | 71.56% | 0.71% |
| L0038 | 85.47% | 83.63% | 1.84% | 76.40% | 73.52% | 2.88% |
| L0044 | 84.27% | 82.22% | 2.05% | 74.08% | 70.89% | 3.19% |
| L0045 | 84.72% | 83.78% | 0.94% | 75.08% | 73.52% | 1.56% |
| L0046 | 84.04% | 83.26% | 0.78% | 74.10% | 72.77% | 1.33% |
| L0047 | 82.62% | 83.18% | −0.56% | 72.33% | 73.10% | −0.77% |
| L0048 | 83.07% | 83.18% | −0.11% | 72.71% | 72.83% | −0.12% |
The better performances obtained with the modeling application of SPI12 are likely related to the less frequent change of drought classes with SPI12, which favors capturing the behavior of changes in drought classes in the preceding months. Indeed, the number of changes in drought class is almost double that of SPI6 when compared with the SPI12. These numbers were computed and are presented in
Table 9, jointly with other relevant information explained later in the next paragraph. For both SPI12 and SPI6, when the maintenance in a given class breaks due to an increase or decrease of rainfall, the modeling fails in predicting the future drought class. Nevertheless, the maintenance in a given class is well captured by the model.
Table 9.
Percentage of correct class change predictions relative to the total number of cases in which the observed drought class at month t + 1 differs from the drought class in the previous month for the model with and without NAO, as well as the total number of class changes for the SPI6 and SPI12.
| SPI6 | L0034 | L0035 | L0036 | L0037 | L0038 | L0044 | L0045 | L0046 | L0047 | L0048 | Average |
| Model w/NAO | 16.2 | 17.1 | 15.8 | 17.3 | 25.8 | 20.0 | 20.1 | 13.2 | 17.9 | 21.9 | 18.5 |
| Model | 11.3 | 11.0 | 14 | 13.4 | 17.3 | 7.4 | 12.1 | 12.9 | 13.6 | 14.5 | 12.8 |
| Difference | 4.9 | 6.1 | 1.8 | 3.9 | 8.5 | 12.6 | 8 | 0.3 | 4.3 | 7.4 | 5.8 |
| Nr. class changes | 421 | 403 | 443 | 421 | 438 | 404 | 422 | 432 | 431 | 421 | 423.6 |
| SPI12 | L0034 | L0035 | L0036 | L0037 | L0038 | L0044 | L0045 | L0046 | L0047 | L0048 | Average |
| Model w/NAO | 10.4 | 15.0 | 8.5 | 6.5 | 17.2 | 11.4 | 15.2 | 19.3 | 7.3 | 6.2 | 11.7 |
| Model | 5.6 | 10.1 | 14.1 | 3.2 | 9.8 | 2.4 | 11.7 | 16.7 | 9.7 | 6.2 | 9.0 |
| Difference | 4.8 | 4.9 | -5.6 | 3.3 | 7.4 | 9 | 3.5 | 2.6 | −2.4 | 0 | 2.8 |
| Nr. class changes | 249 | 267 | 248 | 248 | 244 | 246 | 256 | 270 | 278 | 241 | 254.7 |
The percentage of correct predictions when a drought class change occurs relative to the total number of cases when the observed drought class at month
t + 1 differs from the drought class in the previous month was computed. Results are presented in
Table 9 and refer to the entire time series length regarding the NAO driven predictions, the predictions without the NAO driven and their difference. These results show that the percentage of “predictions w/NAO” that agree with the observed class when there was a class change ranges from 13.2% to 25.8% with an average of 18.5% for SPI6 and from 6.2% to 19.2% with an average of 11.5% for SPI12. Relative to the model with the NAO forcing, those percentages are indeed slightly higher, showing an increase in the percentage of corrects ranging from 0.3% to 12.6% with an average of 5.8% for SPI6. For SPI12, this increase occurs in seven locations ranging from 2.6% to 9%, showing consistency with
Table 8 where the same remaining three locations did not present improvement in the predictions.
These results show that log-linear modeling applied to both SPI6 and SPI12 actually cannot adequately predict the correct class change when there is a break relative to the drought class established in the previous two months. Those are cases where the rainfall regime during the two last months of the SPI precipitation period was totally different from the remaining ones. Maybe in these cases, though not a priori detectable, the lag between the NAO index and the SPI should be smaller in respect to the NAO− conditioned probability transition matrices. However, the fact that some of these cases can be predicted indicates that it may be possible to further use the model and particularly improve the way it is driven by NAO, namely using shorter time lags between NAO and SPI despite the fact that these do not correspond to the best correlation results. Another modification in modeling consists in considering three NAO states—very negative, around zero and very positive—instead of two, negative and positive, as used in this study. In fact, under the influence of a very negative (positive) NAO state, the model may be forced to strongly favor a decrease (increase) of drought class. The middle state, near zero, should not favor any transition.
4. Conclusions
This paper has contributed to the improvement of the log-linear forecasting models of drought class transitions [
31,
32] by conceiving a general method which includes the dependence of past drought SPI classes on a set of mutually exclusive weather regimes or large-scale mid-latitude atmospheric patterns. Its usefulness relies on the influence of Euro-Atlantic WRs, with particular relevance of the North Atlantic Oscillation on the large-scale European rainfall field [
13,
16,
18], and on target regions such as Portugal and the Iberian Peninsula [
12,
17], through the influence of WRs on the meridional shifting of the polar front and storm-tracks [
13]. Despite the availability either of statistical forecasting models (e.g., those based on multivariate linear regression) of the cumulated quantitative precipitation [
21,
22], which could eventually be converted into SPI classes, or of stochastic continuous models of the drought indices [
34,
35,
36,
37], the log-linear modeling assigns the SPI classes’ forecasted probabilities, which might potentially be useful as input into economic value decision models. Moreover, the log-linear models have the advantage of choosing the SPI partition set in a suited manner for discriminating different levels of drought severity (negative SPI values) or in alternative, different levels of rain exceedances and floods (positive SPI values). Another relevant issue is the fact that drought forecasting has essentially the same nature of the seasonal-to-annual weather forecasting problem,
i.e., they are both probabilistic in essence due to the determinist chaotic nature of atmospheric dynamics. They have been evaluated, though not still operationally by the ECMWF integrated seasonal forecasted system [
20], and therefore, simple probabilistic log-linear models, such as that designed in the paper, may capture some signals of the probability forecasts of drought.
In particular, for the developed model, the log-linear modeling of SPI drought class transitions driven by the NAO brought some improvements in the predictions when applied to SPI6 in comparison to the model not driven by the NAO. The improvement is relatively modest since much of the NAO influence on SPI is already implicit, even in a transition model without the explicit NAO forcing. That is because of the tight correlation of about −0.60 between monthly precipitation and the NAO index in western Iberia [
16]. Regarding the application to SPI12, it cannot be concluded that a real improvement in predictions exists since only seven of the locations presented slight improvements.
The overall performances of the log-linear modeling are good, so it can be concluded that the log-linear modeling, when applied to SPI6 and SP12, performs well in predicting the drought class one month ahead while knowing the drought classes of the two previous months, although it fails in predicting many transitions to a drought class that is different than the drought classes in the previous two months; nevertheless, it captures the maintenance of the drought class very well. With the use of the model driven by the NAO, some transitions of class can be correctly predicted, namely those under the influence of negative NAO. On those events under the negative NAO phase, the class predictions tend to be shifted to wetter classes as compared to the predictions without the explicit forcing of NAO. Conversely and consistently, a strengthening or maintenance of the drought became more probable in the NAO-driven predictions throughout the subset of events under the positive phase of the NAO. As a whole, the skill of drought classes’ forecasts is consistent with that of linear statistical schemes of the continuous quantitative precipitation referred to in the introduction.
Overall, results show that the log-linear approach driven by NAO may be used with drought monitoring and forecasting since it provides useful information to water managers and users, helping them in their decisions to mitigate drought. Future research will focus on considering shorter time lags between SPI and NAO indices, using a NAO index with three states, as well as including other weather regime indices (e.g., NAO, EAP, SCAND and EAWR [
13,
14]) into the log-linear modeling or a Markov chain approach. Another approach could consider time averages (e.g., three or six months of averaging) other than the monthly averages of the NAO index used here.


