
An Integrated Approach for Site Selection of Snow Measurement Stations


Abstract
:1. Introduction
2. Data and Methods
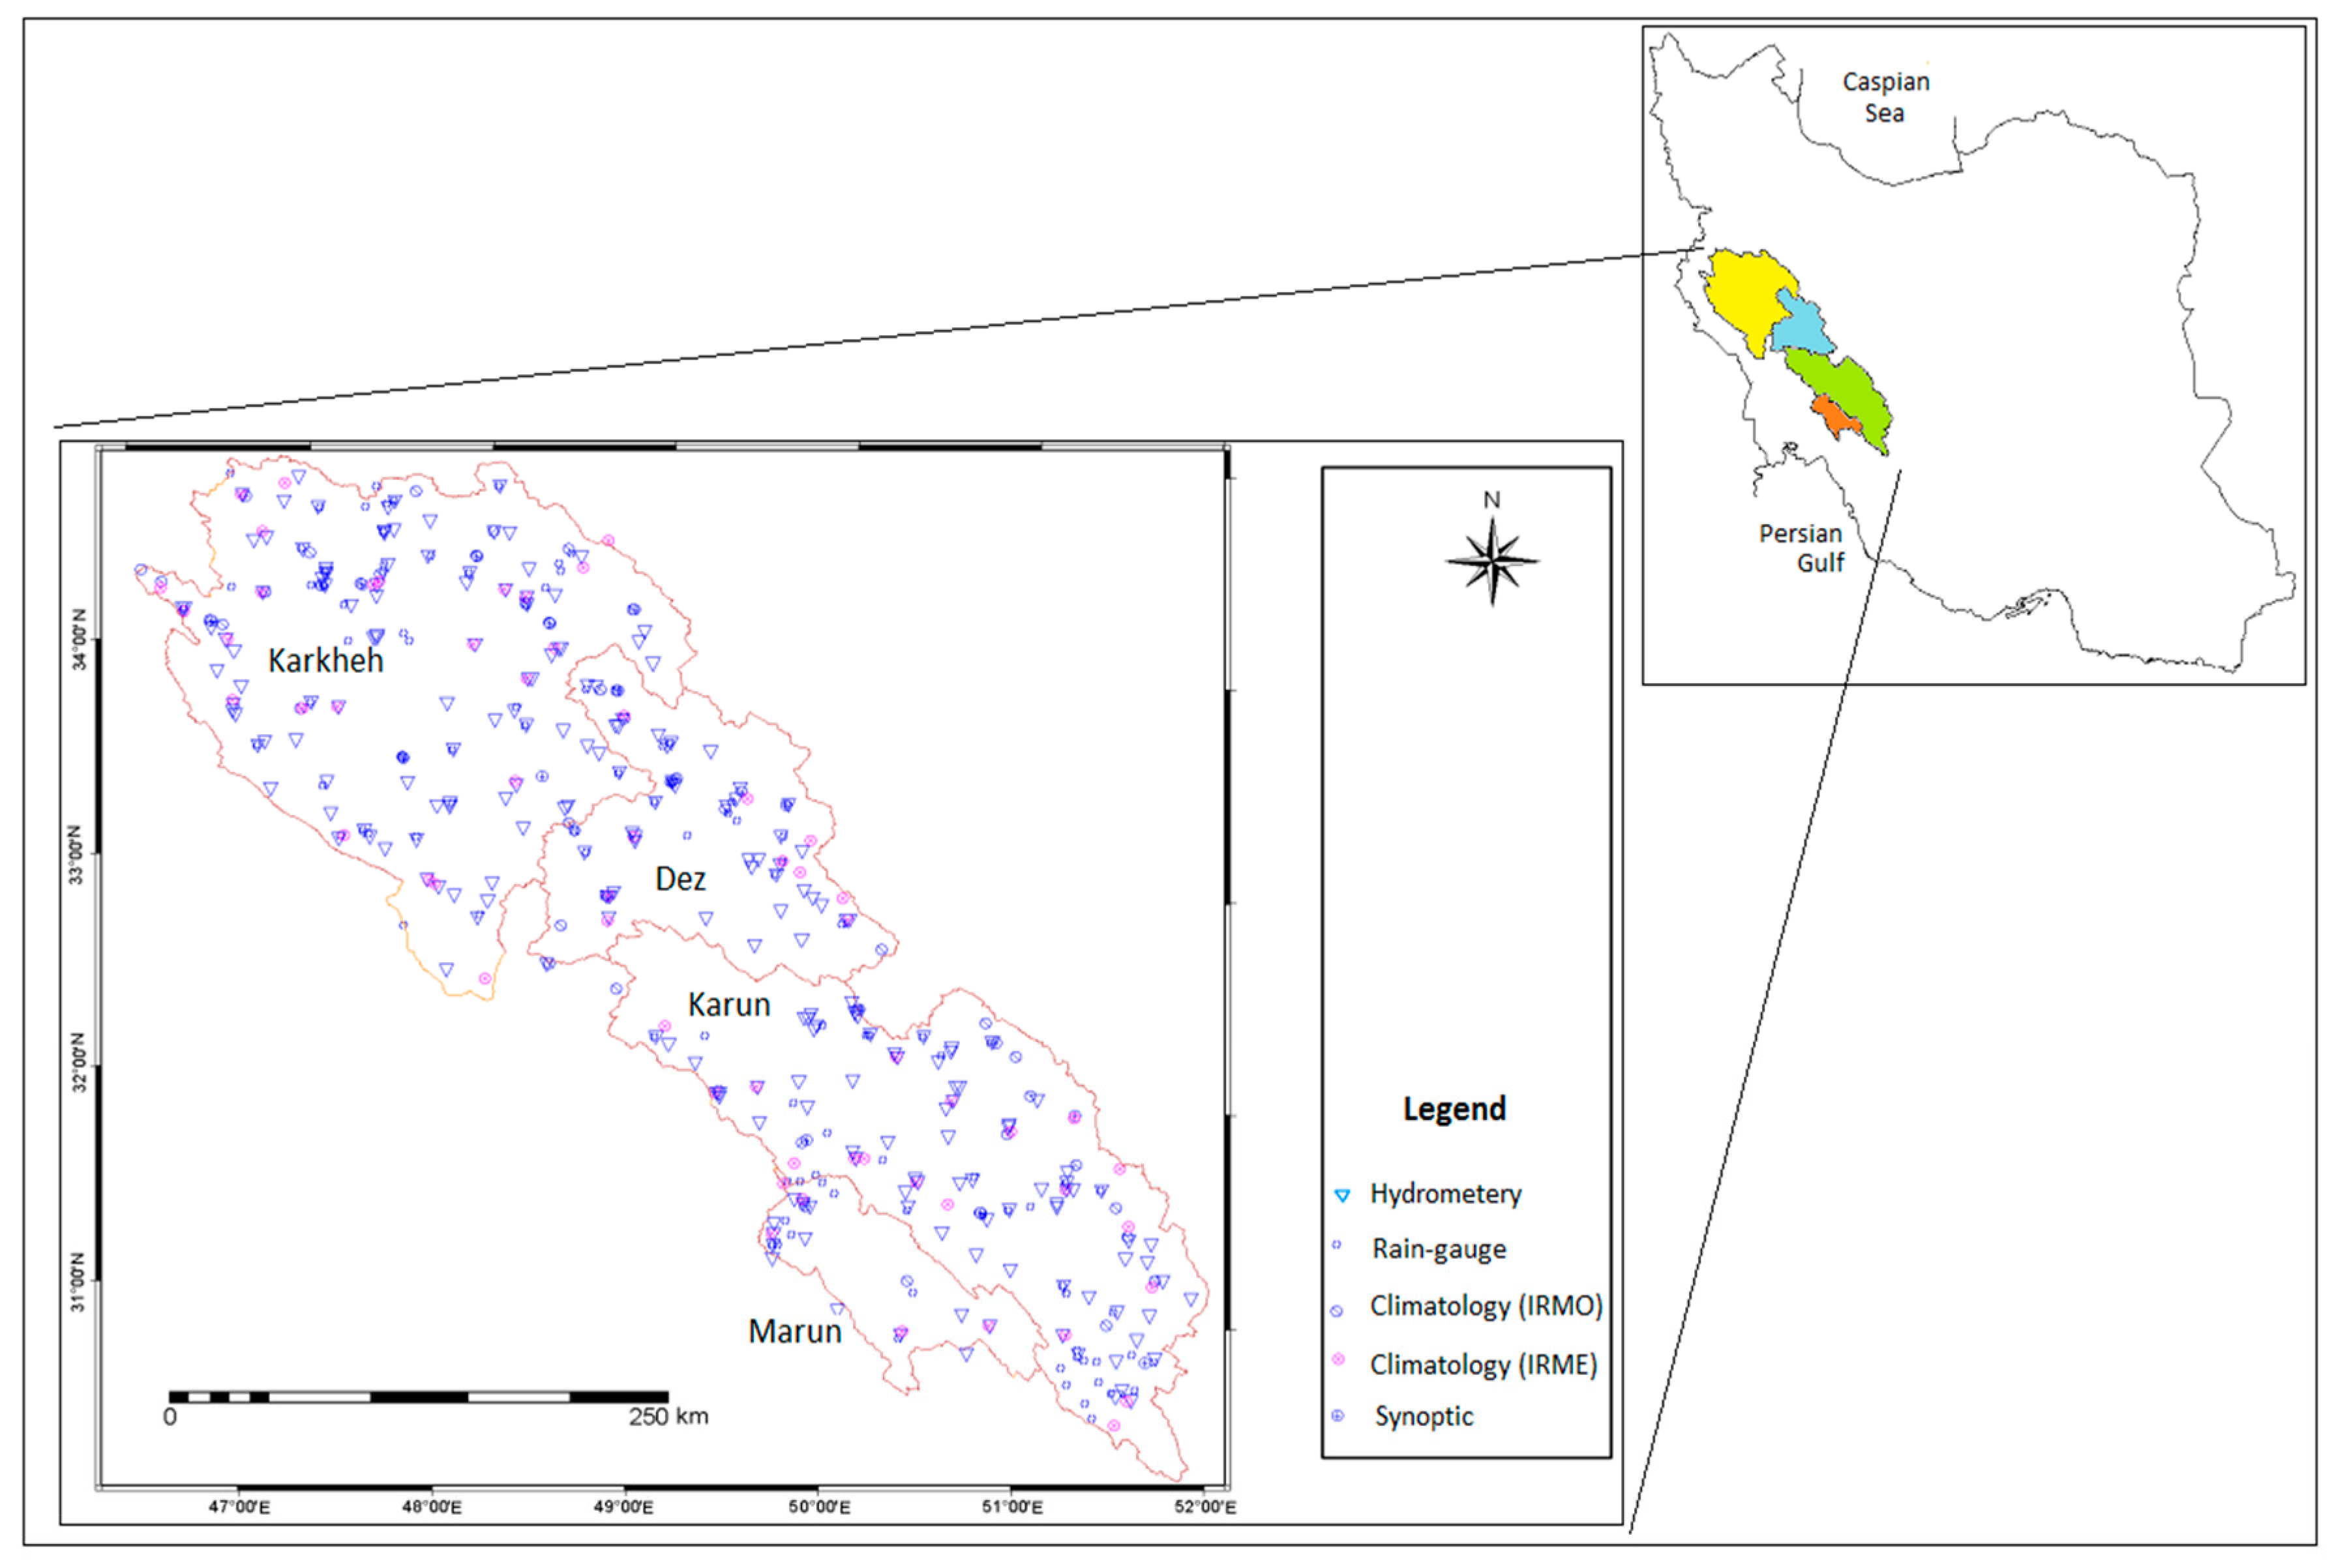
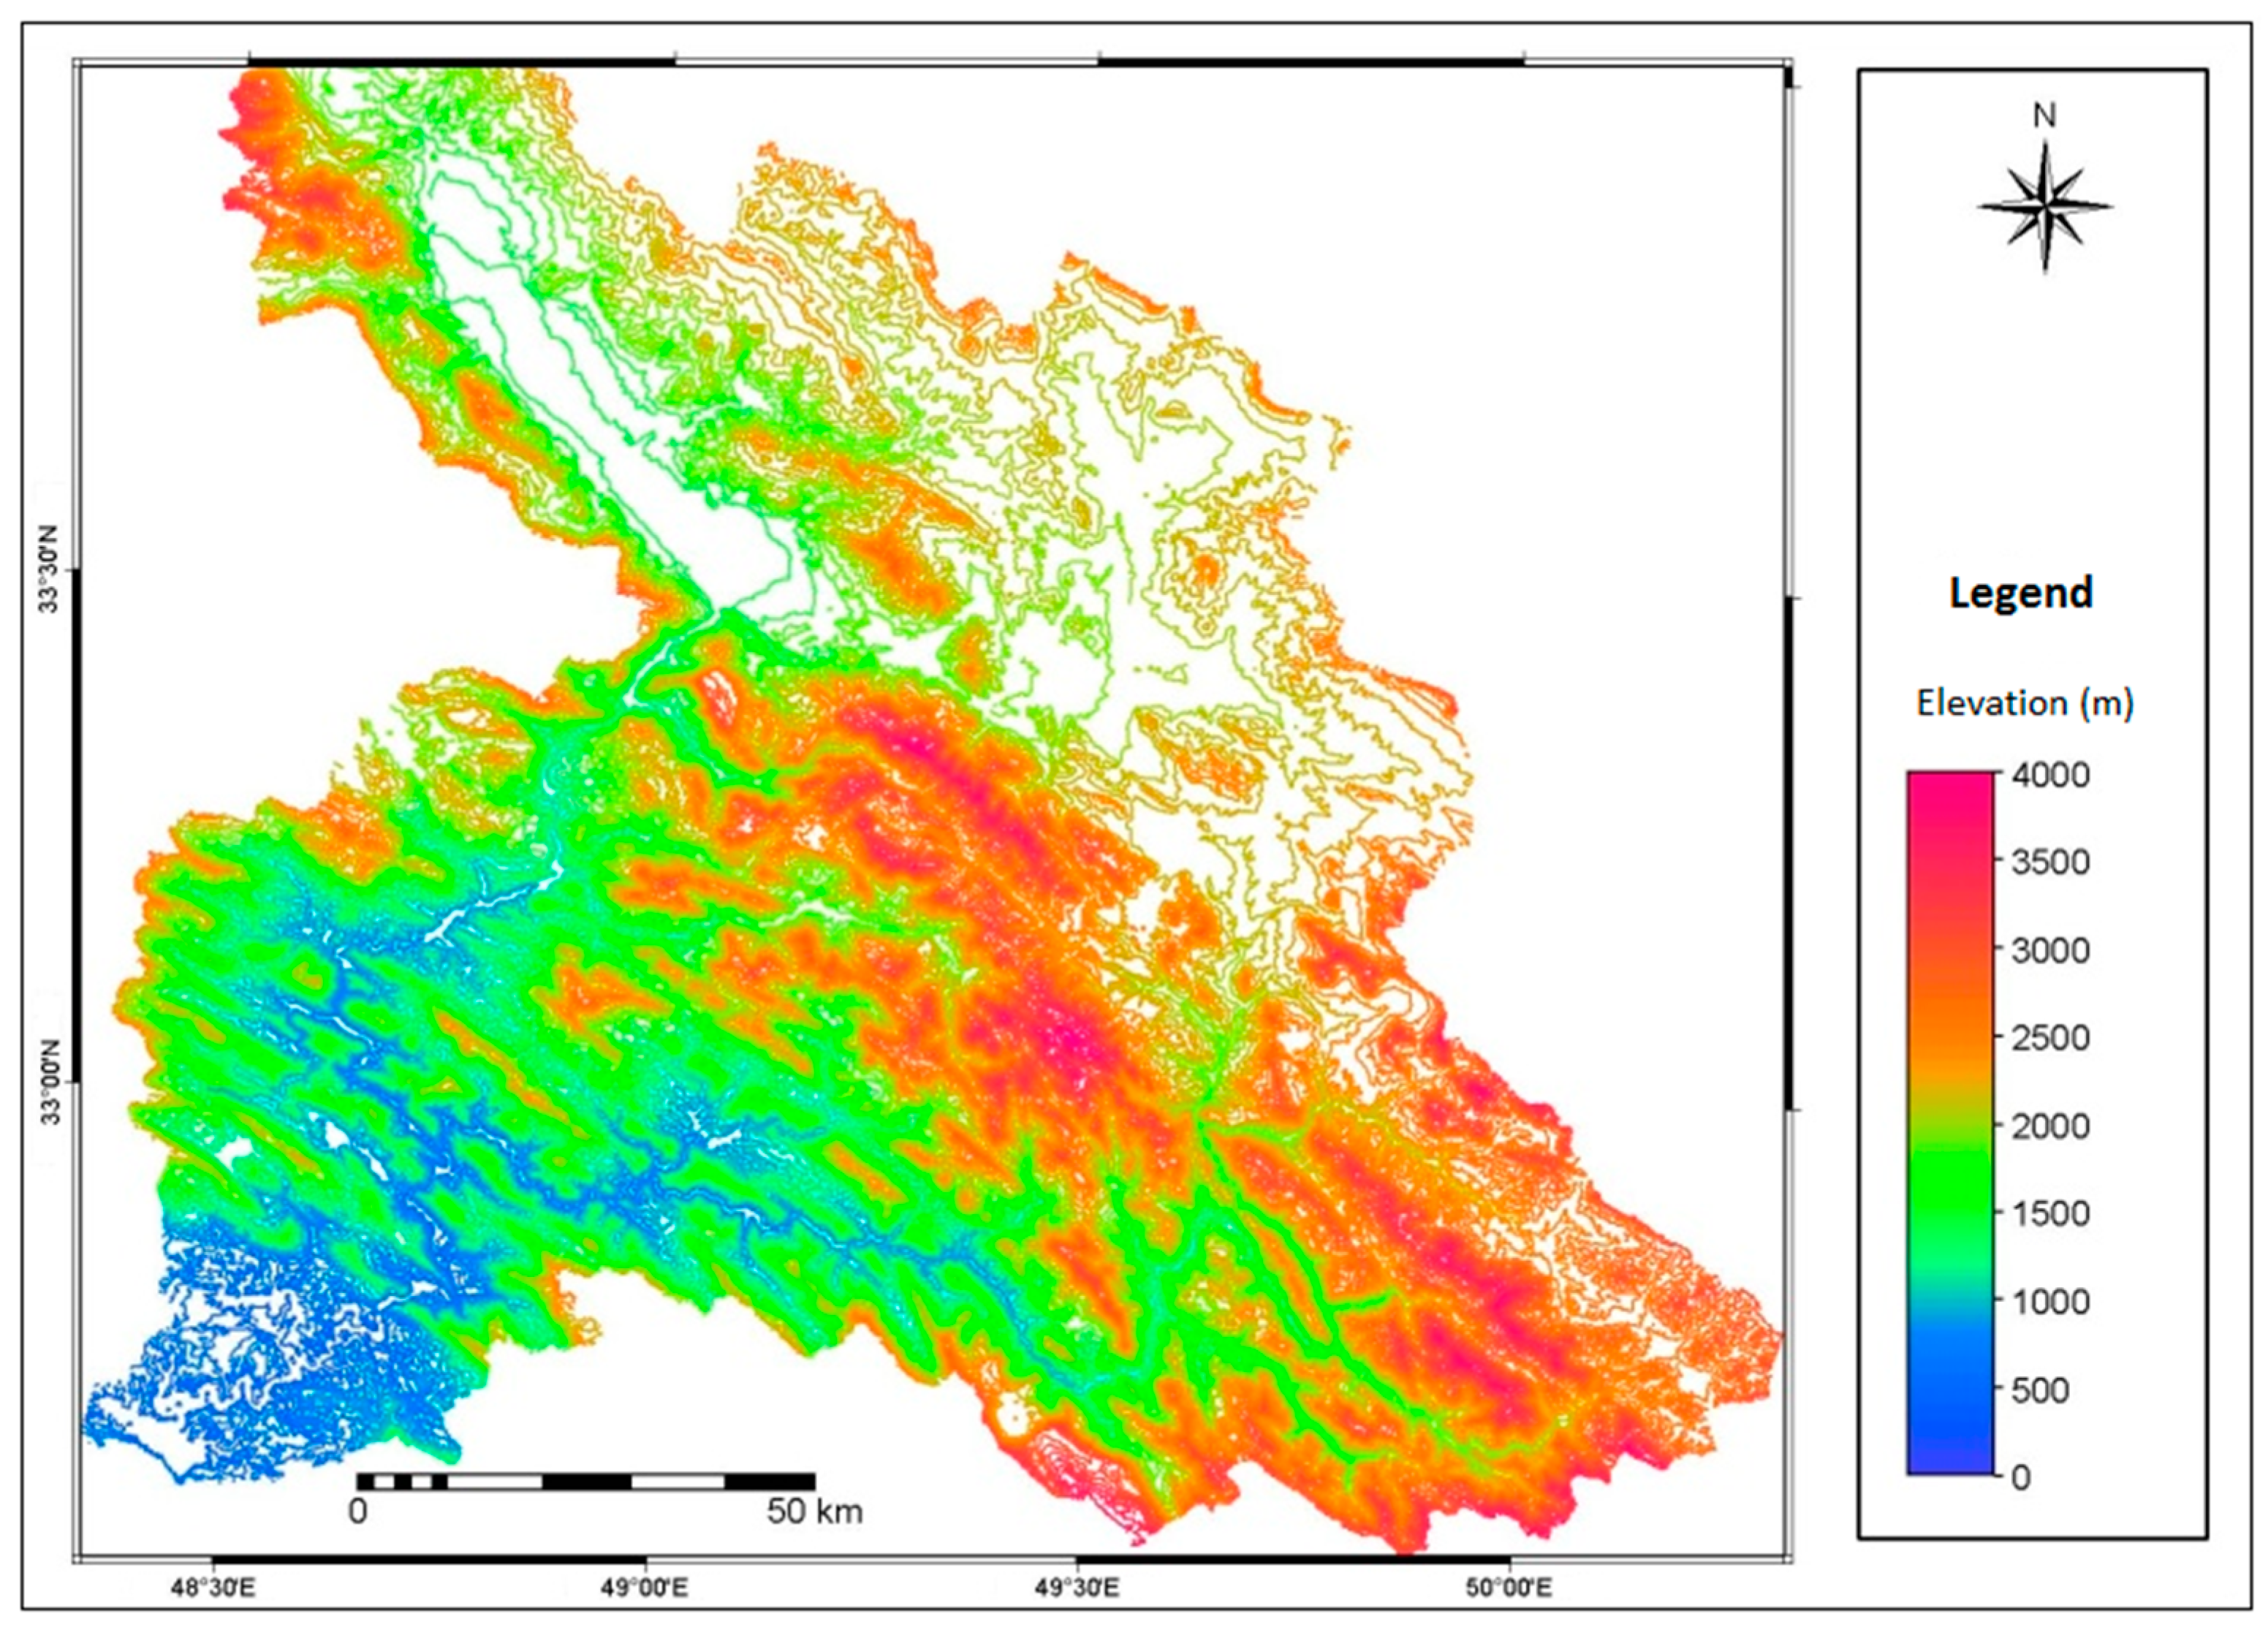
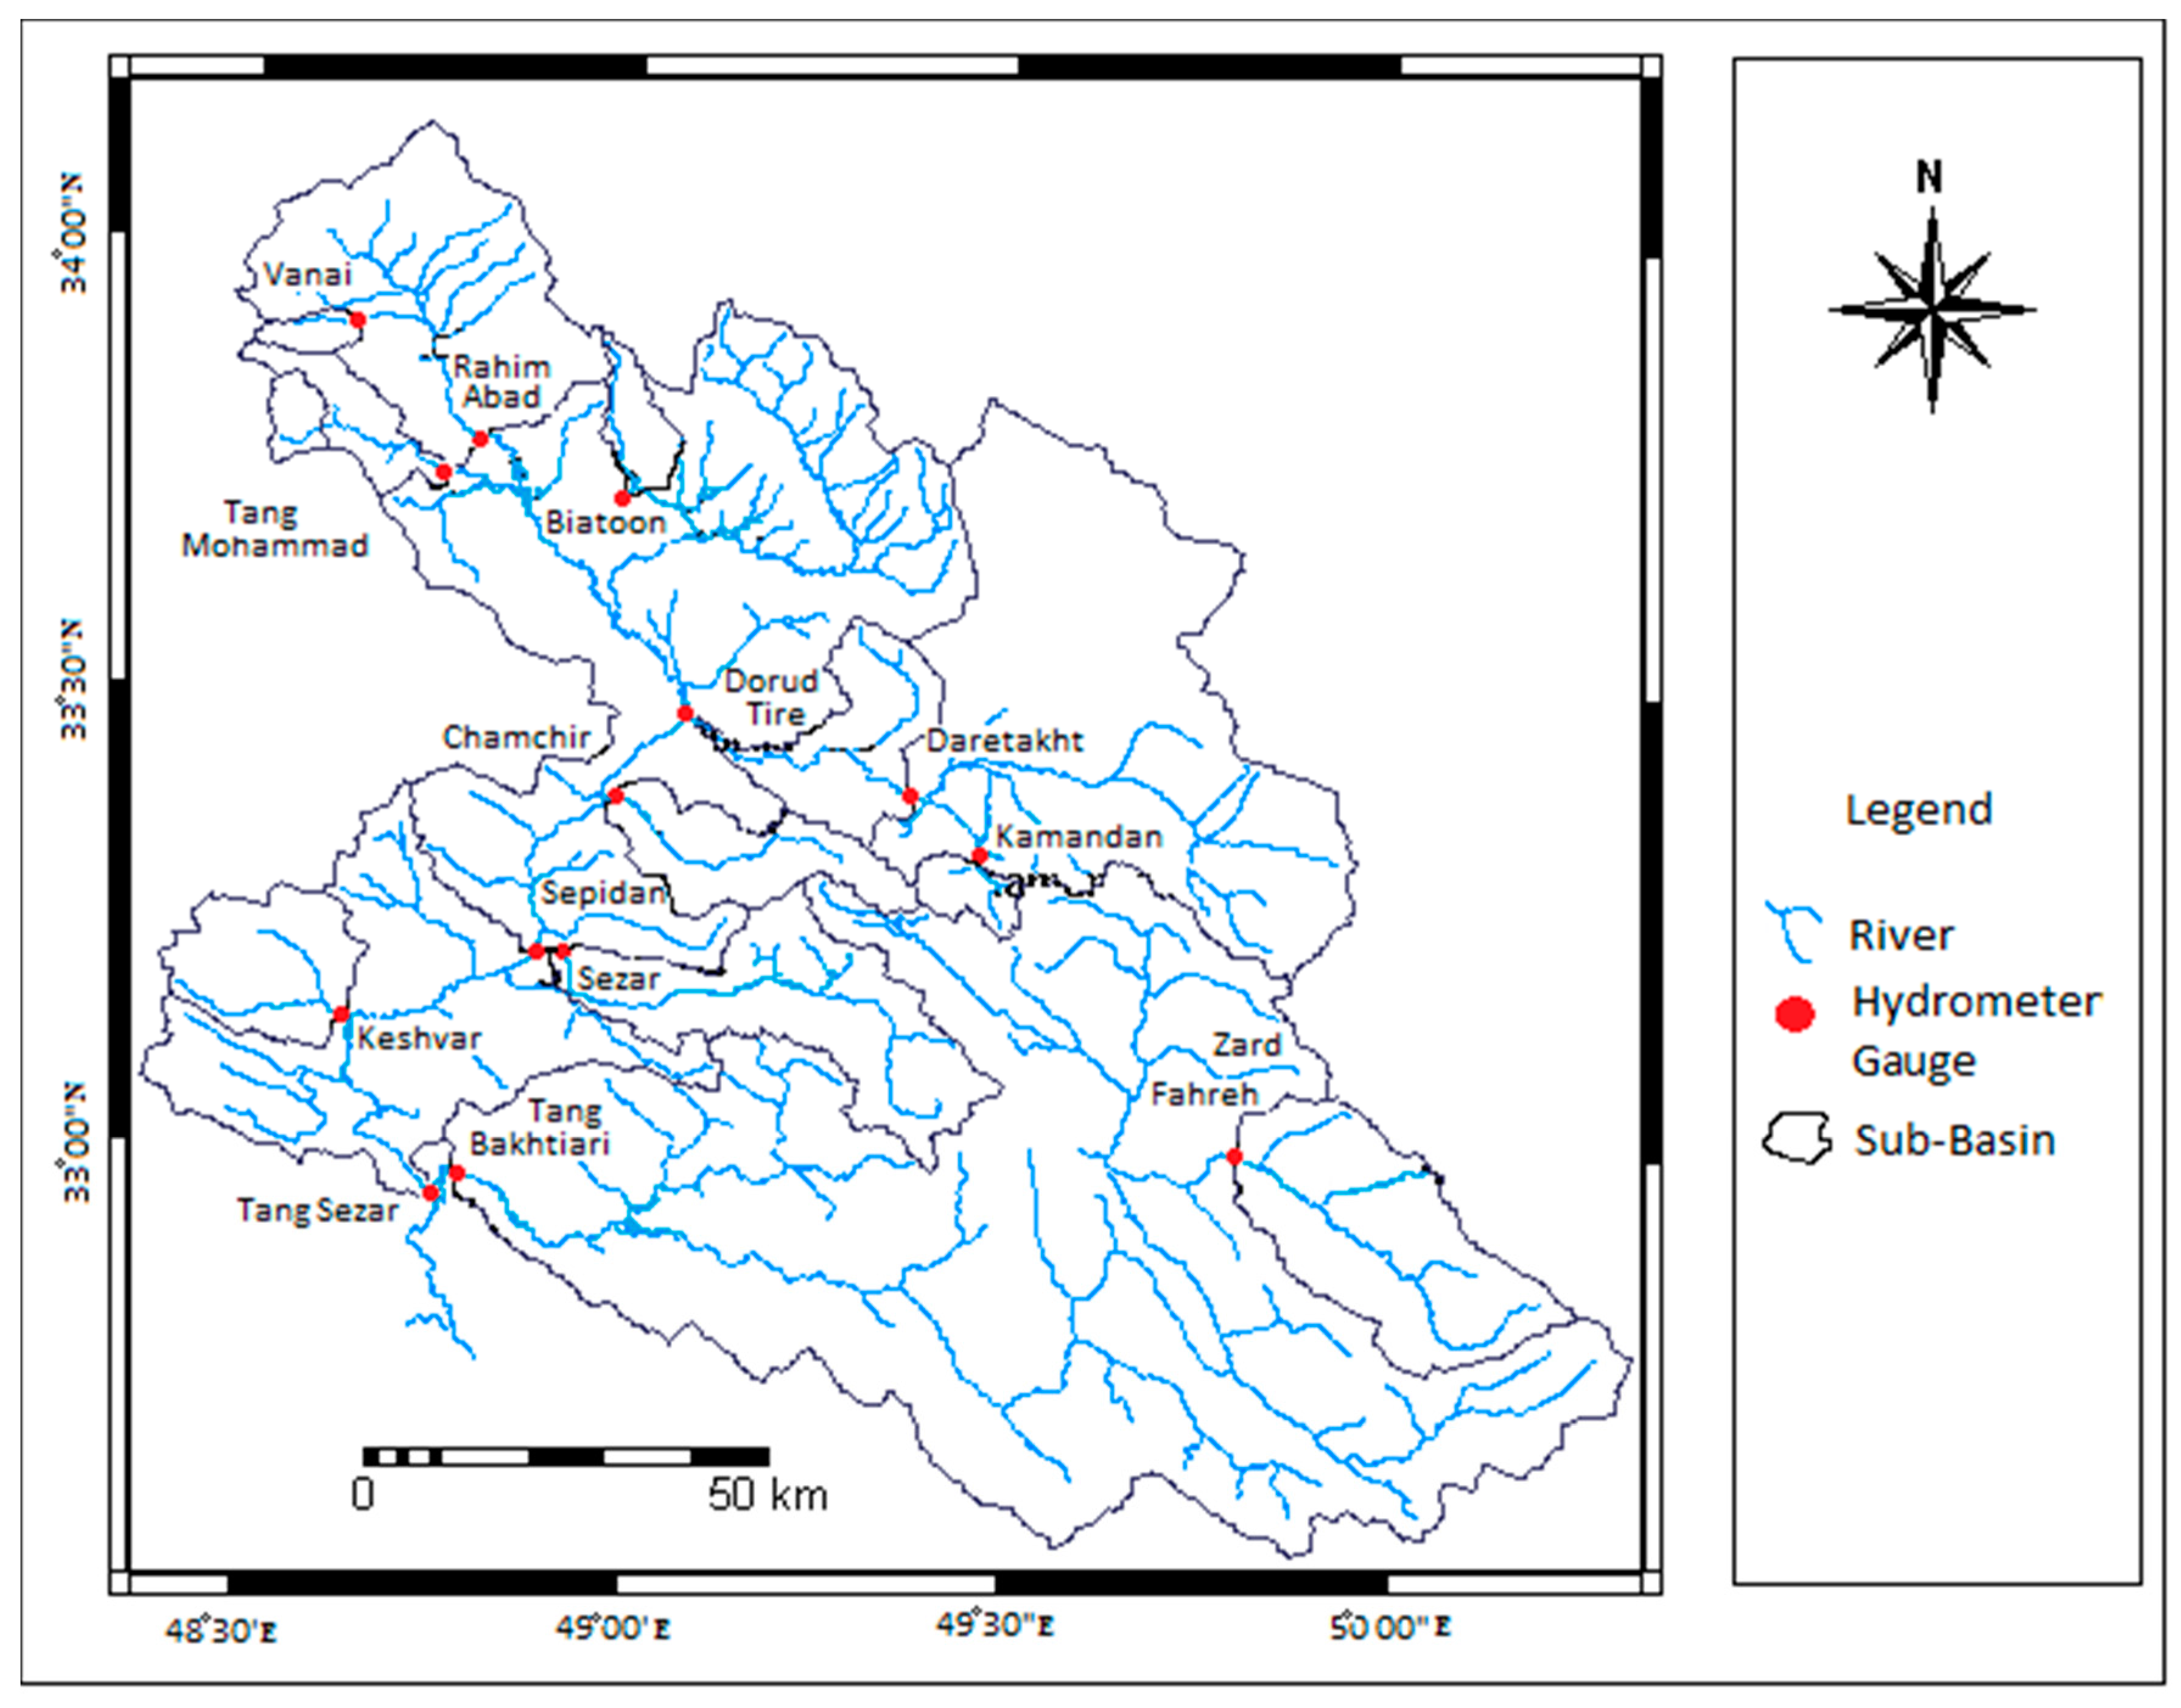
2.1. Study Area
2.2. Data Collection
2.3. Methodology
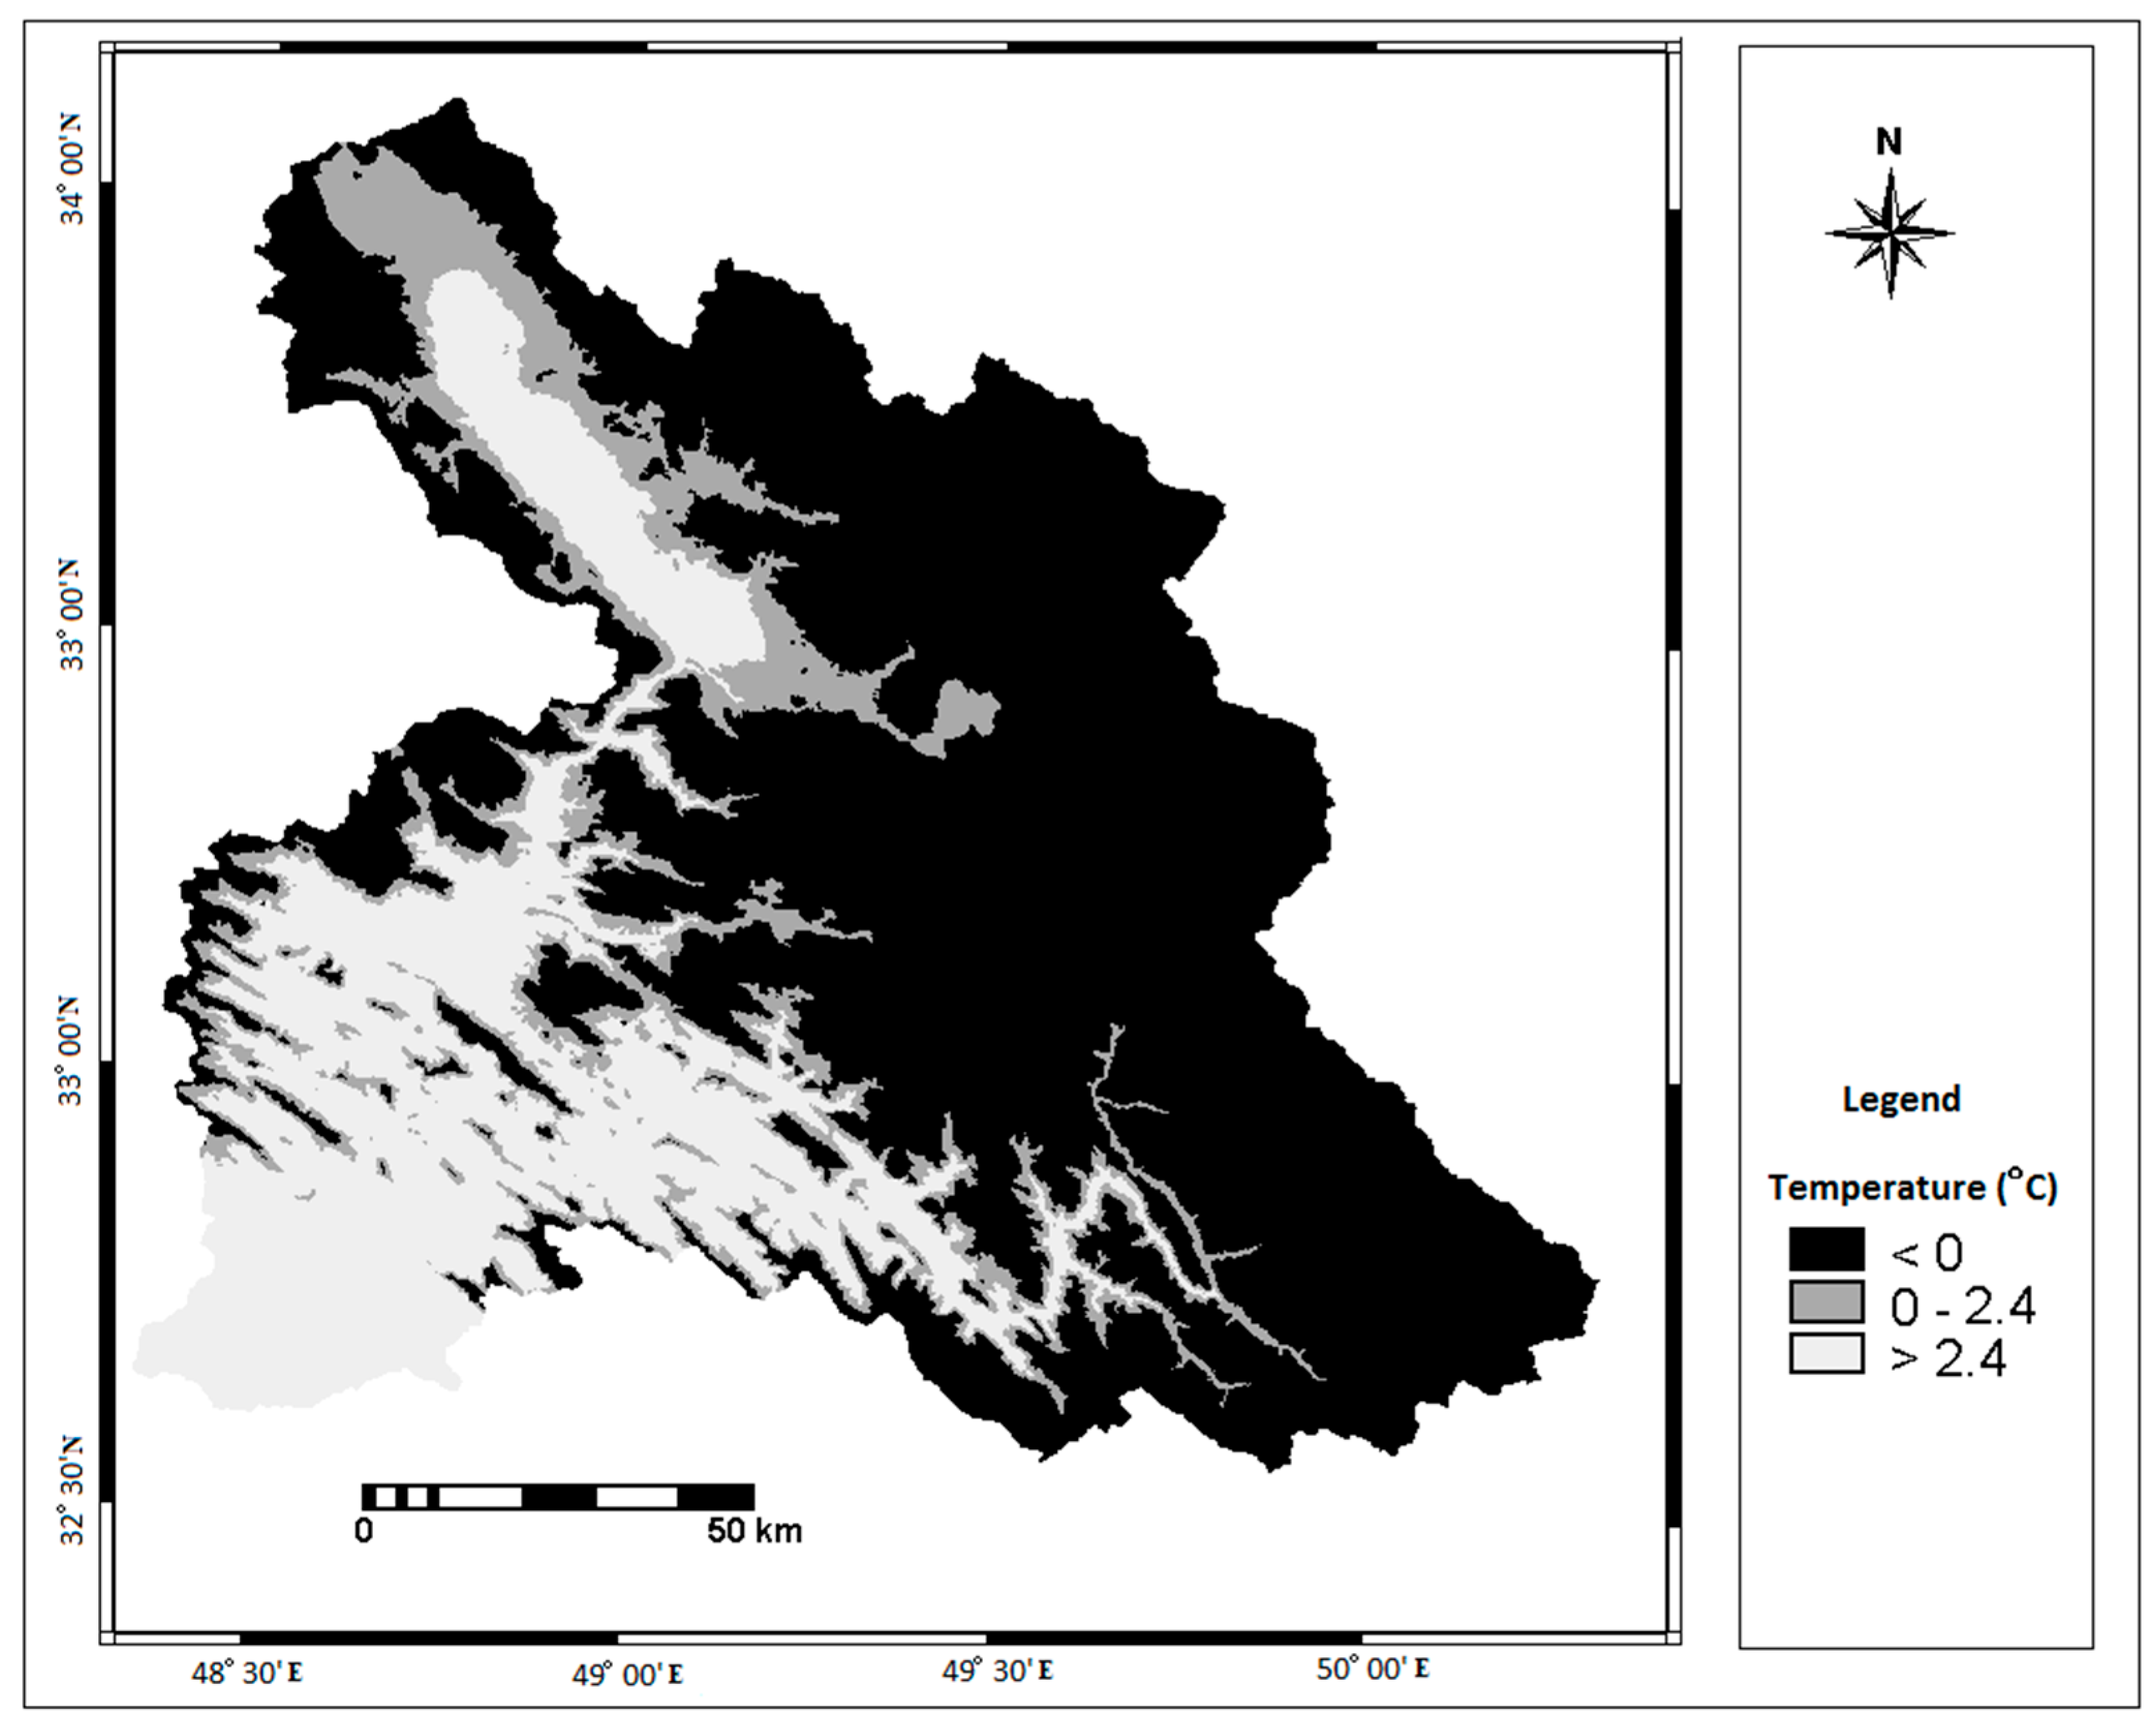
2.3.1. Meteorological Criteria
2.3.2. Hydrological Criteria
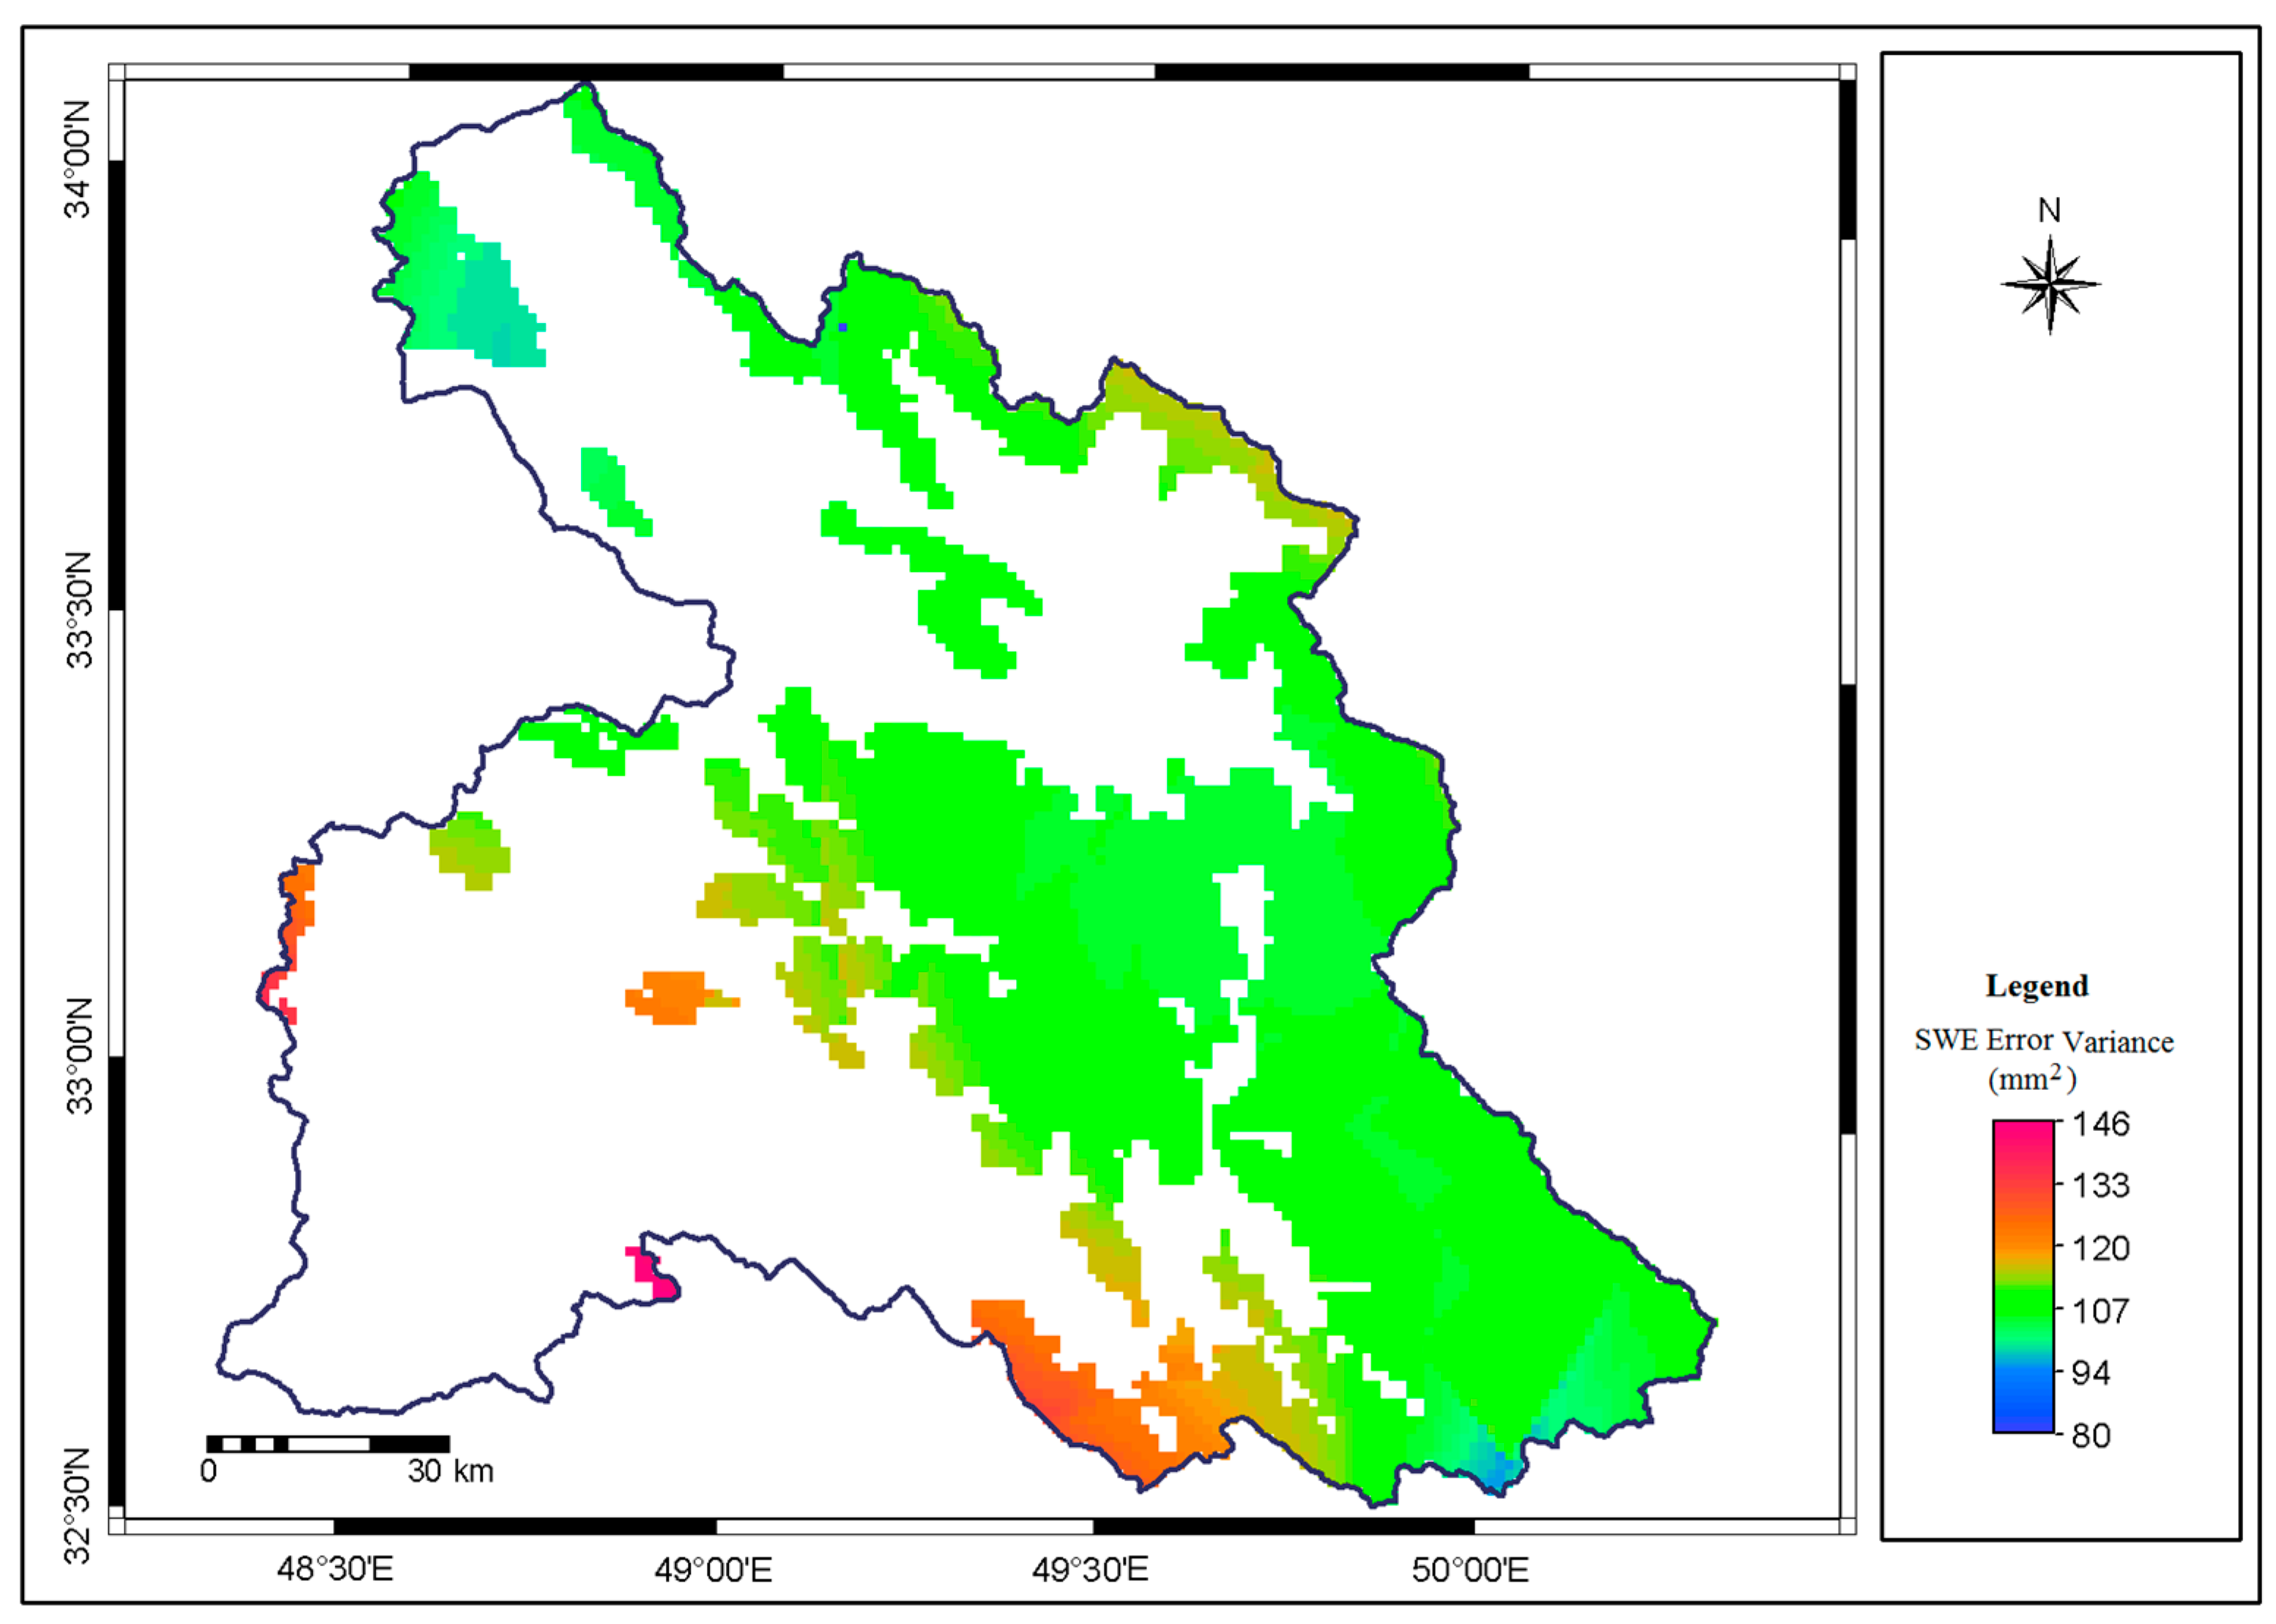
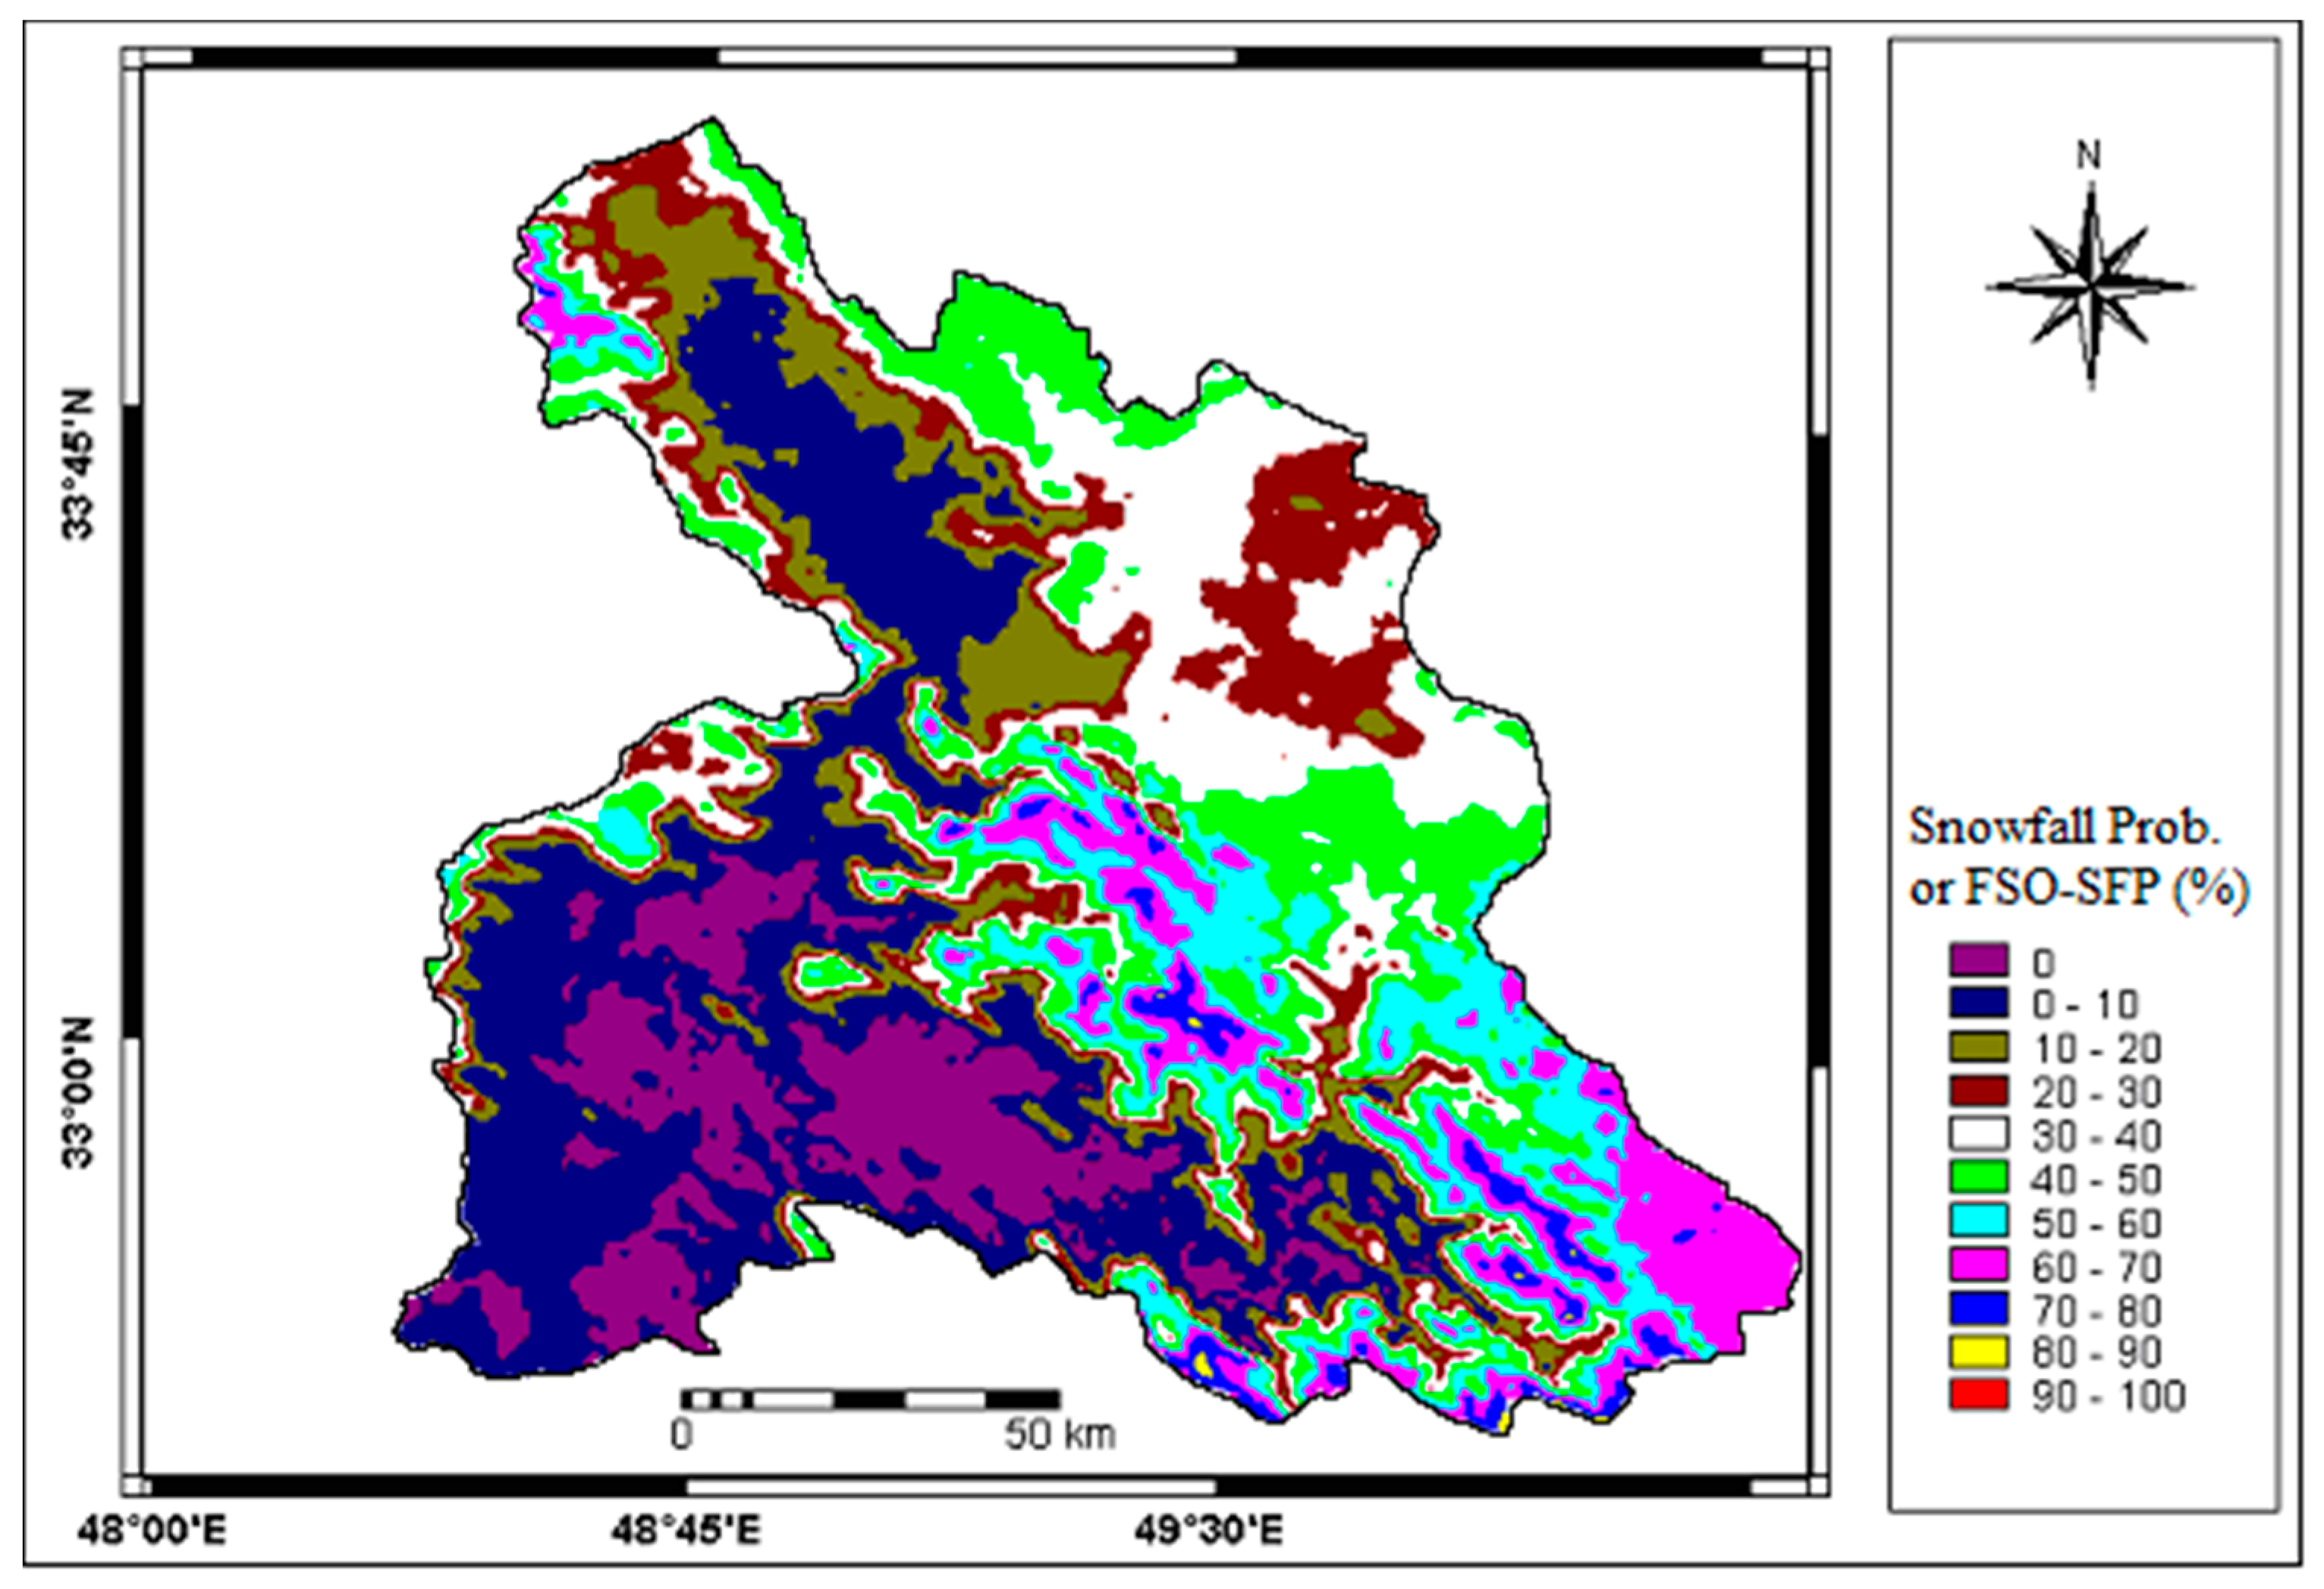
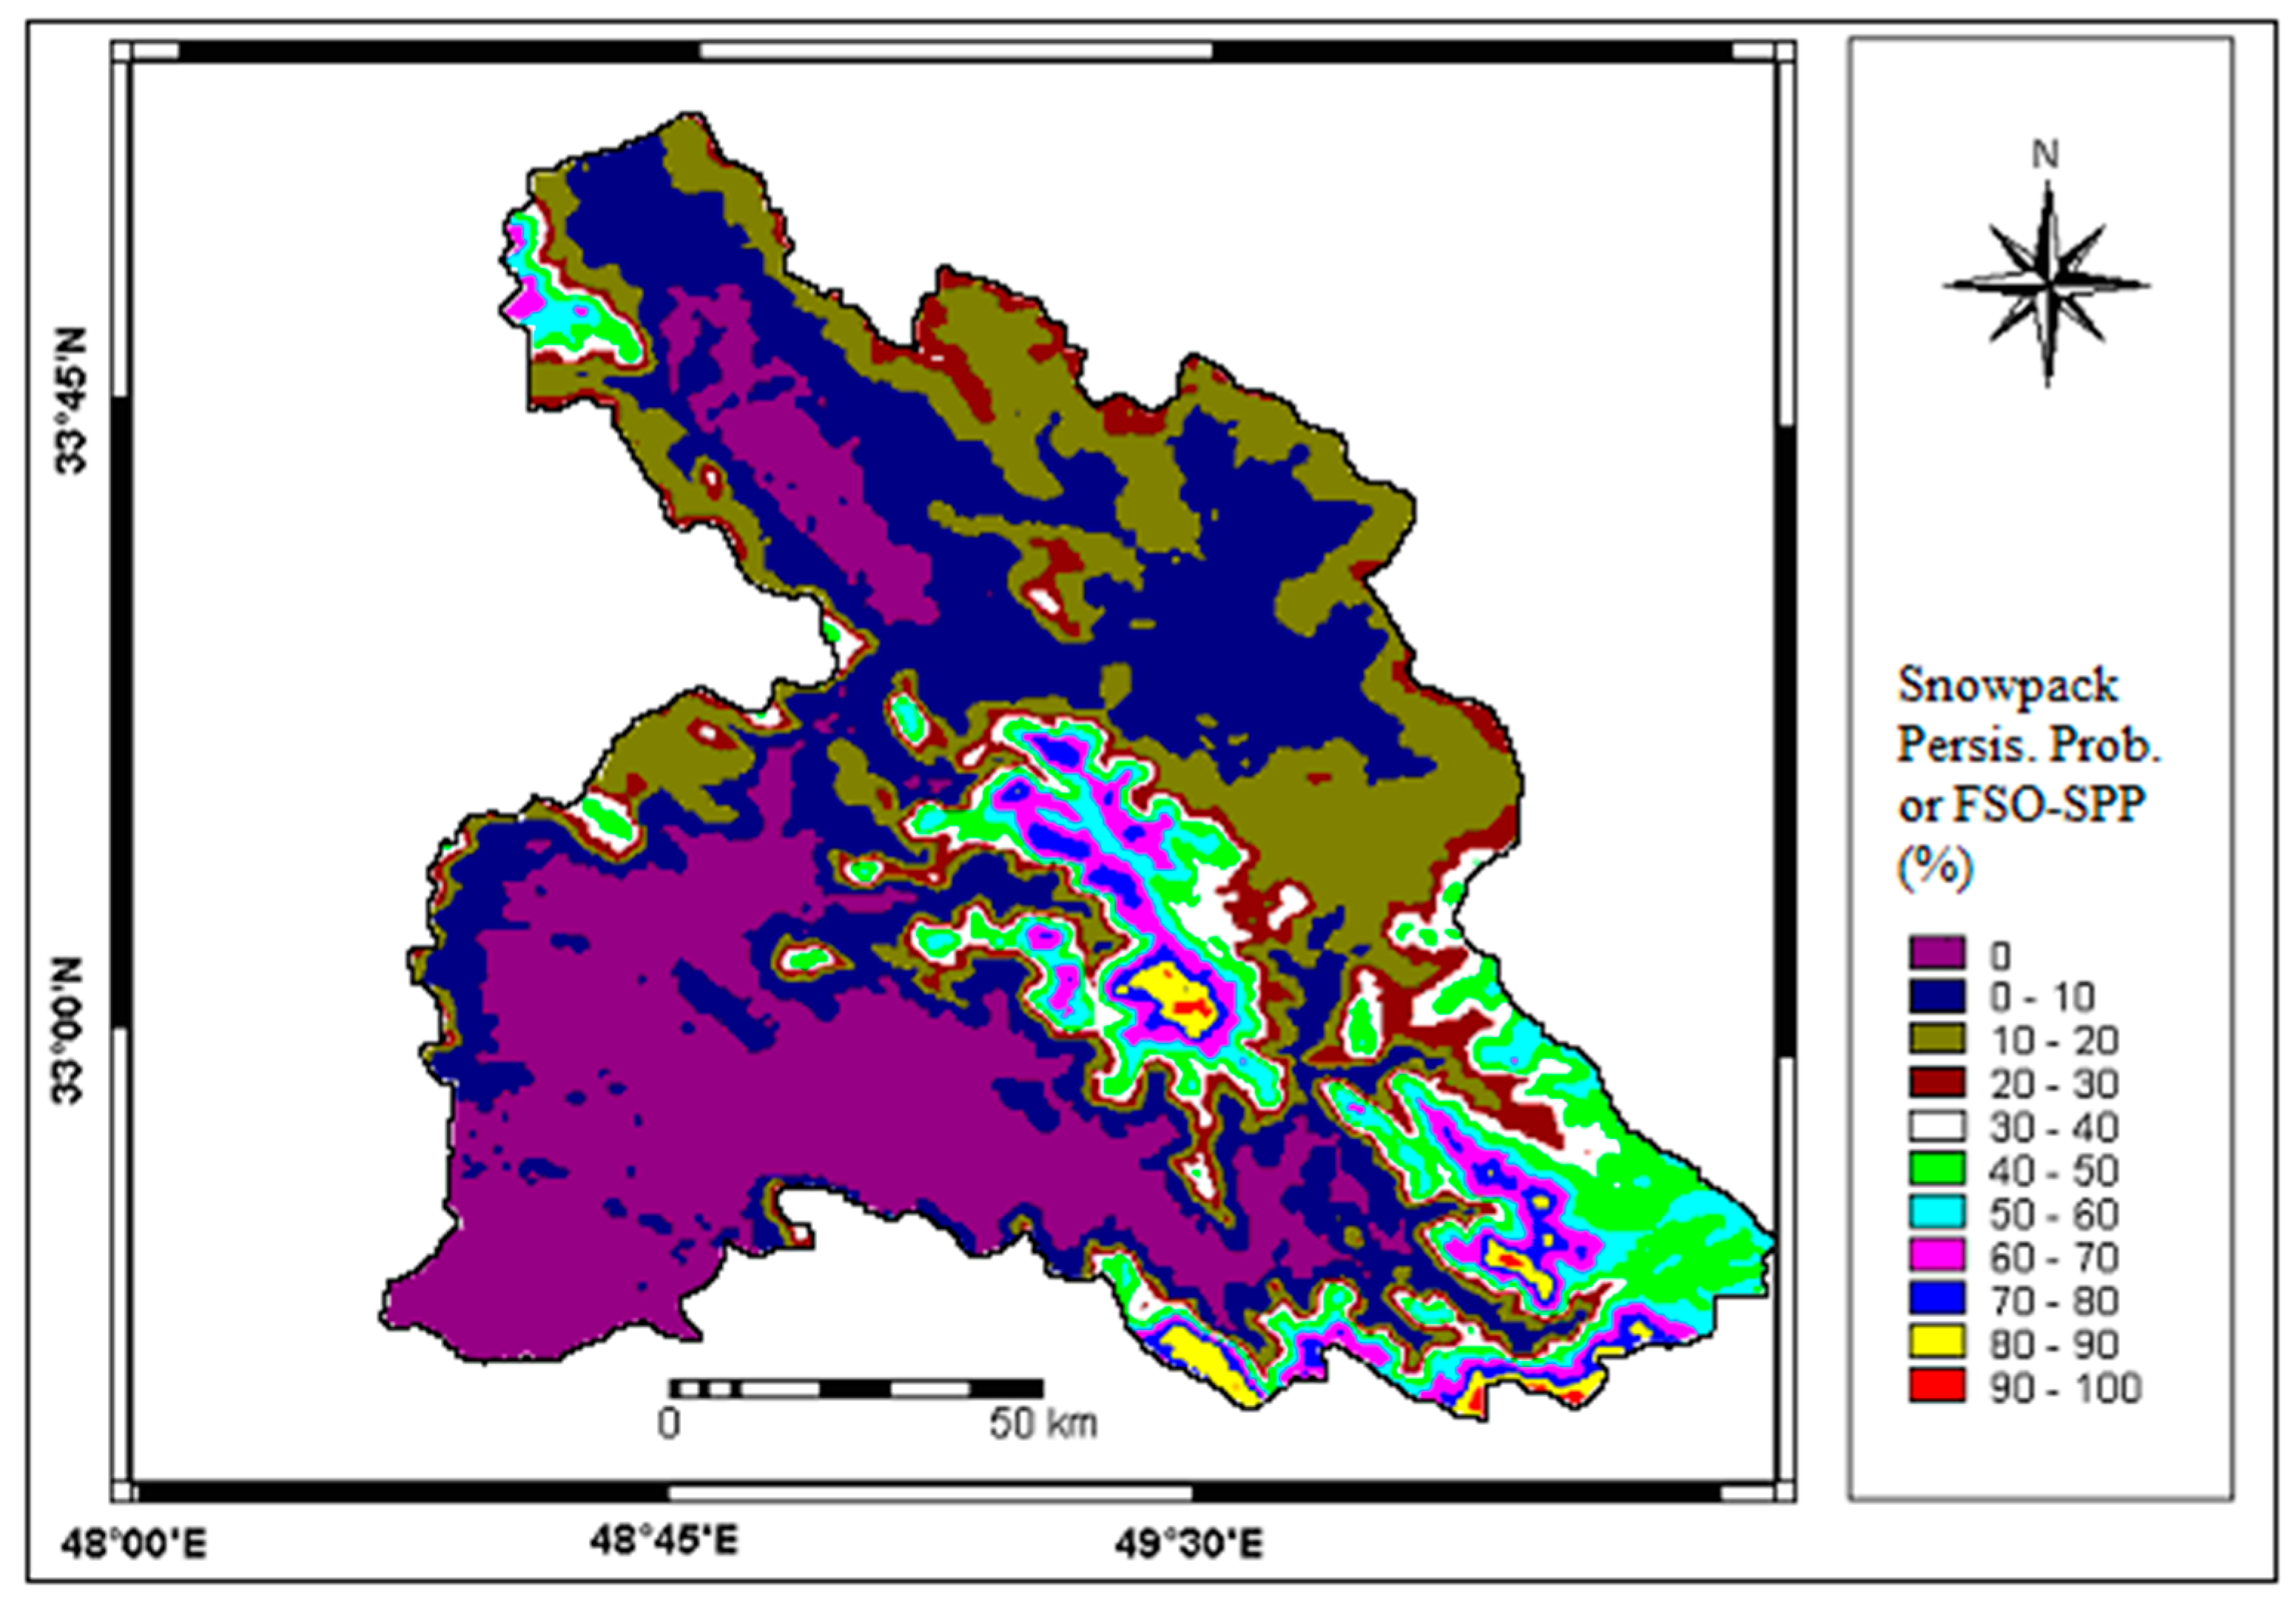
2.3.3. Remote Sensing Snow Observation Criteria
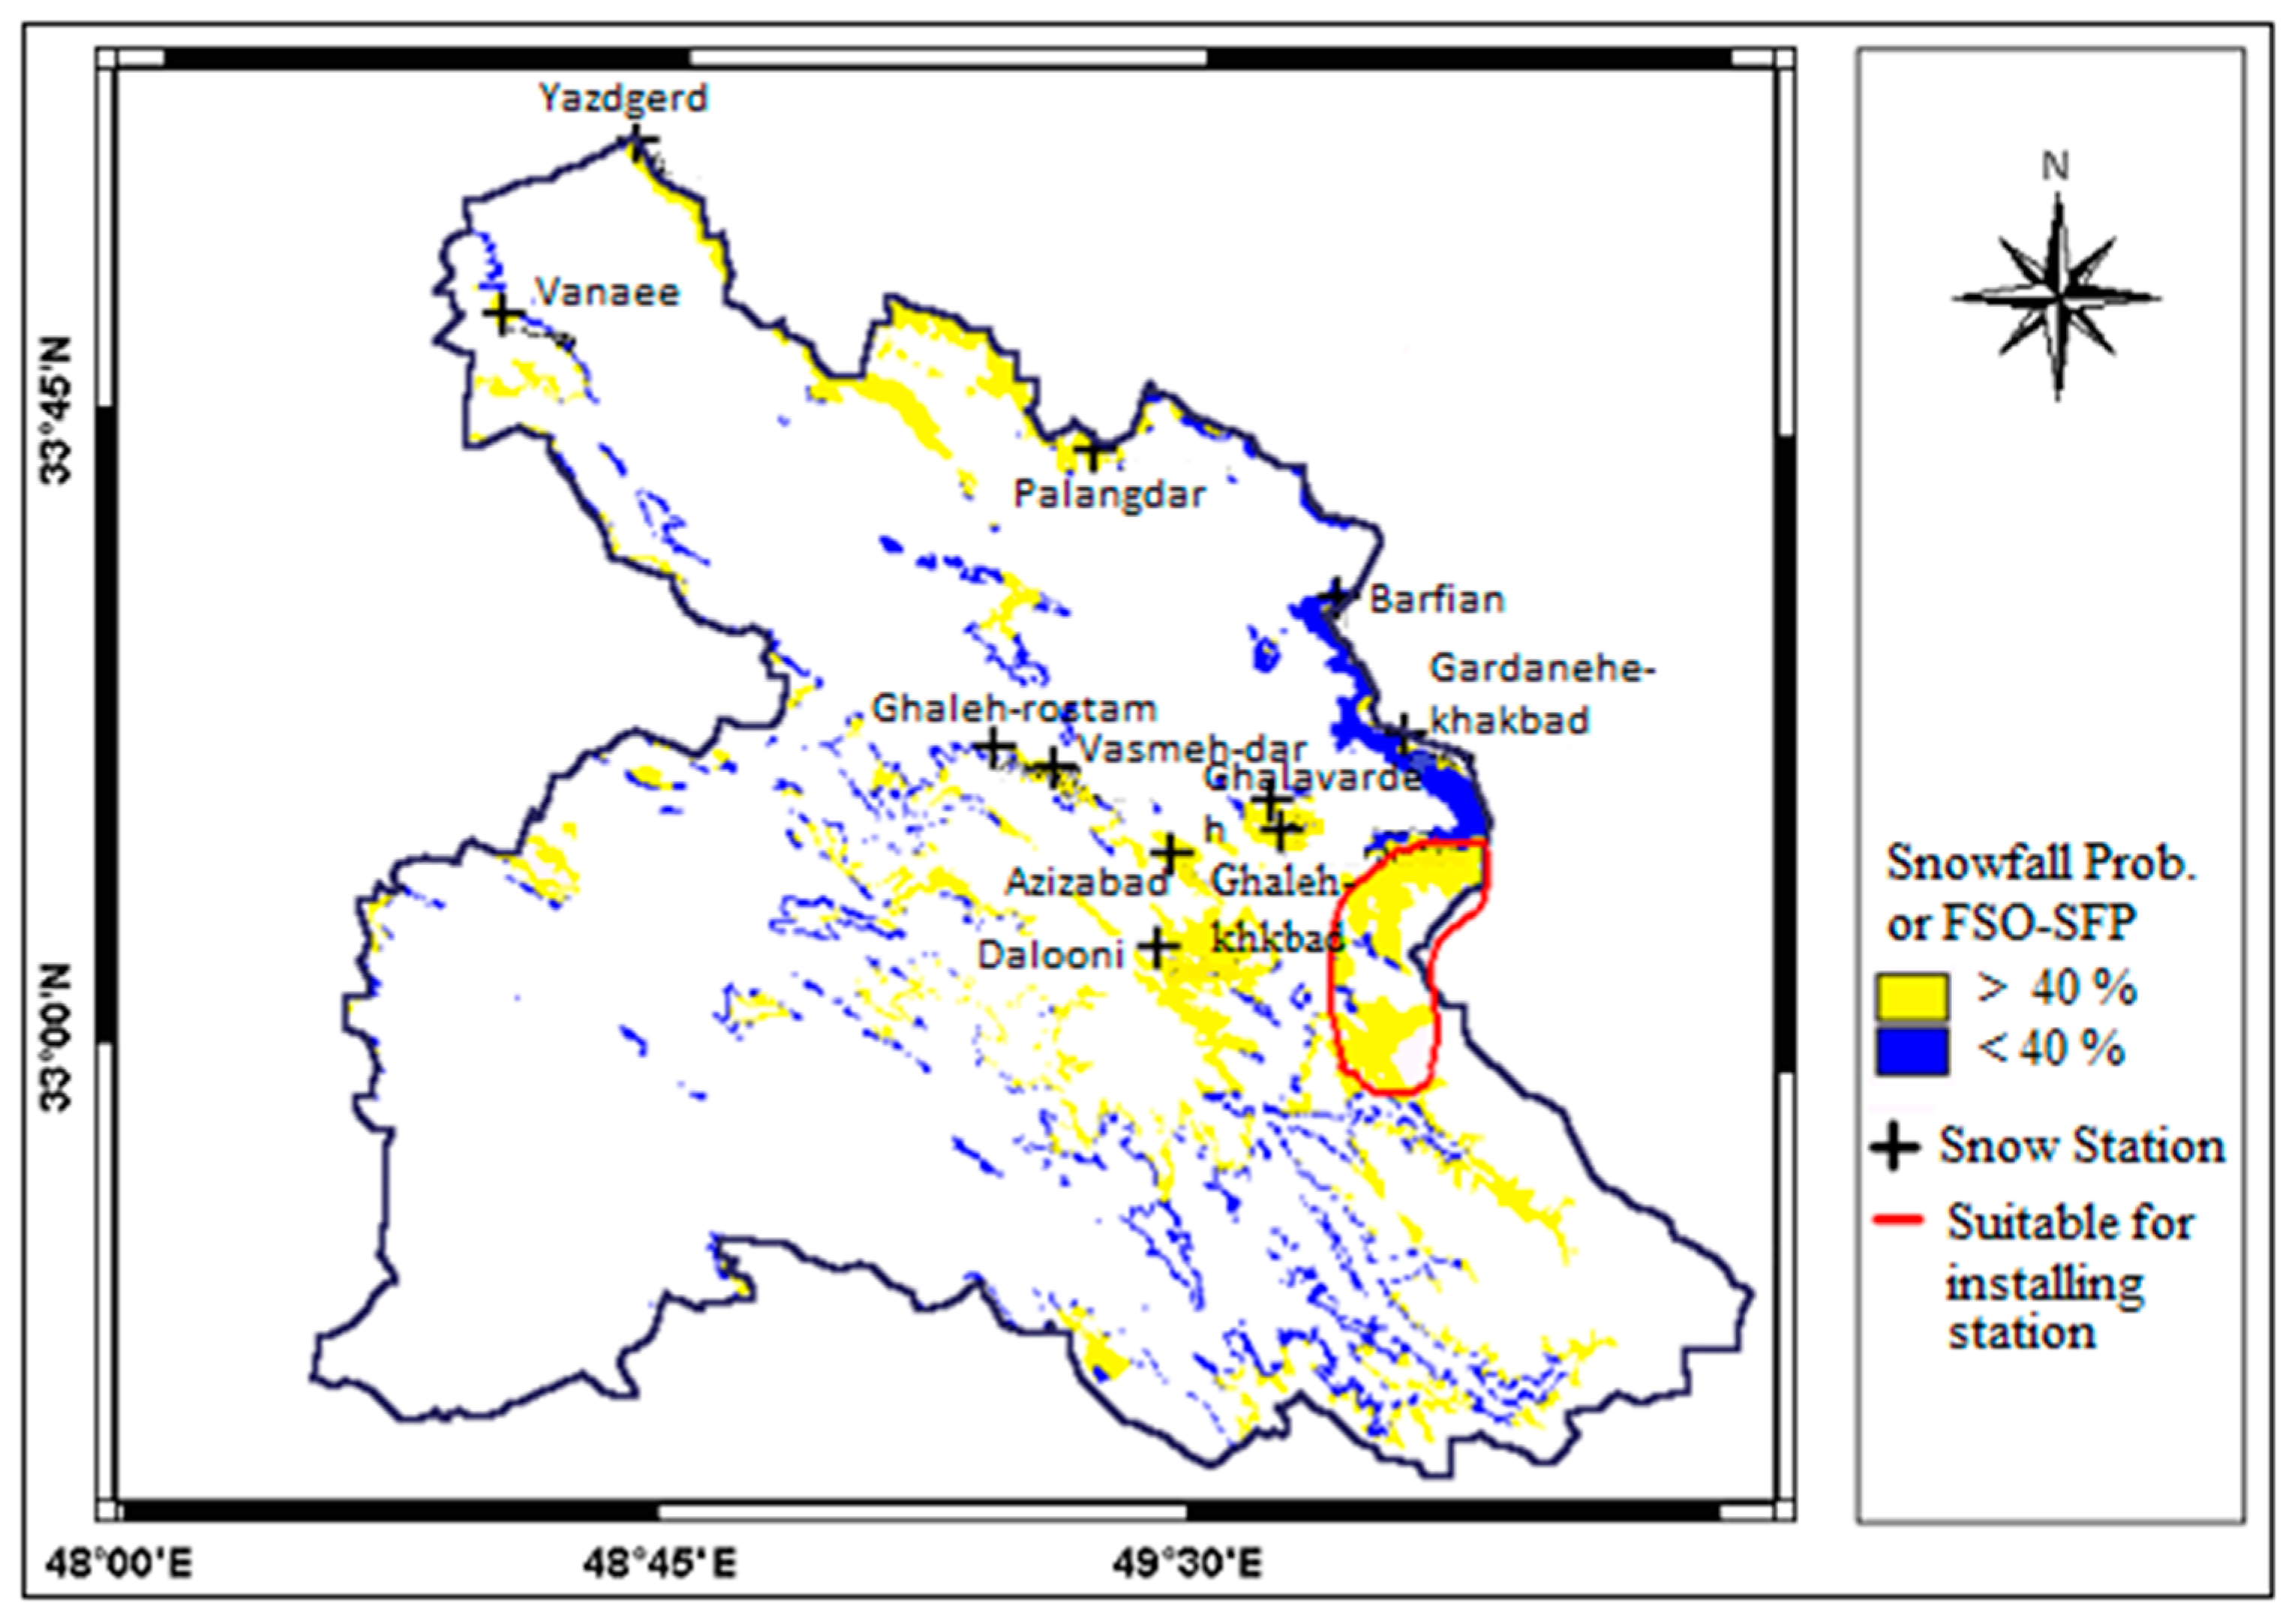
2.3.4. Synthesis of Criteria in Site Selection
3. Results
3.1. Classification of Regions Based on Meteorological Criteria
3.2. Hydrological Criteria
3.3. Snowfall and Snowpack Persistence Probability Criteria
3.4. Site Selection and Station Type
4. Conclusions
Acknowledgments
Author Contributions
Conflicts of Interest
References
- Iran Ministry of Energy (IRME). Karoun, Dez, Karkheh and Maroun River Basins Water Comprehensive Study—Second Study; Iran Ministry of Energy (IRME): Tehran, Iran, 2012.
- Gyawali, R.; Watkins, D.W. Continuous hydrologic modeling of snow-affected watersheds in the Great Lakes Basin using HEC-HMS. J. Hydrol. Eng. 2013, 18, 29–39. [Google Scholar] [CrossRef]
- Larson, L.W.; Peck, E.L. Accuracy of precipitation measurements for hydrologic modeling. Water Resour. Res. 1974, 10, 857–863. [Google Scholar] [CrossRef]
- World Meteorological Organization (WMO). Snow Cover Measurements and Areal Assessment of Precipitation and Soil Moisture; Operational Hydrological Report No. 35; World Meteorological Organization (WMO): Geneva, Switzerland, 1992. [Google Scholar]
- Quanta Consulting Engineering Co. Development and Modernization Plan of Iran Climatological Station; Iran Meteorological Organization Publication No. 1; Quanta: București, Romania, 1976. [Google Scholar]
- Molotch, N.P.; Bales, R.C. Scaling snow observations from the point to the grid element: Implications for observation network design. Water Resour. Res. 2005, 41. [Google Scholar] [CrossRef]
- Brown, R.D.; Walker, A.E.; Goodison, B. Seasonal snow cover monitoring in Canada. In Proceedings of the 57th Eastern Snow Conference, Syracuse, NY, USA, 17–19 May 2000.
- Bell, W.W.; Parmley, L.J.; Walk, H.; Afzal, H. Inflow forecasting for Pakistan’s major reservoirs. Int. Water Power Dam Constr. 1994, 46, 21–26. [Google Scholar]
- World Meteorological Organization (WMO). Guide to Hydrological Practices No. 168; World Meteorological Organization (WMO): Geneva, Switzerland, 1994. [Google Scholar]
- Davtalab, R.; Madani, K.; Massah, A.; Farajzadeh, M. Evaluating the Effects of Climate Change on Water Reliability in Iran’s Karkheh River Basin. In Proceedings of the World Environmental and Water Resources Congress 2014, Portland, OR, USA, 1–5 June 2014; pp. 2127–2135. [CrossRef]
- Ashraf Vaghefi, S.; Mousavi, S.J.; Abbaspour, K.C.; Srinivasan, R.; Yang, H. Analyses of the impact of climate change on water resources components, drought and wheat yield in semiarid regions: Karkheh River Basin in Iran. Hydrol. Process 2014, 28, 2018–2032. [Google Scholar] [CrossRef]
- Saghafian, B.; Davtalab, R. Mapping snow characteristics based on snow observation probability. Int. J. Climatol. 2007, 27, 1277–1286. [Google Scholar] [CrossRef]
- Jamab Consulting Engineering Co. Karoun, Dez, Karkheh and Maroun River Basins Water Comprehensive Study—First Study; Jamab Consulting Engineering Co.: Tehran, Iran, 1991. [Google Scholar]
- Porhemmat, J.; Saghafian, B.; Sedghi, H. An algorithm to mapping snow, cloud and land in NOAA AVHRR data, formulation, verification and evaluation. In Proceedings of the Fourth International Iran & Russia Conference, Shahrekord, Iran, 8–10 September 2004.
- Goovaerts, P. Geostatistics for Natural Resources Evaluation; Oxford University Press, Inc.: New York, NY, USA, 1997. [Google Scholar]
- Saghafian, B.; Davtalab, R.; Kafayati, M. Comparison of methods for determining the snowfall threshold temperature and potential area affected by snowfall in the Karkheh, Dez, Karun and Marun river basins. Iran Water Resour. Res. 2016, 10, 31–39. [Google Scholar]
- Fleming, M.; Neary, V. Continuous hydrologic modeling study with the hydrologic modeling system. J. Hydrol. Eng. 2004, 9, 175–183. [Google Scholar] [CrossRef]
- Garcia, A.; Sainz, A.; Revilla, J.A.; Alvarez, C.; Juanes, J.A.; Puente, A. Surface water resources assessment in scarcely gauged basins in the north of Spain. J. Hydrol. 2008, 356, 312–326. [Google Scholar] [CrossRef]
- Saghafian, B.; Bondarabadi, S. Validity of Regional Rainfall Spatial Distribution Methods in Mountainous Areas. J. Hydrol. Eng. 2008, 13, 531–540. [Google Scholar] [CrossRef]
- Severino, E.; Alpuim, T. Spatiotemporal models in the estimation of area precipitation. Environmetrics 2005, 16, 773–802. [Google Scholar] [CrossRef]
- Rango, A.; Martinec, J. Snow accumulation derived from modified depletion curves of snow coverage. In Proceedings of the Exeter Symposium on Hydrological Aspects of Alpine and High Mountain Areas, Exeter, UK, 19–30 July 1982; IAHS Publ. No. 138. IAHS Press: Wallingford, UK, 1982; pp. 83–90. [Google Scholar]
- Ghanbarpour, M.R.; Saghafian, B.; Saravi, M.M.; Abbaspour, K. Evaluation of spatial and temporal variability of snow cover in a large mountainous basin in Iran. Nord. Hydrol. 2007, 38, 45–58. [Google Scholar] [CrossRef]
- Simpson, J.J.; Stitt, J.R.; Sienko, M. Improved Estimates of the Areal Extent of Snow Cover from AVHRR Data. J. Hydrol. 1998, 204, 1–23. [Google Scholar] [CrossRef]
- Martinec, J. The degree day factor for snowmelt runoff forecasting. In Proceedings of the IUGG General Assembly of Helsinki, IAHS Commission of Surface Waters, Helsinki, Finland, 25 July–6 August 1960; IAHS Publ. No. 51. IAHS Press: Wallingford, UK, 1960; pp. 468–477. [Google Scholar]
- Akyurek, Z.; Sorman, A.U. Monitoring snow-covered areas using NOAA-AVHRR data in the eastern part of Turkey. Hydrol. Sci. J. 2002, 47, 243–252. [Google Scholar] [CrossRef]
- World Meteorological Organization (WMO). The Planning of Meteorological Station Networks; Technical Note No. 111; World Meteorological Organization (WMO): Geneva, Switzerland, 1970. [Google Scholar]
- Moss, M.E. Concepts and Techniques in Hydrological Network Design; Operational Hydrology Report No. 19; World Meteorological Organization: Geneva, Switzerland, 1982. [Google Scholar]


| Sub-Basin | Snowmelt Runoff (mm) | Priority |
|---|---|---|
| Upstream of Tang Sezar | 4.7 | 7 |
| Upstream of Sepidan | 12.4 | 6 |
| Upstream of Sezar | 44.7 | 2 |
| Upstream of Tang Bakhtiari | 42.5 | 3 |
| Upstream of Zard Fahreh | 84.2 | 1 |
| Upstream of Daretakht | 25.5 | 4 |
| Upstream of Doroud | 22.7 | 5 |
| MSC Station | Elevation (m) | FSO-SFP (%) | FSO-SPP (%) |
|---|---|---|---|
| Vanaee | 2250 | 42 | 30 |
| Ghalavardeh2 | 2300 | 44 | 17 |
| Vazmeh-dar | 2300 | 48 | 32 |
| Ghaleh-rostam | 2300 | 32 | 10 |
| Aziz-abad | 2300 | 46 | 20 |
| Barfian | 2350 | 38 | 20 |
| Yazdgerd | 2500 | 44 | 25 |
| Palang-dar2 | 2400 | 46 | 26 |
| Dalooni | 2500 | 57 | 38 |
| Chahar-cheshmeh2 | 2400 | 46 | 18 |
| Gardanehe-khakbad | 2450 | 39 | 27 |
© 2016 by the authors; licensee MDPI, Basel, Switzerland. This article is an open access article distributed under the terms and conditions of the Creative Commons Attribution (CC-BY) license (http://creativecommons.org/licenses/by/4.0/).
Share and Cite
Saghafian, B.; Davtalab, R.; Rafieeinasab, A.; Ghanbarpour, M.R. An Integrated Approach for Site Selection of Snow Measurement Stations. Water 2016, 8, 539. https://doi.org/10.3390/w8110539
Saghafian B, Davtalab R, Rafieeinasab A, Ghanbarpour MR. An Integrated Approach for Site Selection of Snow Measurement Stations. Water. 2016; 8(11):539. https://doi.org/10.3390/w8110539
Chicago/Turabian StyleSaghafian, Bahram, Rahman Davtalab, Arezoo Rafieeinasab, and M. Reza Ghanbarpour. 2016. "An Integrated Approach for Site Selection of Snow Measurement Stations" Water 8, no. 11: 539. https://doi.org/10.3390/w8110539