Article

Environmental Groundwater Vulnerability Assessment in Urban Water Mines (Porto, NW Portugal)

1
Laboratory of Cartography and Applied Geology (LABCARGA), Geotechnical Engineering Department, School of Engineering (ISEP), Polytechnic of Porto, 4200-072 Porto, Portugal
2
Centre GeoBioTec (Georesources, Geotechnics, Geomaterials Research Group), University of Aveiro, 3810-193 Aveiro, Portugal
3
Laboratory of Natural Radioactivity, Earth Sciences Department, Faculty of Sciences, University of Coimbra, 3030-790 Coimbra, Portugal
4
CIIMAR/CIMAR-LA—Interdisciplinary Centre of Marine and Environmental Research, University of Porto, 4050-123 Porto, Portugal
5
CIIMAR/CIMAR-LA, Laboratory of Ecotoxicology and Ecology, University of Porto, 4050-123 Porto, Portugal
6
ICBAS-Institute of Biomedical Sciences of Abel Salazar, Department of Populations Studies, Laboratory of Ecotoxicology, University of Porto, 4050-313 Porto, Portugal
7
Department of Geoscience, University of Calgary, Calgary, AB T2N 1N4, Canada
8
CERENA, Instituto Superior Técnico, University of Lisbon, 1049-001 Lisbon, Portugal
*
Author to whom correspondence should be addressed.
Water 2016, 8(11), 499; https://doi.org/10.3390/w8110499
Submission received: 23 April 2016 / Revised: 18 October 2016 / Accepted: 25 October 2016 / Published: 3 November 2016
(This article belongs to the Special Issue Groundwater Monitoring and Remediation)

Abstract

:
A multidisciplinary approach was developed to estimate urban groundwater vulnerability to contamination combining hydrogeology, hydrogeochemistry, subterranean hydrogeotechnics, groundwater ecotoxicology and isotope tracers. Paranhos and Salgueiros spring waters in Porto City were used as a case study. Historical and current vulnerability scenarios were compared using hydrogeological GIS-based modelling. Potential contamination sources were mapped around the spring galleries. Most of these were point sources and their potential contamination load was moderate. The ecotoxicological assessment indicated a low acute toxicity potential. Groundwater radionuclides appeared to be mainly controlled by geological factors and biomineralisation. Vulnerability maps suggest that most of the area has a moderate to low vulnerability to contamination. However, some surface sources such as sewage systems cause contamination and contribute to increased vulnerability. This integrated approach was demonstrated to be adequate for a better knowledge of urban hydrogeological processes and their dynamics, and highlighted the importance of a vulnerability assessment in urban areas.

1. Introduction

Groundwater is of greatest importance for the water supply to many urban areas, including major cities all over the world (e.g., [1,2,3]). The growing demand for water has led to an increasing appreciation for the earth’s vast groundwater supplies. Aquifers are not just sources of water supply, but also vast storage facilities that give us great management flexibility of groundwater resources at a relatively affordable cost [4,5]. Moreover, it is of vital importance that groundwater of impaired quality remains an economically useful source, particularly well-suited for non-potable purposes, e.g., irrigation of parks, lawns and golf courses, street cleaning, firefighting, and toilet flushing [4,6,7].
Although a consistent and widely accepted definition of vulnerability is missing, groundwater vulnerability can be formulated as an intrinsic relative, dimensionless property of a groundwater system that depends on its sensitivity to detrimental human and/or natural impacts. This means that groundwater vulnerability is not only a function of hydrogeological factors (e.g., aquifer characteristics, ground properties and unsaturated zone lithology), but also human activities (e.g., [8,9,10,11,12]).
Vulnerability maps are used for groundwater protection planning, management and decision making, for identification of areas susceptible to contamination and for public information and education [11]. Moreover, using groundwater age to map vulnerability maps is important, since the older the groundwater, the less chance for it to become anthropologically contaminated [13]. Additionally, understanding of groundwater age and residence time processes in urban areas could help in managing groundwater quality [14].
Such groundwater vulnerability assessment is an important basis in order to comply with the European Union (EU) Water Framework Directive (WFD) 2000/60/EC, the EU Groundwater Directive 2006/118/EC and especially the EU WFD–Common Implementation Strategy (EC-Directorate General for the Environment 2008). Integrated water resources management (IWRM) is a process that promotes the co-ordinated development and management of water, land, and related resources to maximize the resultant economic and social benefit in an equitable manner without compromising the sustainability of vital ecosystems (e.g., [5,15,16]). The IWRM concept has been a key topic of discussion over the past decade. The recognition that, for the best environmental outcomes, water should be managed holistically rather than in compartments is widely recognised ([17], and references therein) but IWRM poses not only scientific, but also technical, socio-economic, cultural and ethical challenges. To effectively take advantage of the valuable information resulting from groundwater vulnerability assessments, it is helpful to consider some broad approaches for water management (e.g., [18,19]). Groundwater vulnerability assessment must be interrelated with and integrated into urban master plans to support the planning, policy and strategy of groundwater resources protection and quality conservation [20,21,22,23,24]. Moreover, these contexts are increasingly common in view of the widespread mitigation efforts and the need to achieve a good environmental status of water masses under the Water Framework Directive.
This work presents the results of a comparative study relating to the application of intrinsic vulnerability mapping methods (e.g., AVI, GODS, DRASTIC, DRASTIC-Fm and SINTACS) in a pilot site situated in Porto city (NW Portugal). The aim was to develop an approach to establish a suitable framework for fissured media against which urban groundwater could be assessed. This evaluation of groundwater vulnerability to contamination took advantage of GIS-based mapping for water resources management purposes. Specific objectives of this work were:
(i)
Understand the evolution of vulnerability to groundwater contamination in Porto city spring waters throughout the last century in a hydrogeo-historical perspective. In addition, to compare several vulnerability methods using different parameters in order to estimate their efficiency in this case study and to be able to generalize this vulnerability assessment for other urban groundwater scenarios;
(ii)
Check the role in an integrated approach for surface and subsurface potential contamination sources and groundwater isotopic data on the validation of vulnerability to contamination;
(iii)
Develop a seasonal ecotoxicological characterisation of the groundwater, for hazard assessment and compliance with EU Groundwater Directive 2006/118/EC;
(iv)
Illustrate the importance of groundwater studies as a key-issue to tackle in large urban areas and also to contribute to the development of urban hydrogeology conceptual models.

2. Porto Urban Area: Paranhos and Salgueiros Spring Waters

Porto city is one of the oldest cities in Europe and is the heart of Portugal’s second biggest metropolitan area (1,286,139 inhabitants). Its history dates back at least to the 6th century and it became an important conurbation in the 12th century [25]. The Douro River marks the border between this city and Vila Nova de Gaia located to the south. Both municipalities have been developed on the granitic hill slopes, near to the terminal part of the Douro River mouth reaching the Atlantic Ocean. Porto city has a relatively small area (41.3 km2) and its current population is 237,559 inhabitants, which gives this area the highest population density (ca. 5750 inhabitants/km2) of any of the surrounding cities.
The regional hydrogeological units underneath Porto city and its surrounding area correspond to [26,27,28]: (i) a sedimentary cover of porous media with connectivity to the drainage system, including alluvia and other fluvial and marine deposits, comprised of sandy, gravely, silty and clayey sediments. These deposits are generally of limited extent and most of them are less than 6 m thick [29], representing shallow aquifers of minor significance; (ii) metasedimentary rocks encompassing micaschists, phyllites and metagreywackes; and (iii) granitoid rocks comprising granites and gneisses. Crystalline rocks constitute a fissured medium with a potential connectivity to the drainage system. Among these fractured formations, granitic rocks dominate the study region, particularly the two-mica, medium to fine grained facies, the so-called “Porto granite” (e.g., [30,31,32,33,34,35]). This granitic bedrock displays thin crushed quartz veins and is evansite enriched, especially in interlocking rock joints and faults fillings [36,37] and is, generally, weathered to different grades, from fresh-rock to residual soil over short distances. These variable weathering fronts result in arenisation and kaolinisation, which may reach depths of more than 30 m [38]. The granitic vertical profile involves different hydrogeological compartments, the weathered surface (alterites), the weathered-fissured zone and the unweathered fracture zone.
The water supply of Porto city was, for more than six centuries, provided by fountains supplied by numerous springs (e.g., [6,7,28,39,40,41,42]). By the end of the 18th century, Paranhos and Salgueiros spring waters were among the most important water supply sources in quantitative and qualitative terms. Throughout the centuries, several underground galleries were excavated on fissured granitic rock masses to capture the water of these springs and to protect it from contamination. Paranhos and Salgueiros spring waters are shallow groundwaters with quick responses to precipitation events [6]. The primary gallery, transporting Paranhos and Salgueiros waters is 3.2 km long at a maximum depth of 20 m below ground level.

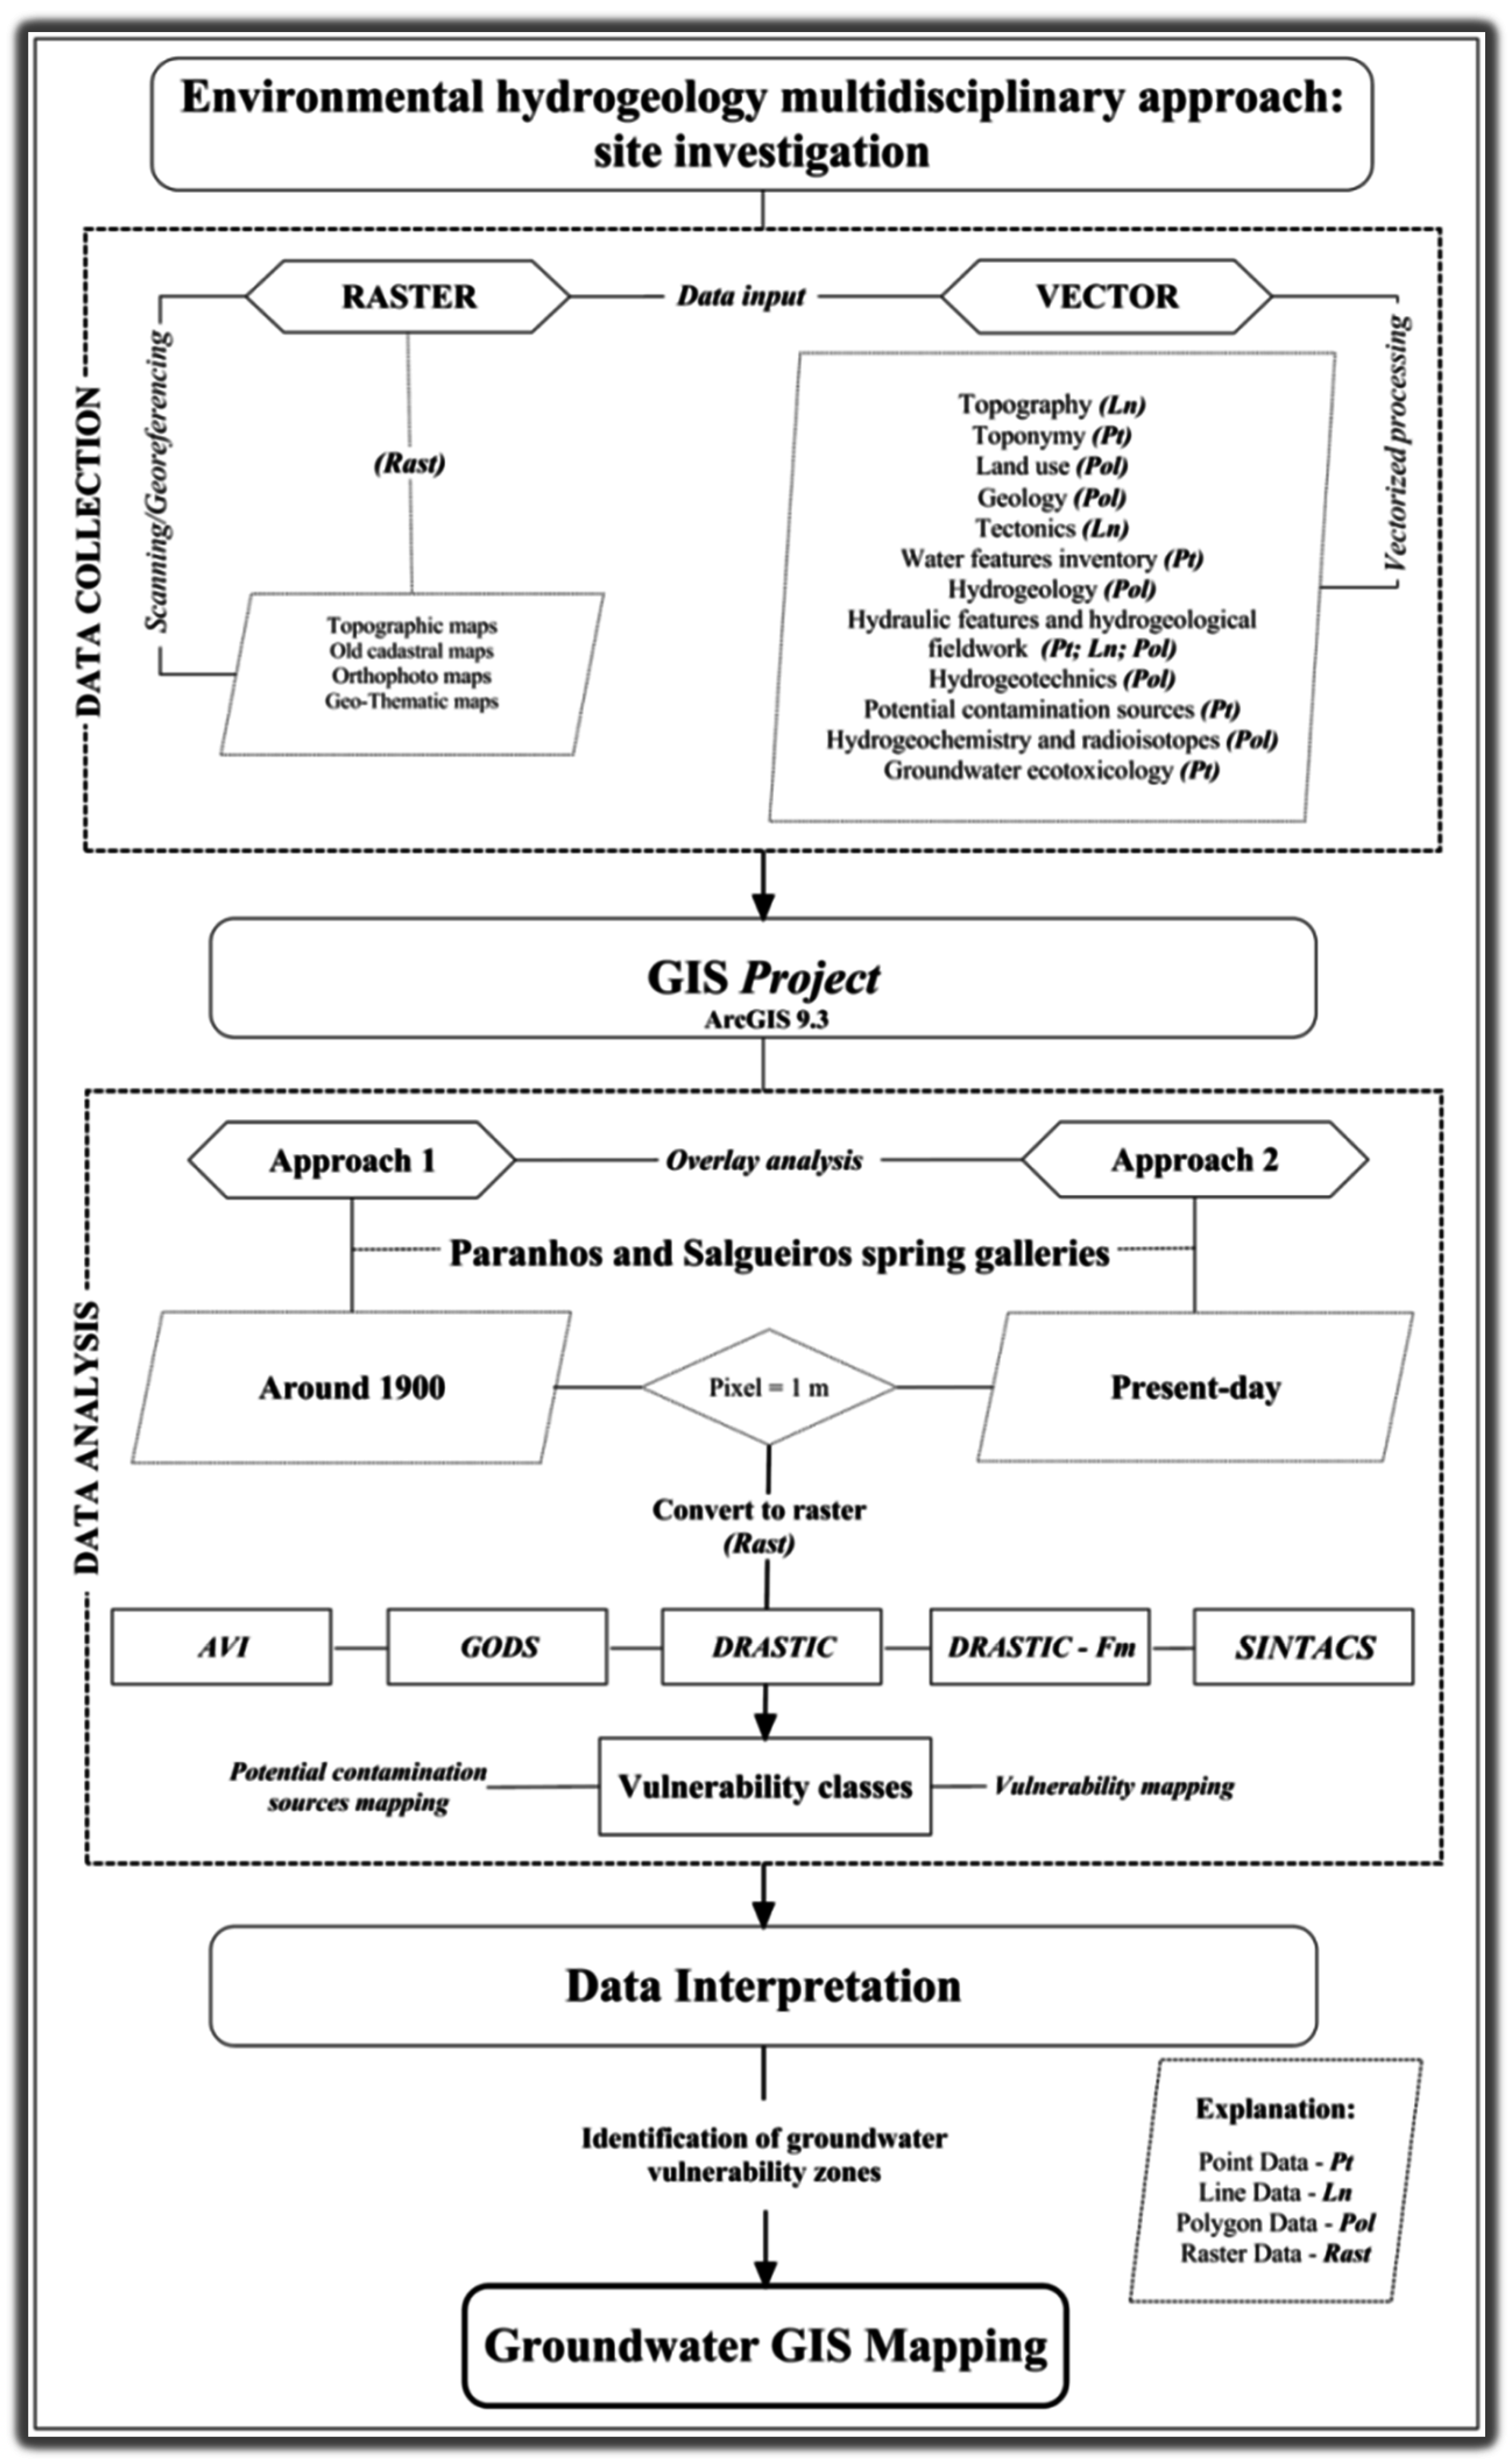
3. Materials and Methods

To assess the vulnerability of Paranhos and Salgueiros spring waters to contamination, a holistic environmental hydrogeology approach was employed. Several vulnerability assessment methods were used on a GIS environment. This methodology took advantage of multiple data sources including land use, and geologic, hydrogeologic, hydrogeotechnic, hydrogeochemical, isotopic and ecotoxicological data. GIS was used to produce an interactive geo-database, assess the spatial distribution of the data, compute the AVI, GODS, DRASTIC, DRASTIC-Fm and SINTACS indexes, and finally to generate the vulnerability maps (Figure 1).

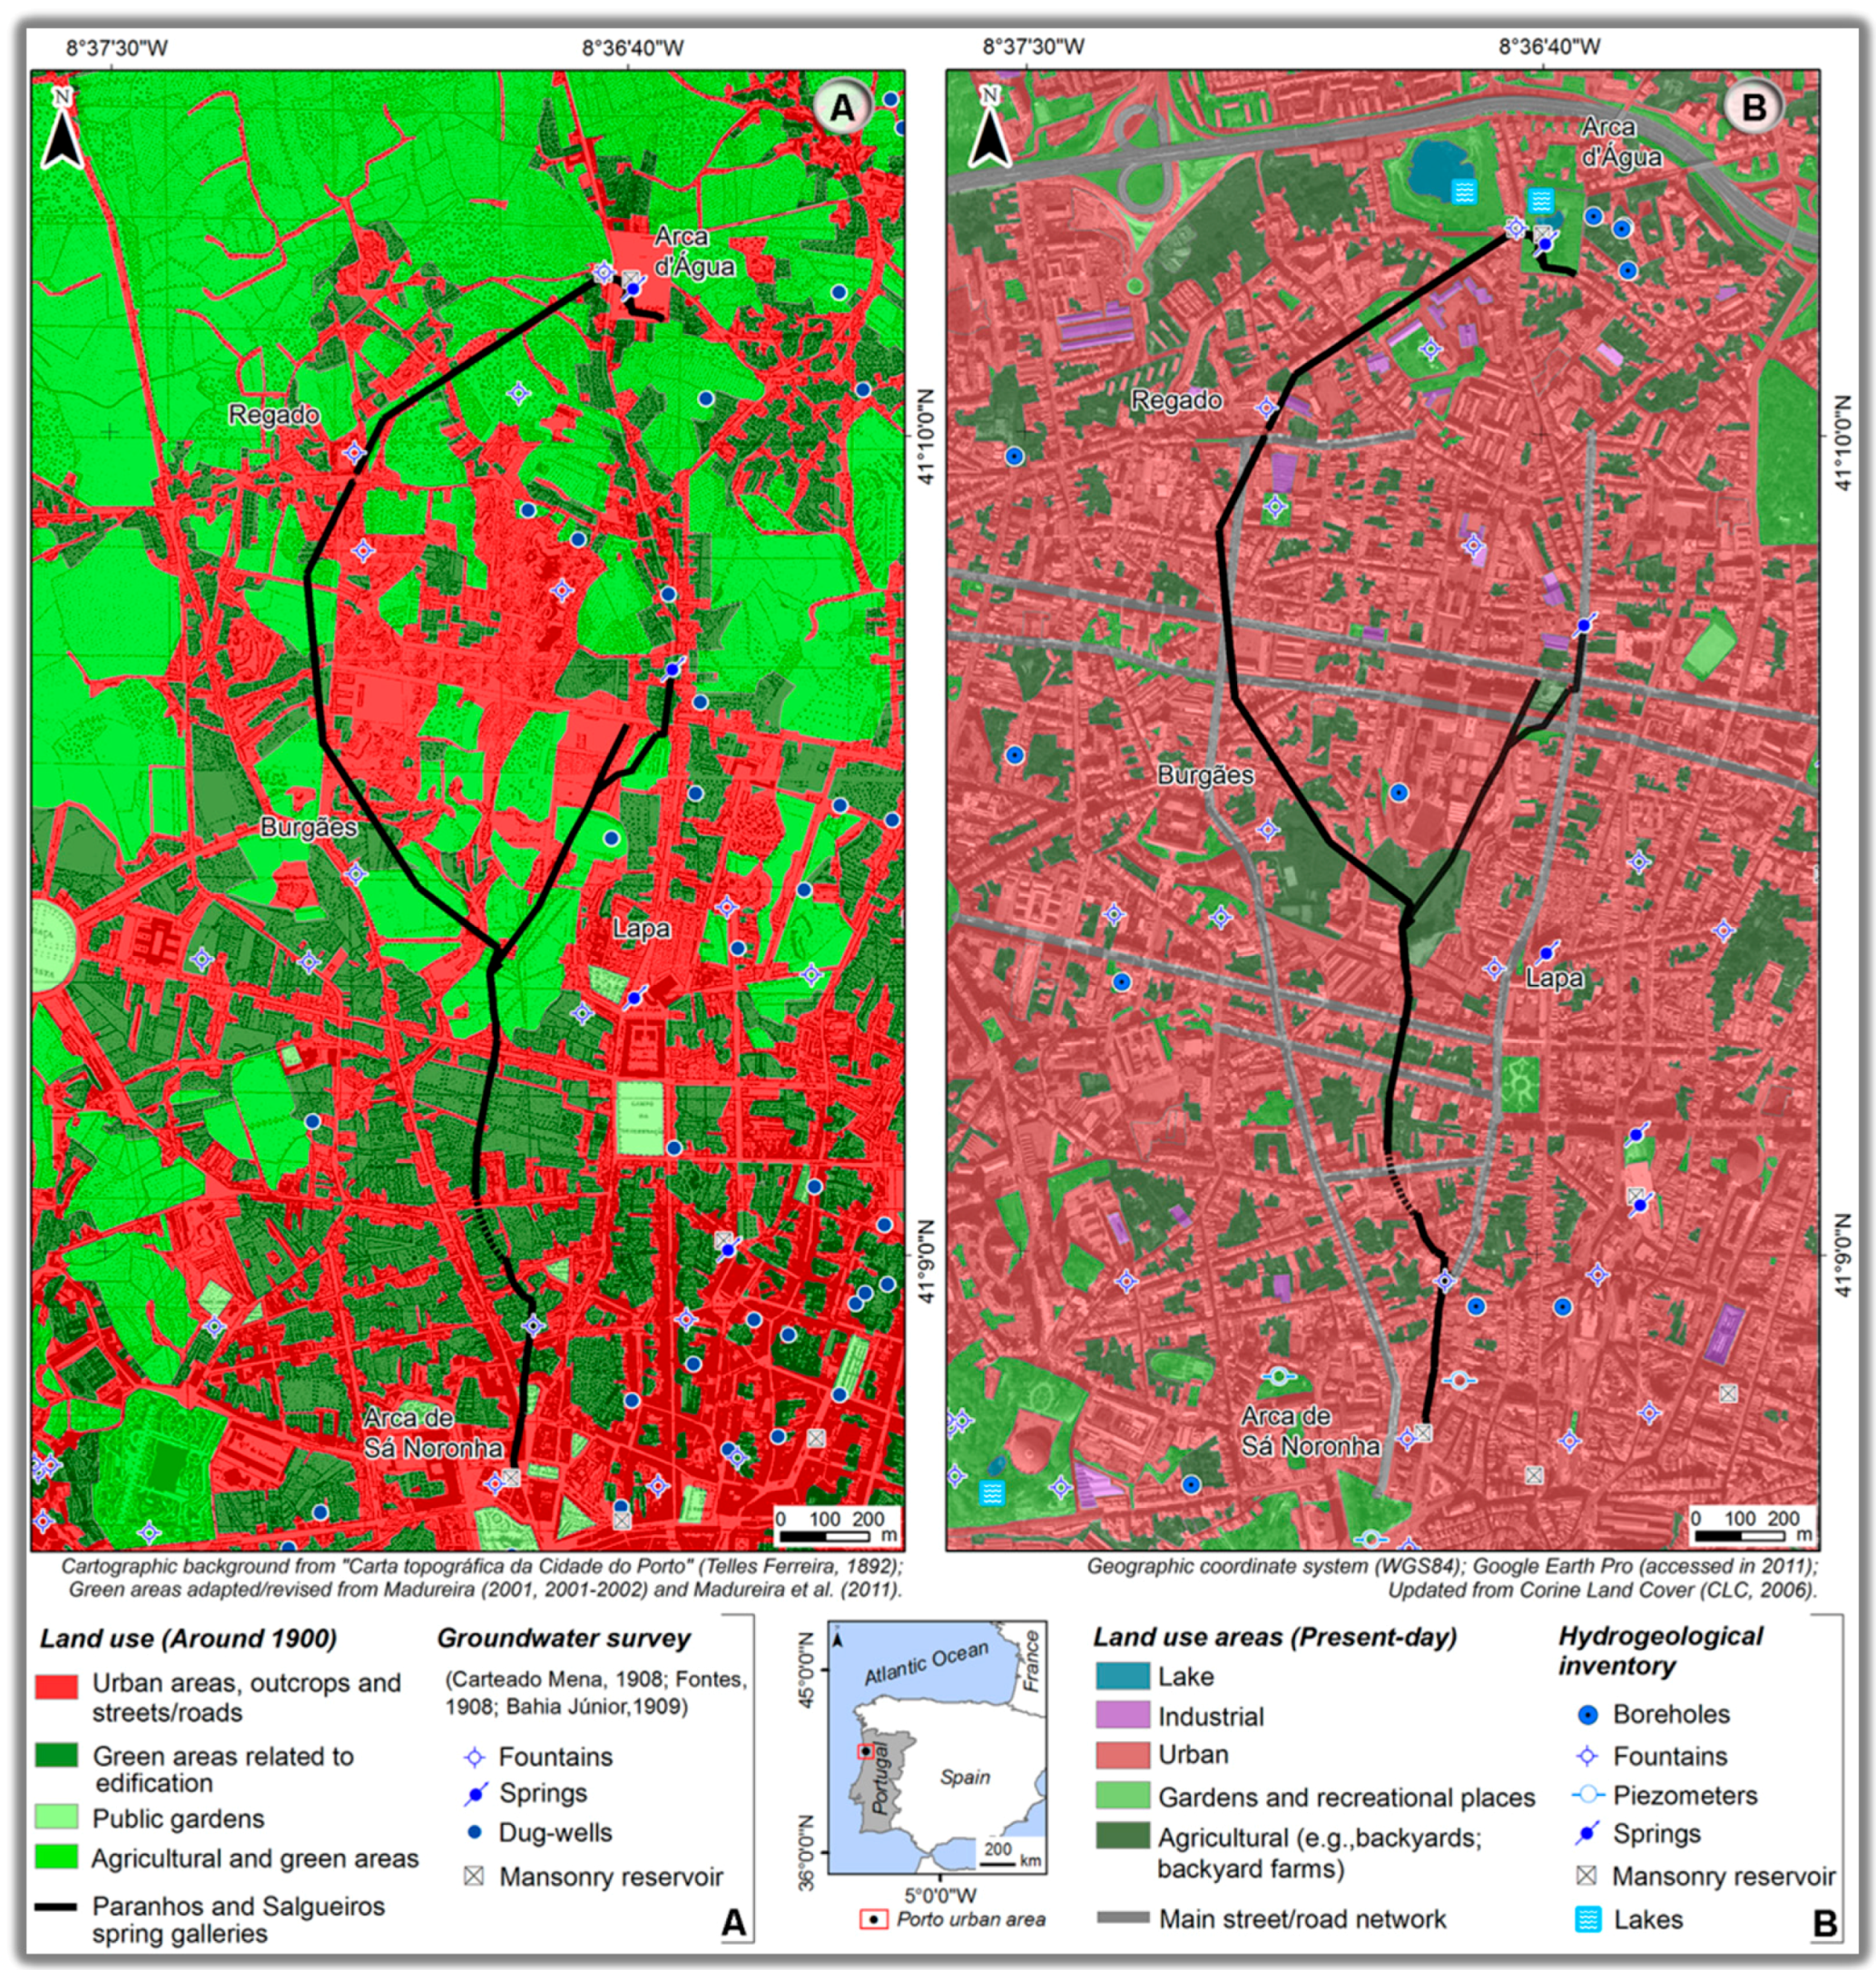
3.1. Land Use Mapping and Inventory of Water Features

Land use areas were mapped according to the categories established by European guidelines [43], in order to understand the evolution of land cover since the end of the 19th century and to assess its contribution to groundwater vulnerability. To assess the land use areas since the late 19th century, old cadastral maps such as the topographic map of Porto (1:2500 scale) by [44] were used; green areas were cross-checked and updated from [45,46]. To evaluate the present-day land cover, orthophoto maps (1:5000 scale) and Google Earth Pro imagery were used.

3.2. Geodata Information Sources

For hydrogeological mapping and the hydrogeotechnical zoning map, surface and underground geological fieldwork were first carried out to map litho-structural heterogeneities and to identify major geostructures responsible for groundwater circulation paths, following the suggestions by [47,48,49,50]. Subsequently, the obtained geodata were integrated including: ground slope, lithology of the vadose zone, soil and aquifer materials, weathering grade, depth to groundwater, net recharge and hydraulic conductivity. These data were collected or determined by means of local topographic cartography, geotechnical and hydrogeological boreholes, dug-wells, piezometers, permeability and pumping tests, and hydrologic balances.

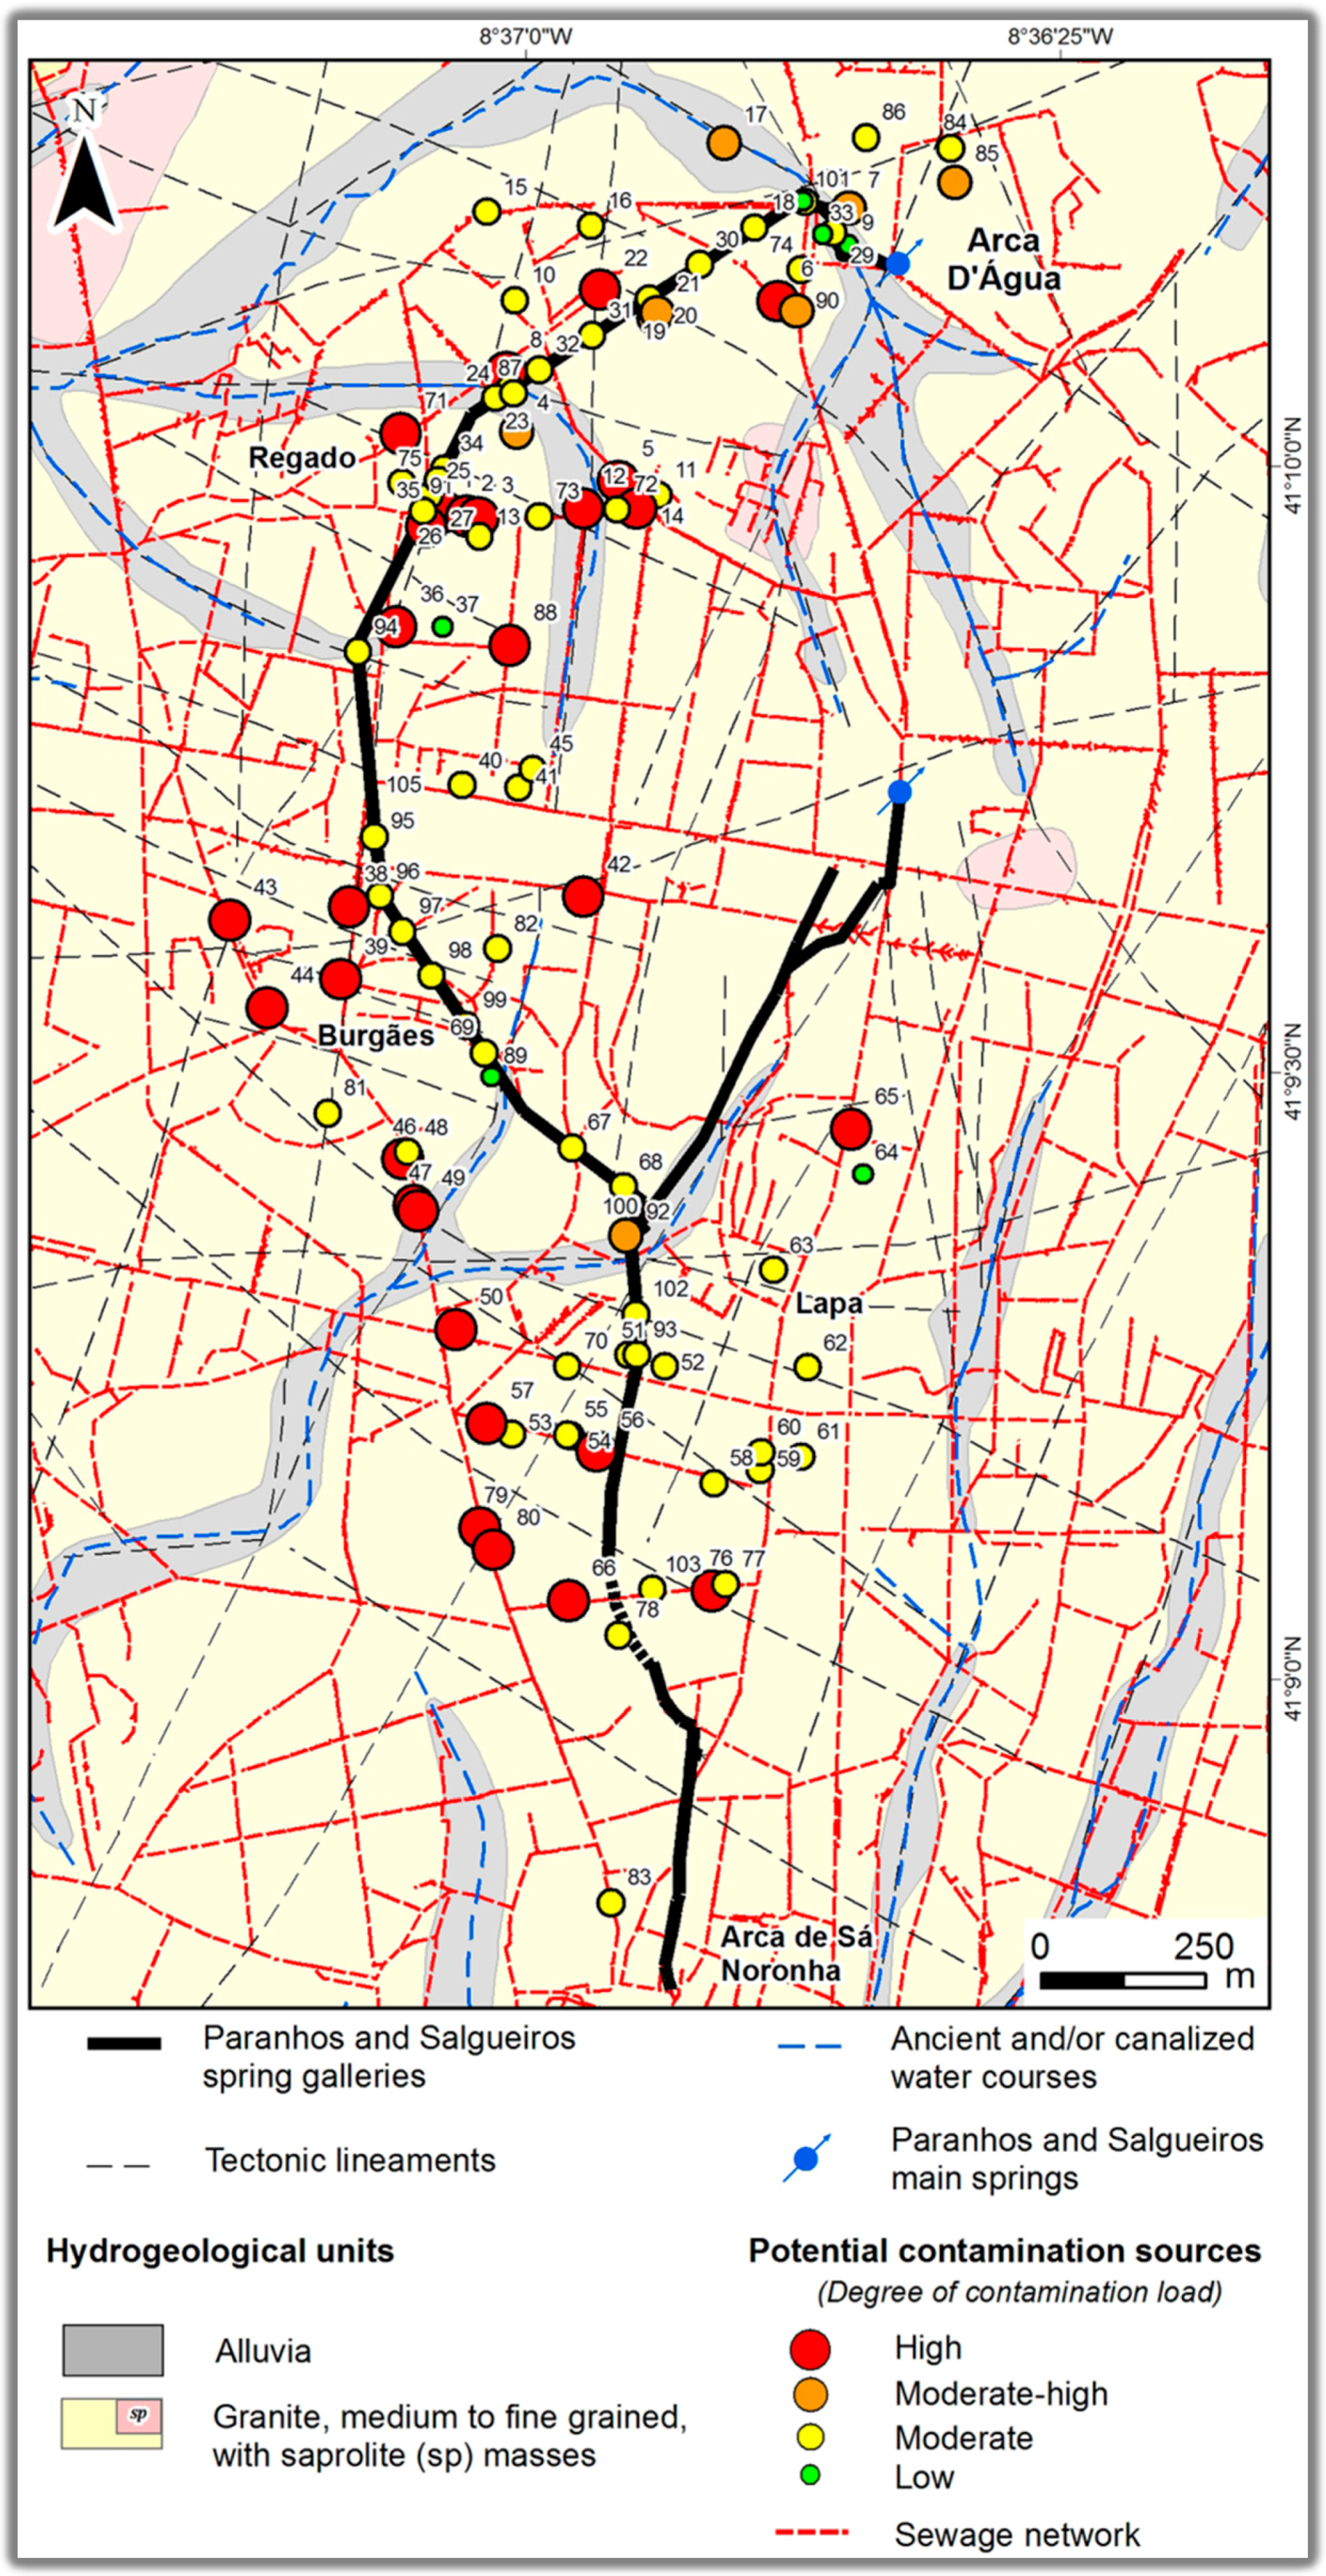
3.3. Inventory of Potential Contamination Sources

Fieldwork campaigns were performed to locate and identify the surface and subsurface potential contamination sources currently occurring in the catchment area of Paranhos and Salgueiros springs, in order to identify sensitive areas that pose a threat to groundwater quality, following the approach previously described in [6,7,27]. These sources were georeferenced by means of a high-accuracy GPS (Trimble® GeoExplorer) and their categorisation and potential groundwater contamination load were classified according to the guidelines of [51].

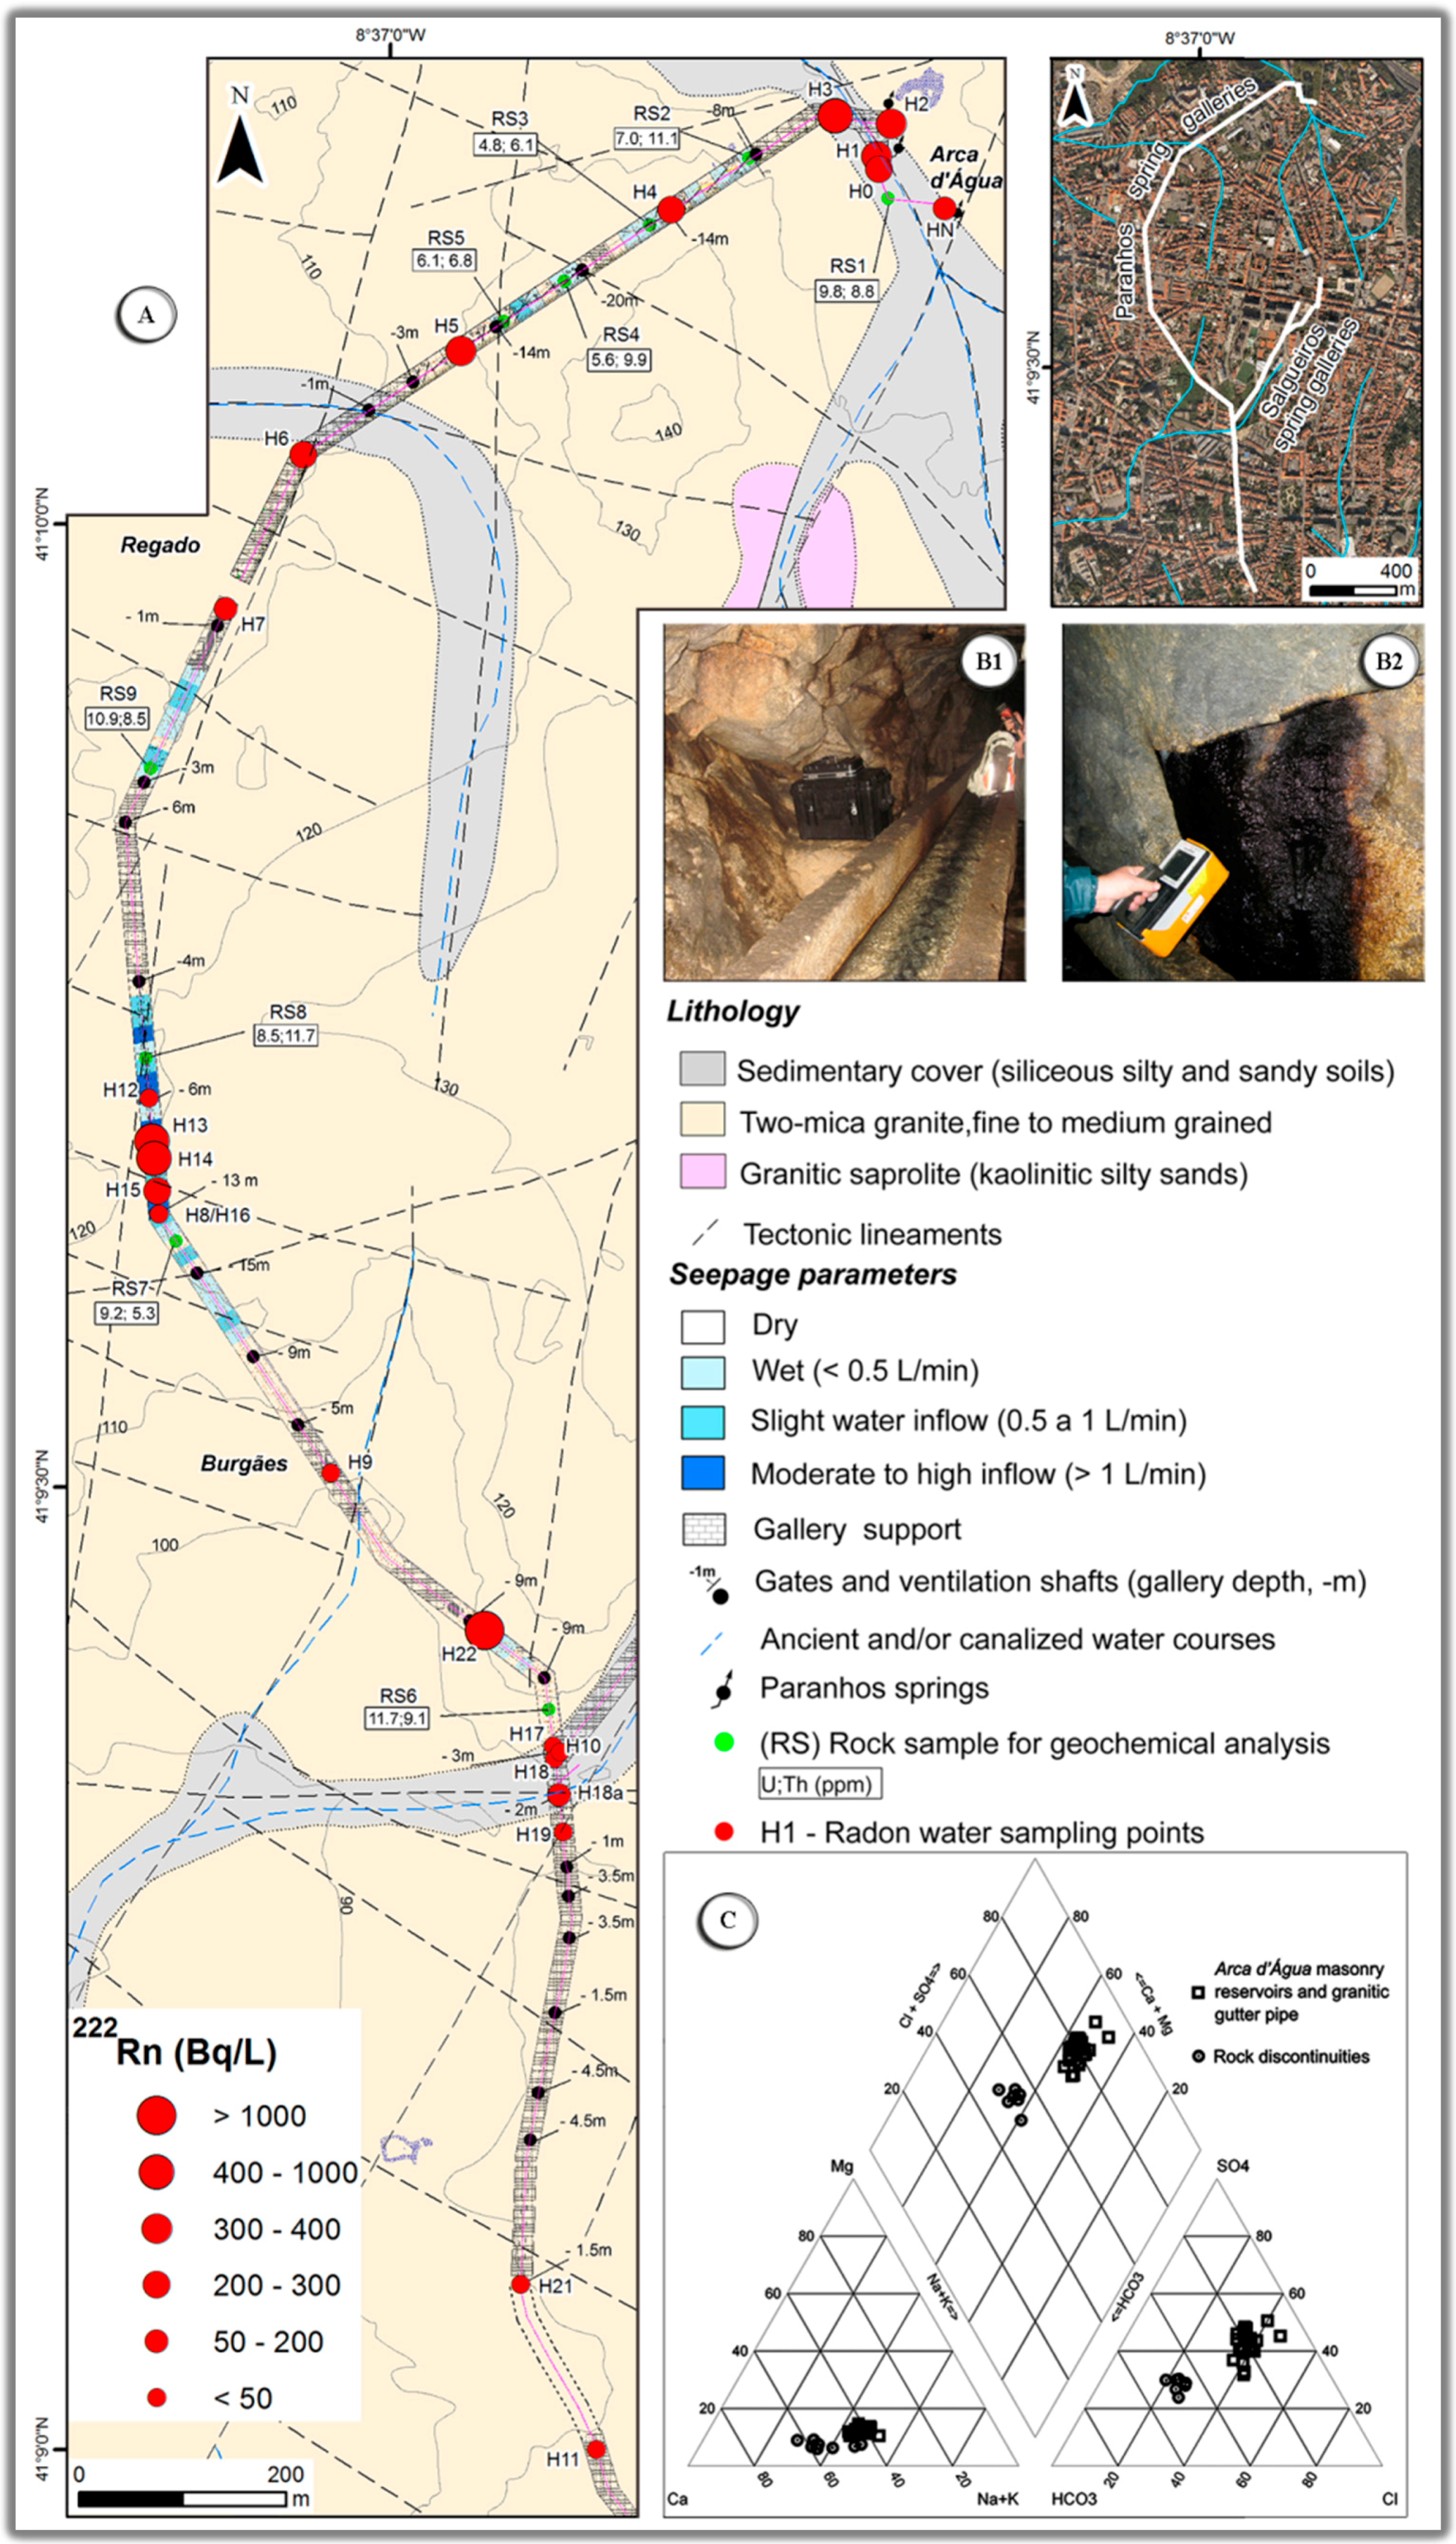
3.4. Hydrogeochemistry, Isotope Tracers

Thirty groundwater samples were collected from different sampling sites, distributed along the 3.2 km extension of the spring galleries, and analysed: seven for Sulphur isotopes, 24 for radioisotopes and 30 for ecotoxicological parameters. Since chemical analysis of waters only can provide the concentration of sulphate, but not its source, the water samples were analysed for δ34S and δ18O values of sulphates. Determinations of the isotopic composition of sulphate were performed at the Department of Geoscience of the University of Calgary (Canada), following the analytical methods described in [52,53]. Determination of δ34S was done converting dissolved sulphate to BaSO4 and then to SO2 in an Element Analyzer (EA 1500) coupled to a mass spectrometer (VG Prism II) in continuous flow mode. To analyse δ18O in sulphates, BaSO4-oxygen was converted to CO at a temperature of 1450 °C in a pyrolysis reactor (Finnigan TC/EA). The resultant gas was subsequently swept by a helium flux in a mass spectrometer (Finnigan MAT delta plus XL) for the determinations of oxygen isotope ratios in continuous flow mode (CFIRMS—Continuous Flow Isotope Ratio Mass Spectrometry). The δ34S and δ18O results for sulphates are expressed in the delta notation (δ), in per mil (‰) relative to the international standards V-CDT and V-SMOW, respectively. Sulphur isotopic data were calibrated with the international reference materials IAEA-S1 (δ34S = −0.3) and IAEA-S2, with a δ34S value of +22.6‰. Sulphur isotope measurements on aqueous sulphate have a precision of ±0.3‰. The analytical precision of δ18O measurements in sulphate is ±0.5‰.
In order to evaluate the abundance and variability of radioisotopes in groundwater, as well as their impact on water quality, 238U, 234U, 226Ra and 222Rn were analysed. The radionuclide activity was measured by liquid scintillation counting techniques (LSC) using an ultra-low-level spectrometer (Quantulus 1220). For radon measurements, the samples were collected in glass containers of 20 mL, which were tightly sealed to avoid gas-leakage during transport. Radon concentration was measured using the double-phase method [54] where an un-aerated water sample was transferred to a polyethylene vial containing a water immiscible scintillation cocktail followed by 3 h of counting to reach the secular equilibrium between radon and its short-term daughter products. 226Ra and U isotopes were measured on water samples that were previously filtered, acidified with HNO3 to a pH of less than 2 and, in the case of 226Ra, pre-concentrated. The 226Ra activity was measured through an indirect method based on radon accumulation in a lipophilic scintillation cocktail for a minimum of 21 days (secular equilibrium). Before Liquid Scintillation Counting a selective extraction of uranium was performed using an “extractive cocktail” (bis-2-etilhexyl-ortophosphoric acid) and a non-water soluble scintillation cocktail. After phase separation, the cocktail collected in polyethylene vials was measured from the α-peaks of 238U and 234U. This method has been tested by comparison with other methods (such as ICP-MS) and the results show good agreement [55]. The uncertainties depend on the activities but, for the range of measured values, these were generally lower than 15%. For a more detailed description about the LSC techniques see [56].

3.5. Vulnerability Assessment

In order to assess groundwater vulnerability to contamination, five methods were implemented to the spring galleries’ neighbouring area; AVI [57], GODS [58,59,60], DRASTIC [61], DRASTIC-Fm [62] and SINTACS [21,63,64], (Table 1). For DRASTIC-Fm, a minor update for the fractured media parameter was made. For SINTACS, two strings of multiplier weights were used in parallel: severe and fissured. No table was created for DRASTIC-Fm, since Fm (fractured media) is the only different parameter from the DRASTIC method. The rating for this parameter is variable as lineaments density values are calculated for each pixel of the ArcGIS raster dataset. Geological background and urban hydrological features were, on the basis of the computation for the vulnerability approach, performed for the 19th and 20th centuries, considering primarily the information from selected published sources (see regional references in Tables S2–S5). Hydrogeotechnical units were the background for the vulnerability assessment related to the 21st century. Groundwater vulnerability was subdivided into several broad classes from “negligible-low” to “extremely high”. The final maps of aquifer vulnerability were generated from the intersection of the considered variables in a Geographical Information System (GIS) environment (ArcGis|ESRI and OCAD for Cartography Inc.). The colour code for DRASTIC index ranges was applied. Finally, an integrated comparison between all the methods was made.

3.6. Acute Effects of Ecotoxicological Evaluation

Standard acute bioassays with Daphnia magna were performed in different seasons for the sampling sites established. On preliminary surveys of the area, no aquatic species that could be relevant for toxicity testing was found in the springs or the galleries through which this groundwater is conducted. Given the interest in surface uses of this groundwater, to foster rational water management saving potable water, Daphnia magna was then selected as a test organism suitable for both surface water and groundwater evaluation, as indicated in OECD guidelines [65].
The test species was selected based on the need to analyse the relationship between groundwater and surface water toxicity, determined during preliminary site recognition. After collection, the samples were immediately transported to the laboratory and the bioassays were performed within, at most, 24 h after collection. Parent organisms (clone A, sensu [66] were maintained in ASTM hard water medium [67] with 4 mL/L of diluted solution of Ascophyllum nodosum [68], and fed daily with Chlorella vulgaris (0.322 mg of carbon per daphnia per day). The photoperiod was 16 hL:8 hD and the temperature was 20 ± 1 °C. All bioassays were carried out according to OECD guidelines [65]. Third to fifth brood neonates aged more than 6 and less than 24 h were used. Test solutions were prepared by the dilution of the sampled groundwater with ASTM hard water. A control group, prepared only with the test media, was also included. Twenty organisms were exposed per treatment, in groups of five per 100 mL. Five groundwater concentrations (12.5%, 25%, 50%, 75%, and 100%) were tested to allow for determination of median effective concentration (EC50). Temperature and photoperiod were used as in the parental cultures. The test duration was 96 h; no renewal of test media was done. No food was provided during the test period. The effect criterion was immobilization of test organisms (not able to swim) within 15 s after gentle agitation of the test vessel and exposure to a light stimulus. Temperature, pH, and dissolved oxygen were measured daily in the test treatments using a multiparametric equipment.

4. Results and Discussion

4.1. Land Use Mapping and Water Features Inventory

The land use in the surroundings of the galleries of the investigated springs changed dramatically since the end of the 19th century. One hundred years ago, green and agricultural spaces dominated the region, covering 60% of this area (Figure 2). The SE sector was the most urbanized area containing the old neighbourhoods of the historic centre of Porto city, which, in 1900, had circa 167,000 inhabitants. Severe insalubrity problems were associated with the population growth, explaining concerns of inventory and characterisation of water structures suitable for the water supply of the population ([28] and references therein). A detailed groundwater survey, including the Paranhos and Salgueiros springs (Figure 2), was carried out by [69,70].
Nowadays, urban and industrial sites cover 73% of this region and green spaces are mainly represented by backyards and public gardens (Figure 2). The actual public water supply to Porto city, implemented in the first quarter of the 20th century, led to the almost complete extinction of dug-wells. In addition, the boreholes were assigned either to private or industrial use. Some of the old fountains are still in situ but most of them are no longer supplied by the water of the ancient springs. The groundwater that flows inside Paranhos and Salgueiros galleries is currently used for limited purposes (i.e., a riding school, a textile factory).

4.2. Inventory of Potential Contamination Sources

In this survey, 107 potential current contamination sources were inventoried and mapped in Paranhos and Salgueiros springs catchment area (Figure 3). The symbols used for these sources represent their degree of contamination load (cf. Table S1). The source type, usual character (P—Point, D—Diffuse, L—Line) and their potential groundwater contamination load (H—High, M—Moderate, L—Low) are displayed in Table S1, according to the proposal by [51]. Table S1 and Figure 3 show that 50% of the potential contamination sources are related to garages (26%) and ventilation shafts or entrances of the spring galleries (24%). Schools and social care buildings are the third most frequent (11%) potential contamination sources. Hospitals and health clinics appear in the fourth position (7%). Most of the inventoried sources are of point source character and their prevailing potential contamination load is moderate. Nevertheless, it is important to emphasize the role of the spring galleries and the sewage network, since their potential contamination load is high and both have a line character. Moreover, the sewer pipe system is more than 50 years old and so very susceptible to leakages and, in this area, it frequently crosses the spring galleries. The impact of underground structures, such as sewers, on the flow and quality of urban groundwater is highlighted by several authors (e.g., [3,19,71]).

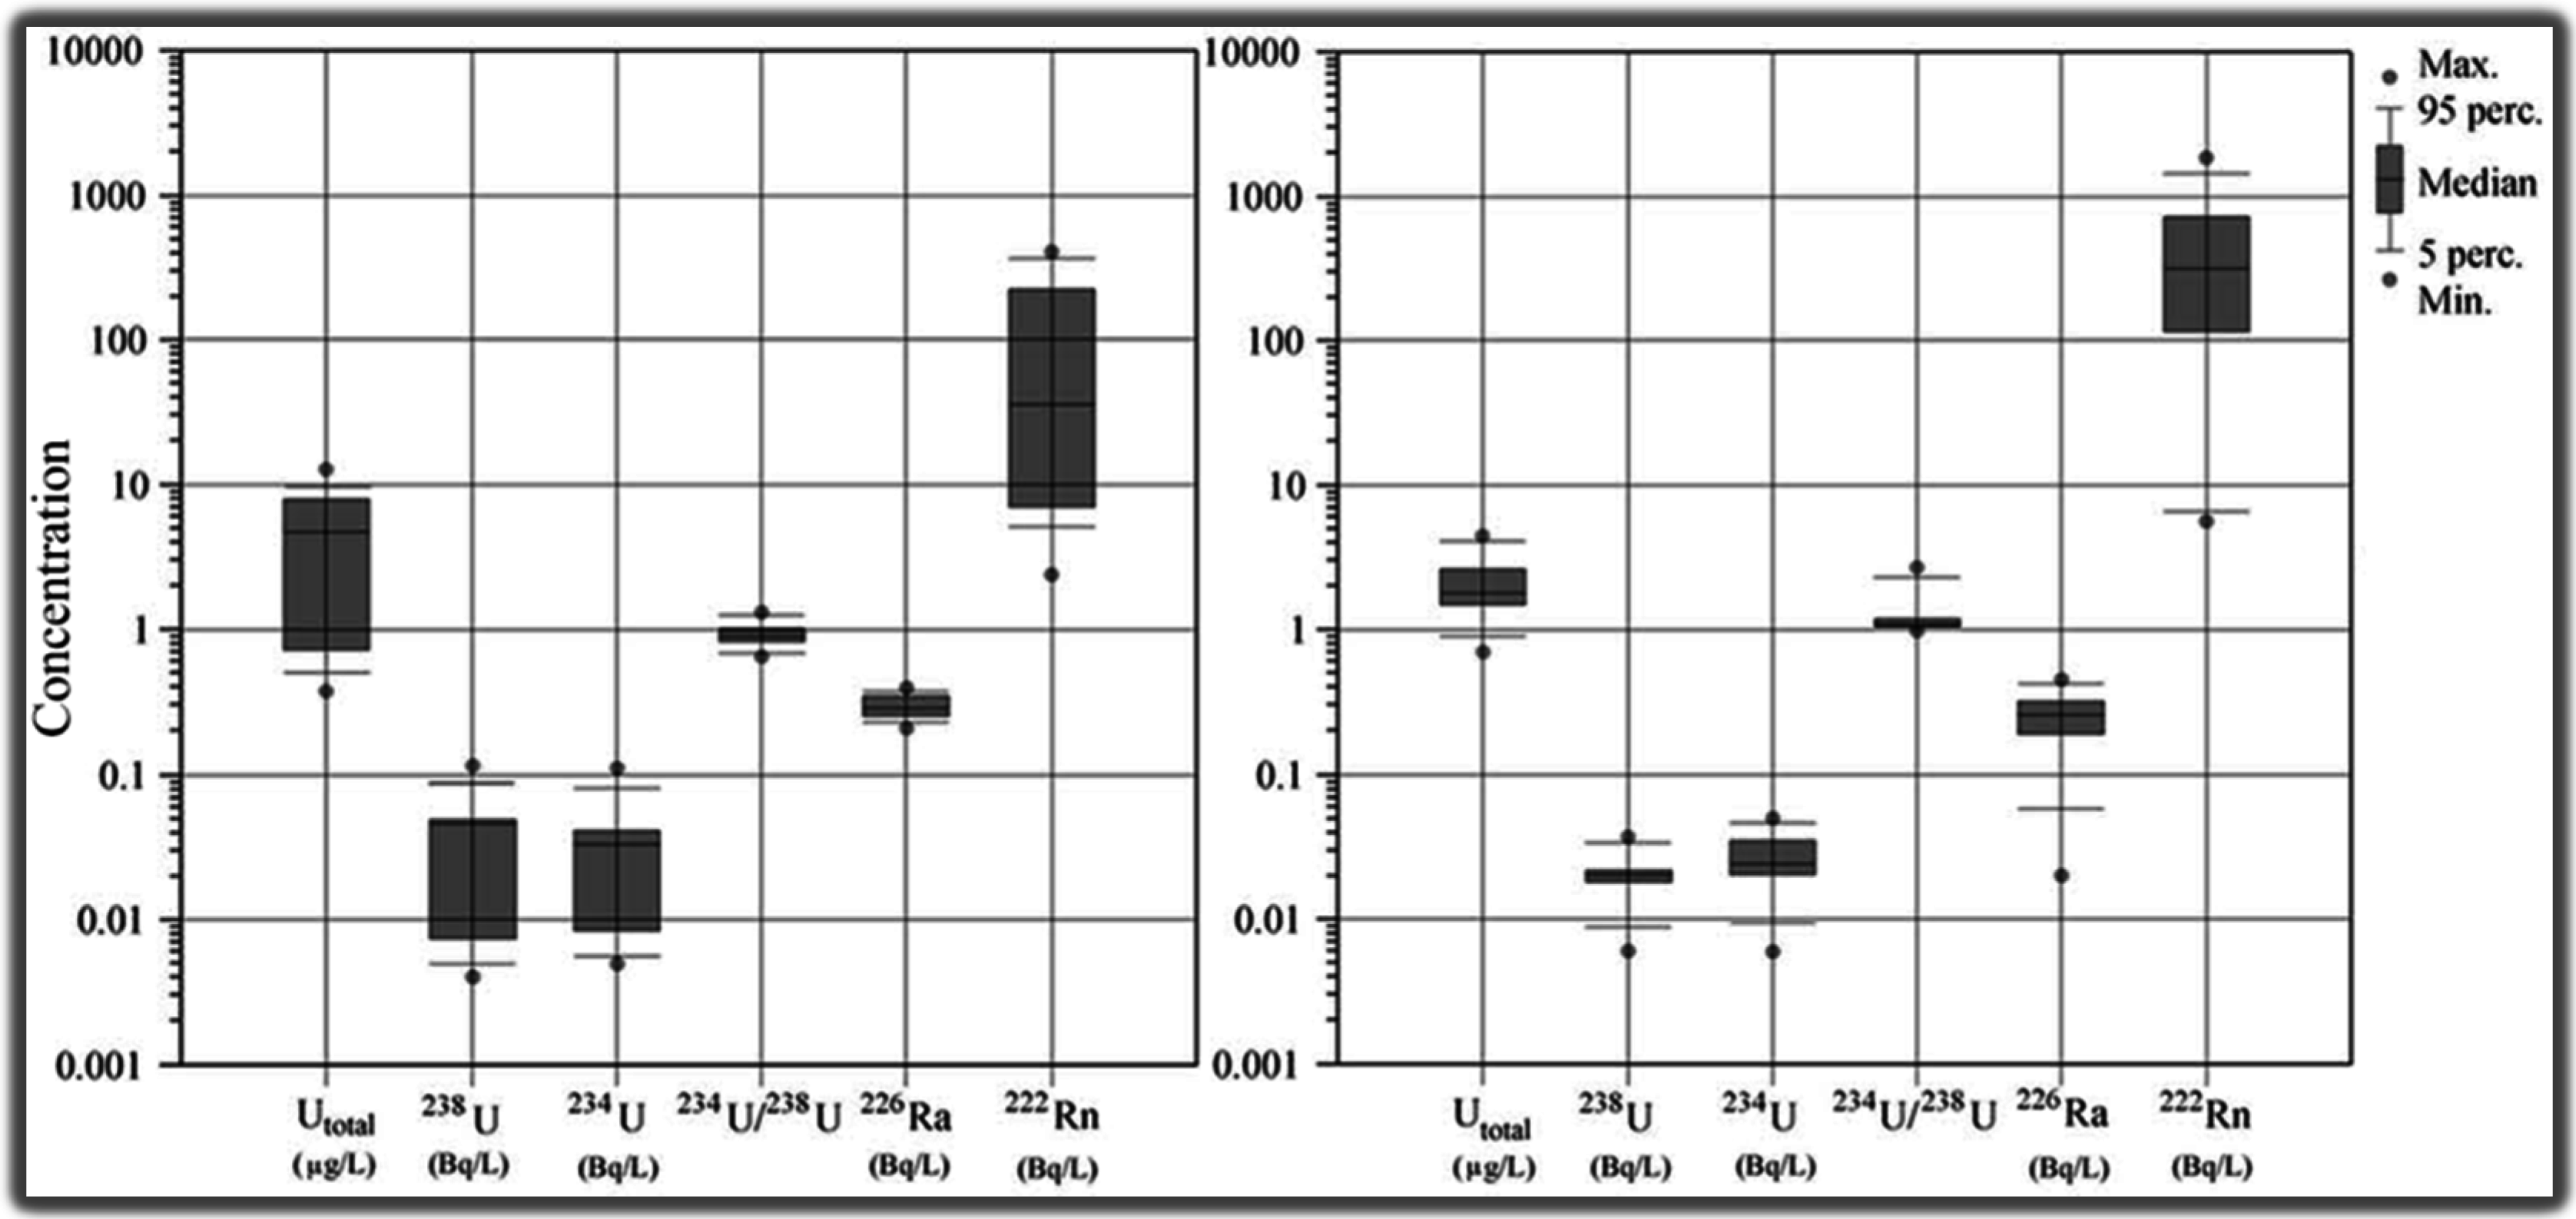
4.3. Hydrogeochemistry and Isotope Tracers

The hydrogeochemistry of Paranhos and Salgueiros groundwater shows that these waters are of neutral character (median pH = 6.7) and nitrate enriched (median NO3 >50 mg/L) and they are classified in two main groups (see [6,28]): (i) SO4-Ca-type for most of the waters near Paranhos springs (Arca d’Água masonry reservoirs) and those percolating along the granitic gutter pipe (a photo of this man-made water subterranean conduit is presented further in Figure 4); and (ii) HCO3-Ca-type for the waters which flow through the rock mass discontinuities.
Isotopic values of oxygen-18 (δ18O) and deuterium (δ2H) show that Paranhos and Salgueiros spring water is shallow groundwater that responds quickly to precipitation events, and permitted the definition of two clusters (see [6]): (i) a homogeneous group with average values of −5.3‰ for δ18O and −33.2‰ for δ2H, for waters near Paranhos springs (Arca d’Água masonry reservoirs) and the granitic gutter pipe; and (ii) a group characterized by lower δ18O and δ2H values, around −6‰ and −39‰, respectively, for water in rock discontinuities.
Analysis of the isotopic composition of sulphate revealed δ34Ssulphate and δ18Osulphate values ranging from +7.3 to +12.4‰ and +4.4 to +9.3‰, respectively, while sulphate concentrations varied between 55 and 80 mg/L. This indicates that sulphate is only partly derived from atmospheric deposition that has cycled through the soil zone and infiltrated the groundwaters [72], while sewage-derived sulphate and/or fertilizer and compost derived sulphate may constitute additional sulphate sources. Fertilizer sulphate has been reported to have δ34S values around +10‰ and δ 18O values between +6 and +11‰ in southern Europe (e.g., [73,74]).
Concerning uranium (U) isotopes, aquifer systems constituted by rocks enriched in U also have higher concentrations of U daughter isotopes dissolved in the circulating water. 226Ra and 222Rn are the main radionuclides generally observed in natural waters, occurring in highly variable concentrations constrained mainly by geological factors [75]. Moreover, it is well known that 222Rn has a strong affinity to Non-Aqueous Phase Liquids (NAPLs) and can be used as a tracer to detect these substances (e.g., [76,77]).
Geochemical analysis of the granitic rock that outcrops inside Paranhos and Salgueiros galleries showed median concentrations for uranium and thorium of 8.5 and 8.8 ppm, respectively. These results are in good agreement with regional data (e.g., [28,35], and references therein). 238U, 234U, 226Ra and 222Rn concentrations in Paranhos and Salgueiros groundwater are within the variation interval observed in Portugal for granitic aquifers [78]. The median value for 226Ra (0.28 Bq/L) is close to values found for areas where U mineralisations are common (e.g., [78,79]). This tendency was also observed in 222Rn, since some samples had concentrations close to 1000 Bq/L (Figure 4).
To further investigate variability in radioisotope concentrations, particularly 238U, 234U and 222Rn, the water samples were grouped in two sets (Figure 5): (i) Group I—samples collected in the granitic gutter pipe (H0 to H11 and H17 to H21); (ii) Group II—samples from the granitic rock fractures (HN, H12 to H16 and H22).
Group I exhibited a variation of 222Rn concentrations (6–400 Bq/L) that could be related to features such as flow rate, distance to the origin of the gutter pipe, and differences in level of the gutter pipe. These factors may enhance water ventilation and consequently the release of radon gas. Changes between samples H7 and H8 are an indication of this, where a significant concentration decrease of 70% was registered. U concentrations were always low (≤0.7 μg/L) and most of them were below the detection limit, though an increase was seen after the junction of Paranhos water with Salgueiros water (sample H17). Low concentrations of 222Rn in Salgueiros water may be due to the higher flow rate and the slope of the Salgueiros gutter pipe, compared to the Paranhos one, which favours the release of radon into the air. Comparatively to Paranhos water, Salgueiros water had a much higher concentration of U (12.2 μg/L) and similar 226Ra concentrations.
Group II showed, in general, the highest values of 222Rn, although there was significant concentration variability. No correlation was observed between 222Rn and 226Ra. The low activities observed for these two isotopes may indicate a fast infiltration rate of shallow waters with minor water–rock interaction (e.g., sample H12). For samples with low 222Rn concentrations, but 226Ra values close to the median, a partial degasification could have occurred between the outflow from the granitic fractures and the inventory site (e.g., samples HN, H15 and H16). U concentrations were always lower than 4.5 μg/L.
The low concentrations of U in groundwater could be explained by two processes: (i) the presence of evansite veins [36], which contain uranyl groups with an average amount of 0.11% of UO2. These U “traps” also explain the high levels of 222Rn, 6000 to 7000 Bq/m3, detected in the air of Paranhos and Salgueiros galleries [37]. According to [33], the granite radioactivity is also due to the enrichment of monazite in mica’s inclusions; (ii) U concentrations of 12.9 ppm and 19.7 ppm were found in iron and manganese biomineralisations, which occur as black coatings in the granite [39,79,80] that are capable of adsorbing heavy metals and radionuclides [81]. Furthermore, [82] refer the presence of bacteria similar to Leptothrix that develops in habitats such as Paranhos and Salgueiros galleries, systems where meteoric or surface waters recharge the subterranean environment [81]. The results also depicted a geogenic 222Rn potential that may be due to the occurrence of U-enriched veins and faults, as well as the local deposition of secondary U.

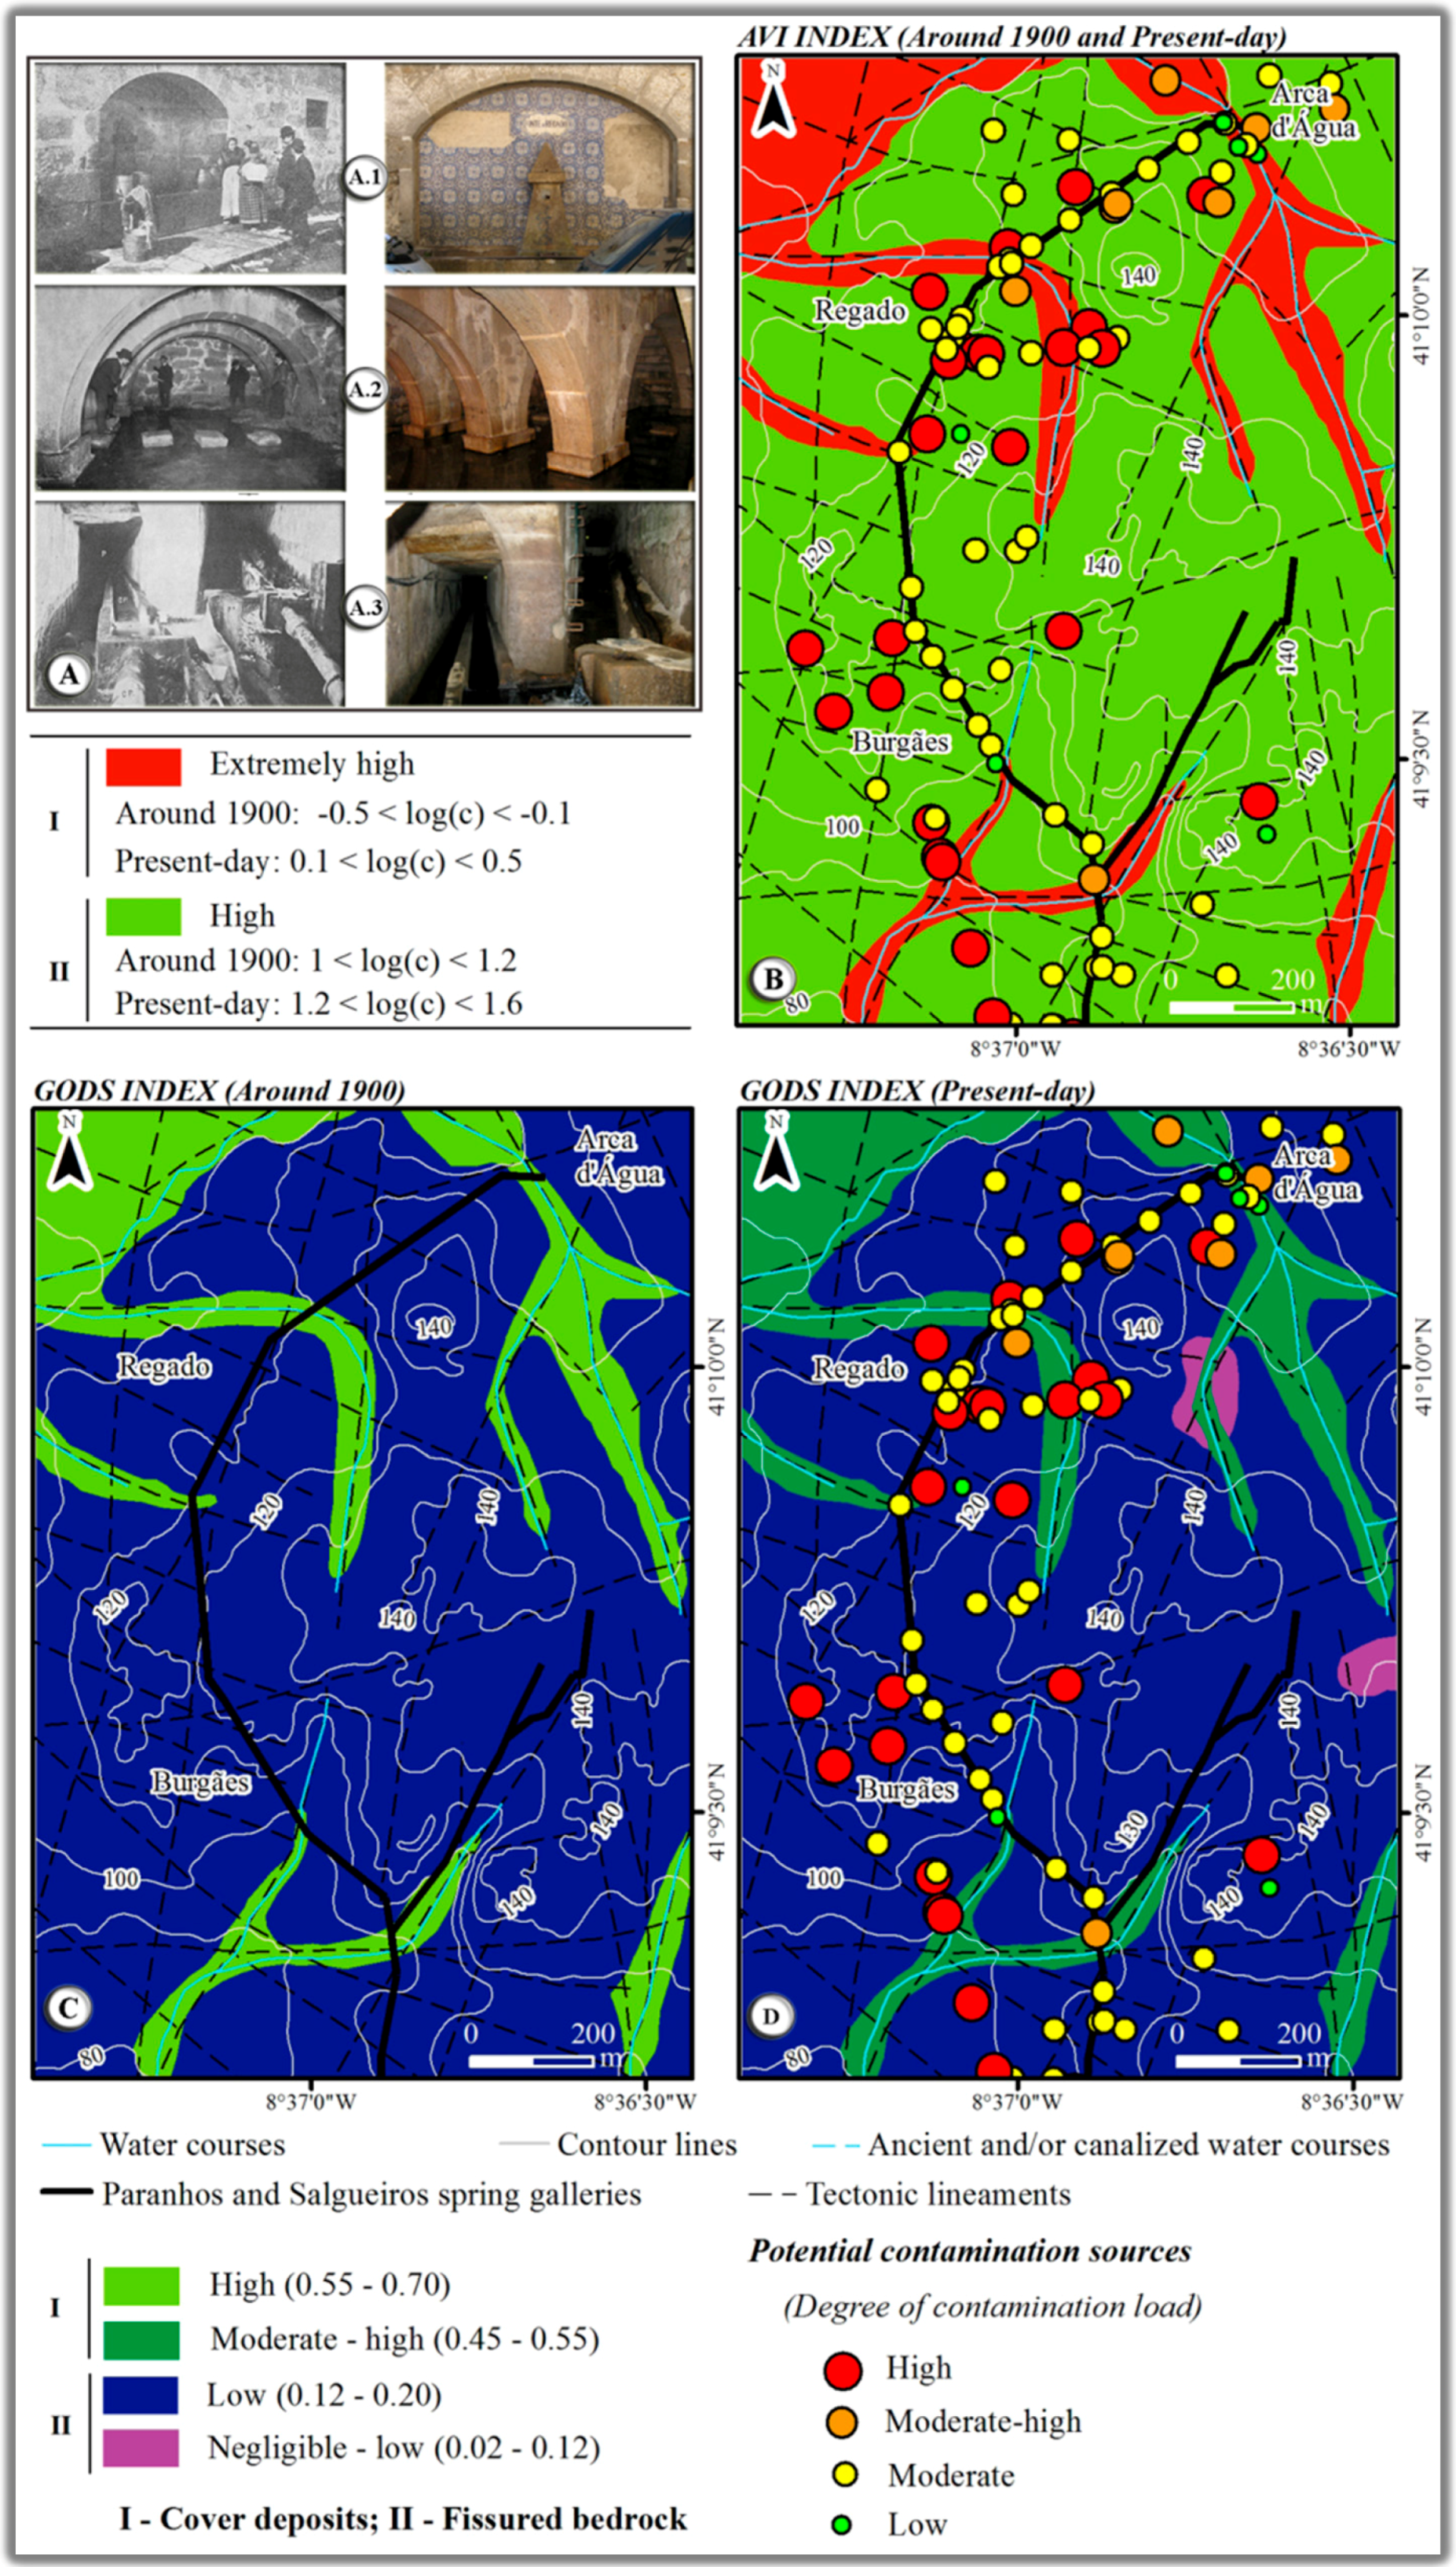
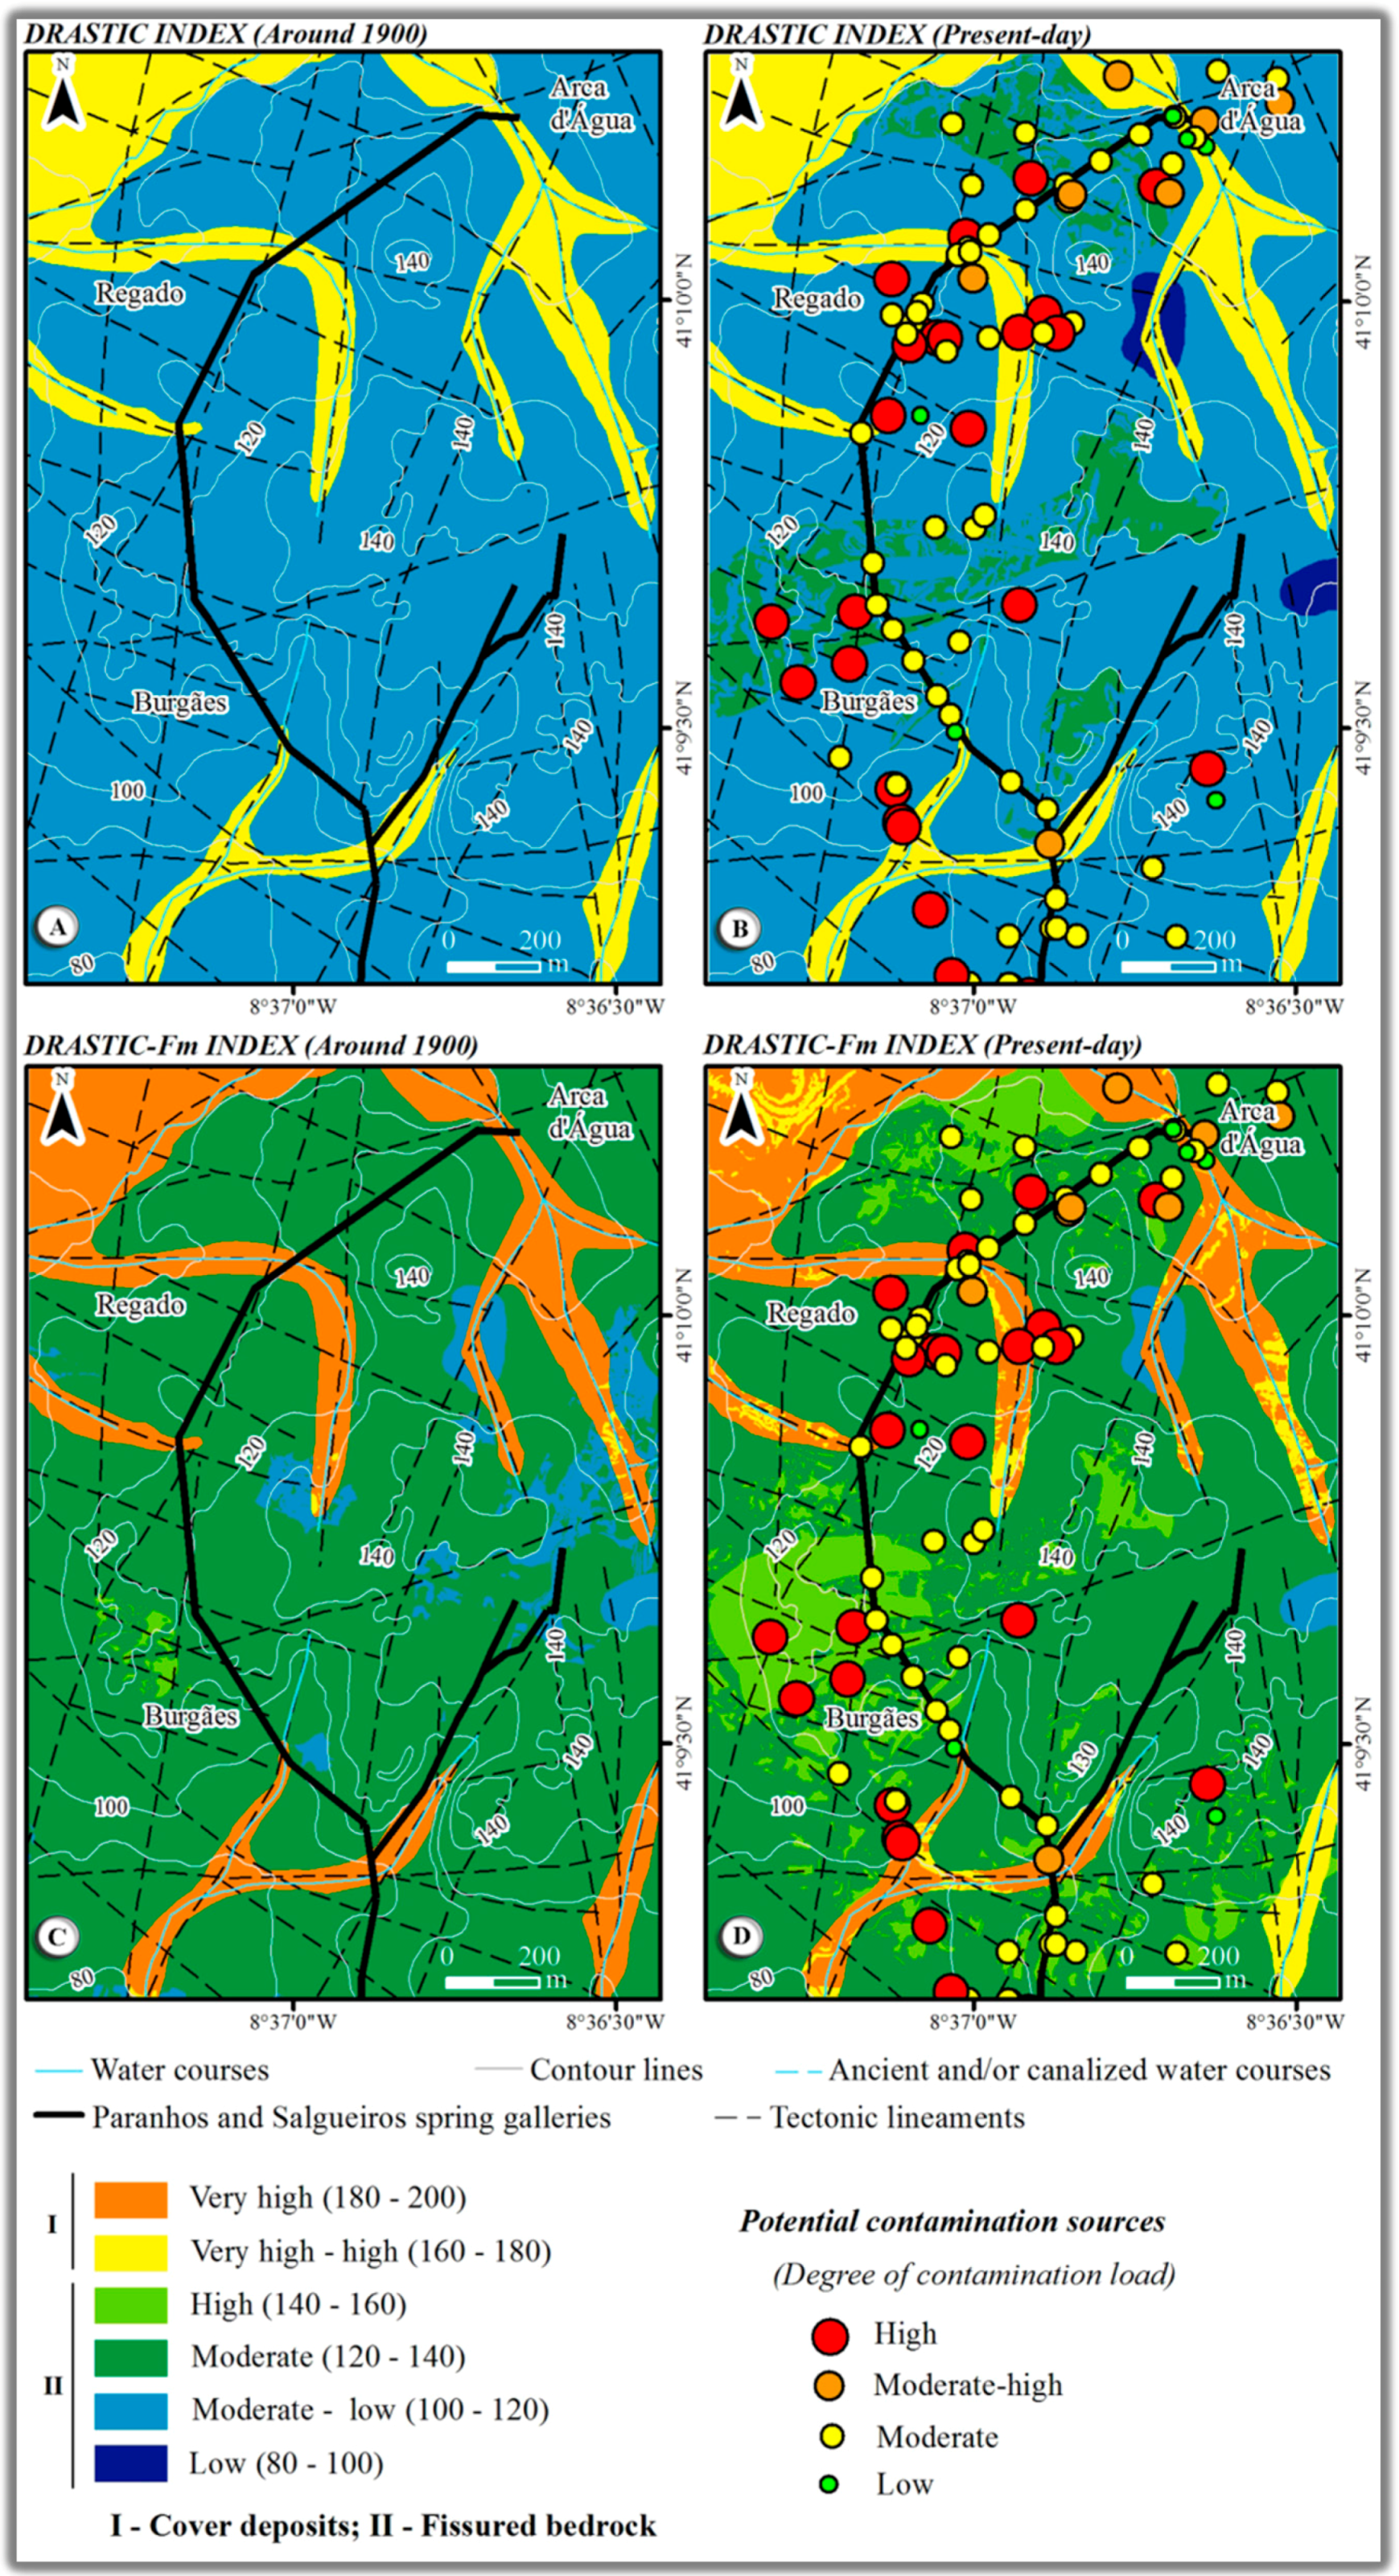
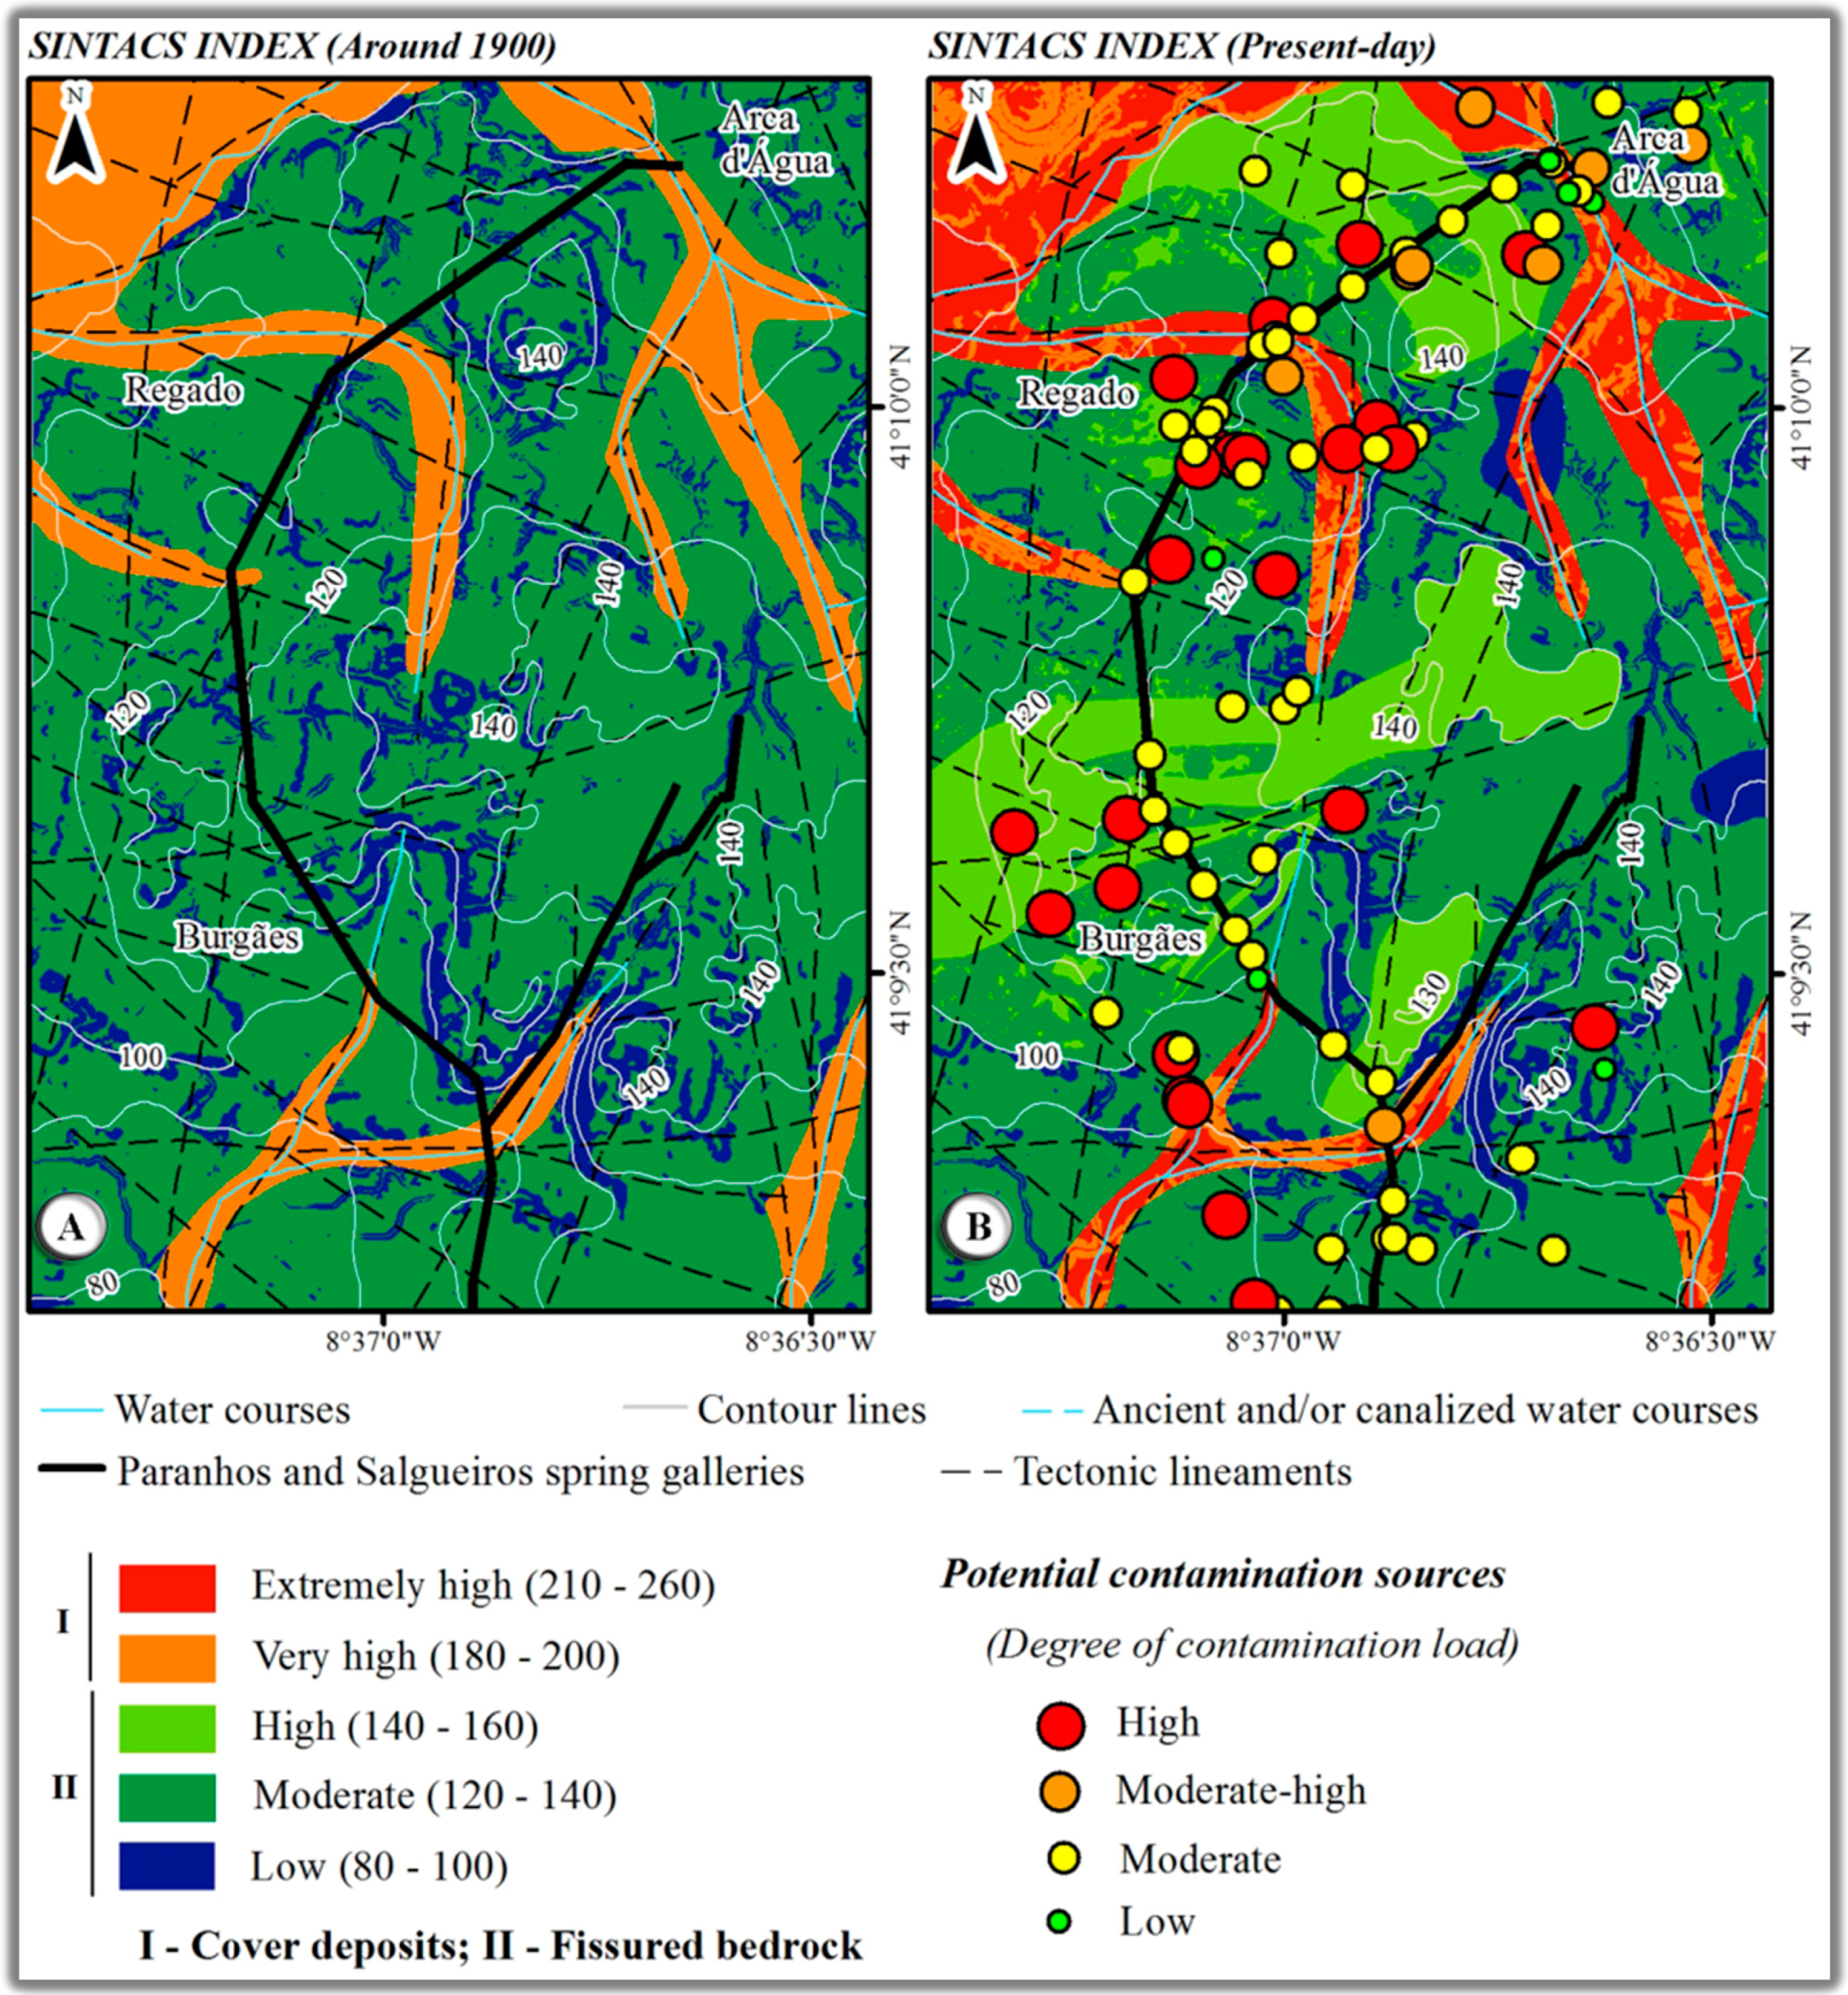
4.4. Groundwater Vulnerability Assessment

Due to the complexity of the urban hydrogeological setting, the classification and mapping of this area is presented in relative and qualitative terms. In the supplementary materials, a synthesis of the parameters’ description is presented, along with the classification adopted for the five methods (Tables S2–S5).
The AVI system is best suited for sedimentary deposits, since it only considers the unsaturated zone and so does not reflect the anisotropy of the fractured bedrock. GODS is more appropriate for designing large areas (used in land management). DRASTIC and DRASTIC-Fm have good accuracy and flexibility and are much more effective in geo-environmental detailed studies (e.g., [9]). SINTACS allows the use of a number of weight strings in parallel, which can be better adapted to urban field conditions.
The analysis of Figure 6, Figure 7 and Figure 8 showed that groundwater vulnerability is closely dependent on geologic and hydrological features around 1900 and on actual hydrogeologic and hydrogeotechnical units. The areas with the highest vulnerability in all the scenarios cover approximately 17% of the total region. These areas correspond to alluvial deposits and are mostly characterized by high to extremely high vulnerability to contamination, both in present-day and around 1900. In shallower water tables, the coarser granulometry and the higher permeability of this porous media contributed to these results. The relative highest index for this unit circa 1900 is explained by watercourses that flowed freely at open-air, mainly in green and agricultural areas, while nowadays most of them are channelled or simply covered by urban infrastructures.
High to moderate vulnerability corresponded to areas where the granitic bedrock is slightly weathered (W1–2), covering roughly 15% of the total region. Generally, tectonic lineaments show higher density in these areas and the soil cover is thin or even absent. On the other hand, areas with moderate to low vulnerability occupy more than 66% of the total region, and were represented by moderately to highly weathered (W3 to W4–5) granite in both scenarios. Greater values of water table depth and sloping are predominant in these areas. These galleries are approximately located in the west border of a hilly platform exceeding 150 m above sea level. Therefore, steeper slopes may contribute to the lowest index. The lowest vulnerability class corresponds to the saprolite granite and represents only 1% of the total region. This material is a soil-like, predominantly clayey residual with a very low permeability.
The study area, therefore, displayed a generally low to moderate vulnerability to contamination that is consistent with the low acute toxicity potential indicated through the ecotoxicological assessment. Nevertheless, the majority of the actual potential contamination sources showed a moderate to high contamination load. A petrol station is among these sources, and garages are the most representative. Most of the entrances and ventilation shafts of Paranhos and Salgueiros spring galleries are not properly sealed, allowing the percolation of contaminants inside the galleries. All of these sources may contribute to a local increase in groundwater vulnerability. Moreover, the sewage pipe system is widespread and prone to leakages. Since groundwater was found to be enriched in NO3 and SO4, it appears that wastewater leakage is a cause of groundwater contamination as supported by δ34Ssulphate and δ18Osulphate values. Furthermore, the origin of NO3 may also be related with lawn/agriculture fertilizer application. In addition, several bacteria such as Gammaproteobacteria, Acinetobacter and Chloroflexi were found inside these galleries [82]. These bacteria are common in polluted environments and in activated sludge (e.g., [83,84]). The authors of [82] pointed out that infiltration waters coming from leaks of Porto city sewage pipes can justify their presence.
The occurrence and distribution of radon and other radioactive elements seem to be controlled, primarily, by the local geology and rock geochemistry. However, radionuclides are considered natural sources of groundwater contamination (e.g., [51], and references therein). Additionally, radionuclides were very useful to a better understanding of flow paths, groundwater velocity, and surface water/groundwater interaction. These processes are important to assess contamination vulnerability, especially in the context of shallow groundwater.

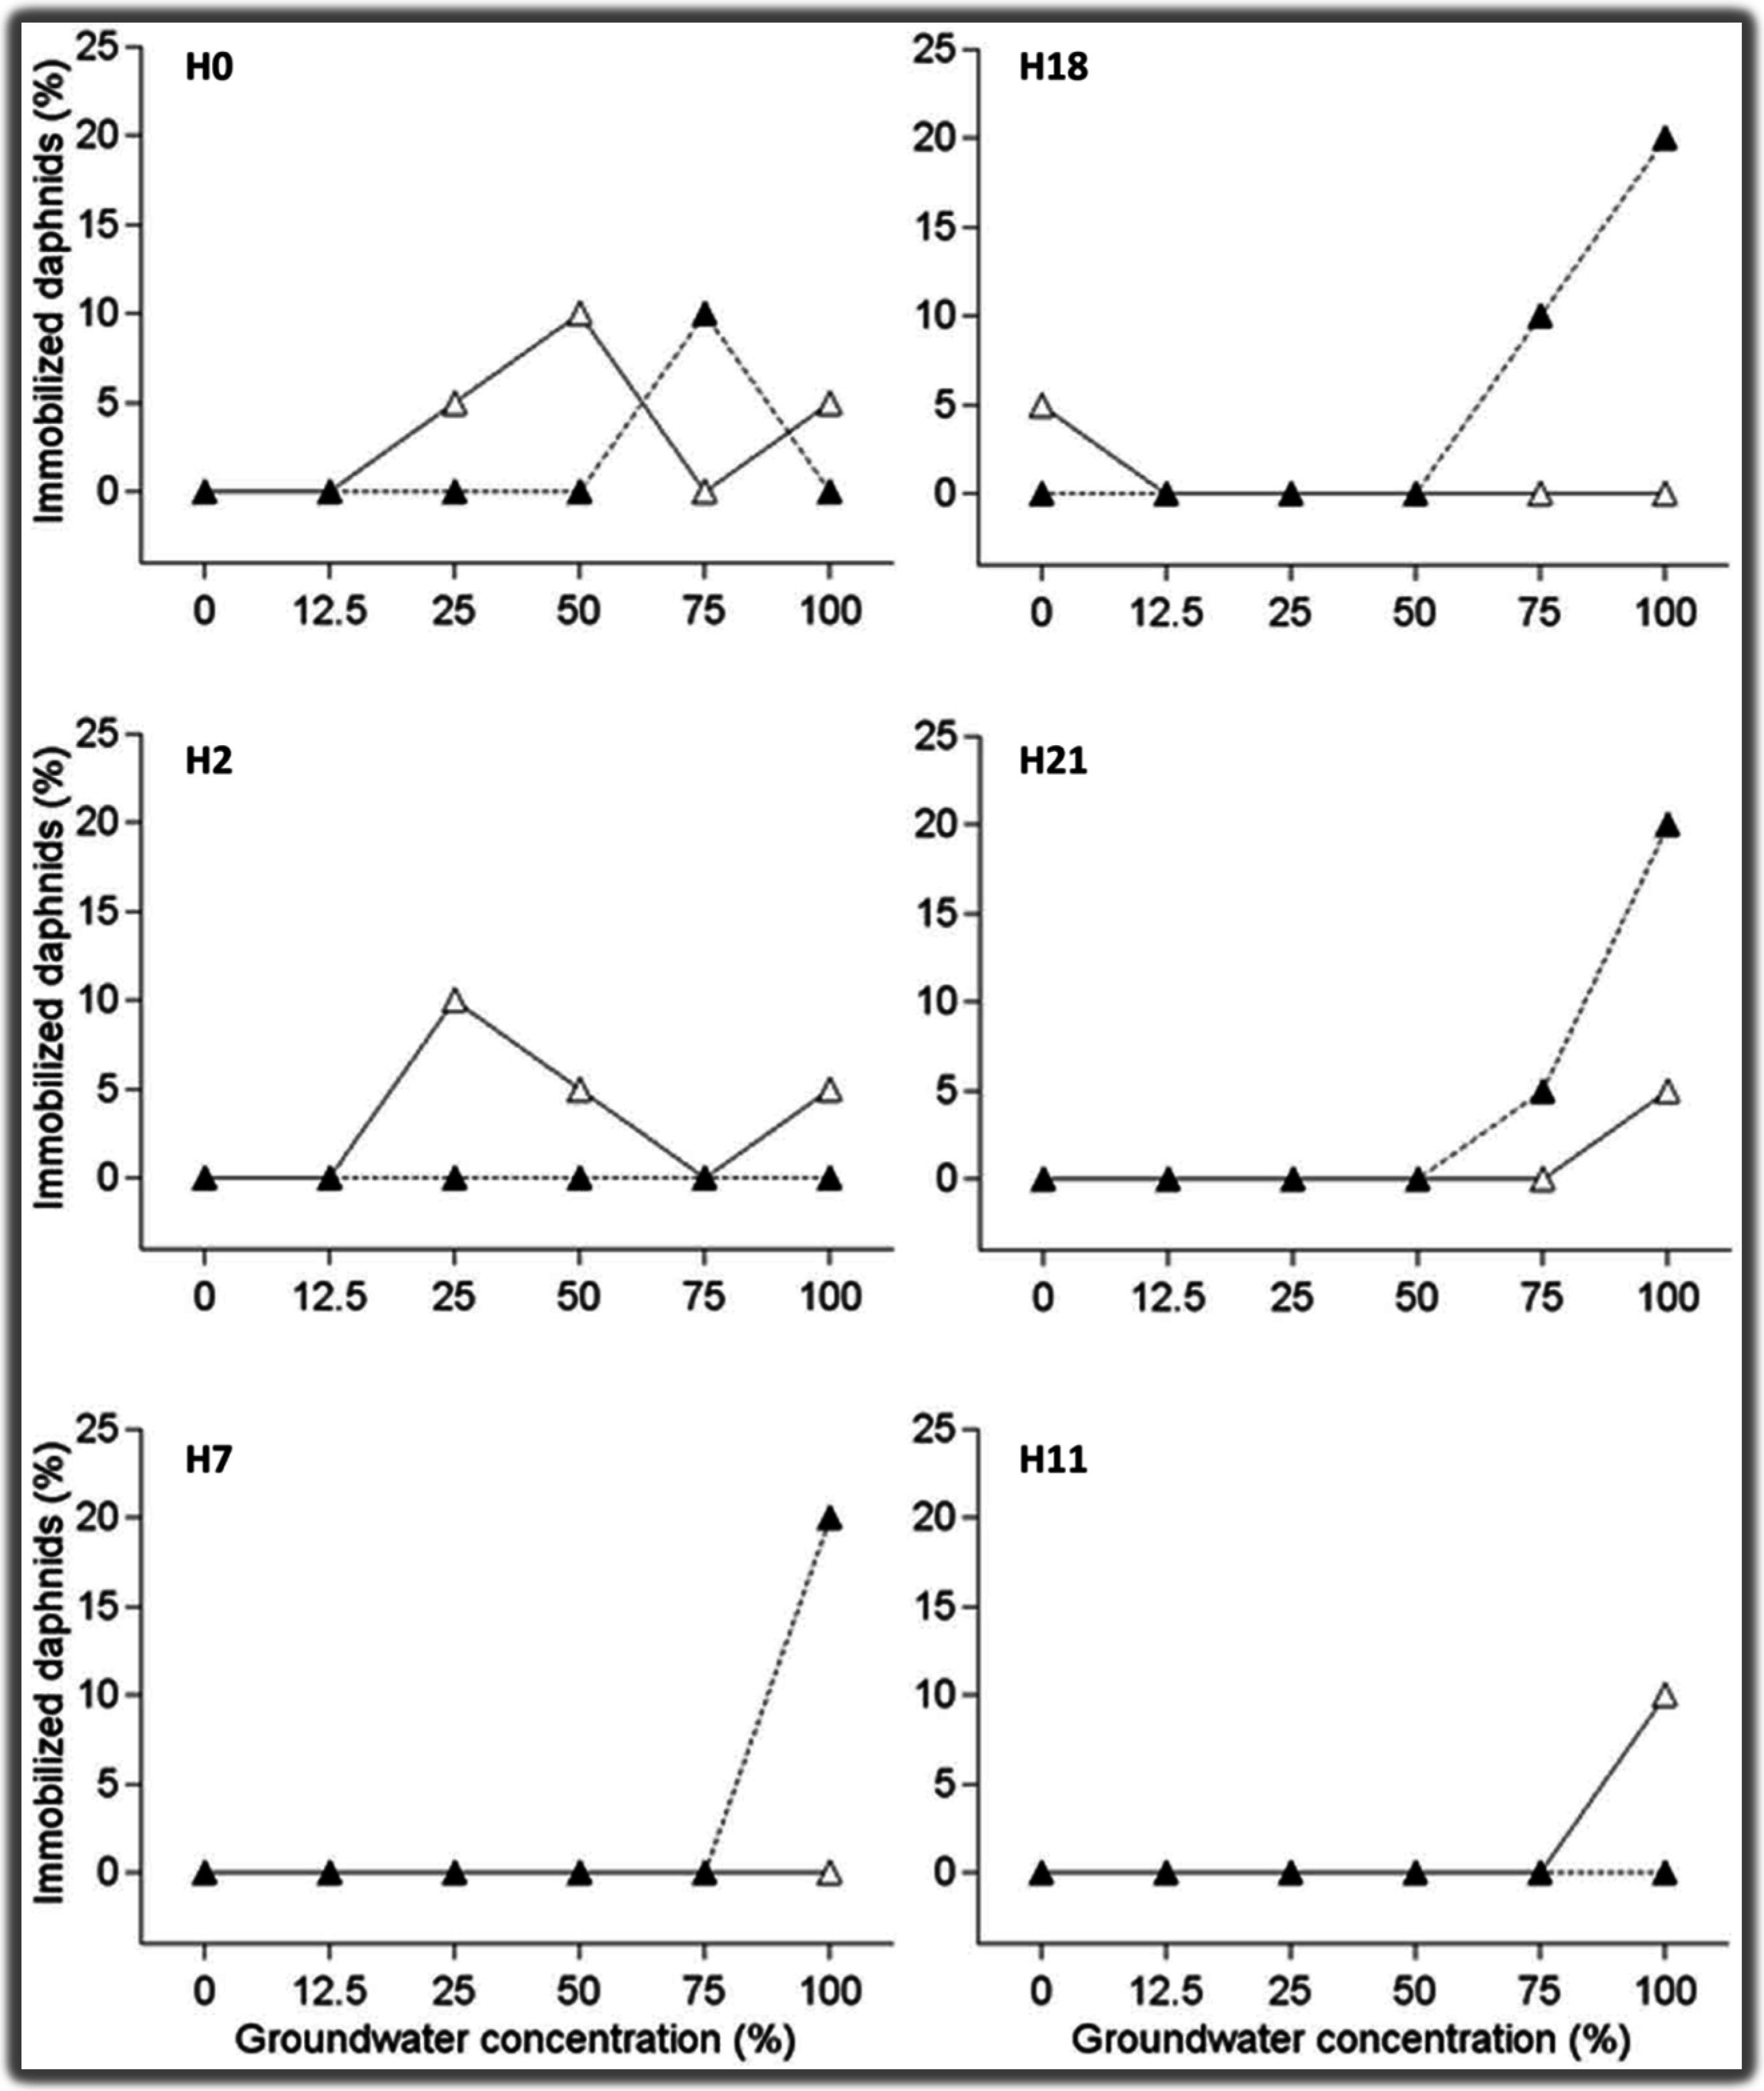
4.5. Groundwater Ecotoxicology

Standard exposure assays (OECD) were performed to gain insight into the toxicity potential of this groundwater and ecotoxicological information to fulfil requirements in the EU Groundwater Directive 2006/118/EC. Validity of the assays carried out was indicated by physico-chemical measurements along the test, and control mortality, all within the acceptable ranges set by the guideline: (i) a lower than 1 unit variation in temperature and pH recorded during the test period; (ii) dissolved oxygen concentration always above 6 mg/L; and (iii) mortality in the control treatments below 10%. Immobilisation of Daphnis recorded in the groundwater dilutions tested was generally low, ranging between 5% and 20% (Figure 9), even for sampling points located in areas showing higher vulnerability. The highest frequencies were observed in full strength groundwater (100%). Overall, no relevant seasonal or interannual variation pattern of toxicity could be depicted, based on the results obtained. From the standard assays conducted, no relevant acute toxic potential could be depicted for this groundwater. Further, although human activities and possible contamination events may show seasonal patterns of occurrence, this does not seem to affect the acute toxic potential to D. magna. In some sampling sites, nitrite levels were above levels allowed by drinking water legislation, but still no relevant toxicity was found in the respective assessments. Assays performed in this study lasted for 96 h, but the data obtained did not allow a reliable estimation of EC50, due to the low, occasional lethality observed. In the literature, 48h-EC50 values (462 mg/L) were previously determined to D. magna [85].

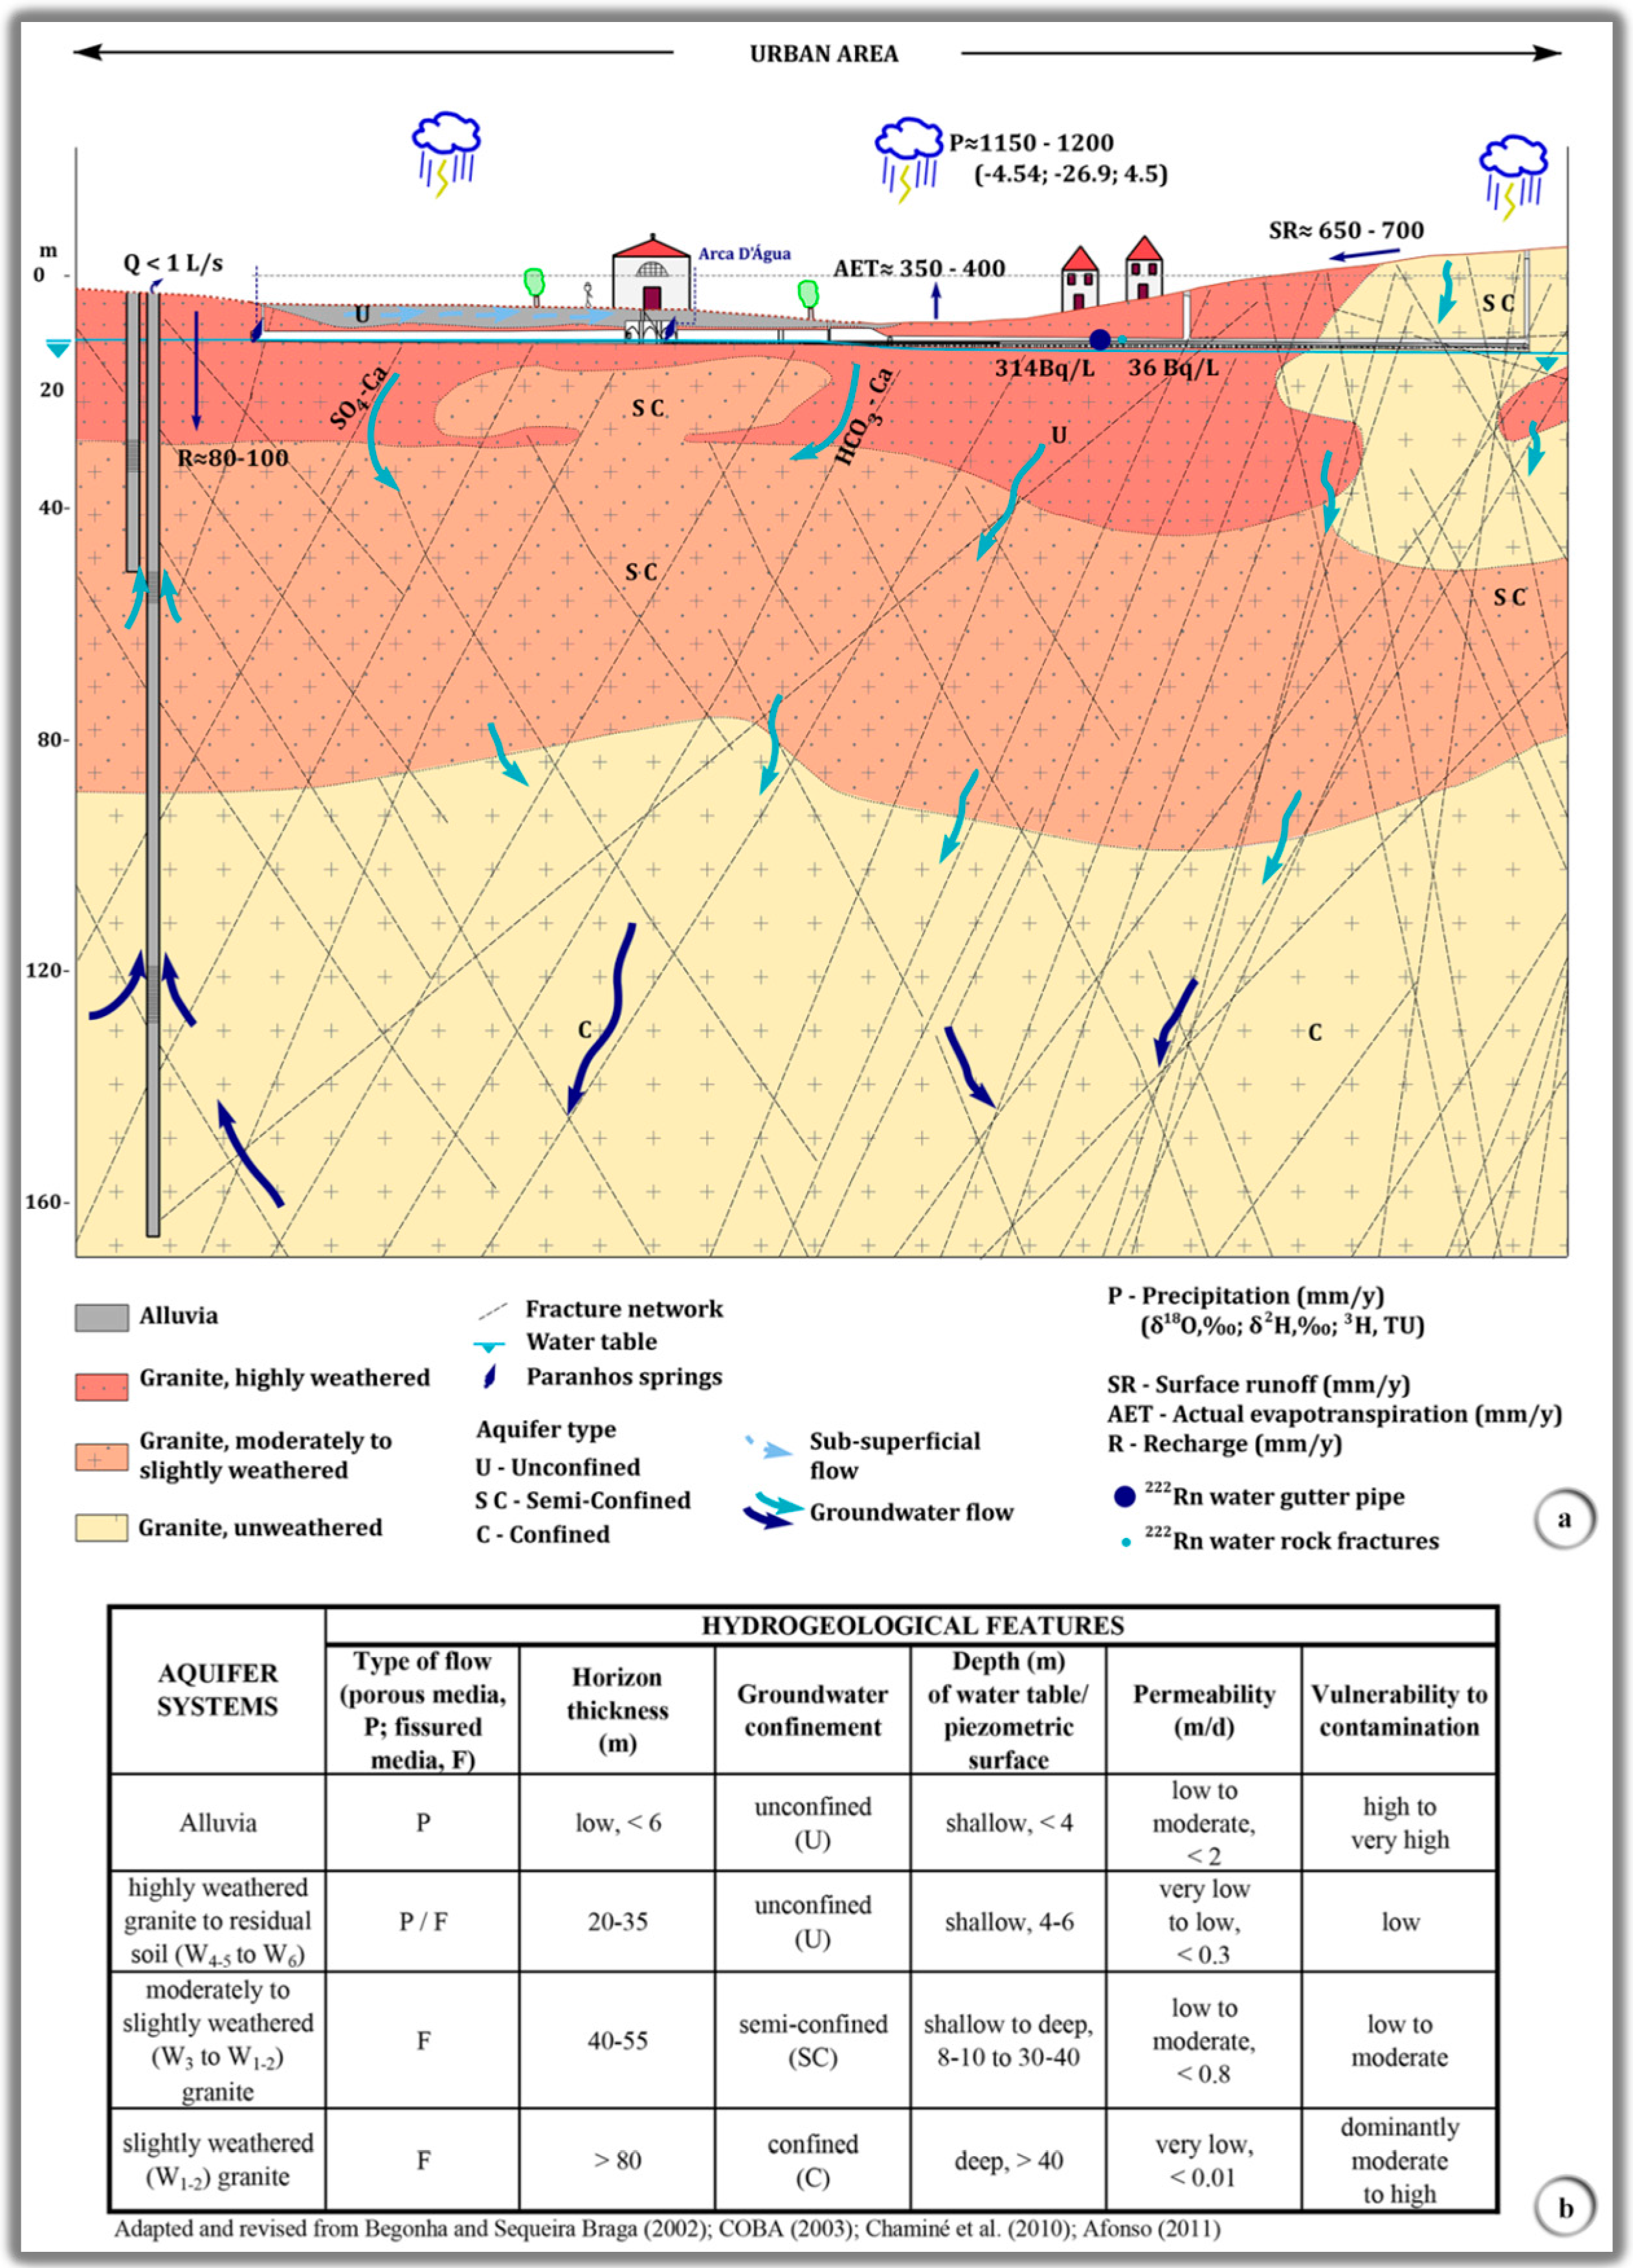
5. Urban Hydrogeological Conceptual Model

Understanding present-day groundwater flow and quality in these urban aquifer systems lies also in the past and recent history of impacts that heavily concentrated human activity on the underlying aquifers. This integrative approach helped to understand and to improve the urban hydrogeological conceptual model for these groundwater systems (Figure 10).

6. Conclusions

In summary, the use of geo-processing tools along with up-to-date subterranean hydrogeotechnics and hydrogeologic databases provided a clear characterisation of the Paranhos and Salgueiros groundwater system. Comparison between actual urban groundwater vulnerability and that estimated for a century ago gave important insights into water evolution in large urban areas. GIS techniques have provided a resourceful environment for vulnerability analysis and high capabilities in handling a large quantity of spatial data sets under a moderate contamination scenario. Coupling isotopic analysis with hydrogeochemical data also allowed us to evaluate the relative contribution of these sources to the vulnerability of groundwater to contamination. Sulphur isotopes proved to be valuable as tracers to validate the vulnerability of these groundwaters to sewage contamination. Radionuclides were important to understand hard-rock constraints and useful tracers to understand the dynamics of urban hydrogeological processes. The results of the vulnerability assessment showed strong correlation with the recorded field conditions. The highest degree of vulnerability obtained by the five methods concurs with the cover deposits, though these areas cover less than one fifth of the study region.
A comparison of all vulnerability maps exposed the greatest correspondence between the DRASTIC-Fm and SINTACS methods. Regardless of the applied method, the dramatic alteration in land use in the last century led to a change in vulnerability to groundwater contamination. So, nowadays these groundwater systems are more vulnerable to contamination, since increasing urbanisation encompasses multiple contamination sources. Nevertheless, the ecotoxicological evaluation with standard assays suggests no relevant acute toxicity of Paranhos and Salgueiros groundwater. Future investigation of this groundwater should encompass bioassays with other species, including relevant groundwater ecological receptors (e.g., isopod Proasellus valdensis). Evaluation of environmental biomarkers should also provide information that is useful for risk assessment. Biomarkers have been advocated as strategic tools in the assessment of environmental quality, giving a significant contribution to the weight-of-evidence approaches involved in risk assessment and classification of ecosystems’ status recognised by the WFD [86].
Future work should focus on developing specific vulnerability maps for different contaminants, such as nitrates, sulphates, heavy metals, Dense Non-Aqueous Phase Liquids (DNAPLs) and Light Non-Aqueous Phase Liquids (LNAPLs). Groundwater vulnerability maps, combined with land use and land cover mapping, should be integrated in future processes of urban water decision-making and planning. Finally, although these groundwaters are not of drinking quality, they may still be used, combined with potable waters, for many other purposes, such as irrigation of green areas, street cleaning, and fire services, under an integrated water resources management outlook.

Supplementary Materials

The following are available online at www.mdpi.com/2073-4441/8/11/499/s1, Table S1: Groundwater potential contamination sources around Paranhos and Salgueiros spring galleries, Table S2: AVI parameters used in the surrounding area of Paranhos and Salgueiros spring galleries, Table S3: GODS parameters used in the surrounding area of Paranhos and Salgueiros spring galleries, Table S4: DRASTIC parameters used in the surrounding area of Paranhos and Salgueiros spring galleries, Table S5: SINTACS parameters used in the surrounding area of Paranhos and Salgueiros spring galleries.

Acknowledgments

This work was partially financed by FEDER-EU COMPETE Funds and the Portuguese Foundation for the Science and Technology, FCT (UID/GEO/04035/2013, PEst-OE/CTE/UI0098/2011 and GroundUrban project: POCI/CTE-GEX/59081/2004), and by the Labcarga|ISEP re-equipment program (IPP-ISEP|PAD’2007/08). Special thanks are due to colleague José Teixeira for all the support in the drawing of Figure 10. The authors are grateful to Guilherme Fontes (Águas do Porto, EM) for his support in all stages of the research. The present paper is dedicated to the late Professor Miguel Montenegro de Andrade (1919–2012), an eminent Portuguese petrologist from University of Porto, who developed innovative geochemistry approaches in Porto region. We acknowledge the anonymous reviewers for the constructive comments that helped to improve the focus of the manuscript.

Author Contributions

Maria José Afonso and Helder I. Chaminé designed the study. Liliana Freitas, Helder I. Chaminé and Maria José Afonso gave inputs with GIS mapping and urban hydrogeomorphology. Alcides Pereira and Luís Neves contributed with radioisotope hydrology. Laura Guimarães and Lúcia Guilhermino wrote the ecotoxicology topic. Bernhard Mayer and José Manuel Marques gave inputs from isotope hydrochemistry. Helder I. Chaminé, Fernando Rocha and Maria José Afonso gave inputs with underground hydrogeotechnics and geochemistry. All authors contributed to data analysis, interpretation and discussed results. Maria José Afonso and Helder I. Chaminé wrote the manuscript with contributions of all authors.

Conflicts of Interest

The authors declare no conflict of interest.

References

  1. Lerner, D.N.; Barrett, M.H. Urban groundwater issues in the United Kingdom. Hydrogeol. J. 1996, 4, 80–89. [Google Scholar] [CrossRef]
  2. Lerner, D.N. Identifying and quantifying urban recharge: A review. Hydrogeol. J. 2002, 10, 143–152. [Google Scholar] [CrossRef]
  3. Vázquez-Suñé, E.; Sánchez-Vila, X.; Carrera, J. Introductory review of specific factors influencing urban groundwater, an emerging branch of hydrogeology, with reference to Barcelona, Spain. Hydrogeol. J. 2005, 13, 522–533. [Google Scholar] [CrossRef]
  4. National Research Council (NRC). Ground Water Recharge Using Waters of Impaired Quality; National Academy Press: Washington, DC, USA, 1994. [Google Scholar]
  5. Foster, S.D.; Hirata, R.; Howard, K.W.F. Groundwater use in developing cities: Policy issues arising from current trends. Hydrogeol. J. 2011, 19, 271–274. [Google Scholar] [CrossRef]
  6. Afonso, M.J.; Chaminé, H.I.; Marques, J.M.; Carreira, P.M.; Guimarães, L.; Guilhermino, L.; Gomes, A.; Fonseca, P.E.; Pires, A.; Rocha, F. Environmental issues in urban groundwater systems: A multidisciplinary study of the Paranhos and Salgueiros spring. Environ. Earth Sci. 2010, 61, 379–392. [Google Scholar] [CrossRef]
  7. Afonso, M.J.; Pires, A.; Chaminé, H.I.; Marques, J.M.; Guimarães, L.; Guilhermino, L.; Rocha, F. Aquifer vulnerability assessment of urban areas using a GIS-based cartography: Paranhos groundwater pilot site, Porto, NW Portugal. In Global Groundwater Resources and Management; Paliwal, B.S., Ed.; Scientific Publishers: Jodhpur, India, 2010; pp. 259–278. [Google Scholar]
  8. Vrba, J.; Zaporozec, A. Guidebook on Mapping Groundwater Vulnerability; IAH, International Contributions to Hydrogeology, 16; Verlag Heinz Heise: Hannover, Germany, 1994. [Google Scholar]
  9. Gogu, R.C.; Dassargues, A. Current trends and future challenges in groundwater vulnerability assessment using overlay and index methods. Environ. Geol. 2000, 39, 549–559. [Google Scholar] [CrossRef]
  10. Vrba, J.; Lipponen, A. Groundwater Resources Sustainability Indicators; UNESCO, IHP-VI, Series on Groundwater, 14; UNESCO: Paris, France, 2007. [Google Scholar]
  11. Witkowski, A.; Kowalczyk, A.; Vrba, J. Groundwater Vulnerability Assessment and Mapping; International Association of Hydrogeologists Selected Papers SP11; Taylor & Francis Group: London, UK, 2007. [Google Scholar]
  12. Pisinaras, V.; Polychronis, C.; Gemitzi, A. Intrinsic groundwater vulnerability determination at the aquifer scale: A methodology coupling travel time estimation and rating methods. Environ. Earth Sci. 2007, 75, 85. [Google Scholar] [CrossRef]
  13. Kazemi, G.; Lehr, J.; Perrochet, P. Groundwater Age; John Wiley & Sons: New York, NY, USA, 2006. [Google Scholar]
  14. Attard, G.; Rossier, Y.; Eisenlohr, L. Urban groundwater age modeling under unconfined condition—Impact of underground structures on groundwater age: Evidence of a piston effect. J. Hydrol. 2016, 535, 652–661. [Google Scholar] [CrossRef]
  15. Mays, L.W. Groundwater resources sustainability: Past, present, and future. Water Resour. Manag. 2013, 27, 4409–4424. [Google Scholar] [CrossRef]
  16. Foster, S.; Evans, R.; Escolero, O. The groundwater management plan: In praise of a neglected ‘tool of our trade’. Hydrogeol. J. 2015, 23, 847–850. [Google Scholar] [CrossRef]
  17. Plummer, R.; Loë, R.; Armitage, D. A systematic review of water vulnerability assessment tools. Water Resour. Manag. 2012, 26, 4327–4346. [Google Scholar] [CrossRef]
  18. Liggett, J.E.; Talwar, S. Groundwater vulnerability assessments and integrated water resource management. Streamline Watershed Manag. Bull. 2009, 13, 18–29. [Google Scholar]
  19. Schirmer, M.; Leschik, S.; Musolff, A. Current research in urban hydrogeology: A review. Adv. Water Resour. 2013, 51, 280–291. [Google Scholar] [CrossRef]
  20. Zektser, I.S.; Everett, L.G. Groundwater Resources of the World and Their Use; UNESCO, IHP-VI, Series on Groundwater, 6; UNESCO: Paris, France, 2004. [Google Scholar]
  21. Civita, M.V. The combined approach when assessing and mapping groundwater vulnerability to contamination. J. Water Resour. Prot. 2010, 2, 14–28. [Google Scholar] [CrossRef]
  22. Foster, S.D.; Hirata, R.; Andreo, B. The aquifer pollution vulnerability concept: Aid or impediment in promoting groundwater protection? Hydrogeol. J. 2013, 21, 1389–1392. [Google Scholar] [CrossRef]
  23. Junior, R.F.; Varandas, S.G.P.; Fernandes, L.F.S. Multicriteria analysis for the monitoring of aquifer vulnerability: A scientific tool in environmental policy. Environ. Sci. Policy 2015, 48, 250–264. [Google Scholar] [CrossRef]
  24. Chaminé, H.I.; Teixeira, J.; Freitas, L.; Pires, A.; Silva, R.S.; Pinho, T.; Monteiro, R.; Costa, A.L.; Abreu, T.; Trigo, J.F.; et al. From engineering geosciences mapping towards sustainable urban planning. Eur. Geol. J. 2016, 41, 16–25. [Google Scholar]
  25. De Oliveira Marques, A.H. History of Portugal, from Lusitania to Empire; Columbia University Press: New York, NY, USA, 1972; Volume 1. [Google Scholar]
  26. Afonso, M.J. Hidrogeologia de rochas graníticas da região do Porto (NW de Portugal). Cadernos Laboratorio Xeolóxico Laxe 2003, 28, 173–192. [Google Scholar]
  27. Afonso, M.J.; Marques, J.M.; Guimarães, L.; Costa, I.; Teixeira, J.; Seabra, C.; Rocha, F.; Guilhermino, L.; Chaminé, H.I. Urban hydrogeology of the Paranhos sector, Porto city (NW Portugal): A geoenvironmental perspective. In Aquifer Systems Management: Darcy’s Legacy in a World of Impending Water Shortage; Chery, L., Marsily, G., Eds.; Selected Papers on Hydrogeology; IAH/Taylor & Francis CRC Press: London, UK, 2007; SP10; pp. 391–406. [Google Scholar]
  28. Afonso, M.J. Hidrogeologia e Hidrogeoquímica da Região Litoral Urbana do Porto, Entre Vila do Conde e Vila Nova de Gaia (NW de Portugal): Implicações Geoambientais. Ph.D. Thesis, Universidade Técnica de Lisboa, Lisbon, Portugal.
  29. COBA—Consultores de Engenharia e Ambiente, SA. Carta Geotécnica do Porto, 2nd ed.; COBA/FCUP/CMP: Porto, Portugal, 2003. [Google Scholar]
  30. Von Eschwege, W.L. Geognostische Verhältnisse der Gegend von Porto, nebst einer Beschreibung des bei S. Pedro da Cova gelegenen Steinkohlenlagers, welches die Uebergangsbildung von der Urbildung trennt. Arch. Miner. Geognos Bergbau Hüttenkd 1833, 6, 264–276. [Google Scholar]
  31. Sharpe, D. On the geology of the neighbourhood of OPorto, including the Silurian coal and slates of Vallongo. Q. J. Geol. Soc. Lond. Proc. 1849, 5, 142–153. [Google Scholar] [CrossRef]
  32. Carríngton da Costa, J. O Pôrto: Geografia-Geologia; Bastos, C., Ed.; Nova Monografia do Porto, Companhia Portuguesa do Porto: Porto, Portugal, 1938; pp. 3–32. [Google Scholar]
  33. Montenegro de Andrade, M. O “Granito do Porto”: Síntese, crítica e novos elementos para o seu conhecimento. In Sumários, IV Reunião de Geologia do Oeste Peninsular; Salamanca-Coimbra: Porto, Portugal, 1976; 2p. [Google Scholar]
  34. Chaminé, H.I.; Gama Pereira, L.C.; Fonseca, P.E.; Noronha, F.; Lemos de Sousa, M.J. Tectonoestratigrafia da faixa de cisalhamento de Porto–Albergaria-a-Velha–Coimbra–Tomar, entre as Zonas Centro-Ibérica e de Ossa-Morena (Maciço Ibérico, W de Portugal). Cadernos Laboratório Xeolóxico Laxe 2003, 28, 37–78. [Google Scholar]
  35. Almeida, A. Geology and urban landscape: The granite in Oporto, NW Portugal. Eur. Geol. J. 2006, 21, 4–8. [Google Scholar]
  36. Rosas da Silva, D.J. Depósitos de evansite nos granitos do Porto (Portugal). Anais Faculdade Ciências Pôrto 1935, 19, 1–8. [Google Scholar]
  37. Sanchez-Moral, S.; Fernandez-Cortes, A.; Cuezva, S.; Cañaveras, J.C.; Correcher, V.; Miller, A.Z.; Dionisio, A.; Marques, J.M.; Saiz-Jimenez, C.; Afonso, M.J.; et al. Uranyl-evansites from Porto (NW Portugal) and Galicia (NW Spain): Structure and assignment of spectra catholuminescence and raman bands. Spectrosc. Lett. 2011, 44, 511–515. [Google Scholar] [CrossRef]
  38. Begonha, A.; Sequeira Braga, M.A. Weathering of the Oporto granite: Geotechnical and physical properties. Catena 2002, 49, 57–76. [Google Scholar] [CrossRef]
  39. Fontes, A. Contribuição Para a Hygiene do Porto: Analyse Sanitaria do seu Abastecimento em Água Potável. I. Estudo dos Mananciaes de Paranhos e Salgueiros. Bachelor’s Thesis, Escola Médico-Cirúrgica do Porto, Porto, Portugal, 1908. [Google Scholar]
  40. Chaminé, H.I.; Afonso, M.J.; Robalo, P.M.; Rodrigues, P.; Cortez, C.; Monteiro Santos, F.A.; Plancha, J.P.; Fonseca, P.E.; Gomes, A.; Devy-Vareta, N.F.; et al. Urban speleology applied to groundwater and geo-engineering studies: Underground topographic surveying of the ancient Arca D’Água galleries catchworks (Porto, NW Portugal). Int. J. Speleol. 2010, 39, 1–14. [Google Scholar] [CrossRef]
  41. Chaminé, H.I.; Afonso, M.J.; Freitas, L. From historical hydrogeological inventory through GIS mapping to problem solving in urban groundwater systems. Eur. Geol. J. 2014, 38, 33–39. [Google Scholar]
  42. Freitas, L.; Afonso, M.J.; Devy-Vareta, N.; Marques, J.M.; Gomes, A.; Chaminé, H.I. Coupling hydrotoponymy and GIS cartography: A case study of hydro-historical issues in urban groundwater systems, Porto, NW Portugal. Geogr. Res. 2014, 52, 182–197. [Google Scholar] [CrossRef]
  43. European Environment Agency (EEA). CLC2006 Technical Guidelines: Update of Corine Land Cover (CLC) for the Reference Year 2006; European Environment Agency: Copenhagen, Denmark, 2007. [Google Scholar]
  44. Telles Ferreira, A.G. Carta Topográfica da Cidade do Porto; Direcção-Geral dos Trabalhos Geodésicos, Topográficos, Hidrográficos e Geológicos do Reino: Lisboa, Portugal, 1892. [Google Scholar]
  45. Madureira, H. Processos de transformação da estrutura verde do Porto. Geografia 2001–2002, 17–18, 137–218. [Google Scholar]
  46. Madureira, H.; Andresen, T.; Monteiro, A. Green structure and planning evolution in Porto. Urban For. Urban Green. 2011, 10, 141–149. [Google Scholar] [CrossRef]
  47. International Society for Rock Mechanics (ISRM). Basic geotechnical description of rock masses. Int. J. Rock Mech. Min. Sci. 1981, 18, 85–110. [Google Scholar]
  48. Struckmeier, W.F.; Margat, J. Hydrogeological Maps: A Guide and a Standard Legend; IAH International Contributions to Hydrogeology; Verlag Heinz Heise: Hannover, Germany, 1995. [Google Scholar]
  49. Committee on Fracture Characterization and Fluid Flow (CFCFF). Rock Fractures and Fluid Flow: Contemporary Understanding and Applications; National Academy Press: Washington, DC, USA, 1996. [Google Scholar]
  50. Assaad, F.A.; LaMoreaux, P.E.; Hughes, T.H.; Wangfang, Z.; Jordan, H. Field Methods for Geologists and Hydrogeologists; Springer: Berlin/Heidelberg, Germany, 2004. [Google Scholar]
  51. Zaporozec, A. (Ed.) Groundwater Contamination Inventory: A Methodological Guide with a Model Legend for Groundwater Contamination Inventory and Risk Maps; UNESCO, IHP-VI, Series on Groundwater, 2; UNESCO: Paris, France, 2004.
  52. Giesemann, A.; Jaeger, H.J.; Norman, A.-L.; Krouse, H.R.; Brand, W.A. On-line sulfur-isotope determination using an elemental analyzer coupled to a mass spectrometer. Anal. Chem. 1994, 66, 2816–2819. [Google Scholar] [CrossRef]
  53. Mayer, B.; Krouse, H.R. Procedures for sulfur isotope abundance studies. In Handbook of Stable Isotope Analytical Techniques; De Groot, P., Ed.; Elsevier: Amsterdam, The Netherlands, 2004; pp. 538–596. [Google Scholar]
  54. American Society for Testing and Materials (ASTM). Standard Test Method for Radon in Drinking Water; ASTM-D5072-09(2016); ASTM International: Philadelphia, PA, USA, 2016. [Google Scholar]
  55. Forte, M.; Rusconi, R.; Badalamenti, P.; Bellinzona, S.; Gollini, R.; Maltese, S.; Romeo, C.; Sgorbati, G. The monitoring of tap waters in Milan: Planning methods and results. Radiat. Prot. Dosim. 2004, 111, 373–376. [Google Scholar]
  56. Gonçalves, C.V.M.; Pereira, A.J.S.C. Radionuclides in groundwater of the Serra do Buçaco region (Portugal). In Groundwater and Ecosystems: Lisbon 2007: Proceedings: XXXV IAH Congress, International Association of Hydrogeologists, CD-Rom ed.; Ribeiro, L., Chambel, A., Condesso de Melo, M.T., Eds.; IAH: Lisbon, Portugal, 2007; 9p. [Google Scholar]
  57. Van Stempvoort, D.; Evert, L.; Wassenaar, L. Aquifer vulnerability index: A GIS compatible method for groundwater vulnerability mapping. Can. Water Resour. J. 1993, 18, 25–37. [Google Scholar] [CrossRef]
  58. Foster, S.D. Fundamental concepts in aquifer vulnerability, pollution risk and protection strategy. In Vulnerability of Soil and Groundwater to Pollutants, Proceedings and Information; Duijvenbooden, W., van Waegeningh, H.G., Eds.; TNO Committee on Hydrological Research: The Hague, The Netherlands, 1987; Volume 38, pp. 69–86. [Google Scholar]
  59. Foster, S.D.; Hirata, R. Groundwater Pollution Risk Assessment: A Methodology Using Available Data; WHO-PAHO/HPE-CEPIS Technical Manual; Pan American Center for Sanitary Engineering and Environmental Sciences: Lima, Peru, 1988. [Google Scholar]
  60. Foster, S.D.; Hirata, R.; Gomes, D.; D’Elia, M.; Paris, M. Groundwater Quality Protection: A Guide for Water Utilities, Municipal Authorities, and Environment Agencies; The World Bank: Washington, DC, USA, 2002. [Google Scholar]
  61. Aller, L.; Bennet, T.; Lehr, J.H.; Petty, R.J. DRASTIC: A Standardised System for Evaluating Groundwater Pollution Potential Using Hydrologic Settings; US EPA Report, 600/2-87/035; Robert S. Kerr Environmental Research Laboratory: Ada, OK, USA, 1987. [Google Scholar]
  62. Denny, S.C.; Allen, D.N.; Journeay, J.M. DRASTIC-Fm: A modified vulnerability mapping method for structurally controlled aquifers in the southern Gulf Islands, British Columbia, Canada. Hydrogeol. J. 2007, 15, 483–493. [Google Scholar] [CrossRef]
  63. Civita, M.V. Le Carte Della Vulnerabilità degli Acquiferi All’inquinamento: Teoria & Pratica; Pitagora Editrice: Bologna, Italy, 1994. [Google Scholar]
  64. Civita, M.V.; De Maio, M. Valutazione e Cartografia Automatica della Vulnerabilità Degli Acquiferi All’inquinamento Con il Sistema Parametrico: SINTACS R5; Pitagora Editrice: Bologna, Italy, 2000. [Google Scholar]
  65. Organisation for Economic Co-operation and Development (OECD). OECD Guidelines for Testing of Chemicals, Revised Protocol for Updating Guideline 202, Daphnia sp.; Acute Immobilisation Test; OECD: Paris, France, 2004. [Google Scholar]
  66. Baird, D.J.; Barber, I.; Bradley, M.; Calow, L.; Soares, A.M.V.M. The Daphnia bioassay: A critique. Hydrobiologia 1989, 188/189, 403–406. [Google Scholar] [CrossRef]
  67. American Society for Testing and Materials (ASTM). Standard Practice for Conducting Acute Toxicity Tests with Fishes; Macroinvertebrates and Amphibians; ASTM E729-96(2014); ASTM International: Philadelphia, PA, USA, 2014. [Google Scholar]
  68. Baird, D.J.; Soares, A.M.V.M.; Girling, A.; Barber, I.; Bradley, M.; Callow, P. The long-term maintenance of Daphnia magna Straus for use in ecotoxicity tests: Problems and prospects. In Proceedings First European Conference on Ecotoxicology; Løkke, H., Tyle, H., Bro-Rasmussen, F., Eds.; Danish Ministry of Environment: Lyngby, Denmark, 1989; pp. 144–148. [Google Scholar]
  69. Carteado Mena, J. Contribuição Para o Estudo da Hygiene do Porto: Analyse Sanitaria do seu Abastecimento em Água Potável. III. Estudo Sobre os Poços do Porto; Unpublished Report; Laboratório de Bacteriologia do Porto e Laboratório de Hygiene do Porto: Porto, Portugal, 1908. (In Portuguese) [Google Scholar]
  70. Bahia Junior, J. Contribuição Para a Hygiene do Porto: Analyse Sanitaria do seu Abastecimento em Agua Potavel. Porto: II—Mananciaes do Campo Grande, Bispo e Freiras, Cavaca, Camões, Virtudes, Fontaínhas, Praça do Marquês de Pombal e Burgal: Fontes suas Derivadas de Nascente Privativa. Bachelor’s Thesis, Escola Médico-Cirúrgica do Porto, Porto, Portugal, 1909. [Google Scholar]
  71. Attard, G.; Winiarski, T.; Rossier, Y.; Eisenlohr, L. Review: Impact of underground structures on the flow of urban groundwater. Hydrogeol. J. 2016, 24, 5–19. [Google Scholar] [CrossRef]
  72. Krouse, H.R.; Mayer, B. Sulphur and oxygen isotopes in sulphate. In Environmental Tracers in Subsurface Hydrogeology, 2nd ed.; Cook, P., Herczeg, A.L., Eds.; Kluwer Academic Publishers: Boston, MA, USA, 2001; pp. 195–231. [Google Scholar]
  73. Hosono, T.; Nakano, T.; Igeta, A.; Tayasu, I.; Tanaka, T.; Yachi, S. Impact of fertilizer on a small watershed of Lake Biwa: Use of sulfur and strontium isotopes in environmental diagnosis. Sci. Total Environ. 2007, 384, 342–354. [Google Scholar] [CrossRef] [PubMed]
  74. Pauwels, H.; Ayraud-Vergnaud, V.; Aquilina, L.; Molénat, J. The fate of nitrogen and sulfur in hard-rock aquifers as shown by sulfate-isotope tracing. Appl. Geochem. 2010, 25, 105–115. [Google Scholar] [CrossRef]
  75. Desideri, D.; Meli, M.A.; Feduzi, L.; Roselli, C.; Rongoni, A.; Saetta, D. 238U, 234U, 226Ra, 210Po concentrations of bottled mineral waters in Italy and their dose contribution. J. Environ. Radioact. 2007, 94, 86–97. [Google Scholar] [CrossRef] [PubMed]
  76. Fan, K.; Kuo, T.; Han, Y.; Chen, C.; Lin, C.; Lee, C. Radon distribution in a gasoline-contaminated aquifer. Radiat. Meas. 2007, 42, 479–485. [Google Scholar] [CrossRef]
  77. Galhardi, J.A.; Bonotto, D.M. Radon in groundwater contaminated by dissolved hydrocarbons in Santa Bárbara d’Oeste, São Paulo State, Brazil. Appl. Radiat. Isot. 2012, 70, 2507–2515. [Google Scholar] [CrossRef] [PubMed]
  78. Pereira, A.J.S.C.; Godinho, M.M.; Neves, L.J.P.F. On the influence of faulting on small-scale soil-gas radon variability: A case study in the Iberian Uranium Province. J. Environ. Radioact. 2010, 101, 875–882. [Google Scholar] [CrossRef] [PubMed]
  79. Skeppström, K.; Olofsson, B. Uranium and radon in groundwater: An overview of the problem. Eur. Water 2007, 17/18, 51–62. [Google Scholar]
  80. Miller, A.Z.; Dionísio, A.; Sequeira Braga, M.A.; Hernández-Mariné, M.; Afonso, M.J.; Muralha, V.S.F.; Herrera, L.K.; Raabe, J.; Fernandez-Cortes, A.; Cuezva, S.; et al. Biogenic Mn oxide minerals coating in a subsurface granite environment. Chem. Geol. 2012, 322/323, 181–191. [Google Scholar] [CrossRef]
  81. Ferris, F.G.; Hallberg, R.O.; Lyvén, B.; Pedersen, K. Retention of strontium, cesium, lead and uranium by bacterial iron oxides from a subterranean environment. Appl. Geochem. 2000, 15, 1035–1042. [Google Scholar] [CrossRef]
  82. Miller, A.Z.; Hernández-Mariné, M.; Jurado, V.; Dionísio, A.; Barquinha, P.; Fortunato, E.; Afonso, M.J.; Chaminé, H.I.; Saiz-Jimenez, C. Enigmatic reticulated filaments in subsurface granite. Environ. Microbiol. Rep. 2012, 4, 596–603. [Google Scholar] [CrossRef] [PubMed]
  83. Speirs, L.; Nittami, T.; McIlroy, S.; Schroeder, S.; Seviour, R.J. Filamentous bacterium Eikelboom type 0092 in activated sludge plants in Australia is a member of the phylum Chloroflexi. Appl. Environ. Microbiol. 2009, 75, 2446–2452. [Google Scholar] [CrossRef] [PubMed]
  84. Jurado, V.; Laiz, L.; Rodriguez-Nava, V.; Boiron, P.; Hermosin, B.; Sanchez-Moral, S.; Saiz-Jimenez, C. Pathogenic and opportunistic microorganisms in caves. Int. J. Speleol. 2010, 39, 15–24. [Google Scholar] [CrossRef] [Green Version]
  85. Scott, G.; Crunkilton, R.L. Acute and chronic toxicity of nitrate to fathead minnows (Pimephales promelas), Ceriodaphnia dubia, and Daphnia Magna. Environ. Toxicol. Chem. 2000, 19, 2918–2922. [Google Scholar] [CrossRef]
  86. Hagger, J.A.; Jones, M.B.; Lowe, D.; Leonard, D.R.P.; Owen, R.; Galloway, T.S. Application of biomarkers for improving risk assessments of chemicals under the Water Framework Directive: A case study. Mar. Pollut. Bull. 2008, 56, 1111–1118. [Google Scholar] [CrossRef] [PubMed]
Figure 1. Flowchart of the GIS-based methodology applied to the study of Paranhos and Salgueiros spring galleries.
Water 08 00499 g001
Figure 2. Land use areas in the surroundings of Paranhos and Salgueiros spring galleries. (A) Around 1900: main sources of water supply at the beginning of the 20th century are also presented; (B) Present-day; hydrogeological inventory.
Water 08 00499 g002
Figure 3. Hydrogeological units and potential contamination sources around Paranhos and Salgueiros spring galleries.
Water 08 00499 g003
Figure 4. Groundwater radon concentrations (A); granitic gutter pipe (B1); water flow from a granitic fracture covered by black ferromanganese biomineralisations (B2); and hydrogeochemical facies (C) of Paranhos and Salgueiros waters.
Water 08 00499 g004
Figure 5. Concentration for groundwater radionuclides from Paranhos and Salgueiros spring galleries, in the granitic gutter pipe, group I (left) and the granitic rock fractures, group II (right).
Water 08 00499 g005
Figure 6. Some aspects of features related with Paranhos and Salgueiros spring galleries around 1900 and at present-day; (A.1) Regado fontain; (A.2) Arca d’Água reservoir; (A.3) confluence of the Paranhos and the Salgueiros galleries; AVI (B) and GODS (C,D) vulnerability maps, and potential contamination sources for the present-day scenario.
Water 08 00499 g006
Figure 7. DRASTIC (A,B) and DRASTIC-Fm (C,D) vulnerability maps, and potential contamination sources for the present-day scenario.
Water 08 00499 g007
Figure 8. SINTACS vulnerability maps, and potential contamination sources for the present-day scenario.
Water 08 00499 g008
Figure 9. Groundwater ecotoxicology from Paranhos and Salgueiros spring galleries. Immobilization of D. magna juveniles following exposure in 96 h standard acute bioassays to groundwater samples collected in 2006 (white triangles) and 2007 (black triangles).
Water 08 00499 g009
Figure 10. Urban hydrogeological conceptual model (a) and hydrogeological features of the main aquifer systems (b) as resulted from the integrated approach (revised and updated from [28]).
Water 08 00499 g010
Table 1. Selected index vulnerability mapping methods to fissured hard-rocks.
MethodologyBrief DescriptionParameters *
DRASTU
DRASTIC [61]Point count system model for the evaluation of intrinsic vulnerability. This method considers seven parameters and the vulnerability index is given by the expression: DrDw + RrRw + ArAw + SrSW + TrTW + IrIw + CrCw, where index r refers to the range and w to the assigned weight. Eight vulnerability classes are considered: <80, 80–100, 100–120, 120–140, 140–160, 160–180, 180–200 and >200.++++++
GODS [58,59,60]Rating system model for the evaluation of intrinsic vulnerability. Adaptation of GOD method, where four parameters are considered. The ultimate integrated aquifer vulnerability index is the final product of component indices for these parameters. This method considers five vulnerability classes: 0.0–0.1 (negligible), 0.1–0.3 (low), 0.3–0.5 (moderate), 0.5–0.7 (high) and 0.7–1.0 (extreme).++++
AVI [57]Rating system model for the evaluation of intrinsic vulnerability. This method considers two parameters, both related to the unsatured zone. The aquifer vulnerability index is given by the hydraulic resistance (c) that results from the product of the two parameters. The method considers five classes: log(c) > 4 (extremely low), 3 < log(c) < 4 (low), 2 < log(c) < 3 (moderate), 1 < log(c) < 2 (high) and log(c) < 1 (extremely high).++
SINTACS [21,63,64]Point count system model for the evaluation of intrinsic vulnerability. Derived from DRASTIC, this method uses the same seven parameters as DRASTIC, but the rating and weighting procedure is more flexible. This method provides six strings of multiplier weights that can be used in parallel: normal, severe, seepage, karst, fissured and nitrates. The vulnerability index is given by the expression: SrSw + IrIw + NrNw + TrTw + ArAw + CrCw + SrSw, where r and w have the same meaning of DRASTIC. Six vulnerability classes are considered: 26–80 (very low), 80–105 (low), 105–140 (moderate), 140–186 (high), 186–210 (very high) and 210–260 (extremely high).++++++
DRASTIC-Fm (updated from [62])Point count system model for the evaluation of intrinsic vulnerability. Modified DRASTIC method that includes an additional eighth parameter: fractured media (Fm). The vulnerability index is given by the expression: DrDw + RrRw + ArAw + SrSW + TrTW + IrIw + CrCw + FmrFmw, where r and w have the same meaning of DRASTIC. The weight for Fm is 3. The same vulnerability classes of DRASTIC are assigned to this method. Fm parameter was derived from the tectonic lineaments density map and grouped into five classes (km of lineaments/km2): <4, 4–8, 8–12, 12–16 and > 16, with ratings of 2, 4, 6, 8 and 10, respectively.++++++
* D = depth to groundwater; R = recharge/infiltration; A = aquifer characteristics (lithology, weathering grade, hydraulic conductivity, groundwater confinement, fracturing degree); S = soil media; T = topography/slope; U = unsaturated zone characteristics (lithology, hydraulic conductivity).
+ parameters included in a given method.
parameters not included in a given method.

