The multi-temporal MCP is applied considering the forecast stage provided by STAFOM-RCM for both the selected river reaches. Therefore, the single-model configuration for MCP-MT is considered with M, number of available forecast, equal to 1.
The first analysis is performed by using the complete dataset of simulated forecasts to calibrate MCP-MT, i.e., for identifying the joint and marginal probability distributions.
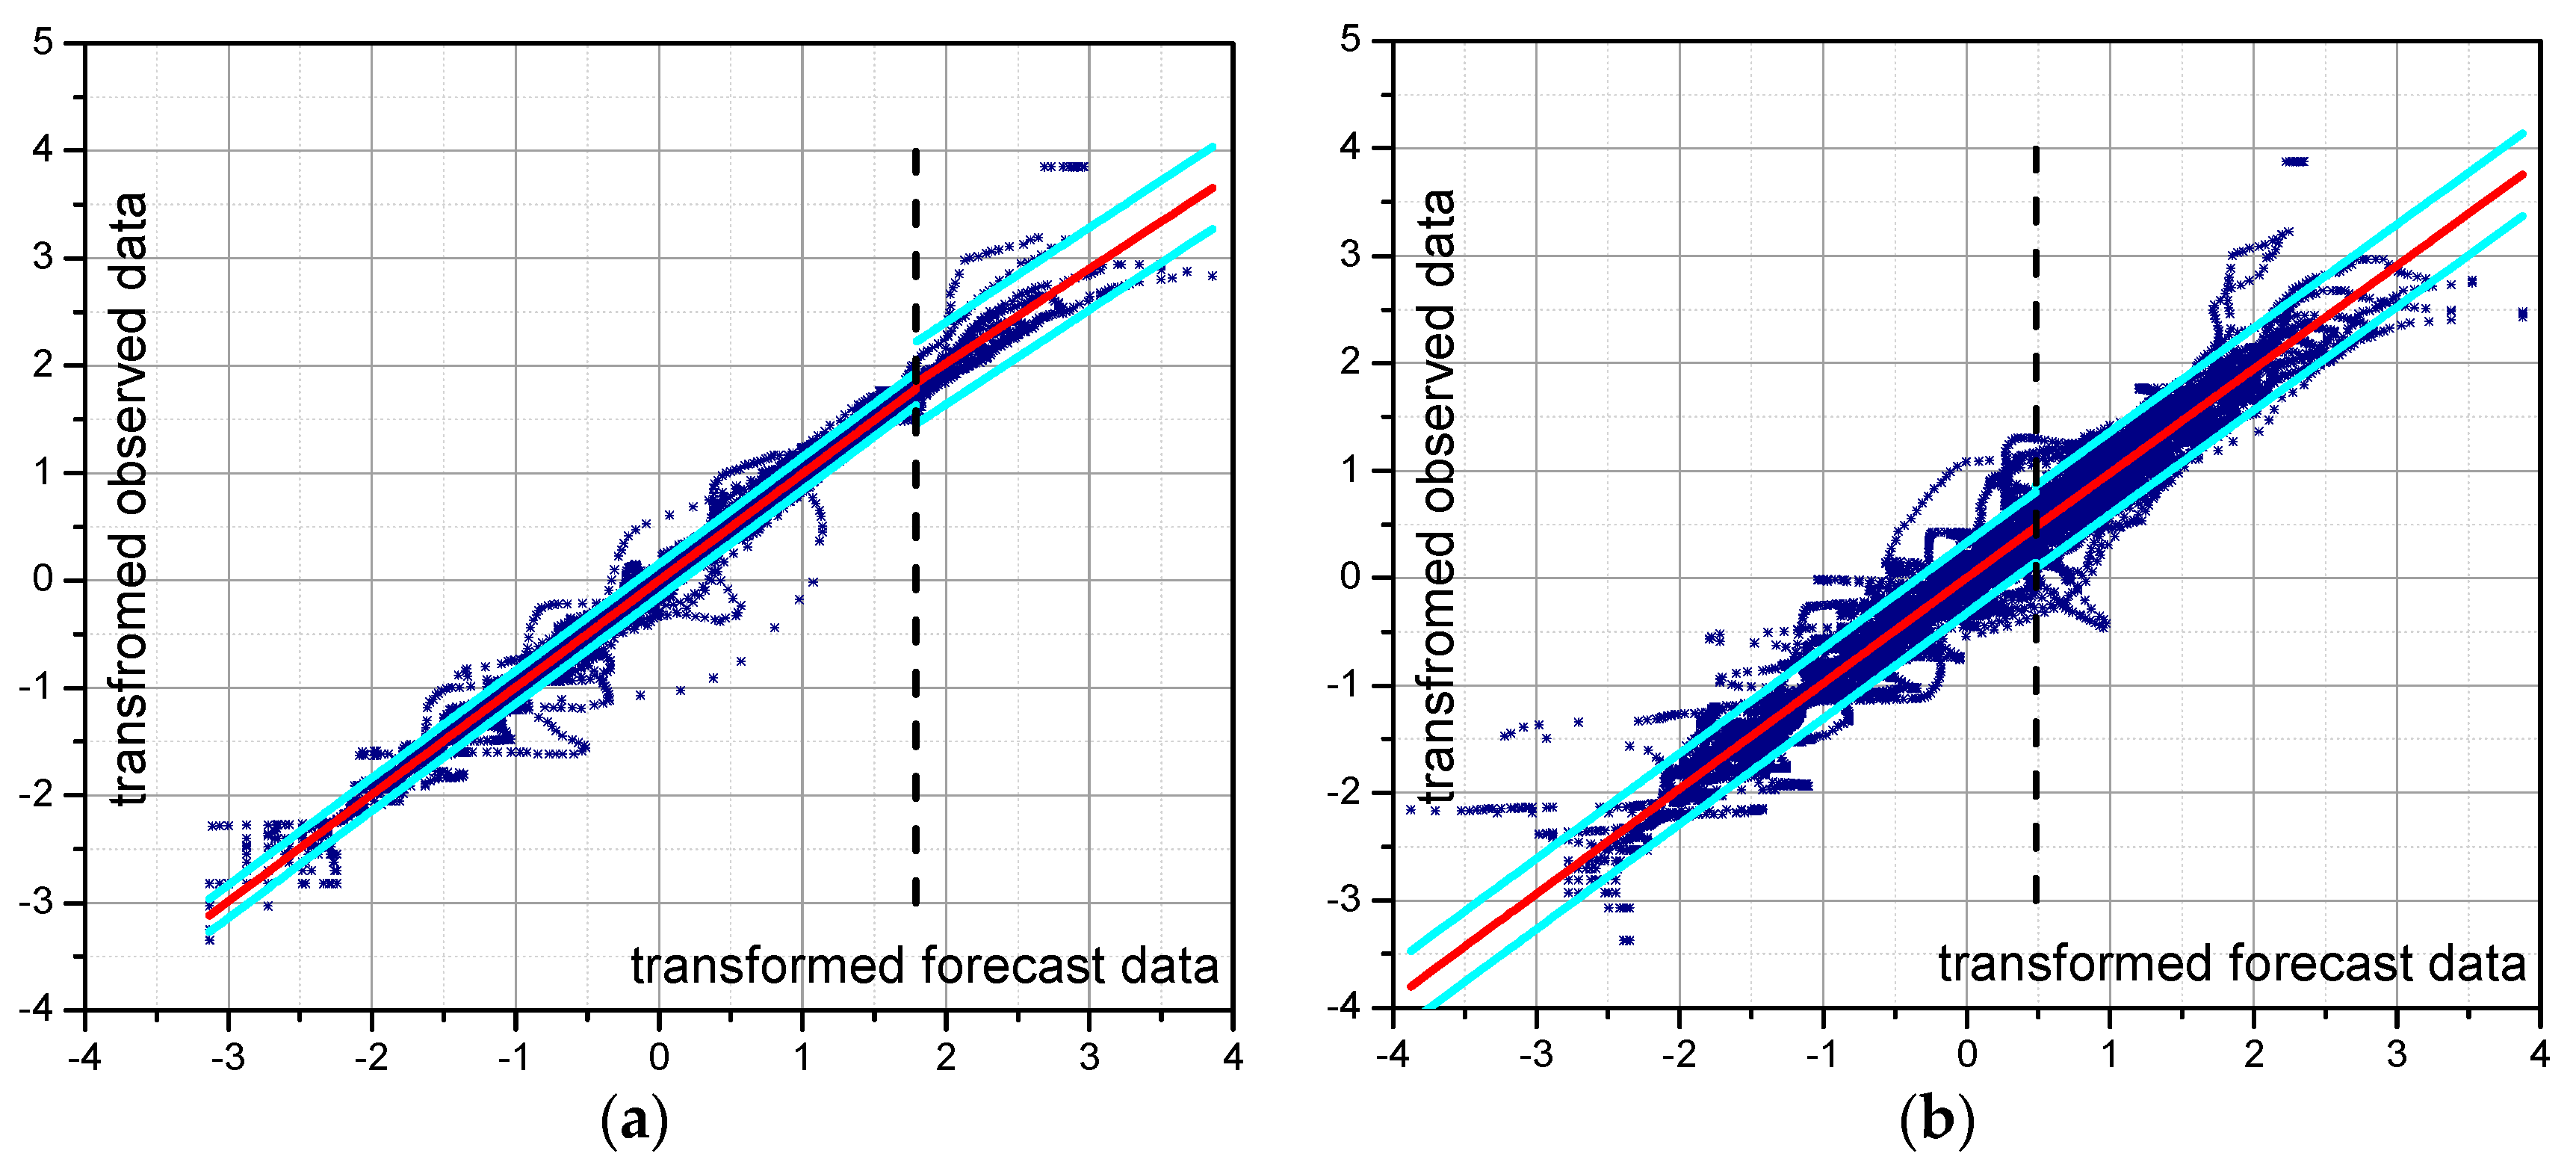
Figure 5 shows the joint distributions identified in the normal space for the forecasting model considering a lead-time of 12 h and 24 h for reach 1 and reach 2, respectively. The threshold automatically identified by the MCP-MT in order to optimize the sample data division for representing low and high flows separately is also depicted in the figure. The transformed of the forecast stage threshold,
ηtr, is equal to 1.79 when STAFOM-RCM is applied to reach 1 (
Figure 5a), while a different value of 0.5 is identified for reach 2 (
Figure 5b). Specifically, the threshold identified for reach 2 divides the data into two samples, the first corresponding to low flows that include 68% of the data and the second one referring to high flows and containing 32% of the entire sample.
It is worth noting that the data truncation for reach 1 (first sample referring to low-medium flows including 96% of data, second sample for high flows corresponding to 4% of the data) does not disagree with the hypothesis of homoscedasticity as the standard deviation of both samples is very similar. Moreover, it might be of interest to mention that a first study based on a different data sample spitting was attempted. Specifically, when dealing with flood forecasting four different states (peak flow, base flow and transitory states occurring during the rising and recession limbs) can be considered. To this end, the joint distribution can be assumed as composed by four TNDs. However, the first results seem to indicate that the MCP-MT performance is not significantly affected by using 2 or 4 samples and, hence, by the size of samples.
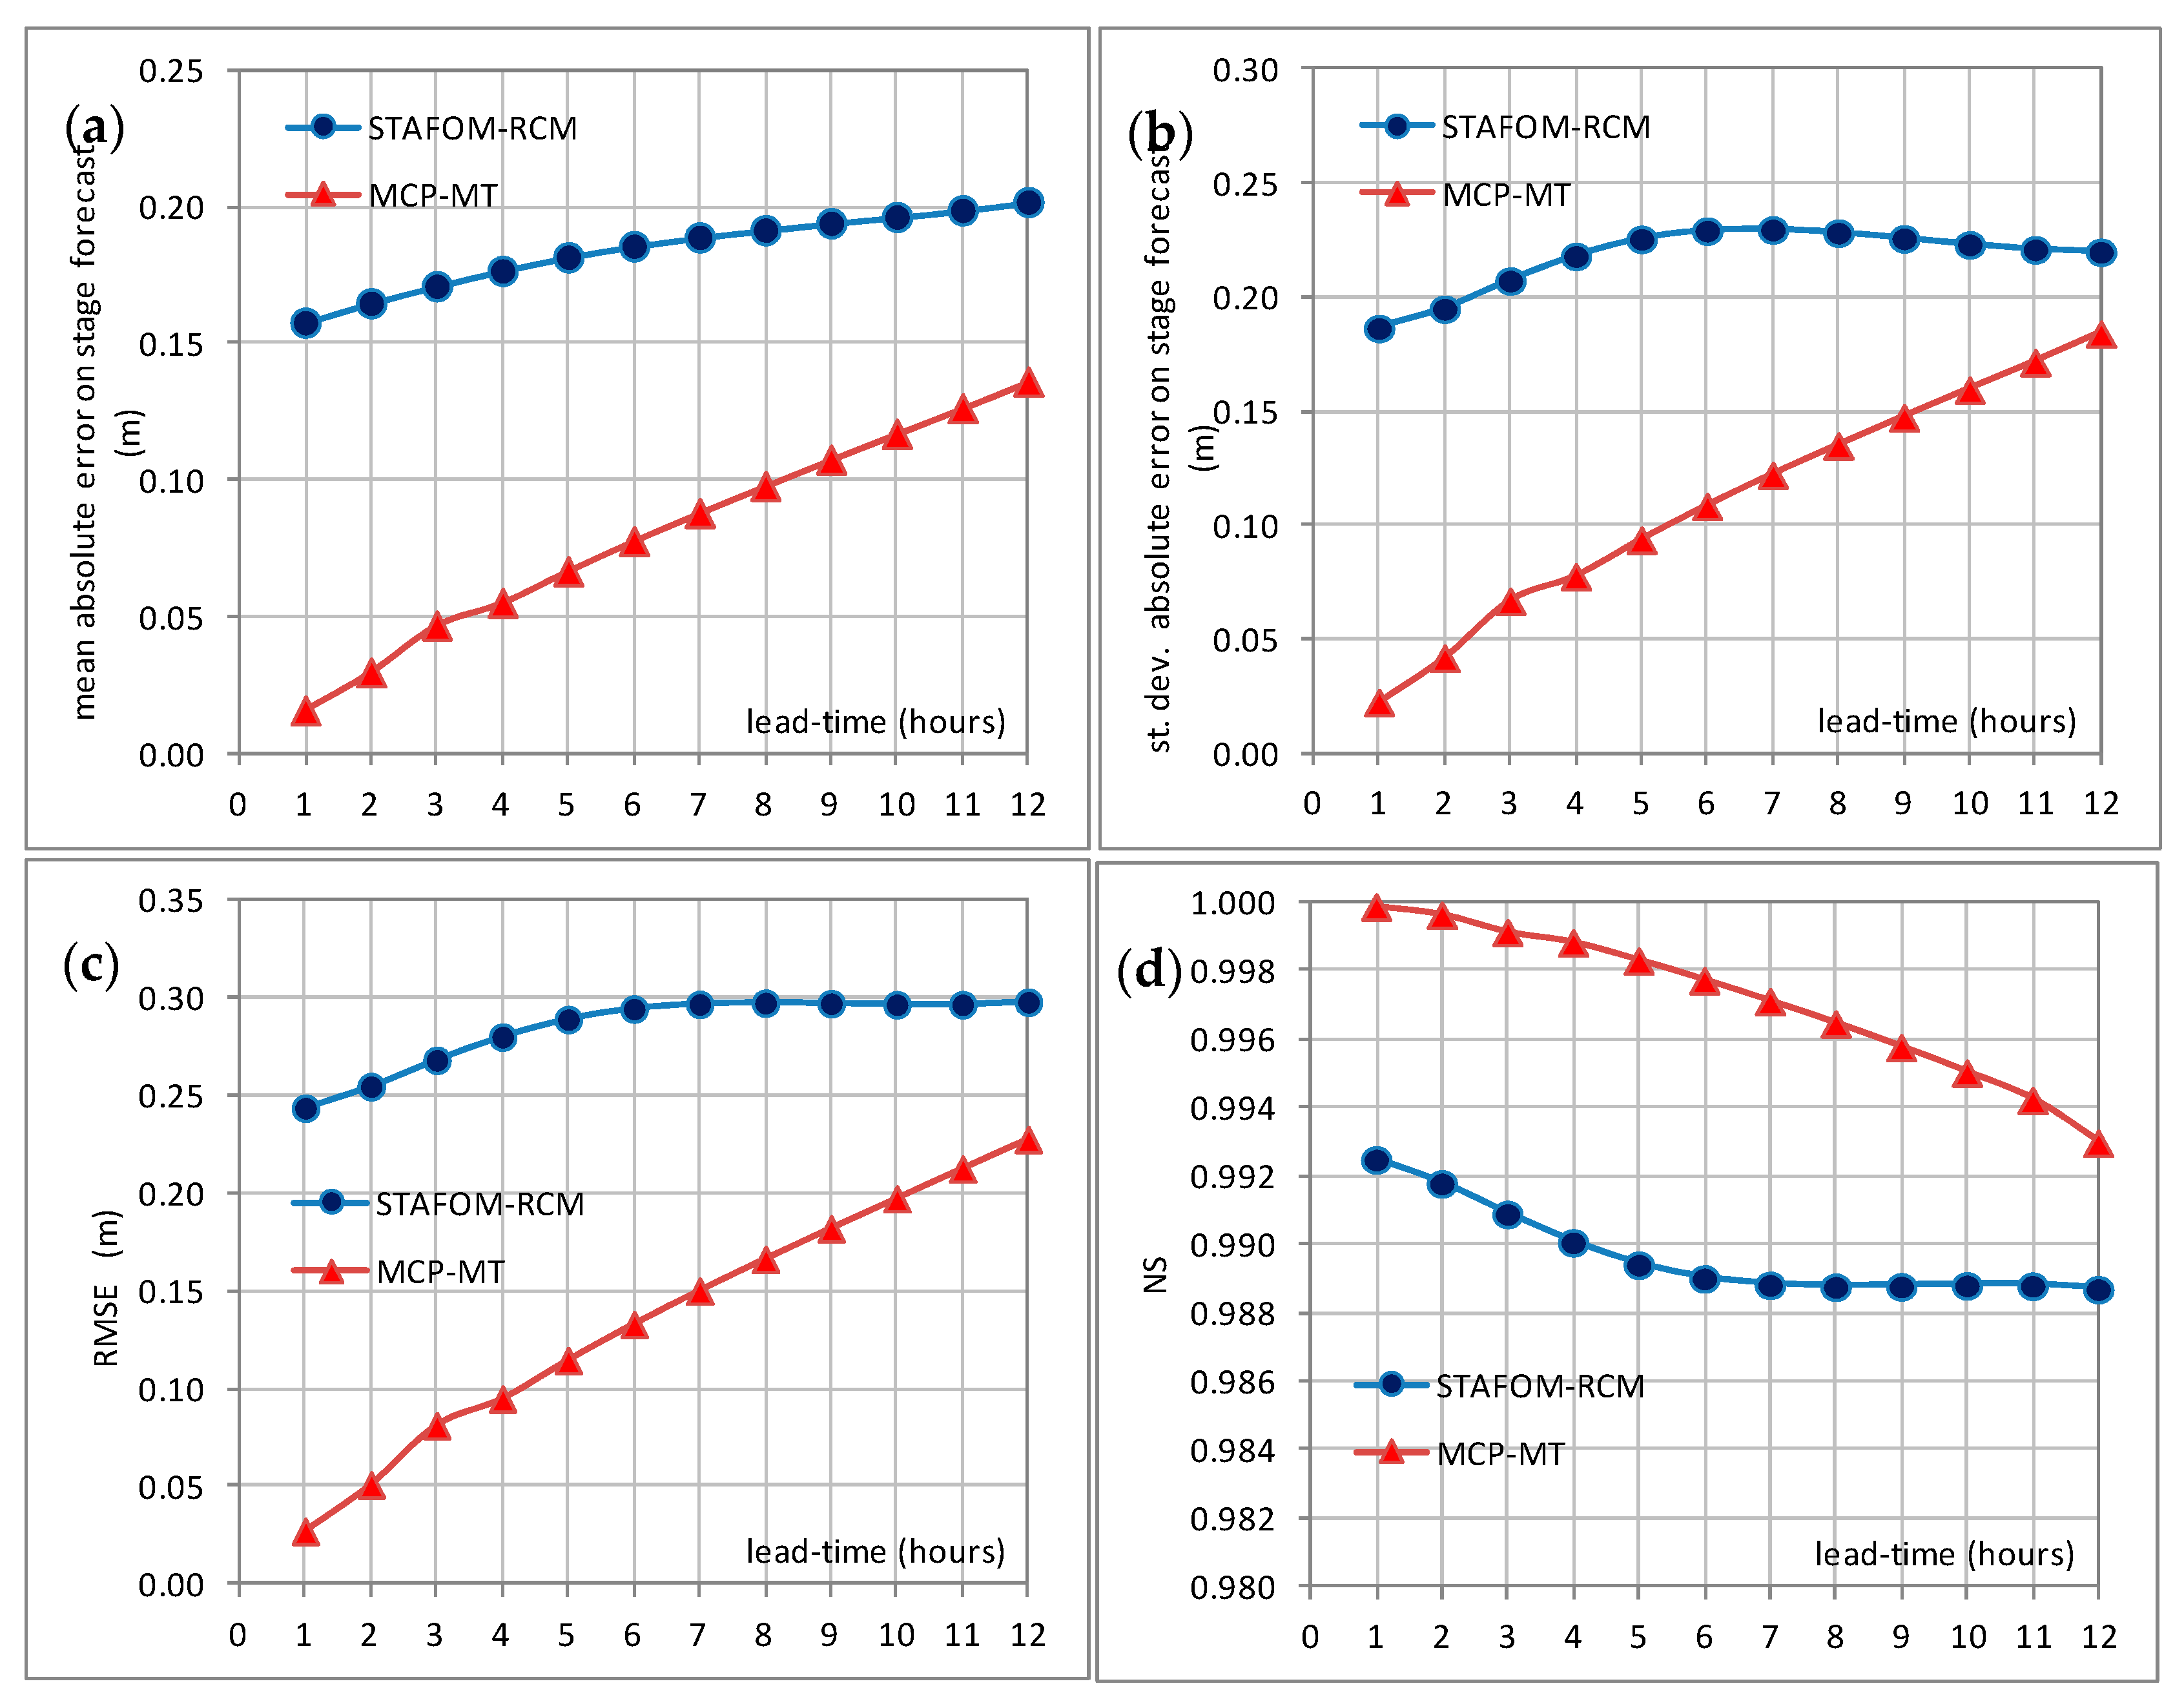
The results of the MCP multi-temporal approach for the two reaches are presented and discussed in the following in terms of the selected performance metrics (i.e., m, σ, RMSE, NS and PC). The analysis is based on the comparison of these evaluation indices computed for the deterministic forecasts and the expected value estimated by MCP-MT. Specifically, the benefits introduced by the PU estimate are discussed: (1) for a forecast horizon of 10 and 12 h for reach 1; and (2) for a lead-time of 20 and 24 h for reach 2.
The effect introduced by MCP-MT can be inferred from
Table 2 where a general reduction of the mean absolute error on stage forecast,
m, and the root mean square error can be observed for all the lead-times and for both the investigated reaches. Similarly, the standard deviation of the absolute error on stage forecast is lower for MCP-MT expected value than for the deterministic model, with the most significant reduction for the case of reach 2 and lead-time equal to 24 h. Moreover, the
NS values, already very high for the model performance, are found improved when the MCP-MT expected value is considered for all the case studies. Finally, a significant increase of
PC is observed for both the investigated reaches and all the selected lead-times, with values always higher than 0.55.
The PU estimate is, definitely, an added value compared to providing only the forecasts of the deterministic model and it is potentially useful for supporting real-time decision-making mainly because it can provide fundamental information on the hydrometric thresholds exceedance probability within the time forecast horizon. Moreover, it could be that the deterministic prediction giving only a single value does not exceed the threshold, while the PU lines overcome the critical level and this surely represents an added value.
5.3.1. Calibration and Validation
In order to better evaluate the performance of MCP-MT for the selected study areas, a division of the whole available data into calibration and validation datasets is also tested. To this end, the dataset is divided by considering the monsoon season of years 2001, 2002, 2003 and 2004 as calibration period and the monsoon season of years 2005, 2007 and 2010 as validation dataset for both the investigated river reaches. Therefore, the calibration time series consists of about 9000 and 10,000 hourly data for reach 1 and reach 2, respectively, while the validation dataset is made up of more than 8000 data for both the investigated Godavari River branches. The main results of this analysis are summarized in
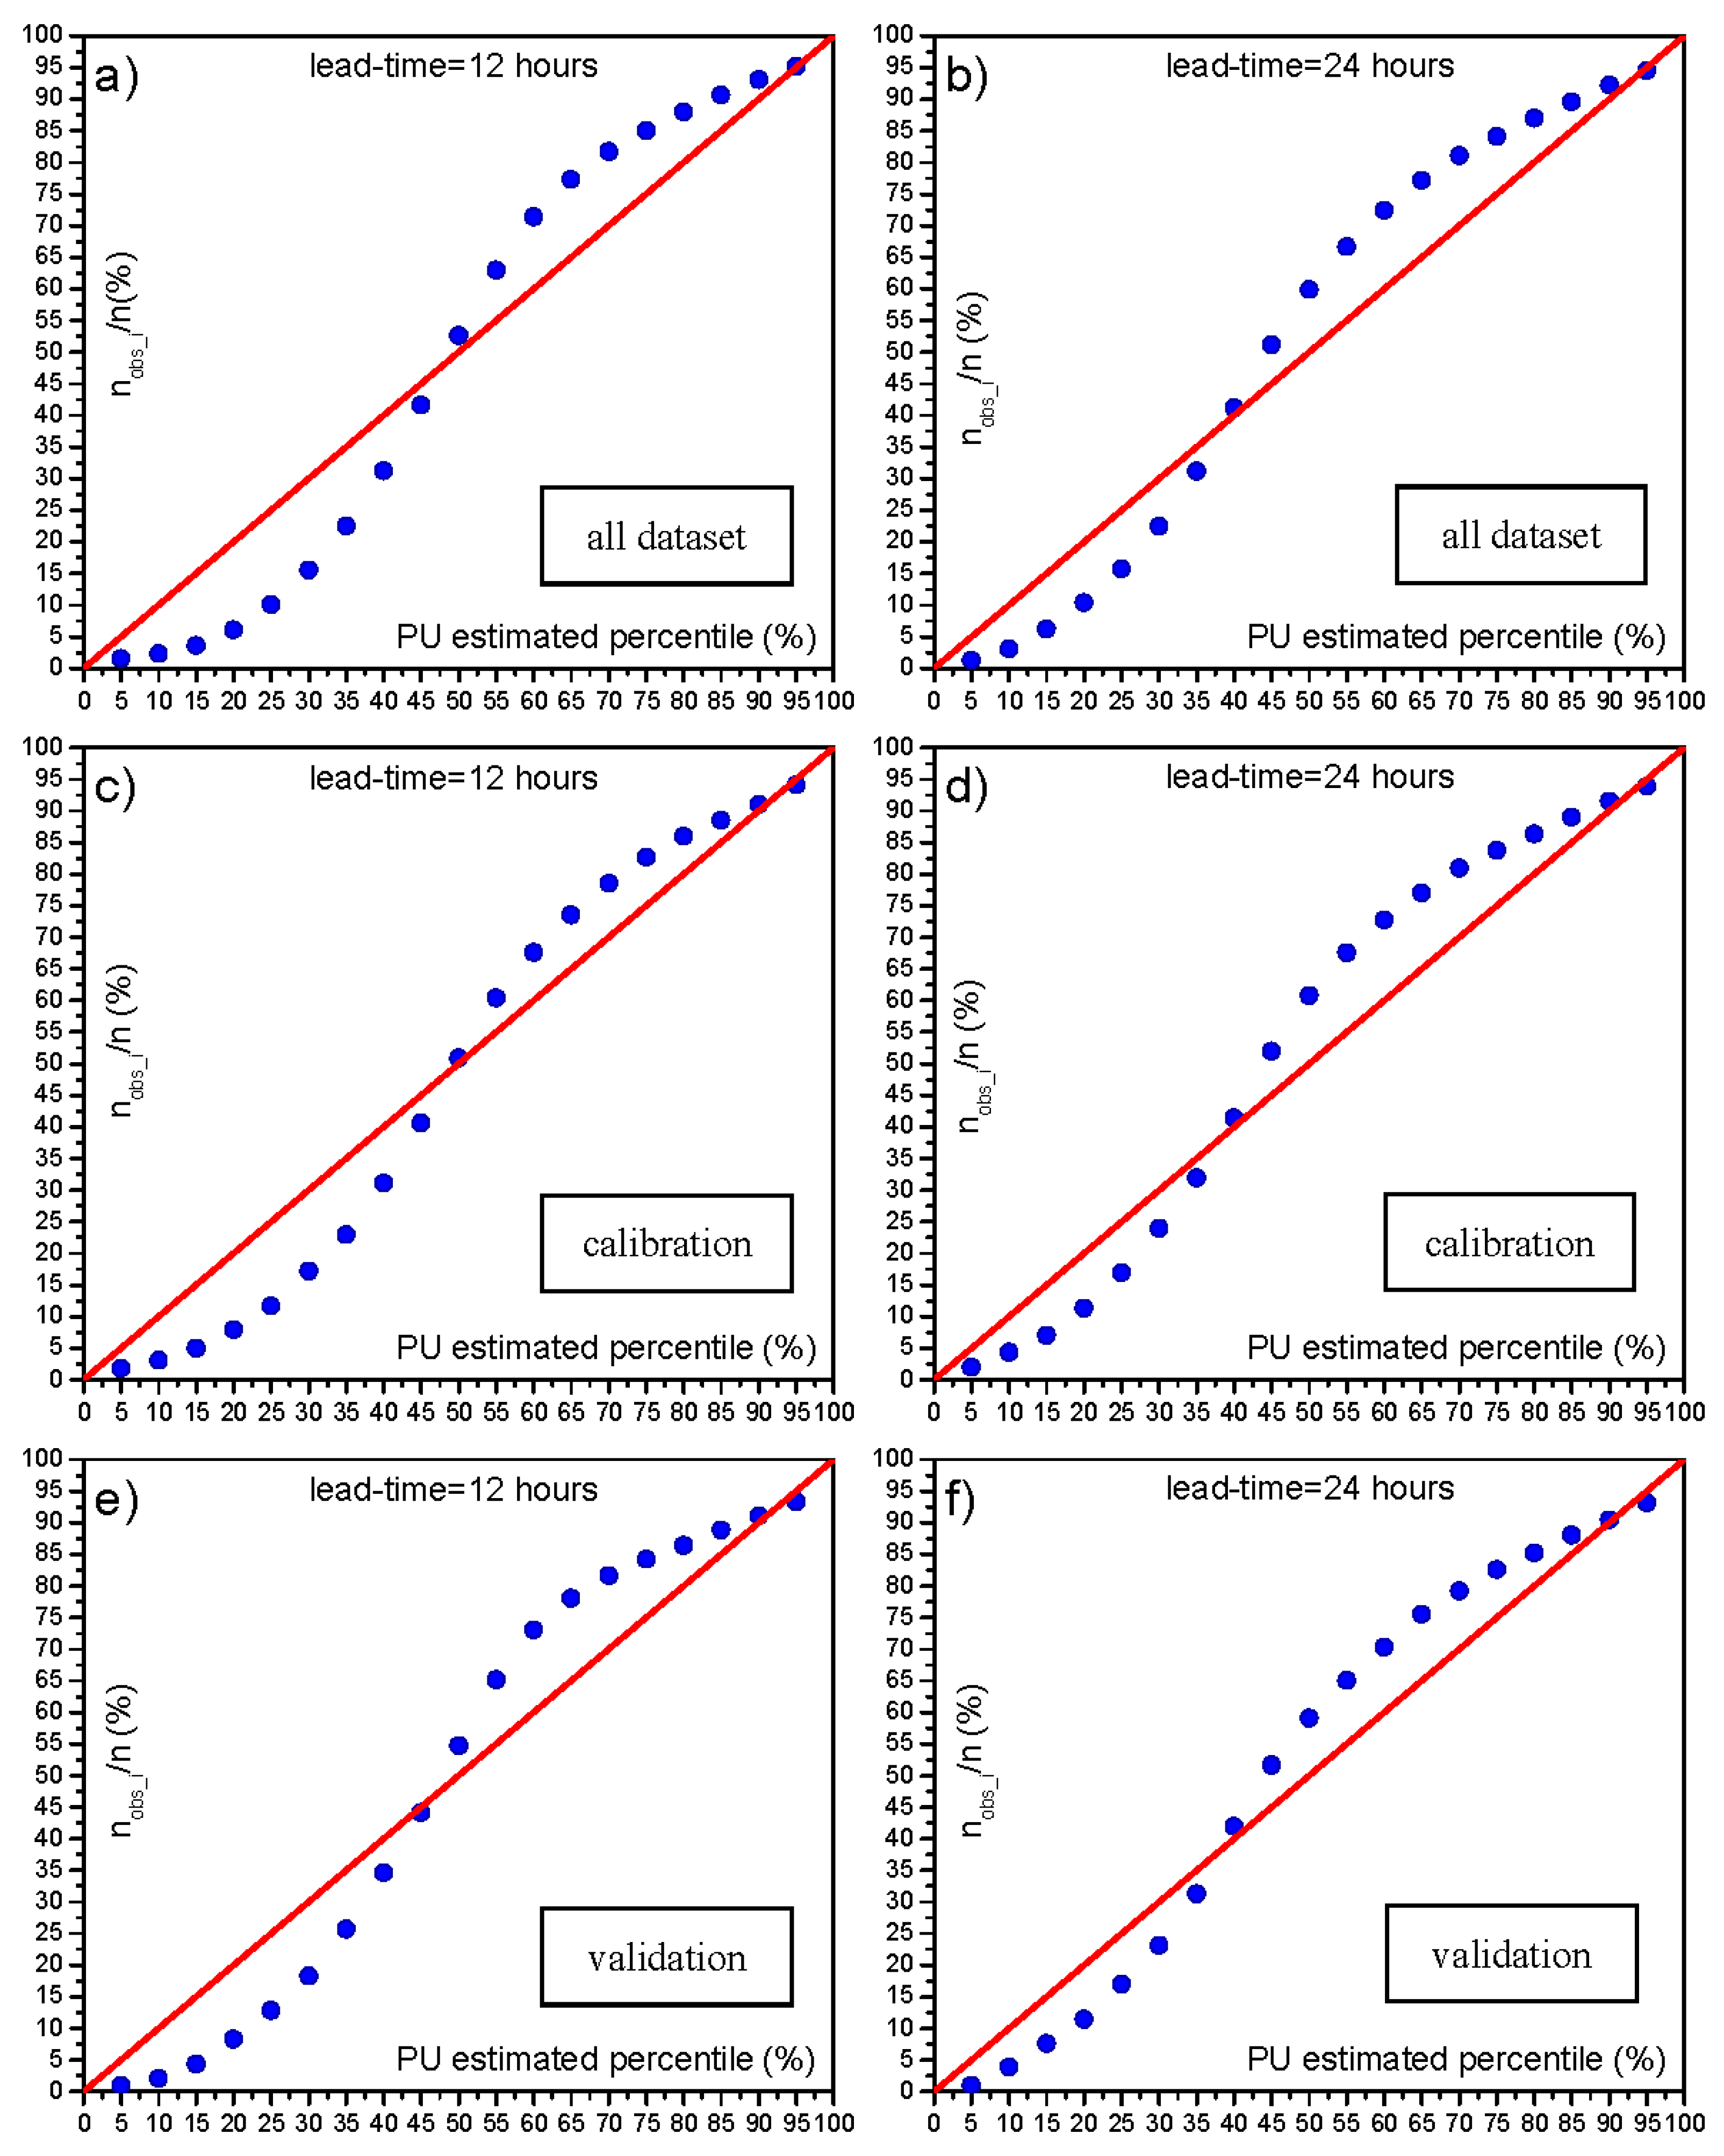
Figure 6c–f and in
Table 4 and
Table 5.
The benefit introduced by MCP-MT is demonstrated in
Table 4 where a general reduction of
m and
RMSE can be observed for both the investigated reaches and for both the calibration and validation period. Similarly,
σ is lower for MCP-MT expected value than for the deterministic model and
NS is improved when the MCP-MT expected value is considered. Moreover, an increase of
PC is always observed with values higher than 0.7 for MCP-MT.
Figure 6c,e shows the comparison between the PU estimated percentiles and the corresponding percentages of observed occurrences falling below each percentile for the MCP-MT based on the forecasts of STAFOM-RCM for reach 1 (lead-time = 12 h), considering the calibration and the validation dataset, respectively. As it can be seen, the PU estimated percentile for the calibration period quite well matches with corresponding observed frequencies, mainly for percentiles higher than 50%. The shape of the curve is similar to the one obtained by calibrating the MCP-MT considering the whole available dataset (
Figure 6a) and, hence, analogous considerations hold. It is worth noting that comparable results are achieved also for the validation dataset, shown in
Figure 6e. Similar considerations apply to the results based on the forecast model application to the longer reach with a lead-time of 24 h (see
Figure 6d,f).
Finally, it is verified that the 90% uncertainty band provided by MCP-MT includes a percentage of observed occurrences slightly higher than 90% (
Table 5) and is characterized by very low increase of the mean width from the calibration to the validation dataset, with a slightly decreased standard deviation.
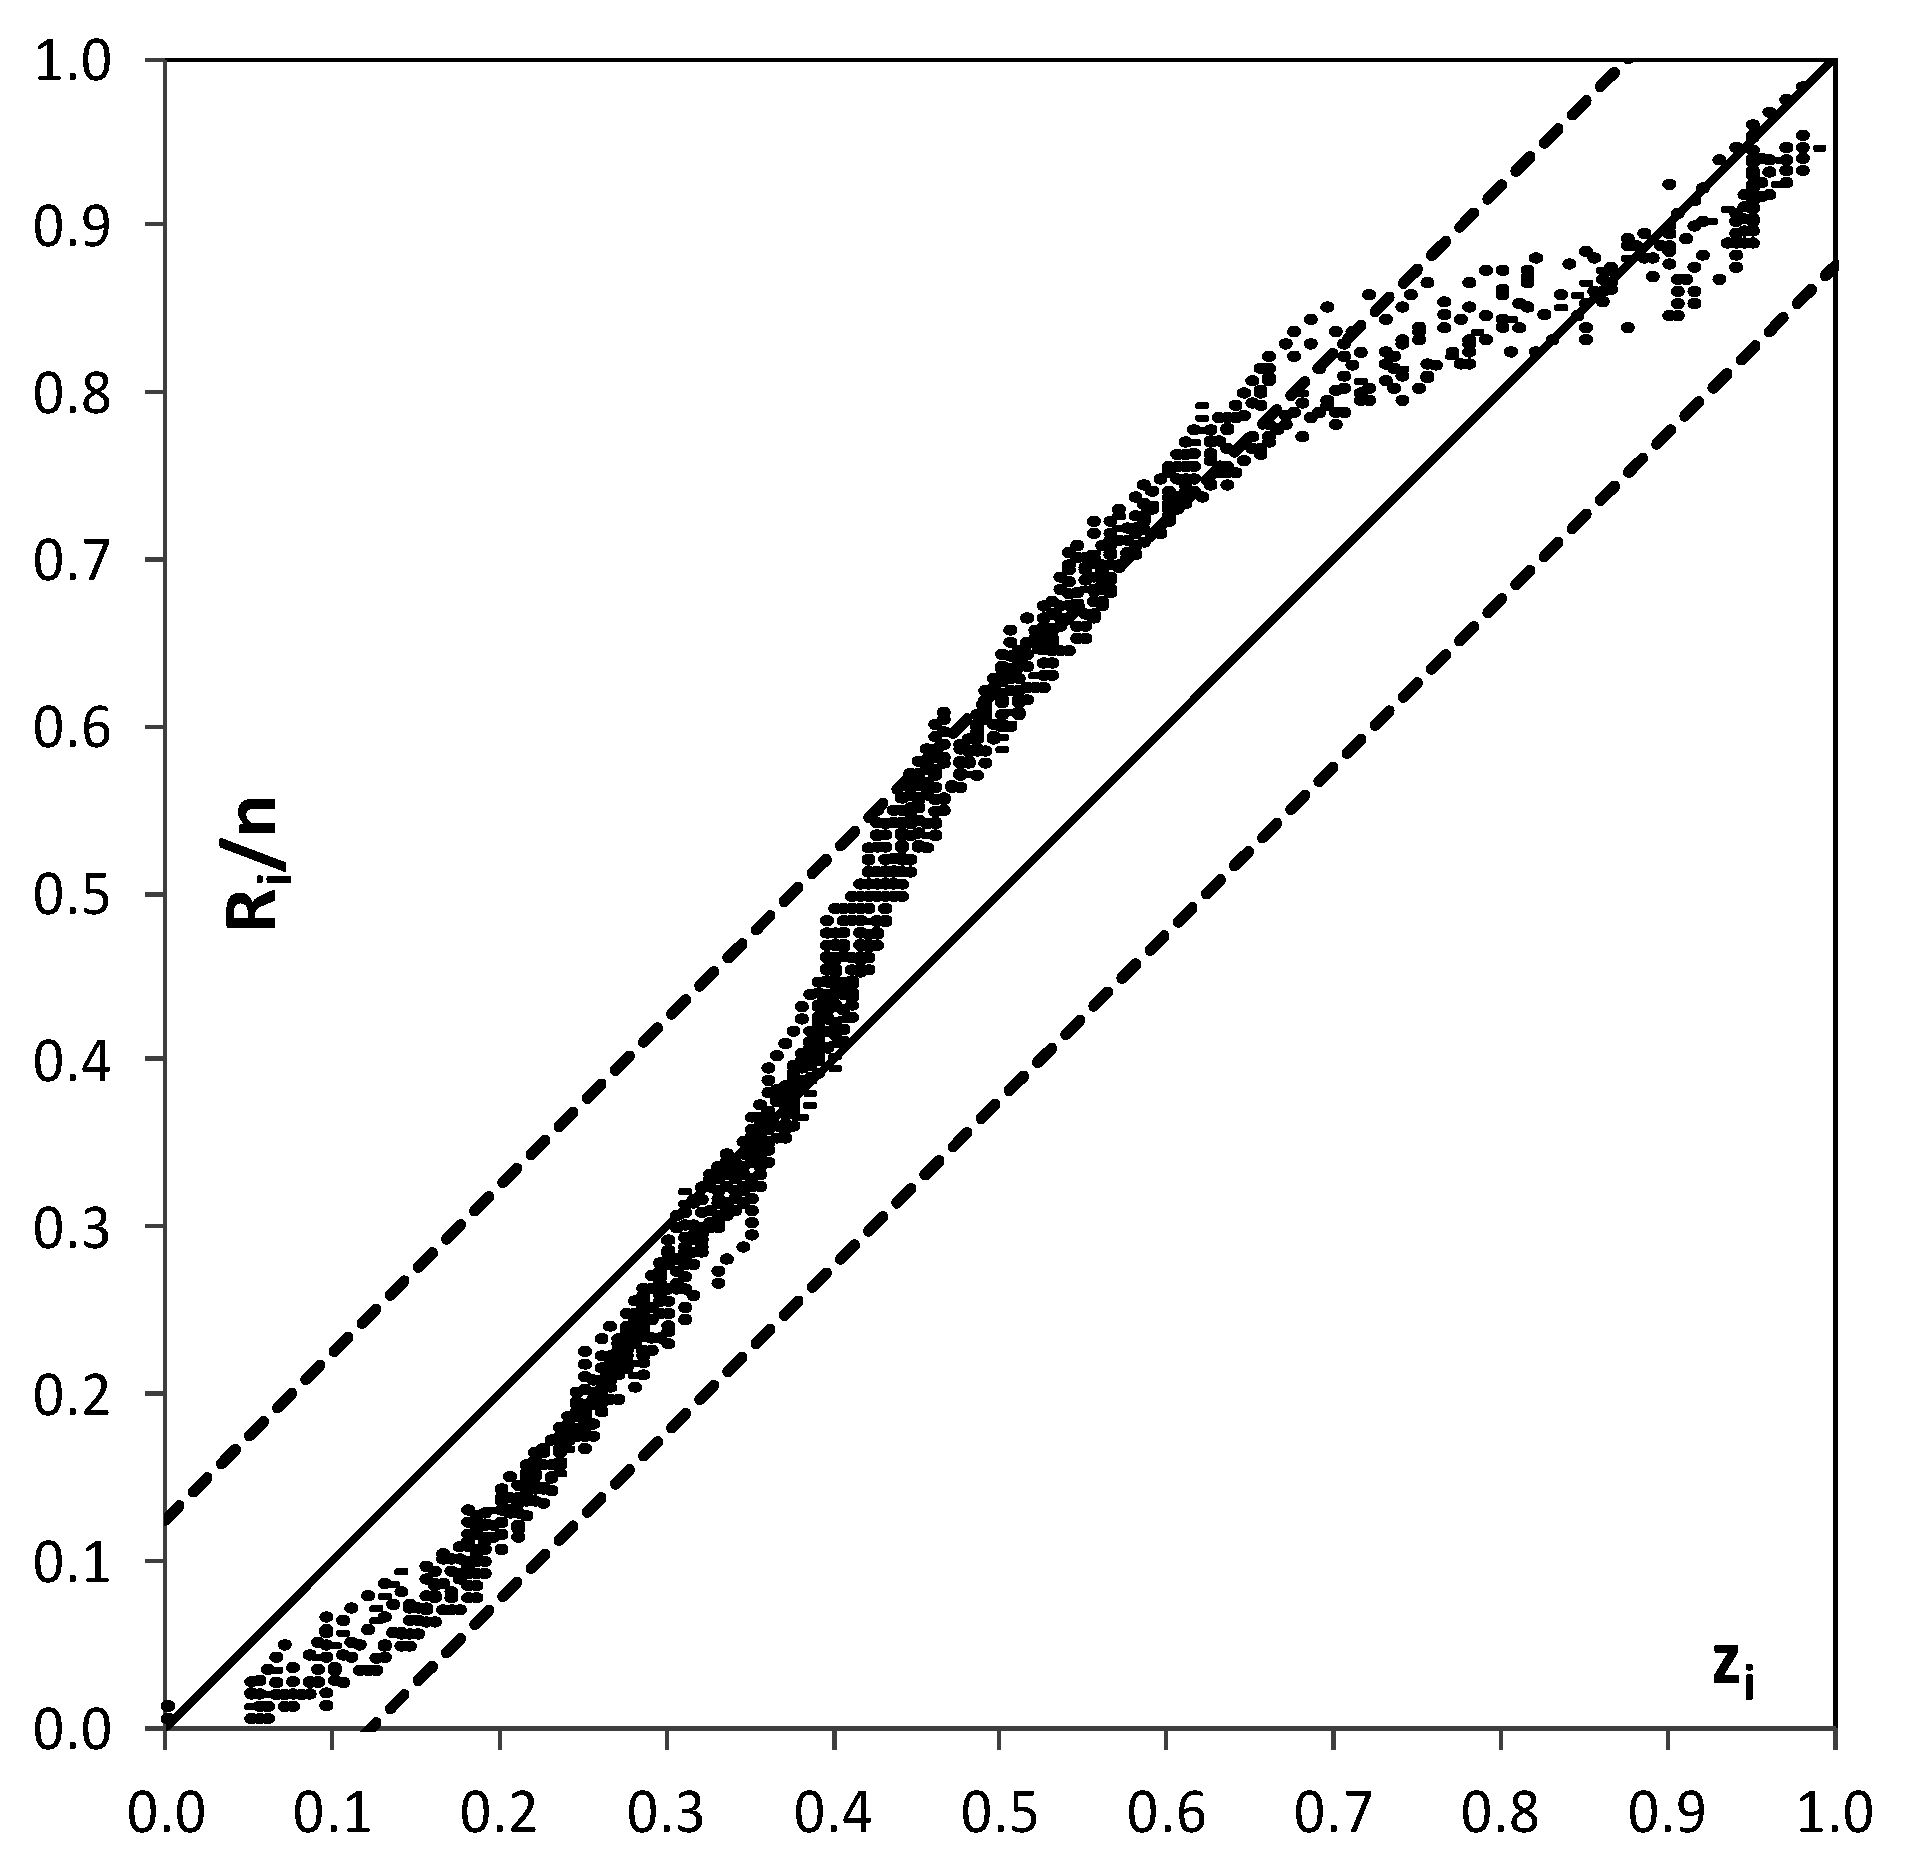
An additional analysis is finally carried out based on the “probability plot representation” (PPR) as described by Laio and Tamea [
31]. The PPR is a plot of the values of the forecasted cumulative probability of the observed value
xi,
zi =
P(
xi), versus their corresponding empirical distribution function,
Ri/
n, with
Ri = ranks and
n = sample size. The PPR indicates if the uniformity test is passed or not and, also, the shape of the resulting curve gives information on the possible causes behind deviations from uniformity, i.e., placement of the points along the 1:1 line [
10,
31]. Moreover, the Kolmogorov confidence band can be displayed in the PPR indicating if the uniformity test is passed (the curve is inside the band) or not [
31]. The PPR is here developed for the case study of MCP-MT results for the longer branch, reach 2, lead-time 24 h and focusing on the 2001 severe monsoon season. Following Laio and Tamea [
31], we use 24 sub-series obtaining the results shown in
Figure 9. Based on the indications provided by Laio and Tamea [
31] to evaluate the results, it is clear that the forecasts provided by the probabilistic method are reliable (most of the forecasts remains inside the Kolmogorov band with 5% significance), even if the shape of the curves indicates that the predictions are large around the central value. The probability plot shows a large steepness of the curves, i.e., more
zi points concentration, in the vicinity of 0.4–0.5 points.
5.3.2. Probability of Hydrometric Thresholds Exceedance: Flooding Probability within a Time Horizon and Contingency Table
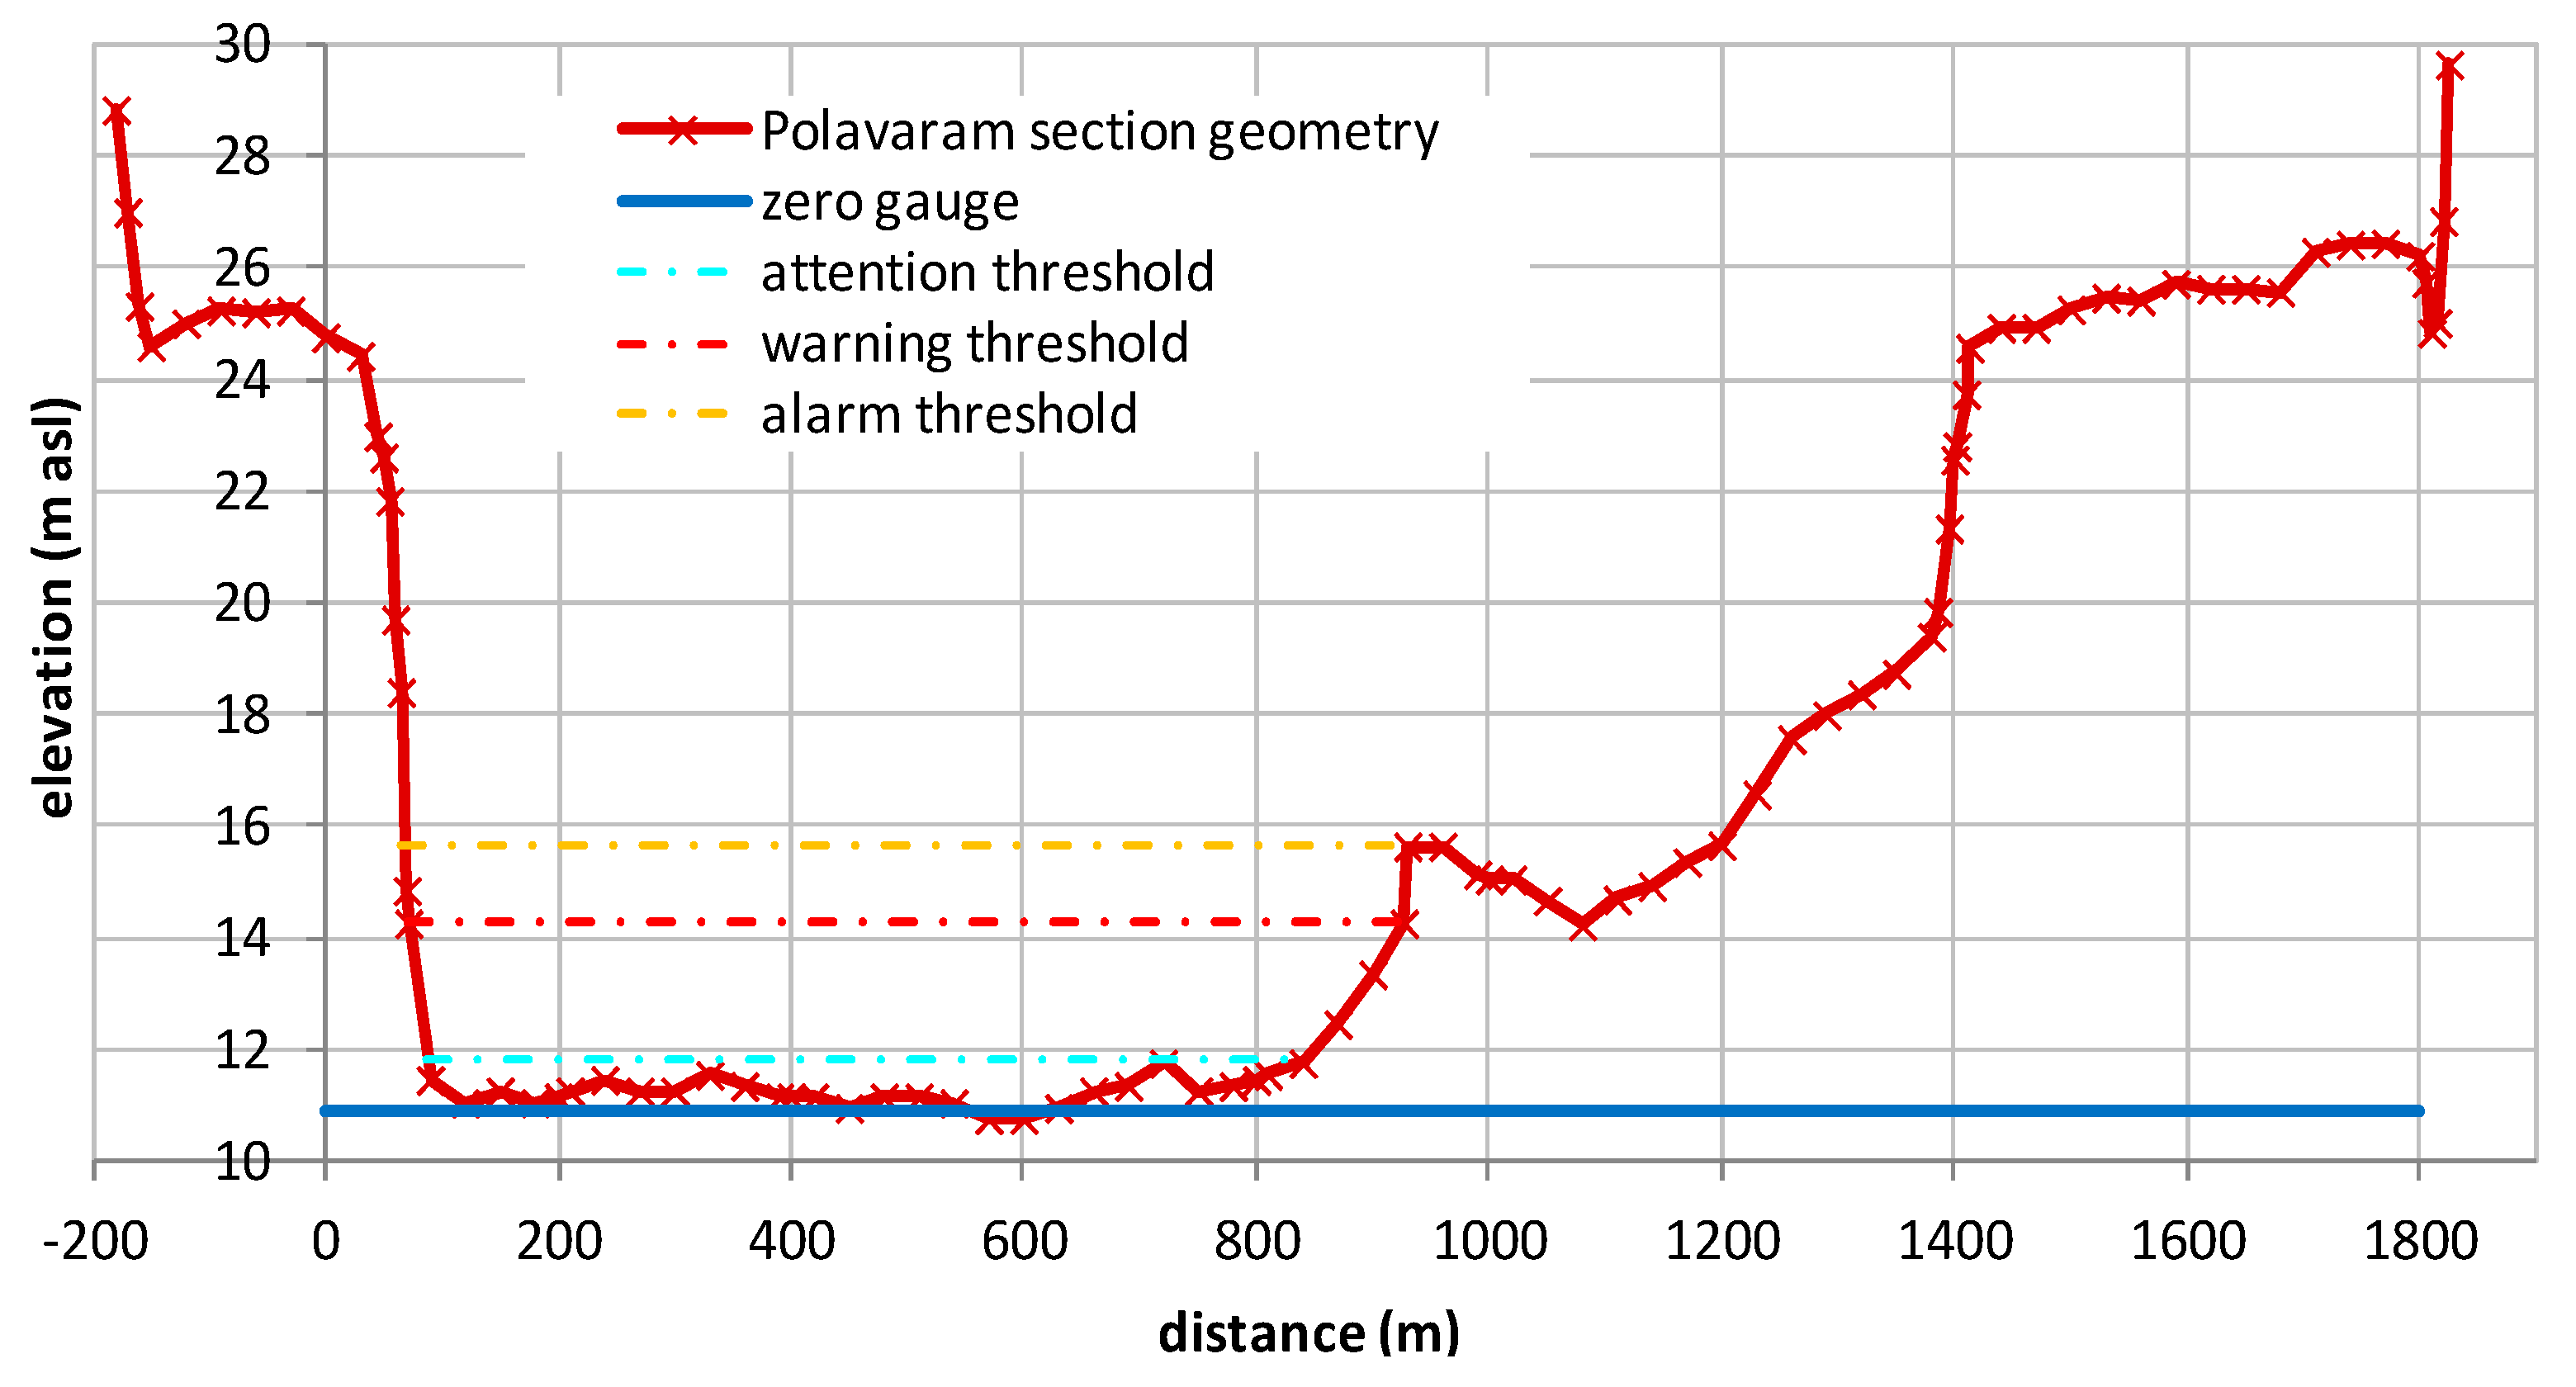
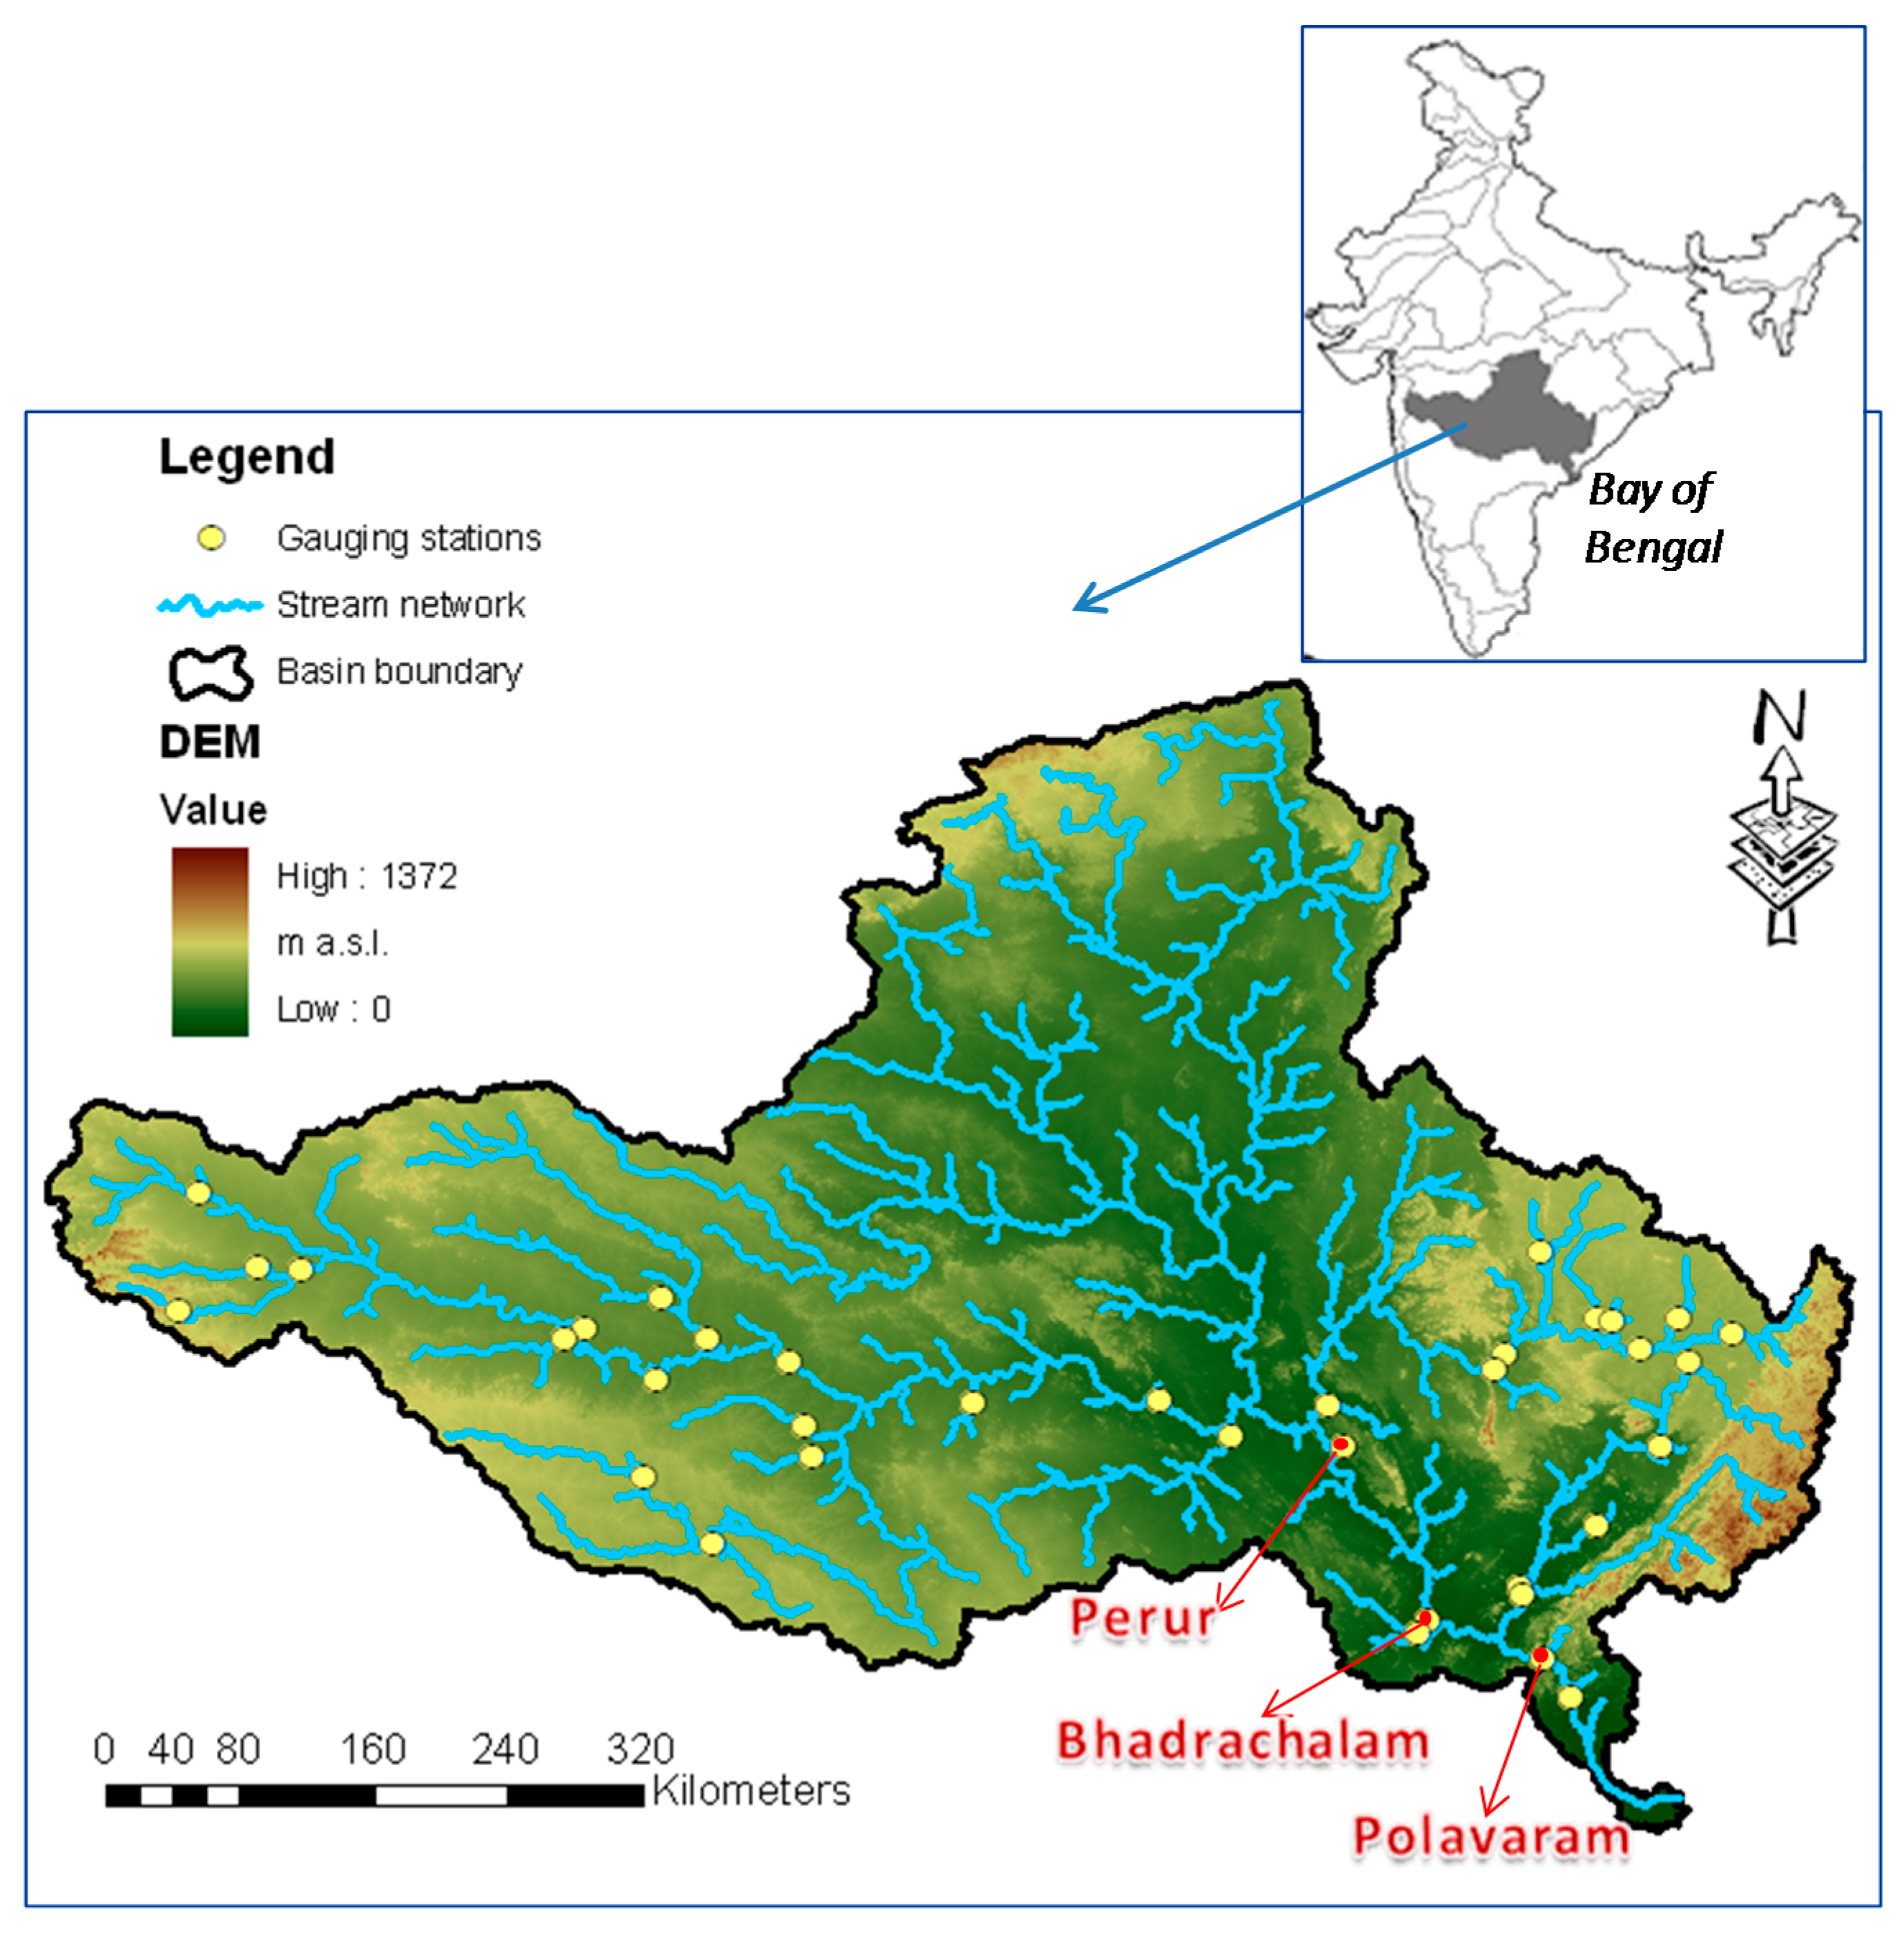
As already underlined, the probability of hydrometric thresholds exceedance (ETP) is fundamental to address the flood risk management in real-time. Therefore, the first results of the MCP-MT in terms of flooding probability are here presented for Polavaram section by assuming as reference thresholds the levels shown in
Figure 3 and referred as “attention” (th
att), “warning” (th
war) and “alarm” (th
alar) threshold. It is worth noting that these critical levels are not based on operational values defined by the authority in charge of decision in case of flood, but they are set by the authors. Specifically, the warning and alarm threshold are identified on the basis of the section geometry (see
Figure 3), while the lowest one is assumed equal to the 95th percentile of the historical observed river level data with the aim of investigating a critical level exceeded several times during the available dataset.
The analysis focuses on the “attention” and “warning” thresholds because the “alarm” threshold is not actually reached during the available dataset. The lead-times of 12 h and 24 h by considering the results of MCP-MT for reach 1 and reach 2, respectively, are selected for the analysis. As for the previous analysis concerning the PU estimate using MCP-MT, we first discuss the results obtained by using the all available dataset for calibration. The study compares the binary observed exceedance, equal to 1 when the observed stage is above the threshold level and equal to 0 when it is below, and the exceeding probability computed by the multi-temporal approach of the MCP-MT within the selected forecast lead-time period.
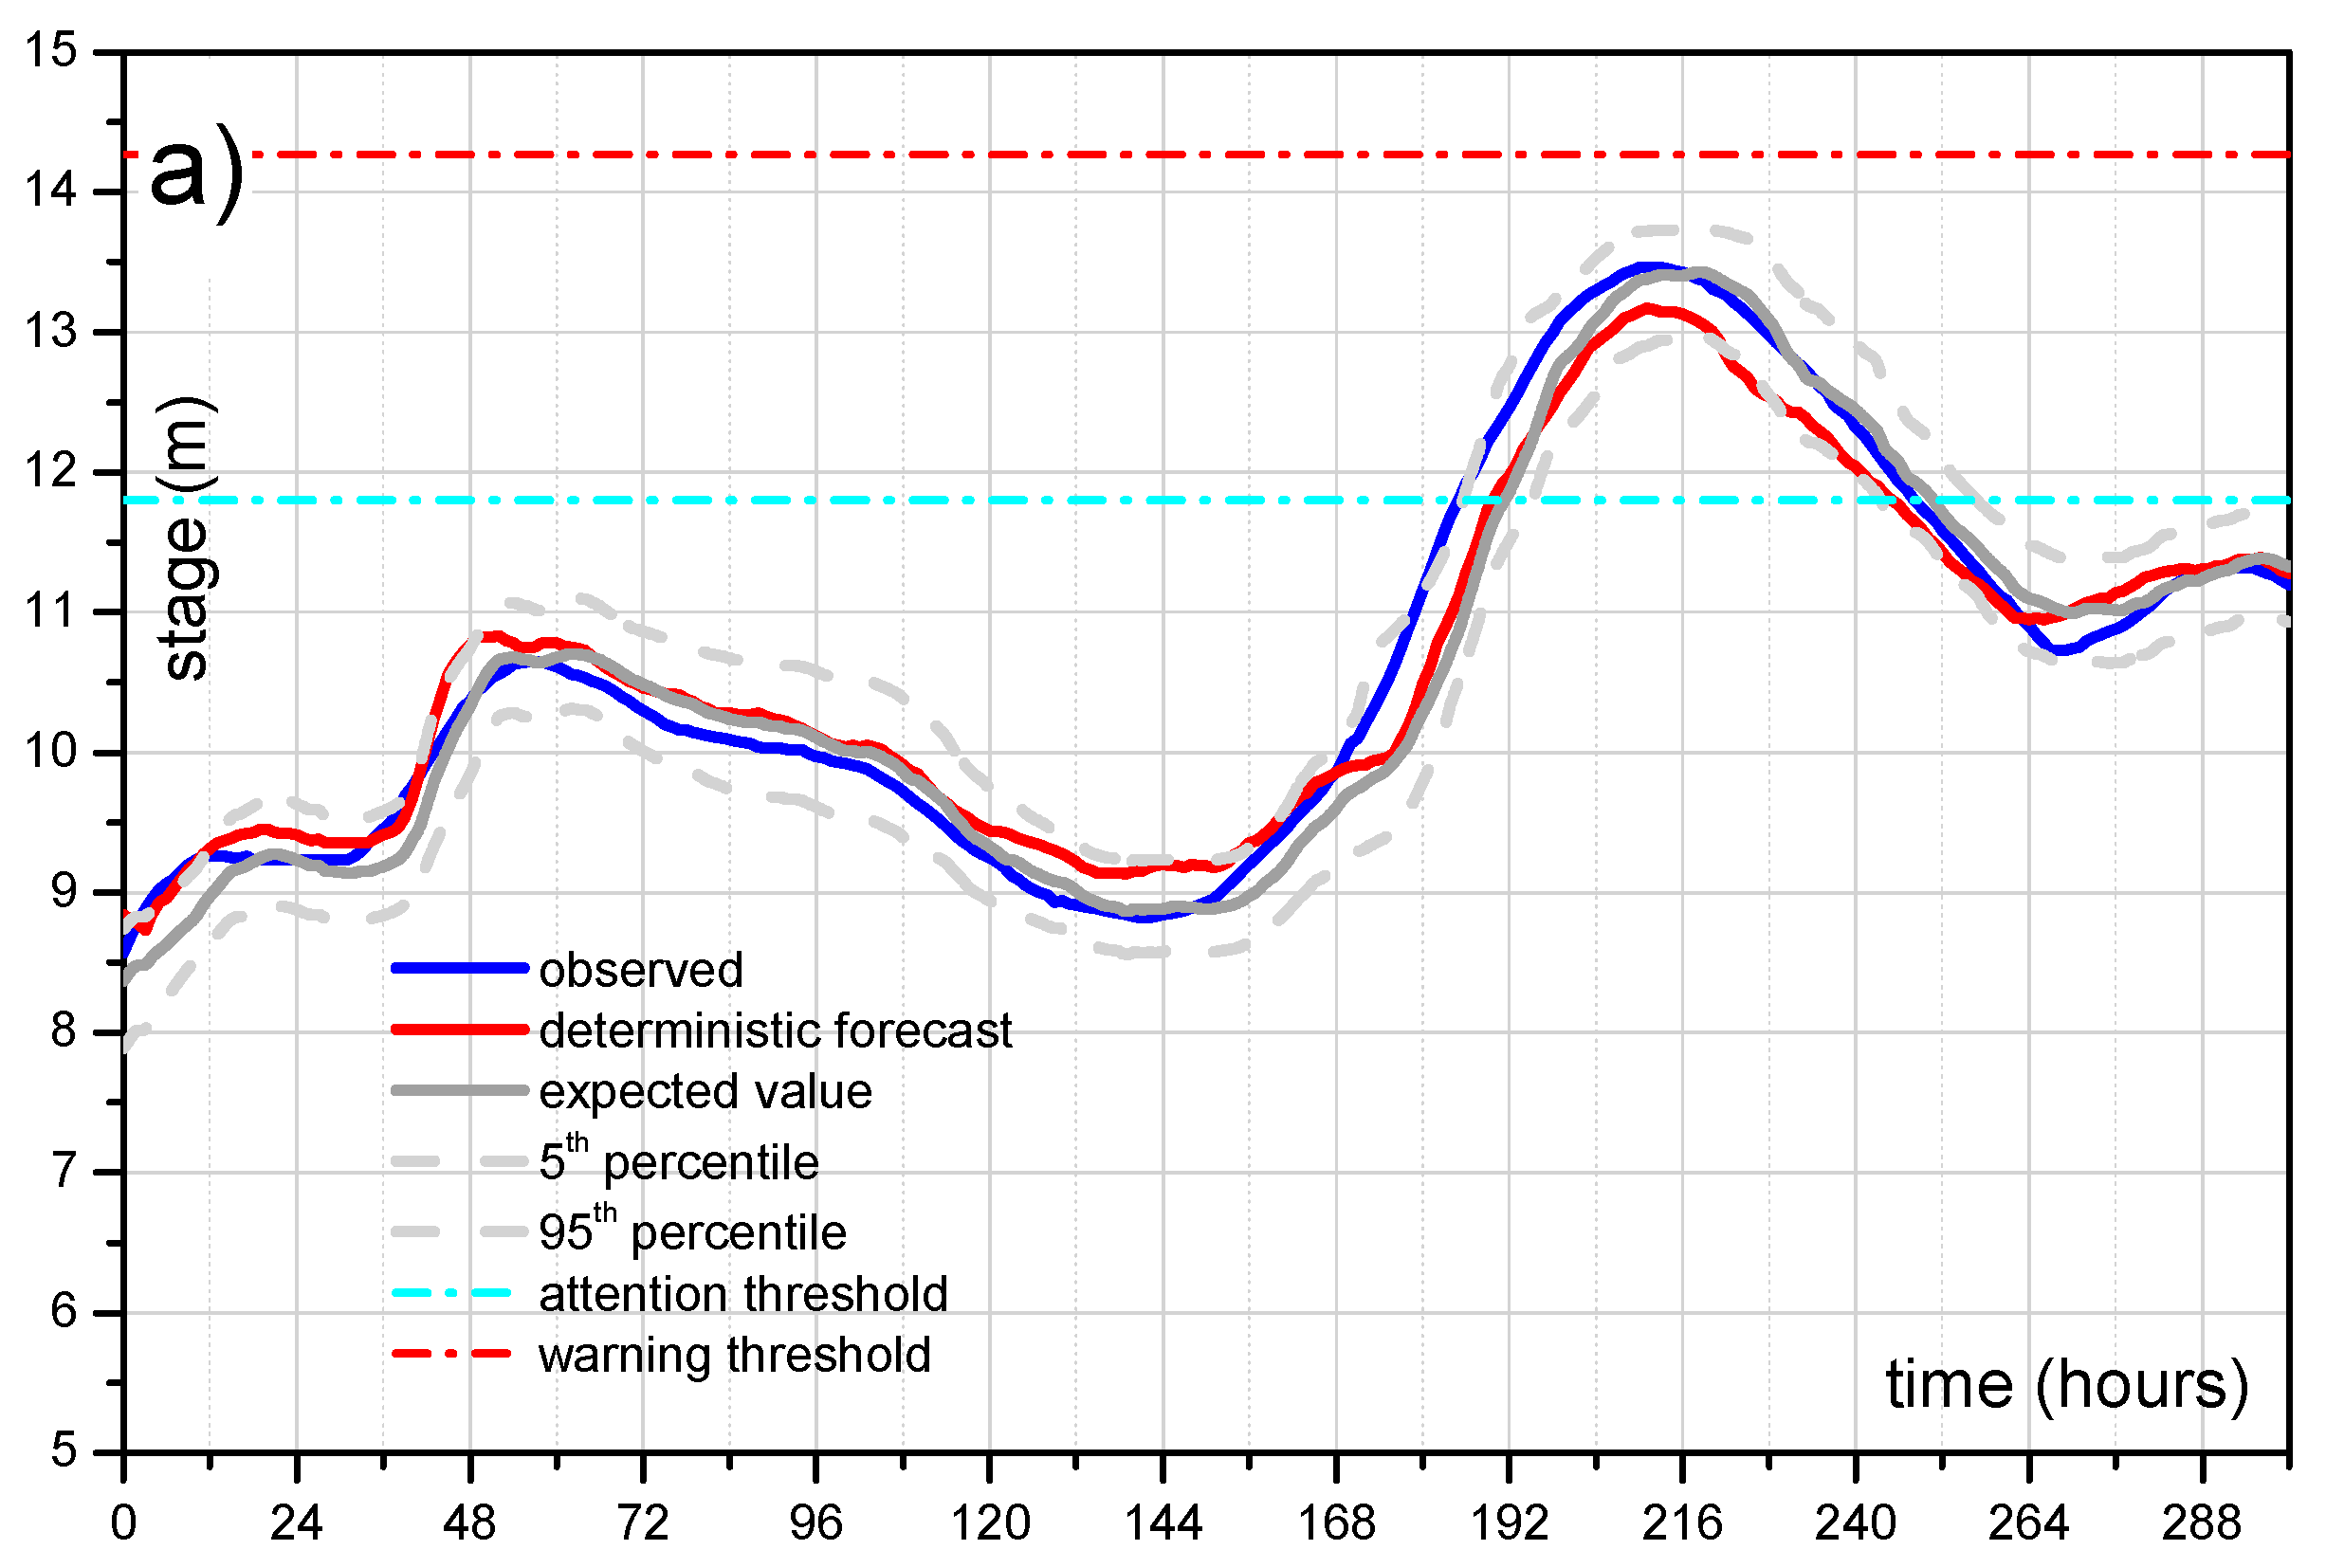
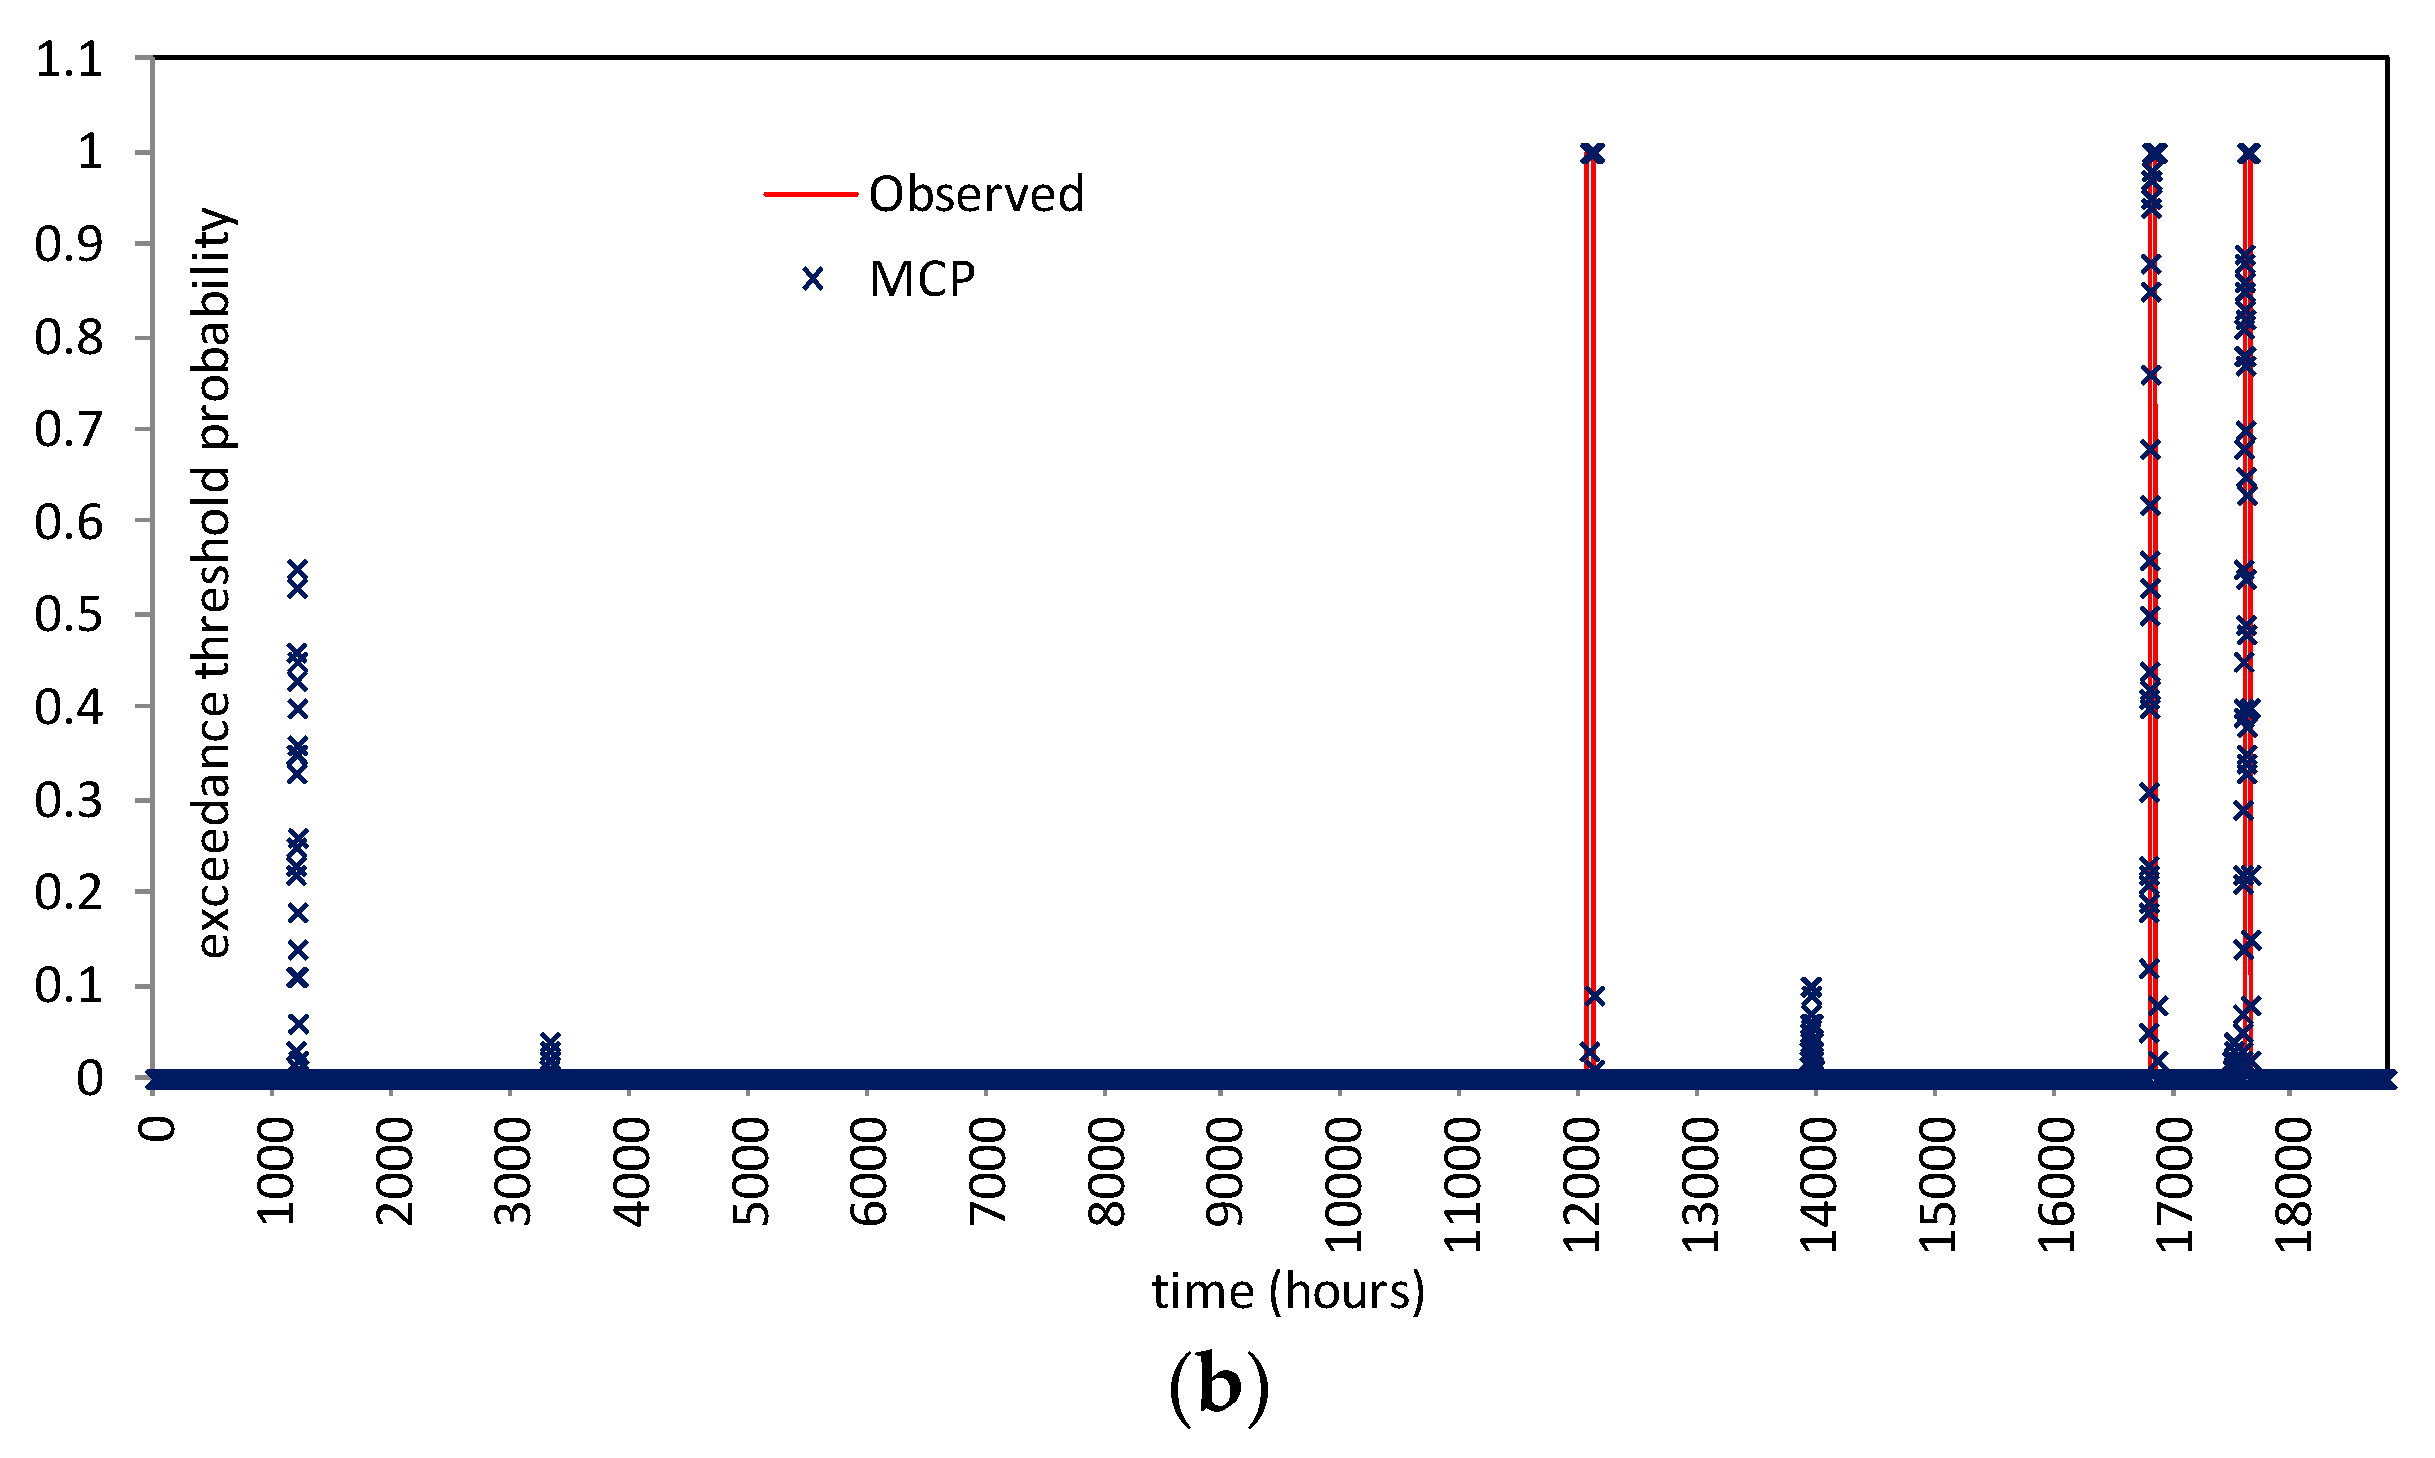
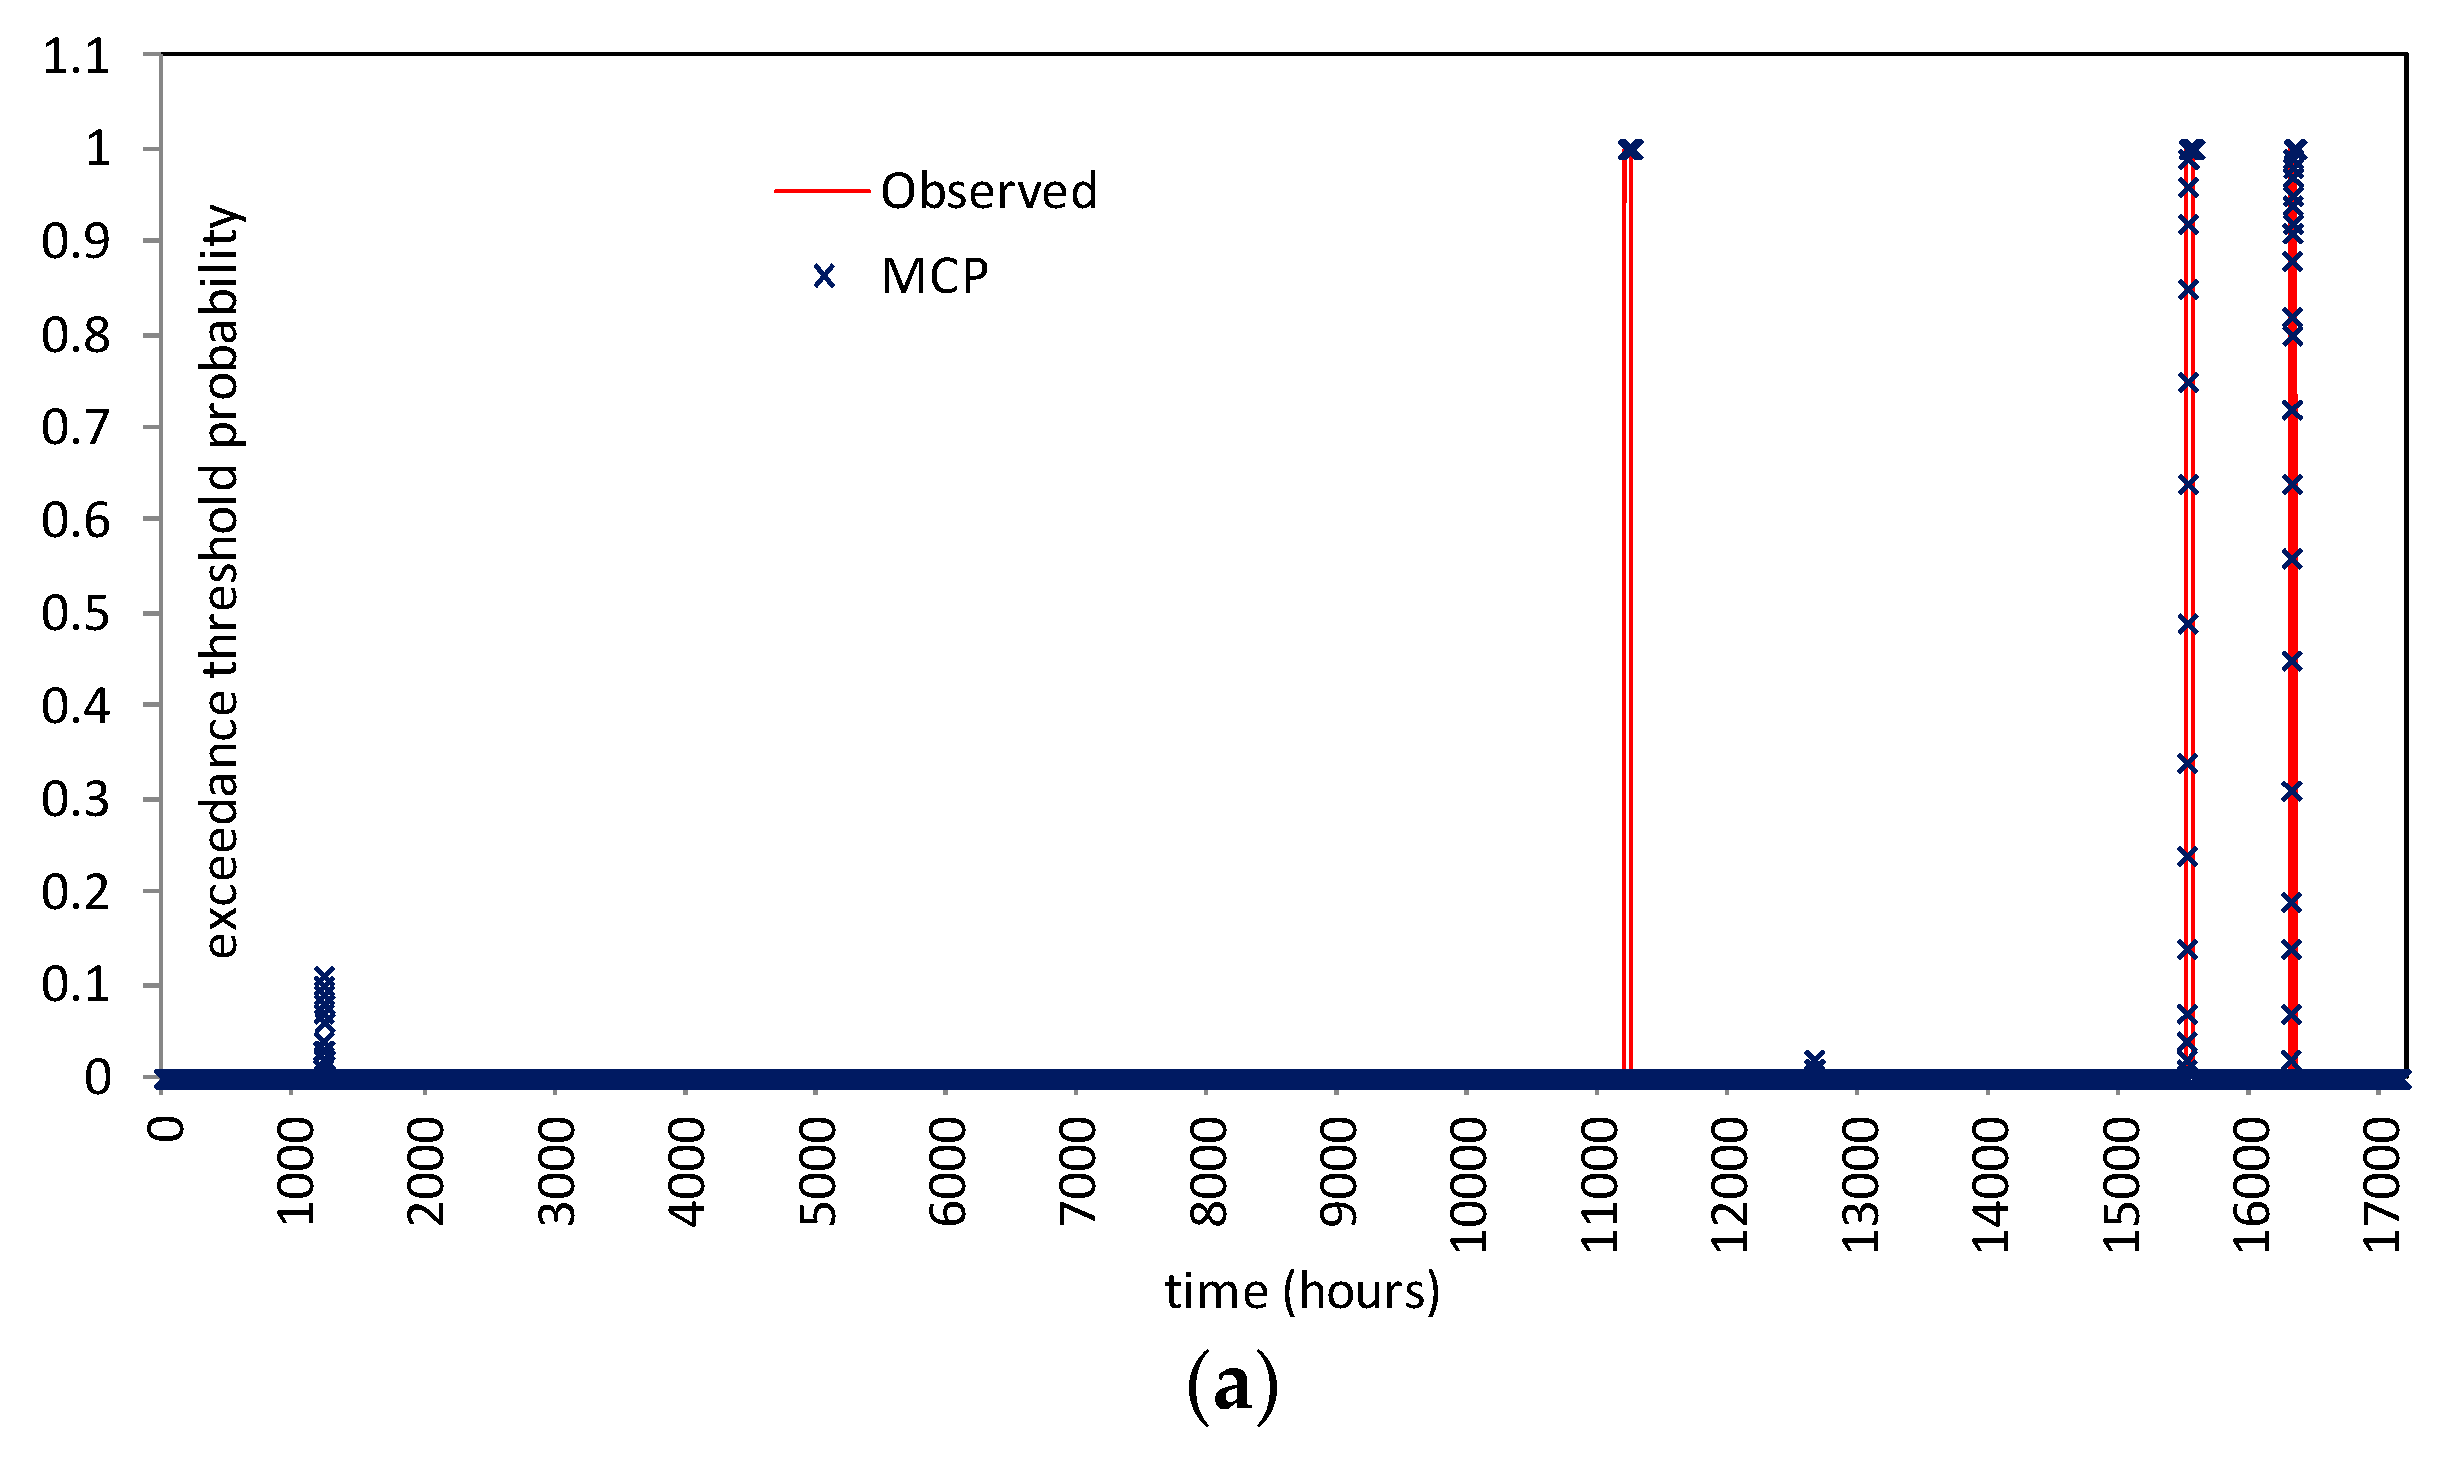
Figure 10 shows the comparison for reach 1 (lead-time = 12 h) and for reach 2 (lead-time = 24 h) for all the available dataset. Specifically, at each time
t the displayed value (between 0 and 1) represents the exceedance threshold probability estimated for the next 12/24 h. As it can be seen, when the threshold is really exceeded, the MCP-MT always estimates a probability equal to 1, i.e., provides the certainty of threshold exceeding. When the threshold is not actually exceeded, the processor provides very low probability values, mostly equal to zero. Only in one case, the ETP is found higher than 50% when the threshold is not actually reached (see
Figure 10b), however it is worth noting that the maximum observed stage is only 18 centimeters below the threshold level.
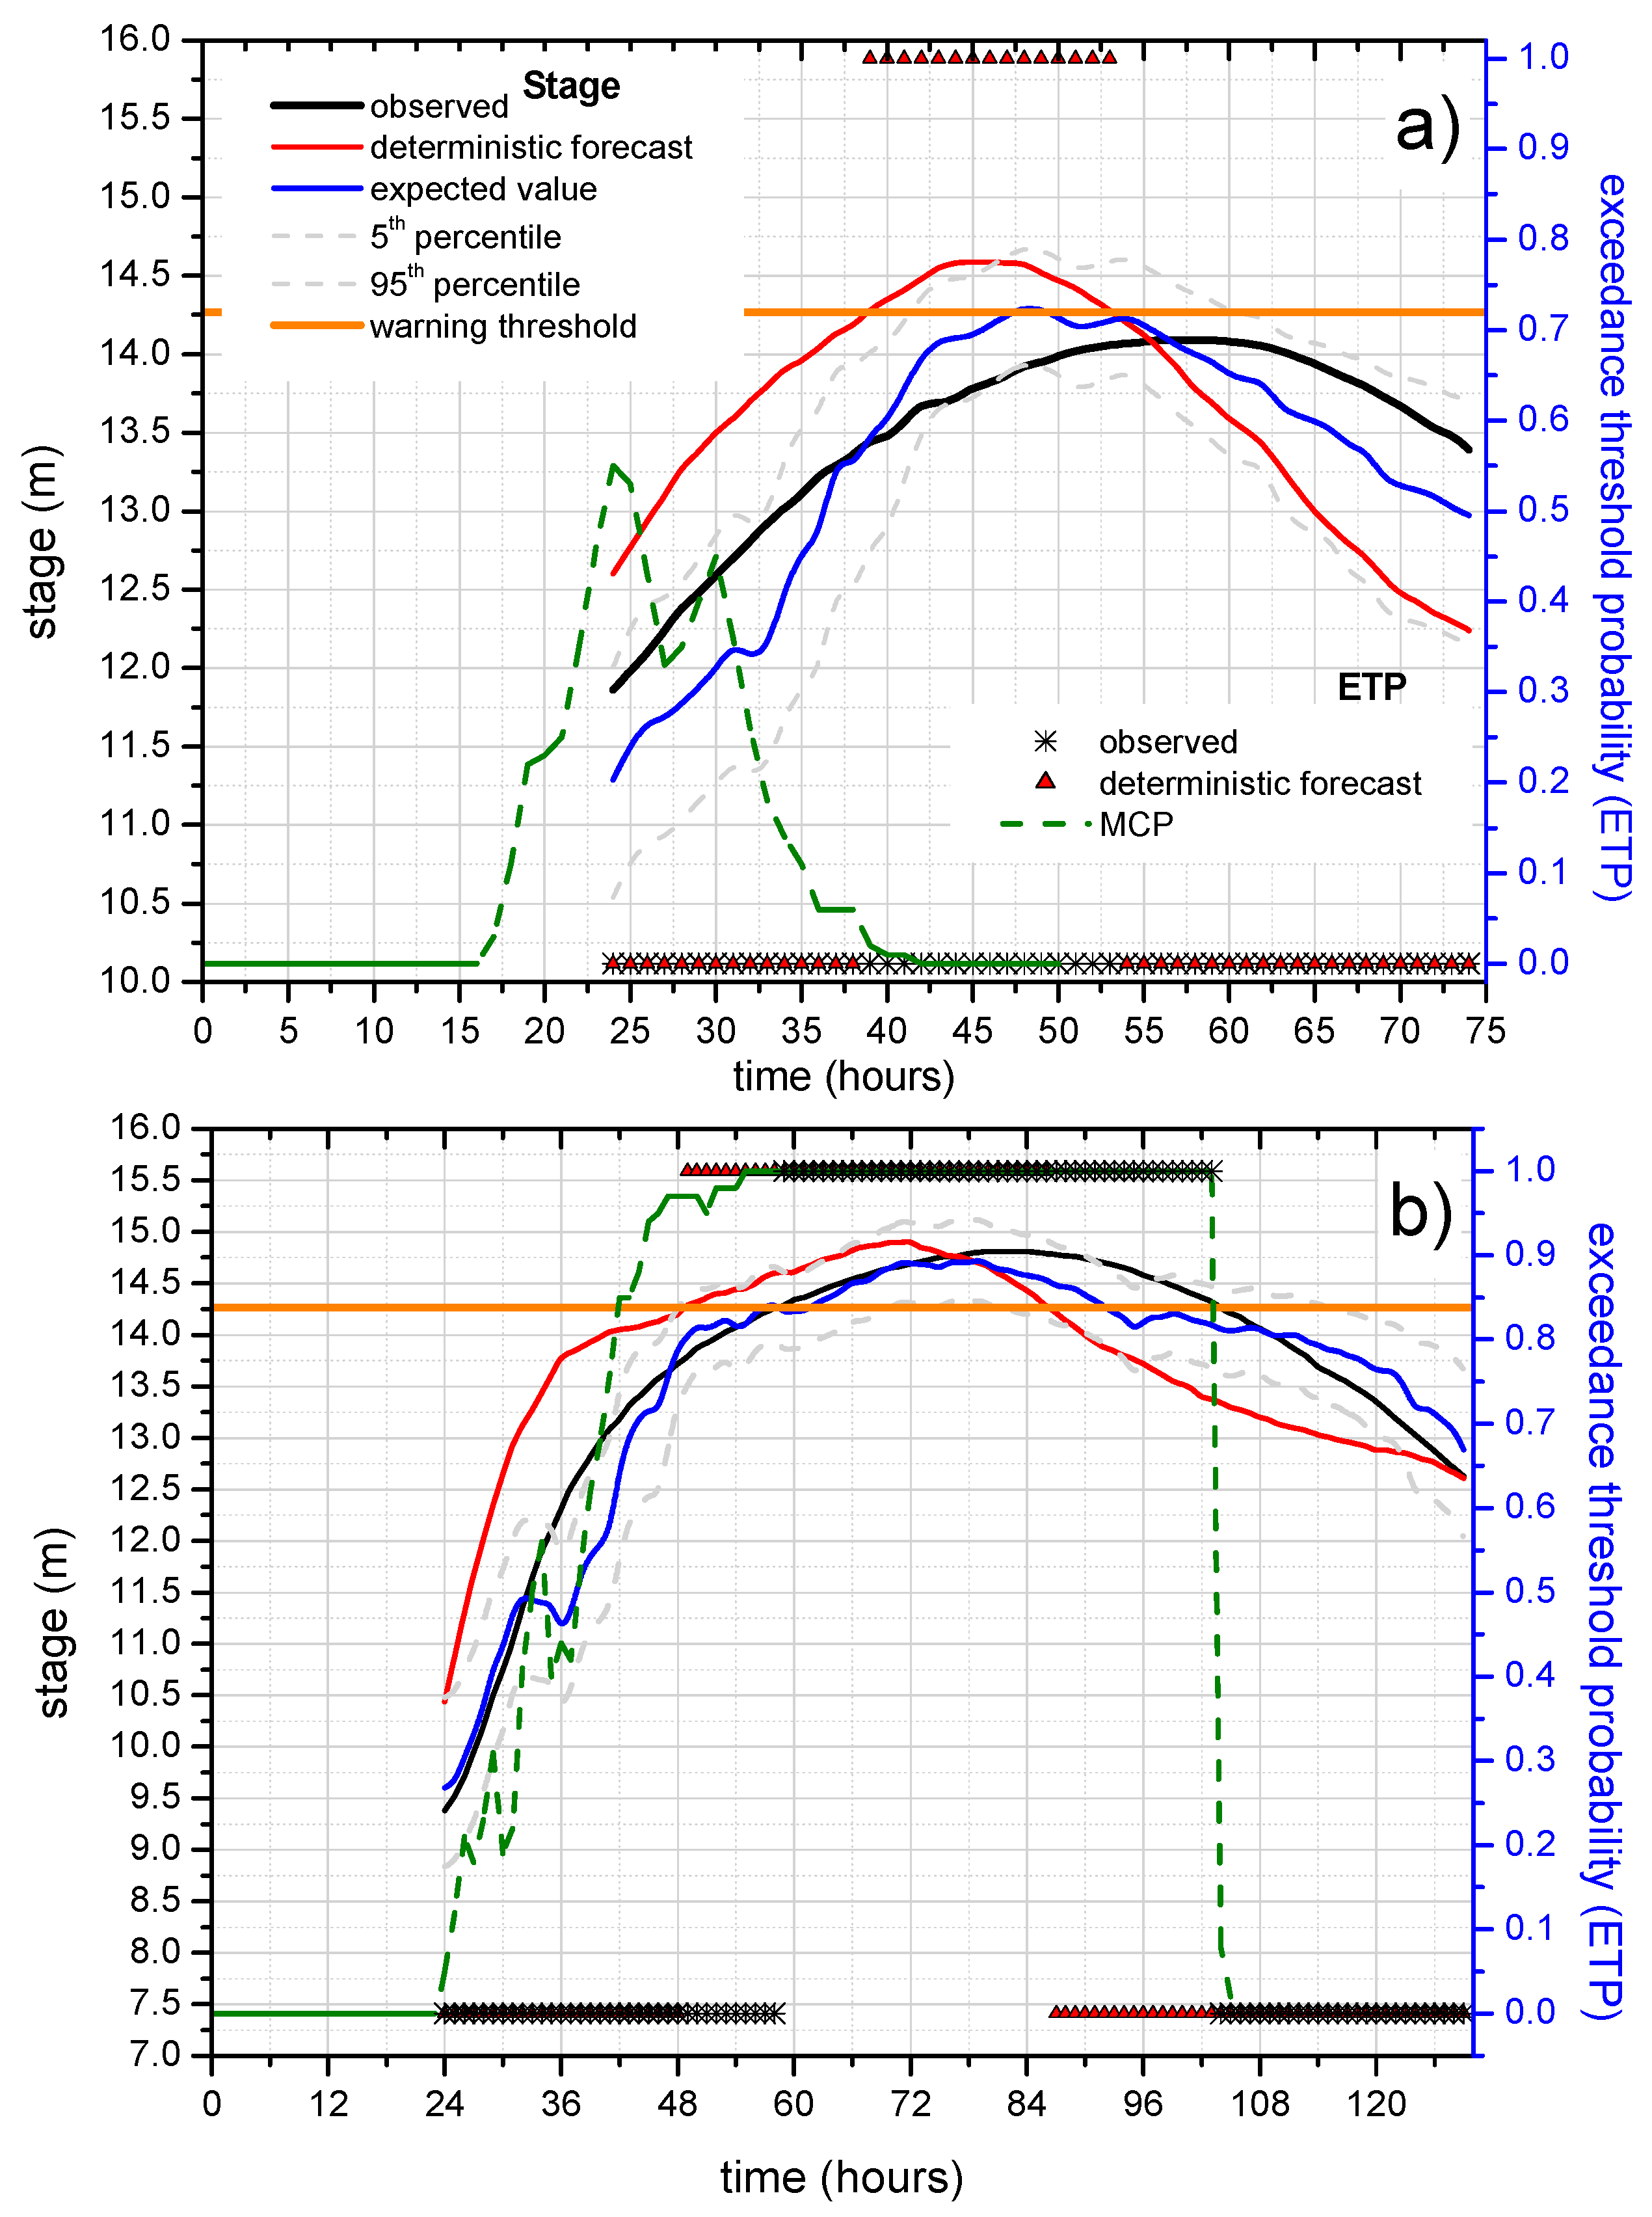
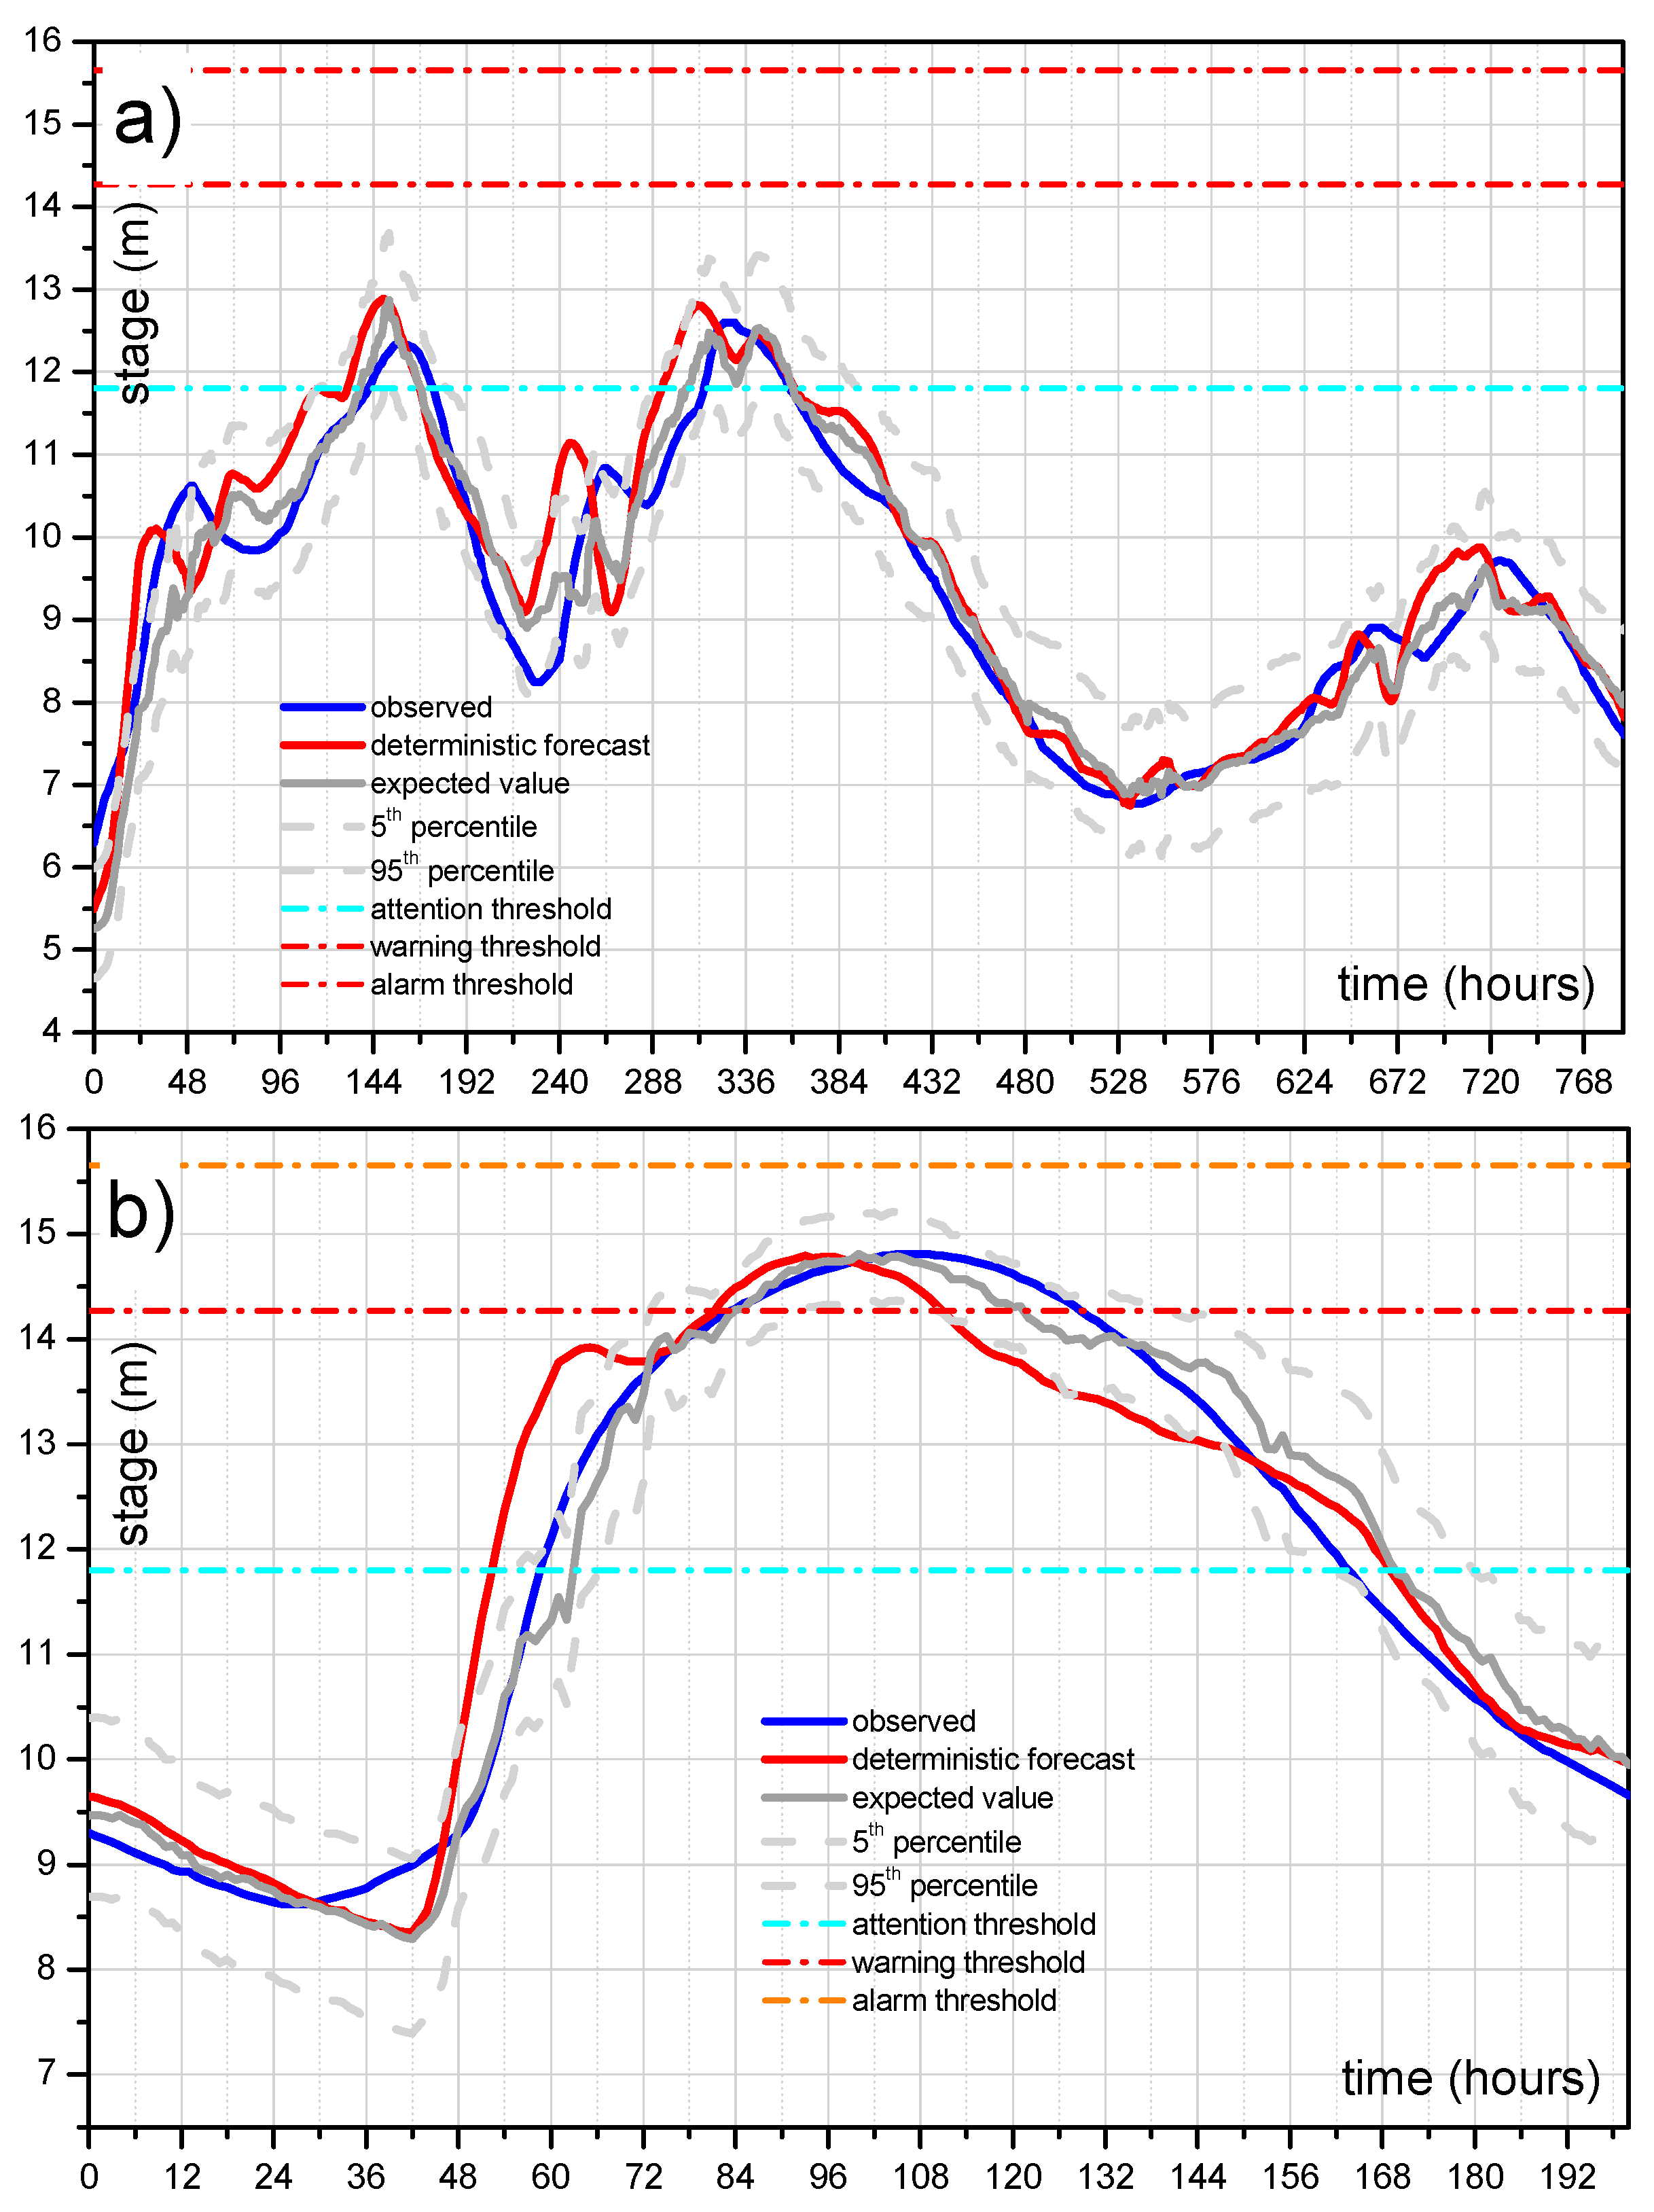
To investigate the benefit of the ETP estimate, a deep analysis on selected flood events is also shown in
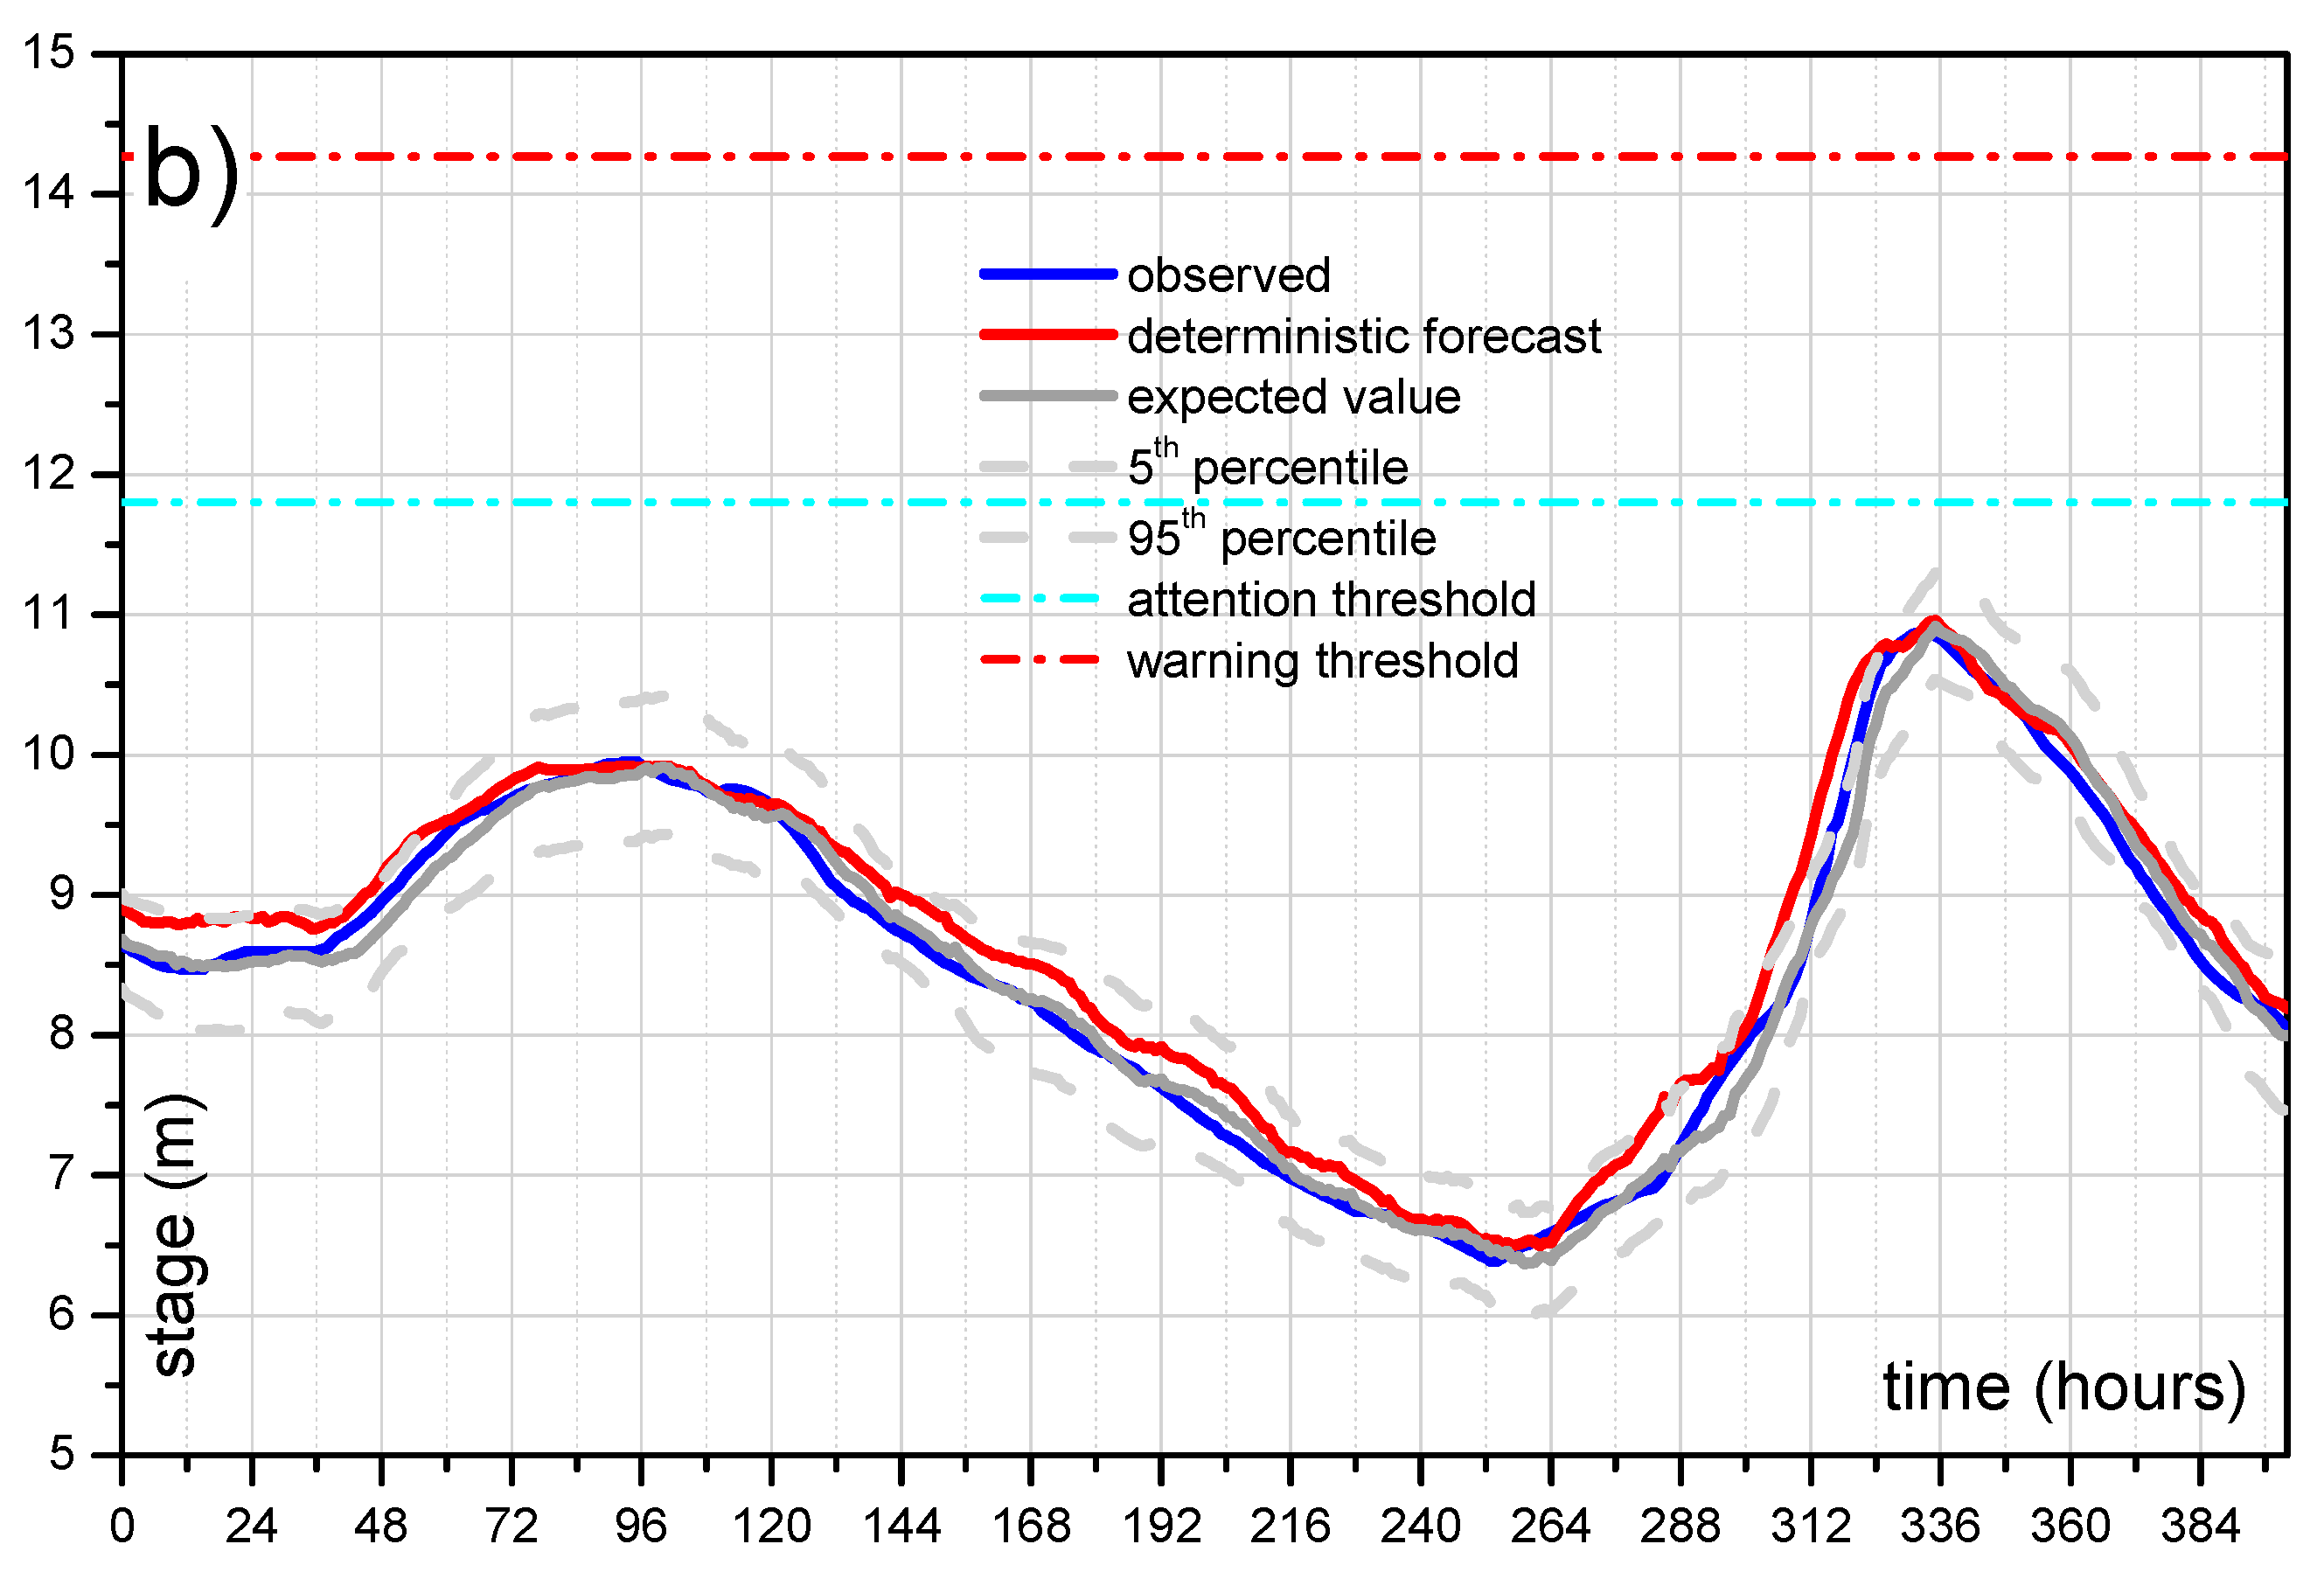
Figure 11 for the reach 2 case study and the longer lead-time equal to 24 h that represents the best information that could be provided to decision-makers. The analysis consists in comparing the binary observed exceedance (equal to 1 when the observed stage is above the threshold level and equal to 0 when it is below) and the exceeding probability computed by the MCP-MT within the selected forecast lead-time period (24 h) that is varying over time. For sake of completeness, the binary response of the deterministic model, that can be equal to 1 or 0, is also considered in the analysis.
Figure 11a,b, which concerns two high flood events occurred at Polavaram section, shows the benefit obtainable using the PU estimate. Specifically, these figures effectively show the advantage of using probabilistic approaches able to provide probabilities in the range of 0–1 and not only the binary values 0/1, corresponding to the condition of threshold exceedance/non-exceedance.
In the figures, the red line represents the stage predicted by STAFOM-RCM model 24 h in advance compared with the observed stage (black line), the expected value (blue line) and the 90% uncertainty band (dashed grey lines) provided by MCP-MT. The dashed green line in
Figure 11a,b represents the probability to exceed the level of 14.27 m (warning threshold) within the total time horizon (i.e., 24 h) computed by the MCP-MT. Specifically, the exceedance probability provided by the MCP-MT for each time step
t refers to the next 24 h period, i.e., the time interval
t–(
t + 24 h). As it can be seen, for the flood on 21–22 August 2001 (
Figure 11a) the deterministic model predicts the threshold exceedance at time
t = 39 h, while the warning threshold was not actually exceeded by the observed stage. In this case, the exceedance probability provided by MCP-MT reaches the maximum value equal to 0.55 at
t = 24 h, therefore the ETP is always significanlty lower than 0.75 that identified the limit value for the “red probability class” that indicates a high probability of threshold overtopping. In details, the probability values computed by the MCP-MT can be grouped in three probability classes: the green class refers to the probability lower than 0.25, the red one includes the probability values greater than 0.75 and the yellow class indicates values within these two percentages. The probability classes are assumed to be easily understandable by authorities in charge of decision, providing useful information for supporting the real-time flood risk management.
It is worth noting that the highest values of ETP, between
t = 22 h and
t = 31 h (see
Figure 11a), correspond to the beginning of the peak region of the observed stage hydrograph and that the maximum observed stage is only 18 centimeters lower than the warning threshold.
By inspecting the results shown for the flood which occurred on 6–10 August 2010 (
Figure 11b), it can be noted that the warning threshold is actually exceeded at
t = 58 h, while the deteministic model predicts the threshold overtopping 9 h in advance, at
t = 49 h. The benefit introduced by the predictive uncertatinty estimate can be easily inferred by analyzing the results for the flood of August 2010 (see
Figure 11b). In this case, the ETP increases very quickly starting from
t = 24 h and reaches nearly the maximum value equal to 1 at
t = 47 h. Moreover, the expected value, depicted as the blue line in the figure, passes the threshold at time
t = 57 h, only one hour before the actual overtopping.
It is also worth noting that the alarm hydrometric threshold, equal to 15.65 m, is never really exceeded for the whole available dataset and that the ETP provided by MCP-MT for both the investigated reaches is always null for this highest threshold.
Finally, it is worth noting that the probabilistic information from the multi-temporal approach of the MCP-MT refers to the entire forecast horizon, i.e., to a 24 h time interval, while the deterministic models cannot provide exceedance probability.
The contingency table metric [
32] is also used to investigate how correctly the exceedance or non-exceedance of the fixed hydrometric thresholds is forecasted. A perfect forecast would produce only “hits” (event forecast to occur, and did occur) and “correct negatives” (event forecast not to occur, and did not occur) and no “misses” (event forecast not to occur, but did occur) or “false alarms” (event forecast to occur, but did not occur).
Table 6 shows the outcomes of the analysis for the warning and the attention threshold for reach 1 and reach 2 by assuming a lead-time of 12 and 24 h, respectively. The performance of the deterministic model is here compared with the one of the expected value and the 95th percentile provided by MCP-MT. The table provides the hits, the misses and the false alarms, while the correct negatives refer to all the other situations not quantified because during the monsoon season continuous flood events are recorded. As it can be seen, STAFOM-RCM correctly forecasts the three actual warning threshold exceedances with a forecast horizon of 12 h, but also provied two false alarms; when the 24 h lead-time is considered one miss is observed. Referring to th
att, we see 14 hits and one false alarm for 12 h lead-time and 15 hits and two false alarms for 24 h lead-time. By inspecting the results for MCP-MT calibrated by using the whole available dataset, a better performance can be seen both in terms of mean and 95th percentile. For example, the two false alarms for th
war and 12 h lead-time are no more observed for the expected value. Moreover, the two false alarms for reach 2 (24 h) of the 95th percentile are characterized by a maximum value of the exceedance probability provided by MCP-MT lower than 40% and 10%. It is also worth noting that the maximum water level observed during the only miss for th
att provided by the expected value of MCP-MT is found only two centimeters above the critical level.
For a comprehensive evaluation, the anlaysis of how correctly the exceedance or non-exceedance of the fixed hydrometric thresholds is forecasted is also carried out for study based on separated calibration and validation periods. As it can be inferred from
Table 6, the warning threshold is never exceeded during the selected calibration period, while it is for three times during the validation period. Nevertheless, MCP-MT expected value and 95th percentile correctly forecast the three threshold exceedances for lead time = 12 h, while for 24 h a miss is observed for which the 95th percentile line is only 10 centimeters below th
war. As concerns th
att, the theshold is reached five and nine times during the calibration and the validation period, respectively, when the dataset of reach 1 is considered. If reach 2 is investigated, it is seen that th
att is exceeded six times during the calibration period and nine times in the validation time series. The results of reach 1 (lead-time = 12 h) show for the calibration period five hits with 0 false alarms and misses (for both the deteministic model and the MCP-MT outcomes), and for the validation period, nine. Threrefore, the th
att overcoming is always correctly predicted when it actually occurs, however one false alarm is also observed in the validation period for MCP-MT as well as for the deterministic model. When the 24 h lead-time case study is analyzed, it is seen that in the calibration period six hits are obtained and only one false alarm for the 95th percentile that, however, is characterized by a maximum probability threshold exceedance equal to 22%. Finally, for the validation dataset, eight and nine hits are found for the expected value and the 95th percentile, respectively, with one miss for the mean of MCP-MT and one false alarm for both that is characterized by a maximum exceedance probability of about 50%.
Based on these results, it is evident that the information provided by the PU estimate with MCP-MT represent an added value to correctly support the activities of real-time FFWSs.
As it can be expected, a better perfomance of the processor is found when it is calibrated on the all available dataset, but even when separated calibration and validation periods are considered, the outcomes suggest that MCP-MT can be conveniently used for addressing flood risk management.


