
Evaluation of Dicentrarchus labrax Meats and the Vegetable Quality of Beta vulgaris var. cicla Farmed in Freshwater and Saltwater Aquaponic Systems

 ,
,
Abstract
:1. Introduction
2. Materials and Methods
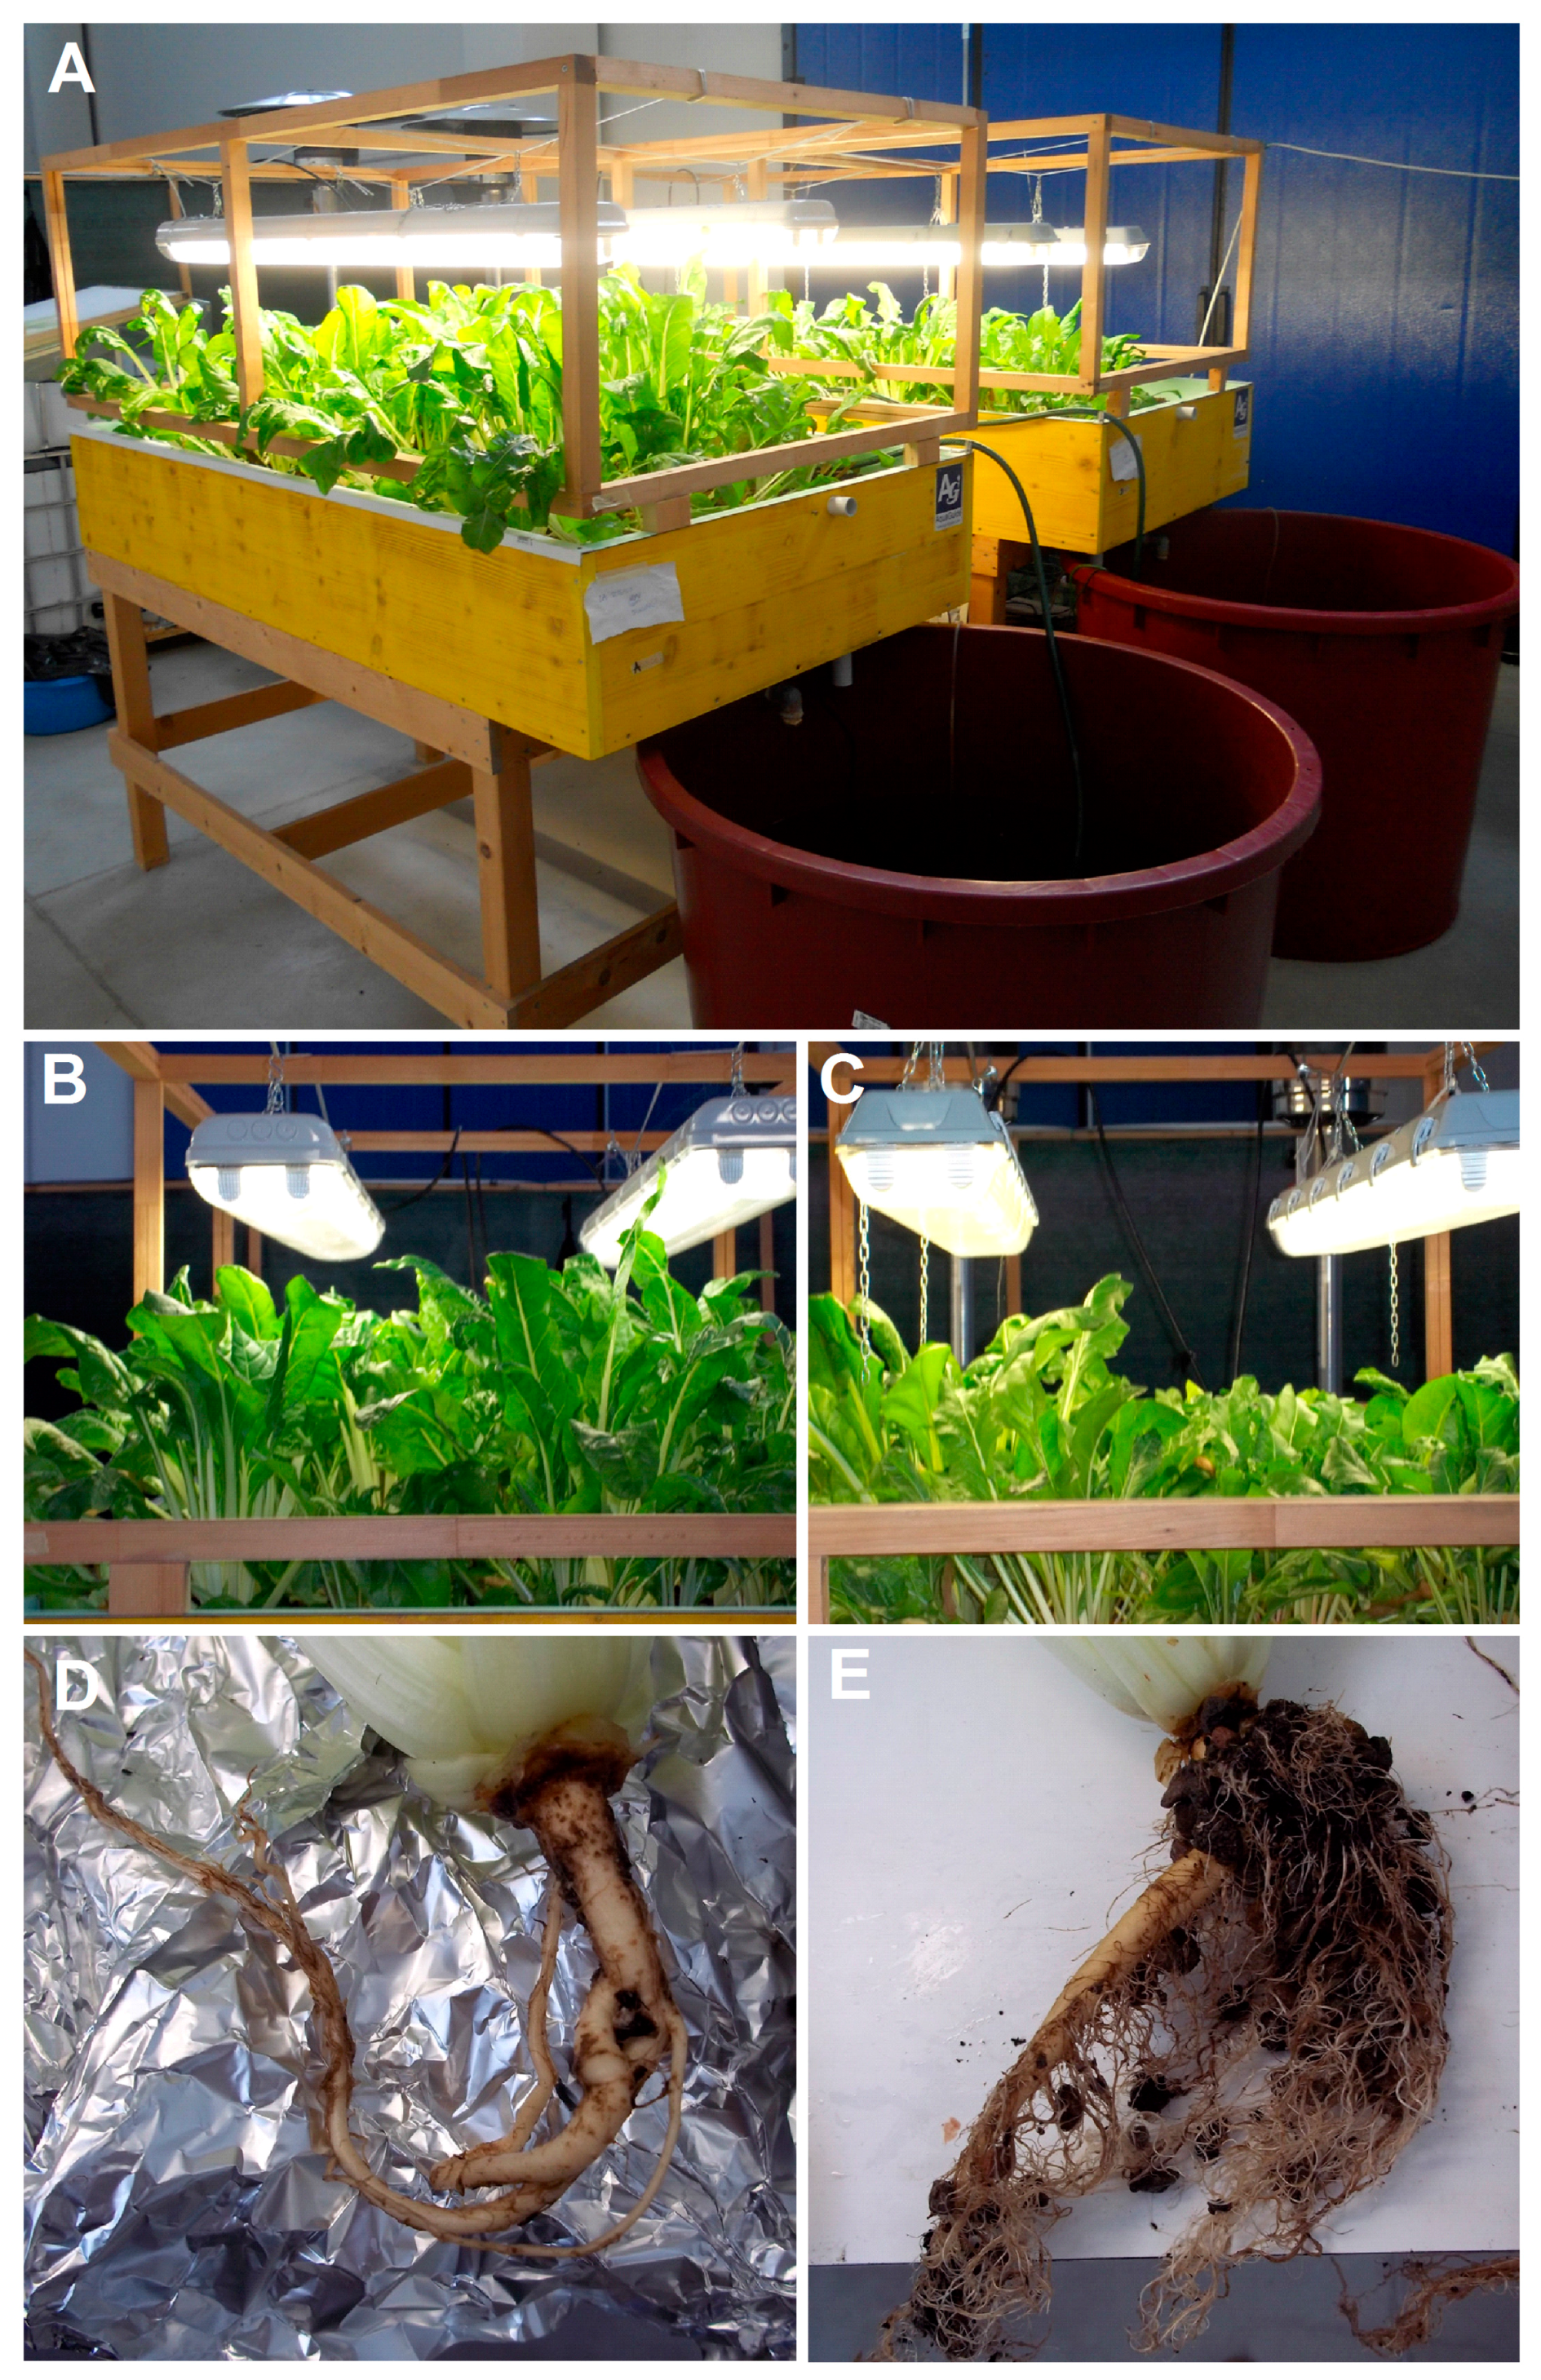
2.1. Experiment Setup
- first week: acclimation from 25 to 15 ppt; salinity was decreased 5 ppt every 48 h
- second week: acclimation from 15 to 10 ppt; salinity was decreased 2 or 3 ppt every 48 h
- third and fourth week: acclimation from 10 to 0 ppt; salinity was decreased 1 or 2 points every 48 h.
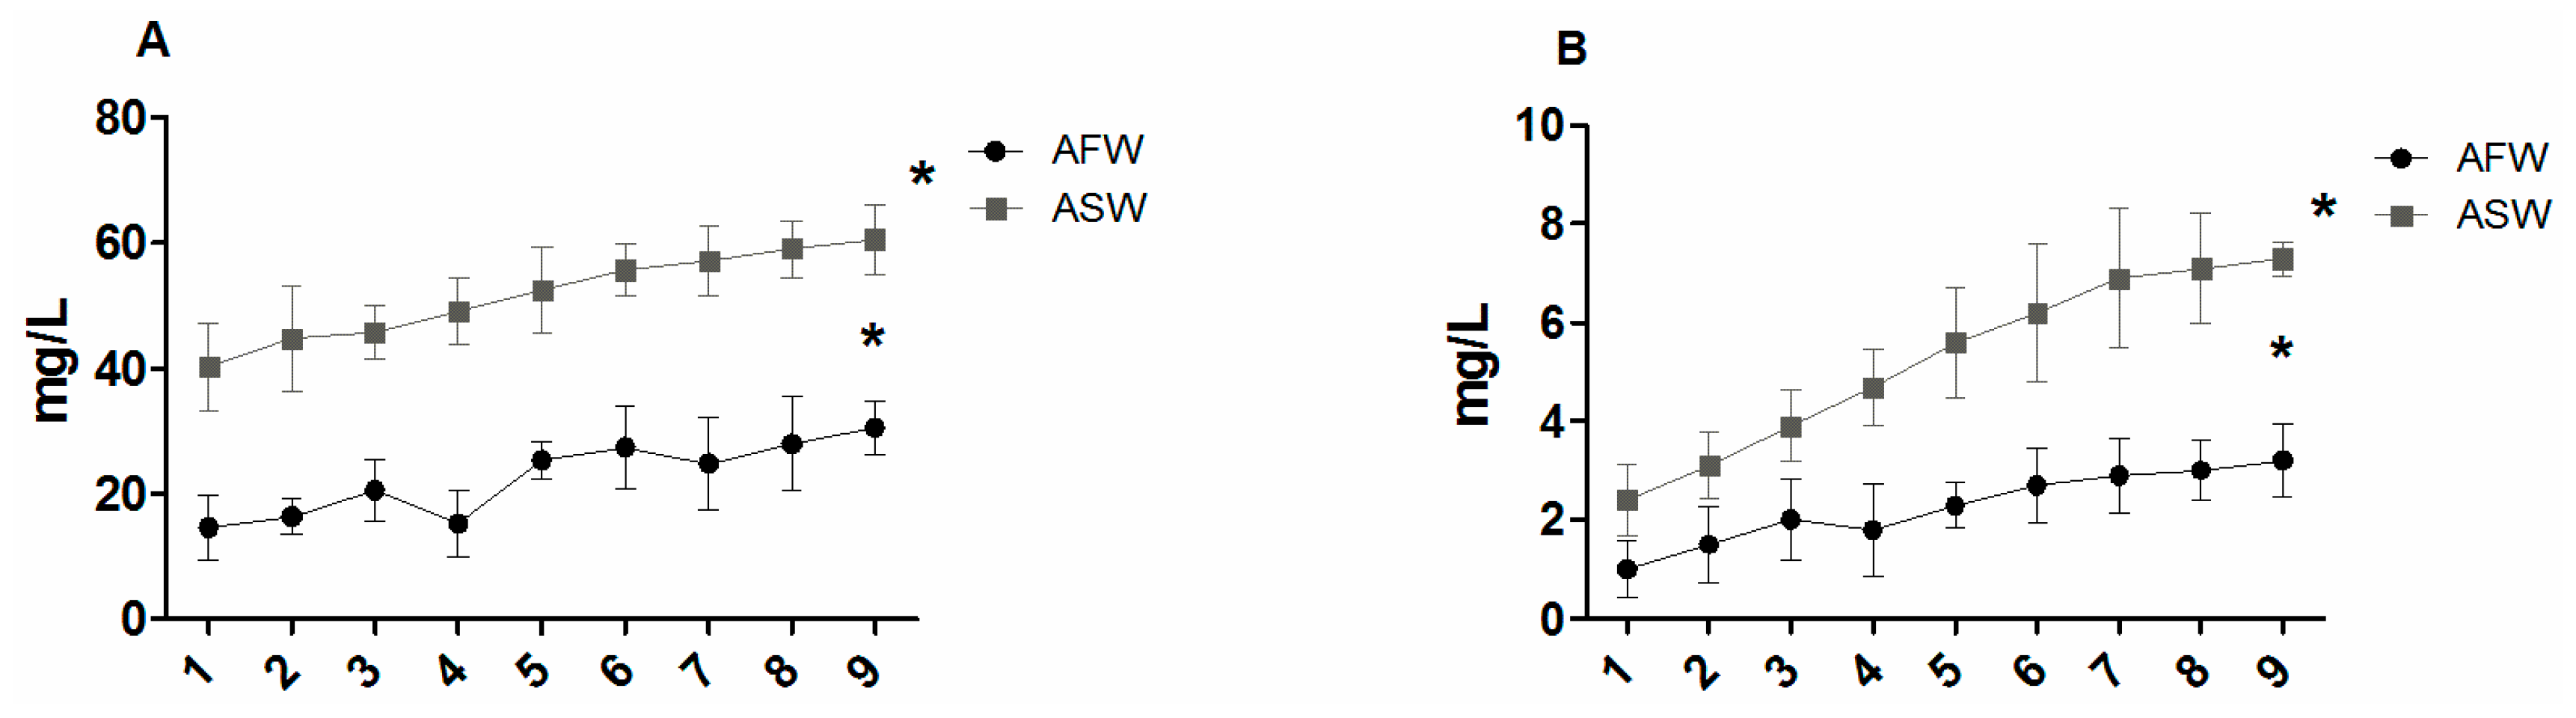
2.2. Water Parameters
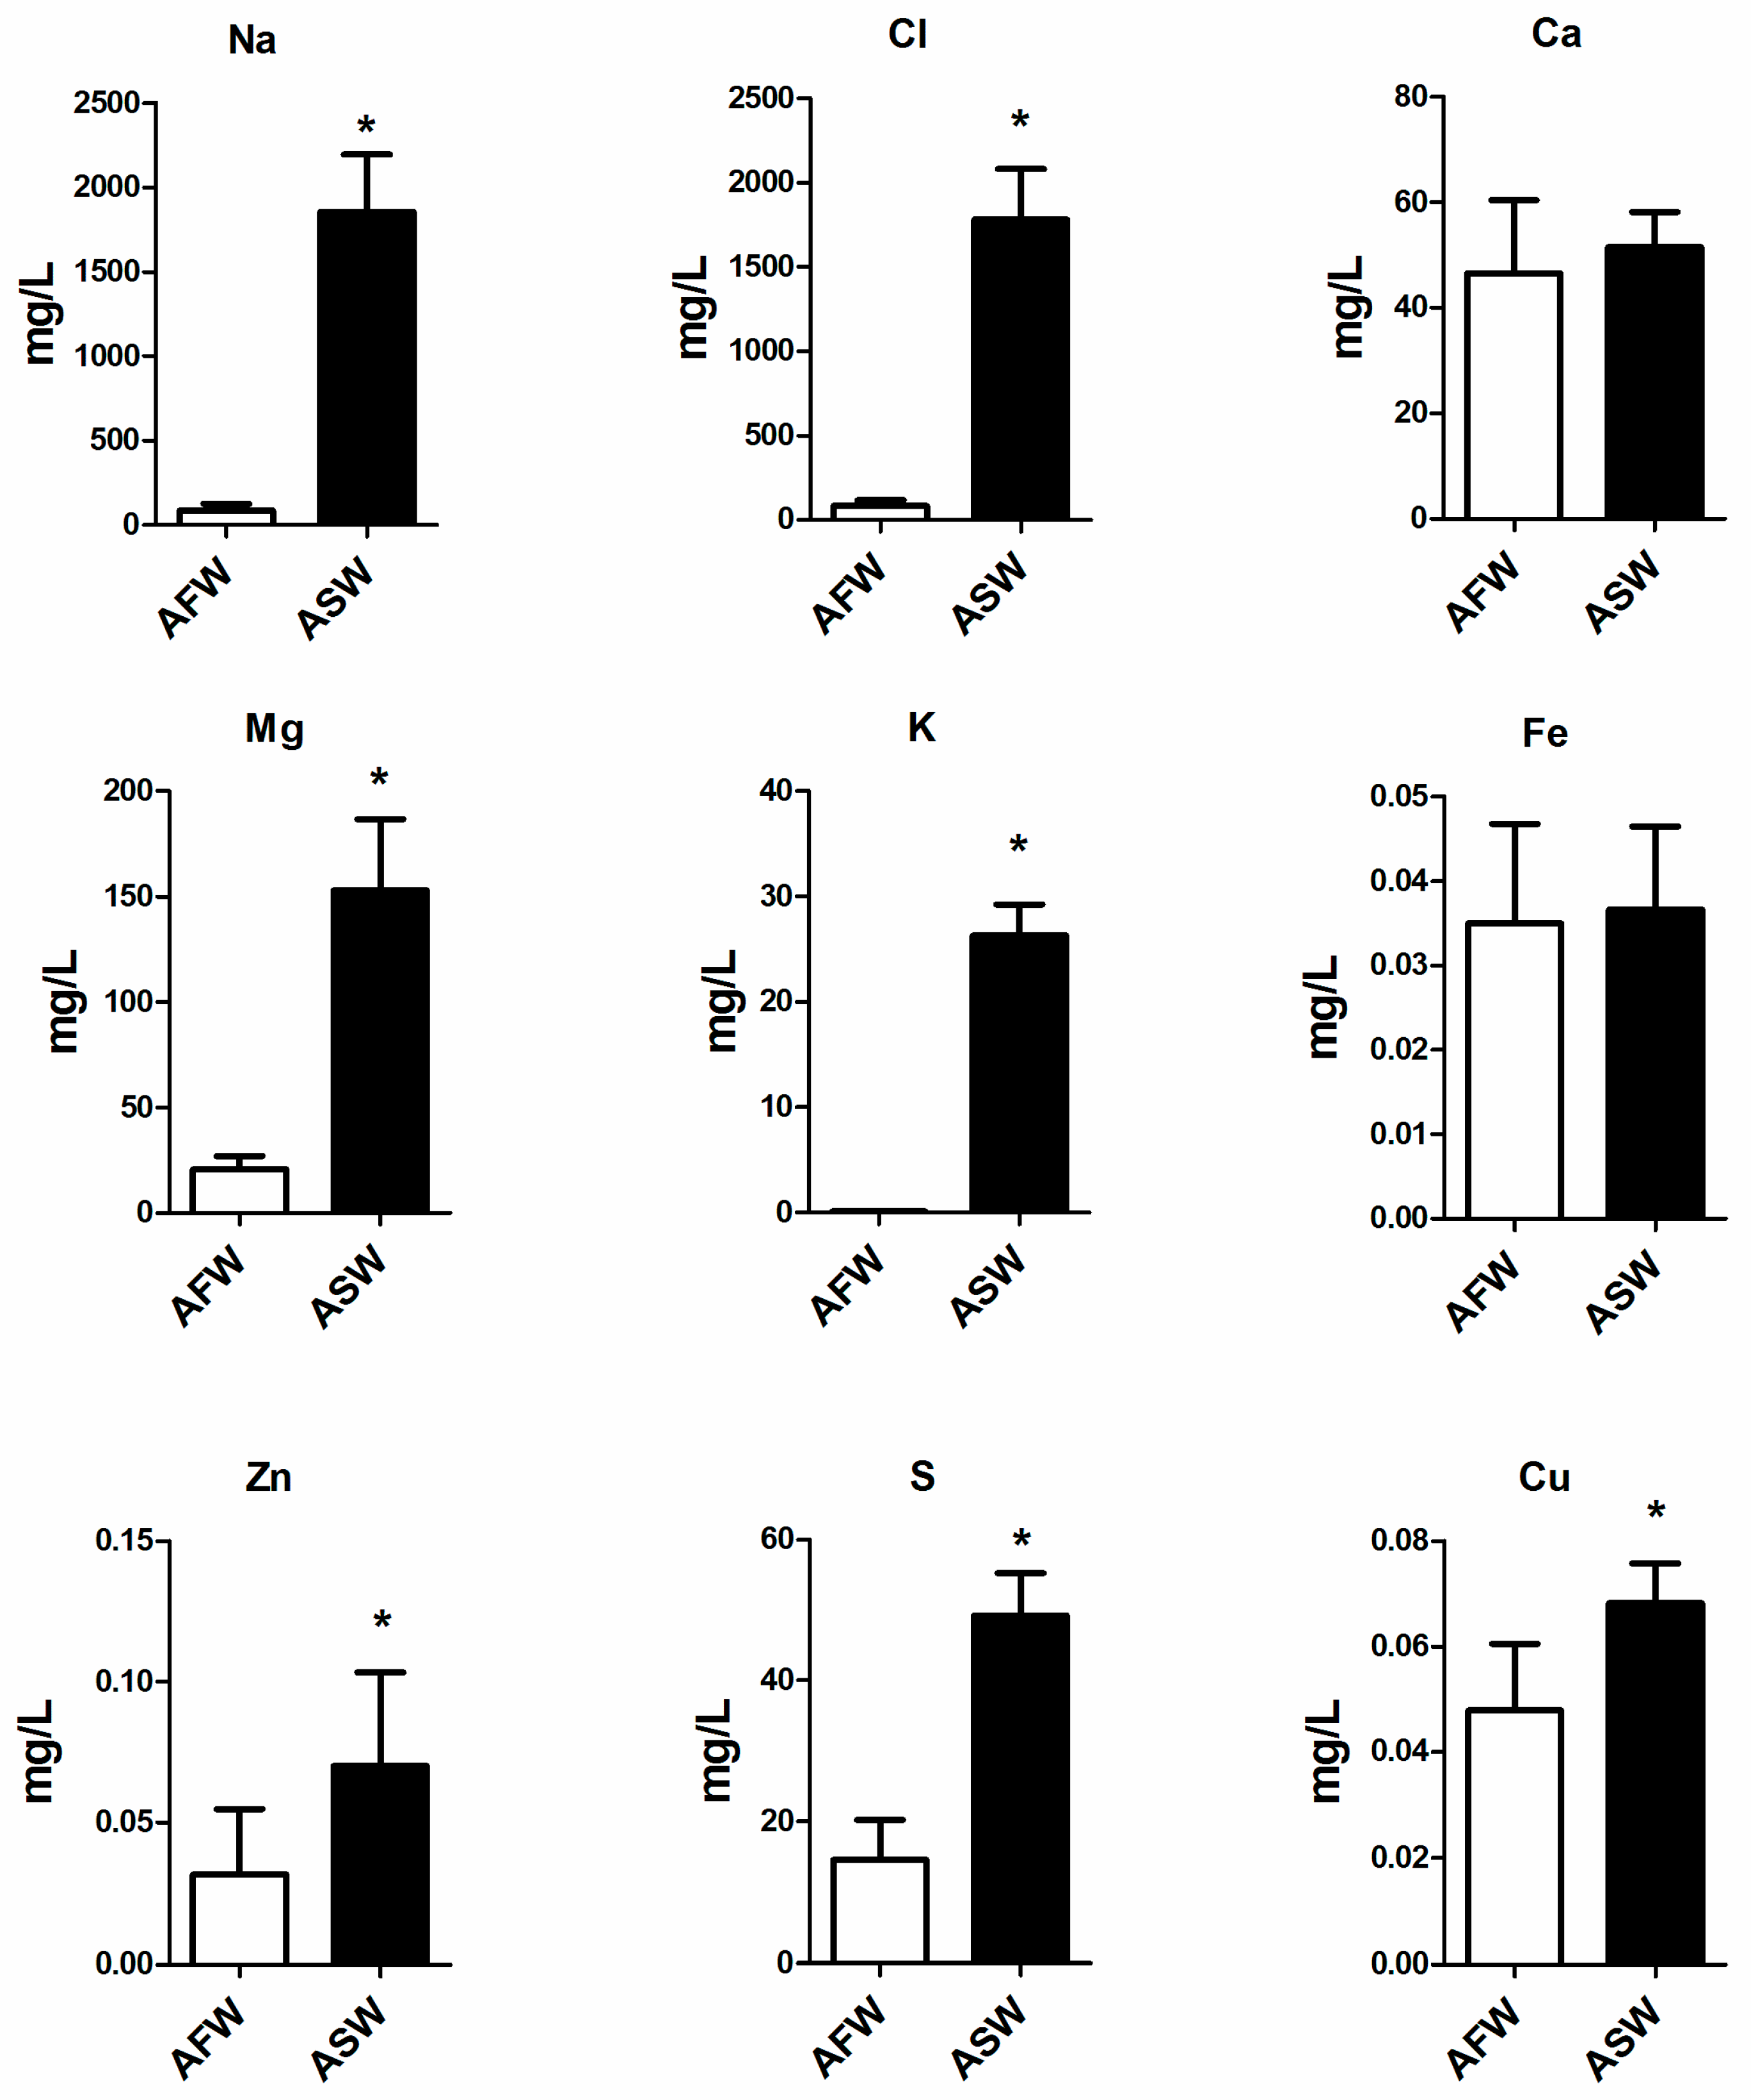
2.3. Total Reflection X-ray Fluorescence (TXRF) Spectrometry (Metals in Water)
2.4. Analyses on Fish
2.4.1. Color
2.4.2. Total Lipids
2.4.3. Determination of Fatty Acid (FA) Composition
2.5. Plants Biometric Data
2.6. FTIR-Fourier Transform Infrared Spectroscopy: Fish and Plants
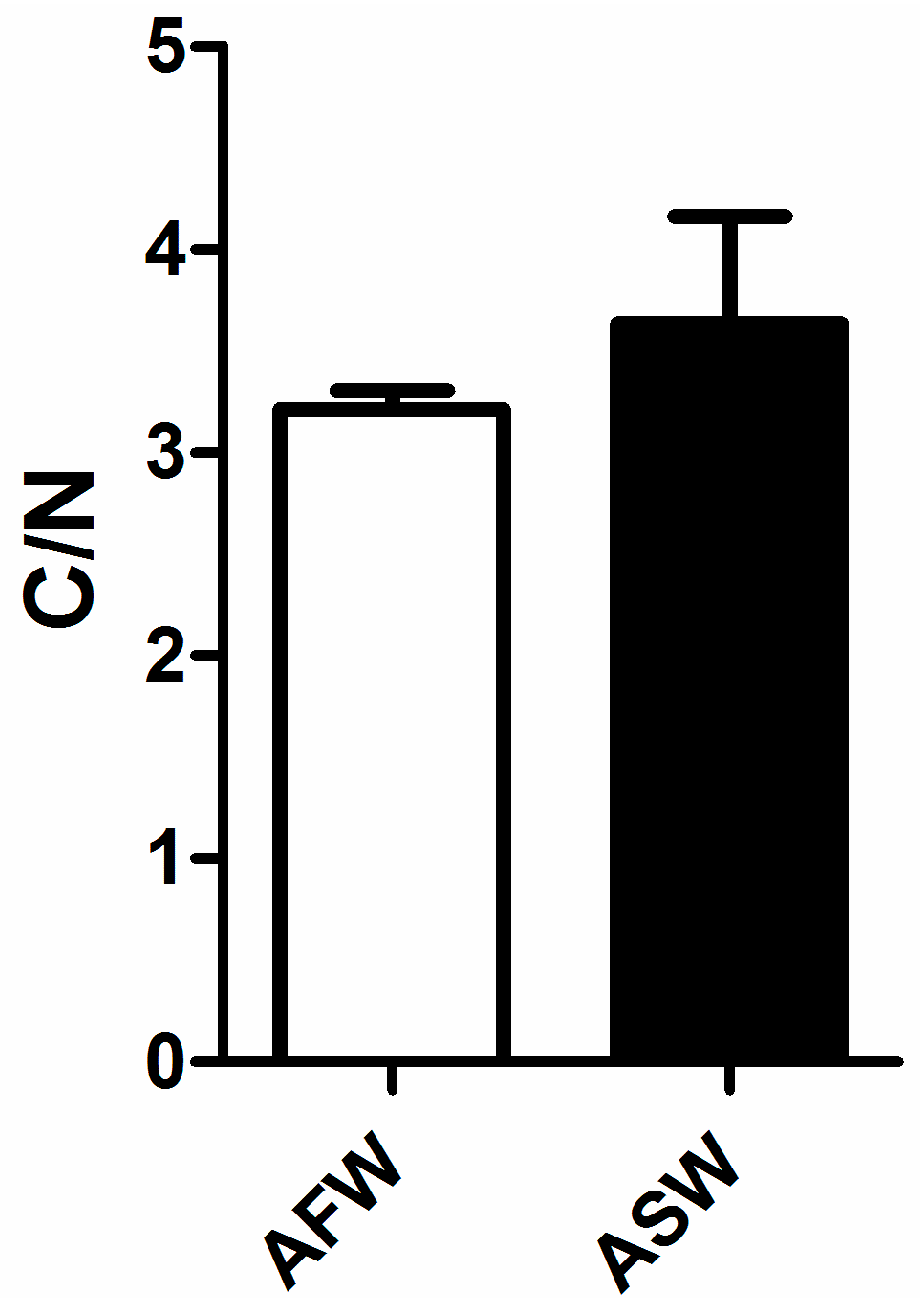
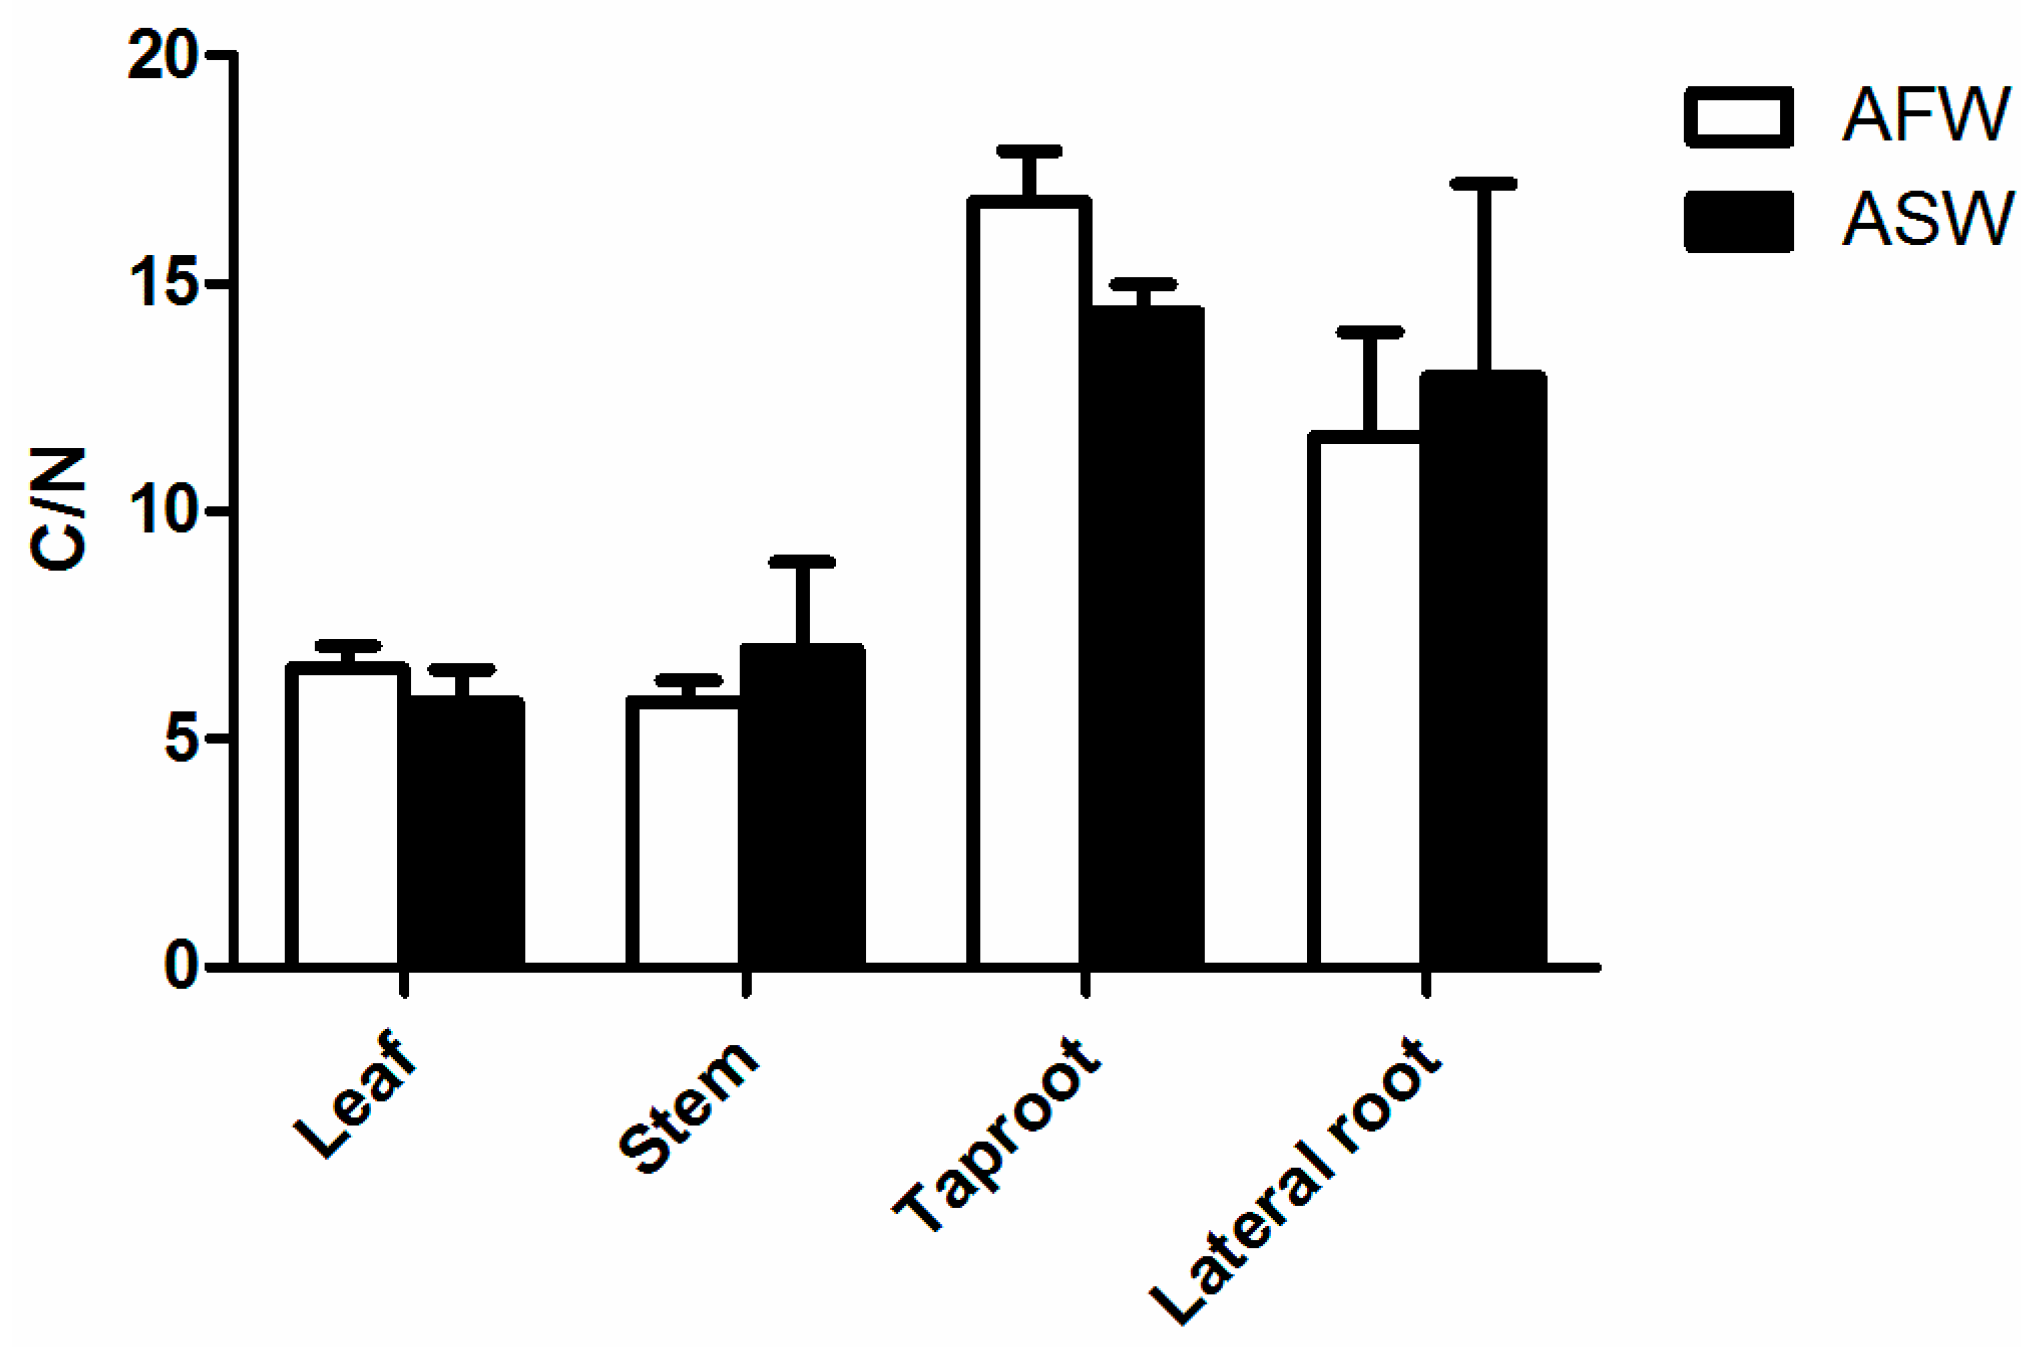
2.7. Carbon to Nitrogen Ratio (CNS Analysis)
2.8. Statistical Analysis
3. Results
3.1. Water Quality
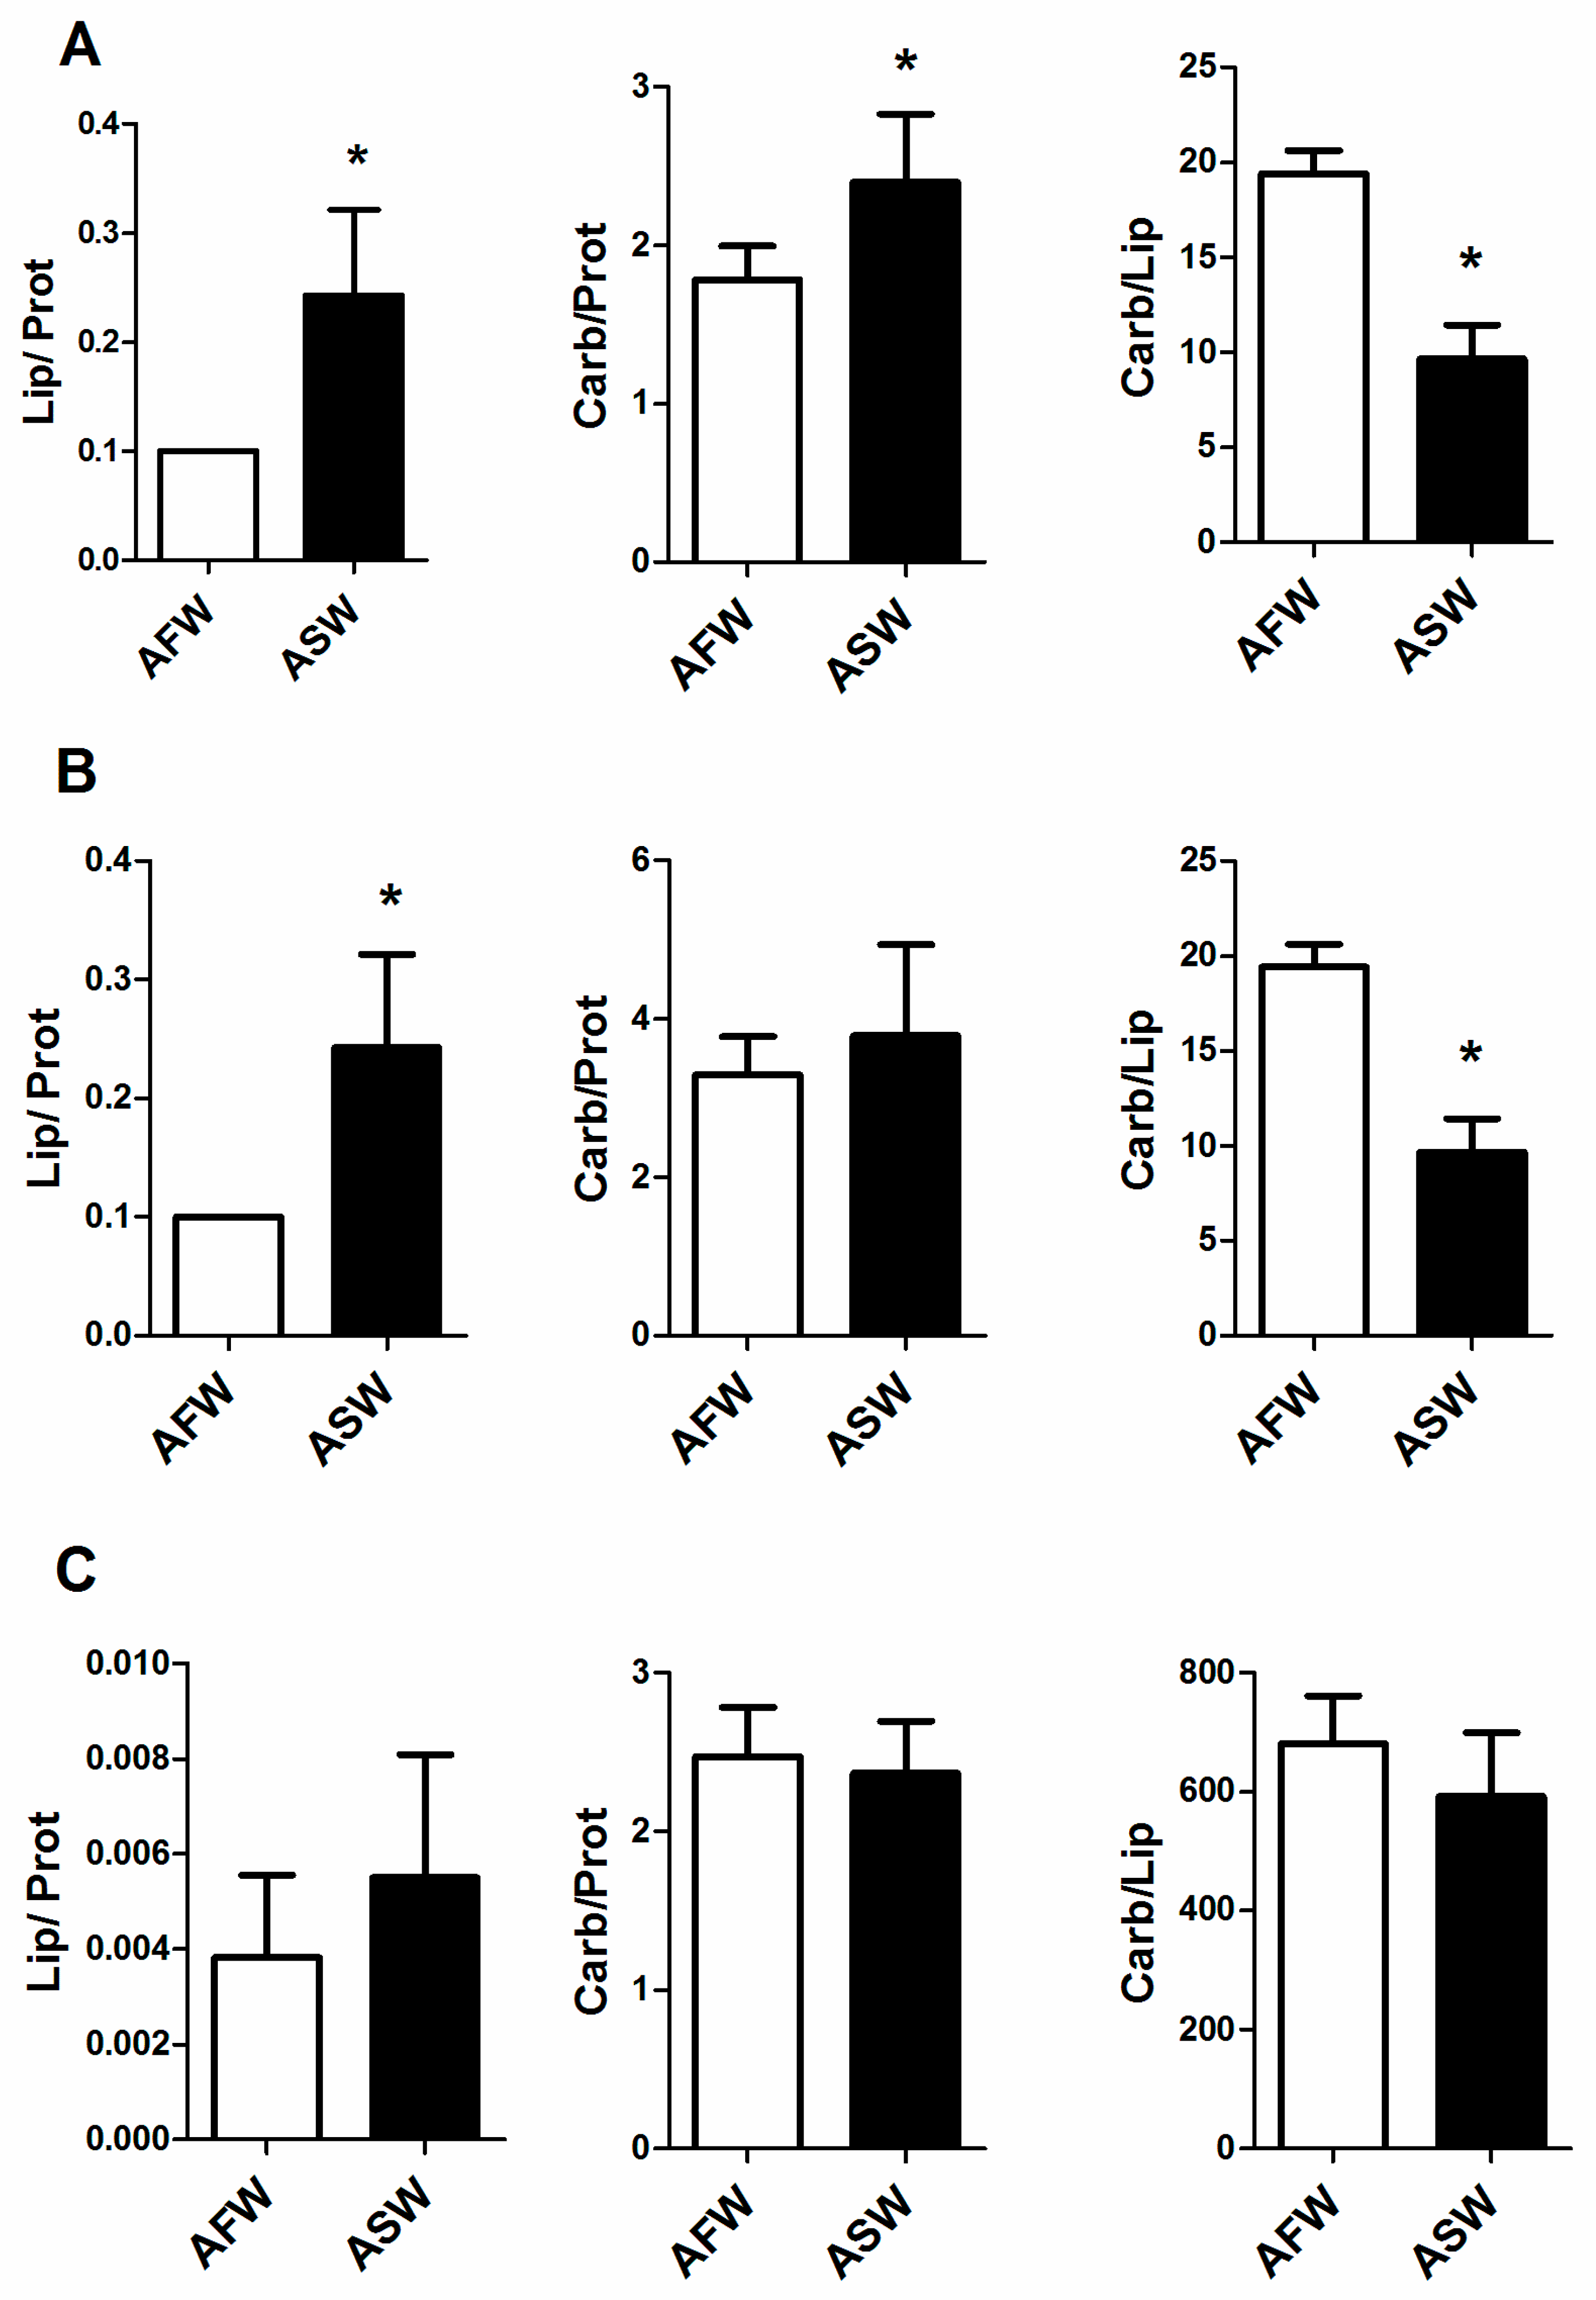
3.2. Plant Quality
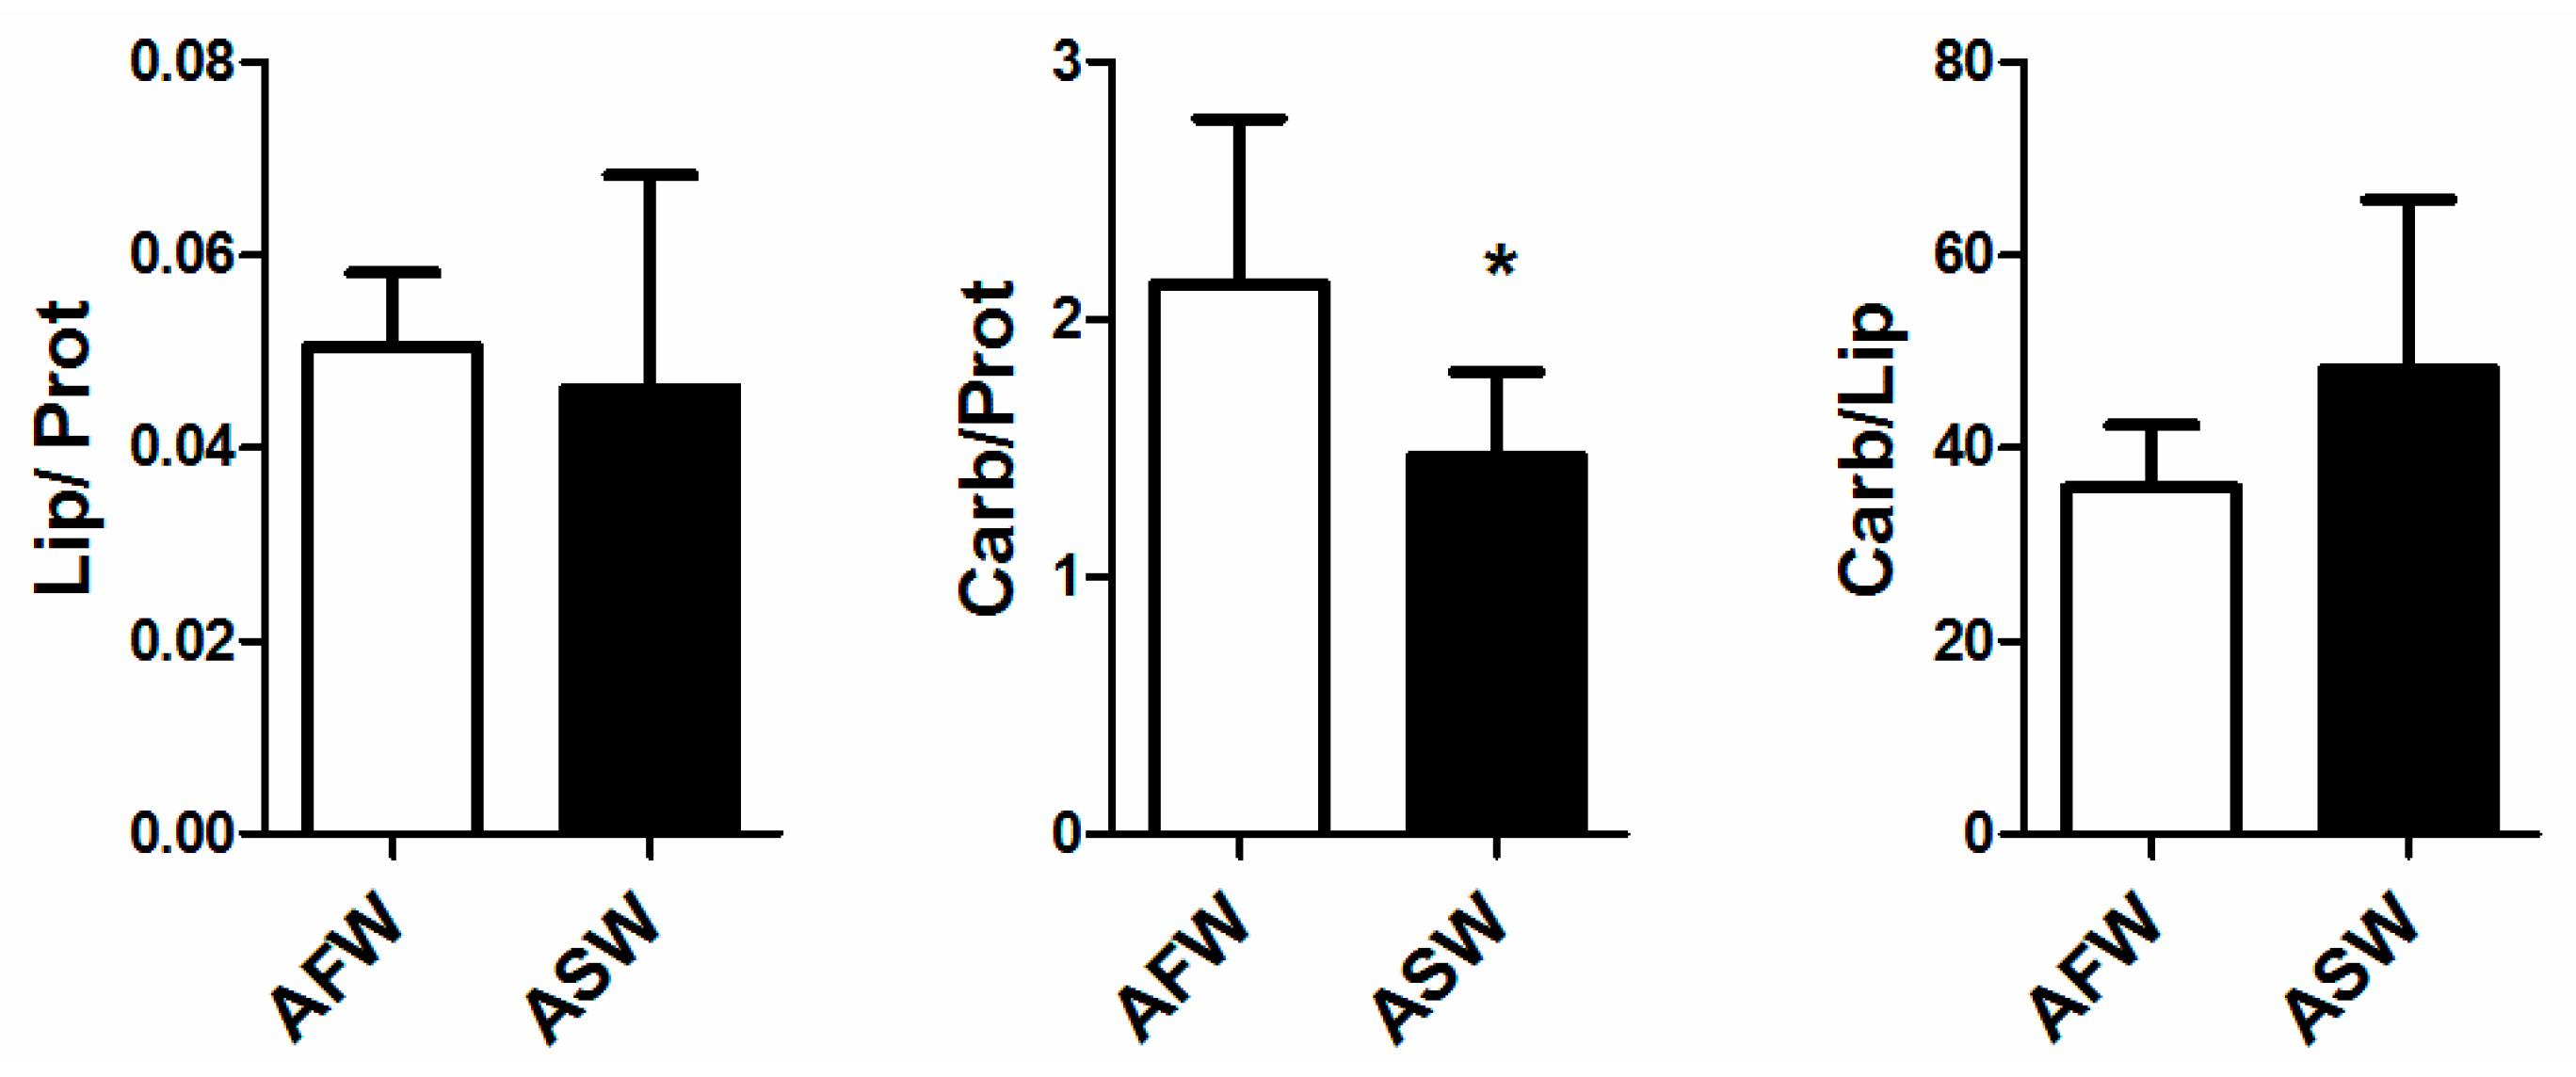
3.3. Fish Quality
4. Discussion
4.1. Water
4.2. Plants
4.3. Fish
5. Conclusions
Acknowledgments
Author Contributions
Conflicts of Interest
References
- McMurtry, M.R.; Sanders, D.C.; Cure, J.D.; Hodson, R.G.; Haning, B.C.; Amand, E.C.S. Efficiency of water use of an integrated fish/vegetable co-culture system. J. World Aquac. Soc. 1997, 28, 420–428. [Google Scholar] [CrossRef]
- Seawright, D.E.; Stickney, R.R.; Walker, R.B. Nutrient dynamics in integrated aquaculture-hydroponics systems. Aquaculture 1998, 160, 215–237. [Google Scholar] [CrossRef]
- Lennard, W.A.; Leonard, B.V. A comparison of three different hydroponic sub-systems (gravel bed, floating and nutrient film technique) in an Aquaponic Test System. Aquac. Int. 2006, 14, 539–550. [Google Scholar] [CrossRef]
- Kotzen, B.; Appelbaum, S. An investigation of aquaponics using brackish water resources in the Negev Desert. J. Appl. Aquac. 2010, 22, 297–320. [Google Scholar] [CrossRef]
- Parida, A.K.; Das, A.B. Salt tolerance and salinity effects on plants: A review. Ecotoxicol. Environ. Saf. 2005, 60, 324–349. [Google Scholar] [CrossRef] [PubMed]
- Allegrucci, G.; Caccone, A.; Cataudella, S.; Powell, J.R.; Sbordoni, V. Acclimation of the European sea bass to freshwater: Monitoring genetic changes by RAPD polymerase chain reaction to detect DNA polymorphisms. Mar. Biol. 1995, 121, 591–599. [Google Scholar] [CrossRef]
- Riche, M.A.; Pfeiffer, T.J.; Wills, P.S.; Amberg, J.J.; Sepùlveda, M.S. Inland marine fish culture in low salinity recirculating aquaculture systems. Bull. Fish. Res. Agen. 2012, 35, 65–75. [Google Scholar]
- Rakocy, J.E.; Masser, M.P.; Losordo, T.M. Recirculating aquaculture tank production systems: Aquaponics—Integrating fish and plant culture. SRAC Publ. 2006, 454, 1–16. [Google Scholar]
- Lemarié, G.; Dosdat, A.; Covès, D.; Dutto, G.; Gasset, E.; Person-Le Ruyet, J. Effect of chronic ammonia exposure on growth of European seabass (Dicentrarchus labrax) juveniles. Aquaculture 2004, 229, 479–491. [Google Scholar] [CrossRef]
- Dosdat, A.; Person-Le Ruyet, J.; Covès, D.; Dutto, G.; Gusset, E.; Le Roux, A.; Lemarié, G. Effect of chronic exposure to ammonia on growth, food utilization and metabolism of the European sea bass (Dicentrarchus labrax). Aquat. Living Resour. 2003, 16, 509–520. [Google Scholar] [CrossRef]
- Lennard, W.A.; Leonard, B.V. A comparison of reciprocating flow versus constant flow in an integrated, gravel bed, aquaponic test system. Aquac. Int. 2004, 12, 539–553. [Google Scholar] [CrossRef]
- Fanesi, A.; Raven, J.A.; Giordano, M. Growth rate affects the responses of the green alga Tetraselmis suecica to external perturbations. Plant Cell Environ. 2014, 37, 512–519. [Google Scholar] [CrossRef] [PubMed]
- Robertson, A.R.; Lozano, R.D.; Alman, D.H.; Orchard, S.E.; Keitch, J.A.; Connelly, R.; Graham, L.A.; Acree, W.L. CIE Recommendations on uniform colour space, colour difference equations and metric colour terms. Color Res. Appl. 1997, 2, 5–7. [Google Scholar]
- Folch, J.; Lees, M.; Sloane-Stanley, G.H. A simple method for the isolation and purification of total lipids from animal tissues. J. Biol. Chem. 1956, 226, 497–509. [Google Scholar]
- Morrison, W.R.; Smith, L.M. Preparation of fatty acid methyl esters and dimethylacetals from lipids with born fluoride-methanol. J. Lipid Res. 1964, 5, 600–608. [Google Scholar] [PubMed]
- Giordano, M.; Kansiz, M.; Heraud, P.; Beardall, J.; Wood, B.; Mc Naughton, D. Fourier transform infrared spectroscopy as a novel tool to investigate changes in intracellular macromolecular pools in the marine microalga Chaetoceros muellerii (Bacillariophyceae). J. Phycol. 2001, 279, 271–279. [Google Scholar] [CrossRef]
- Domenighini, A.; Giordano, M. Fourier transform infrared spectroscopy of microalgae as a novel tool for biodiversity studies, species identification, and the assessment of water quality. J. Phycol. 2009, 45, 522–531. [Google Scholar] [CrossRef] [PubMed]
- Palmucci, M.; Ratti, S.; Giordano, M. Ecological and evolutionary implication of carbon allocation in marine phytoplankton as a function of nitrogen availability: A Fourier transform infrared spectroscopy approach. J. Phycol. 2011, 47, 313–323. [Google Scholar] [CrossRef] [PubMed]
- Ratti, S.; Knoll, A.H.; Giordano, M. Did sulphate availability facilitate the evolutionary expansion of chlorophyll a + c phytoplankton in the oceans? Geobiology 2011, 9, 301–312. [Google Scholar] [CrossRef] [PubMed]
- Tyson, R.V.; Treadwel, D.D.; Simonne, E.H. Opportunities and challenges to sustainability in aquaponic systems. Horttechnology 2011, 21, 1–13. [Google Scholar]
- Grattan, S.R.; Grieve, C.M. Salinity-mineral nutrient relations in horticultural crops. Sci. Hortic. Amst. 1999, 78, 127–157. [Google Scholar] [CrossRef]
- Hsiao, T.C.; Xu, L.K. Sensitivity of growth of roots versus leaves to water stress: Biophysical analysis and relation to water transport. J. Exp. Bot. 2000, 51, 1595–1616. [Google Scholar] [CrossRef] [PubMed]
- Chalbi, N.; Martínez-Ballesta, M.C.; Youssef, N.B.; Carvajal, M. Intrinsic stability of Brassicaceae plasma membrane in relation to changes in proteins and lipids as a response to salinity. J. Plant Physiol. 2015, 175, 148–156. [Google Scholar] [CrossRef] [PubMed]
- Munns, R. Comparative physiology of salt and water stress. Plant Cell Environ. 2002, 25, 239–250. [Google Scholar] [CrossRef] [PubMed]
- Stuiver, C.E.E.; Kuiper, P.J.C.; Marschner, H.; Kylin, A. Effects of salinity and replacement of K+ by Na+ on lipid-composition in 2 sugar-beet inbred lines. Physiol. Plant. 1981, 52, 77–82. [Google Scholar] [CrossRef]
- Kuiper, P.J.C. Environmental changes and lipid metabolism of higher plants. Physiol. Plant. 1985, 64, 118–122. [Google Scholar] [CrossRef]
- Wu, J.; Seliskar, D.M.; Gallagher, J.L. The response of plasma membrane lipid composition in callus of the halophyte Spartina patens (Poaceae) to salinity stress. Am. J. Bot. 2005, 92, 852–858. [Google Scholar] [CrossRef] [PubMed]
- Mansour, M.M.F.; Salama, K.H.A.; Allam, H.Y.H. Role of the plasma membrane in saline conditions: Lipids and proteins. Bot. Rev. 2015, 81, 416–451. [Google Scholar] [CrossRef]
- Eroldoǧan, O.T.; Kumlu, M. Growth performance, body traits and fillet composition of the European sea bass (Dicentrarchus labrax) reared in various salinities and fresh water. Turkish J. Vet. Anim. Sci. 2002, 26, 993–1001. [Google Scholar]
- Xu, J.; Yan, B.; Teng, Y.; Lou, G.; Lu, Z. Analysis of nutrient composition and fatty acid profiles of Japanese sea bass Lateolabrax japonicus (Cuvier) reared in seawater and freshwater. J. Food Compos. Anal. 2010, 23, 401–405. [Google Scholar] [CrossRef]
- Eroldoǧan, O.T.; Kumlu, M.; Aktaş, M. Optimum feeding rates for European sea bass Dicentrarchus labrax L. reared in seawater and freshwater. Aquaculture 2004, 231, 501–515. [Google Scholar] [CrossRef]
- Haliloǧlu, İ.H.; Bayır, A.; Sirkecioǧlu, N.A.; Aras, M.N.; Atamanalp, M. Comparison of fatty acid composition in some tissues of rainbow trout (Oncorhynchus mykiss) living in seawater and freshwater. Food Chem. 2004, 86, 55–59. [Google Scholar] [CrossRef]
- Tocher, D.R. Omega-3 long-chain polyunsaturated fatty acids and aquaculture in perspective. Aquaculture 2015, 449, 94–107. [Google Scholar] [CrossRef]
- Van Anholt, R.D.; Spanings, F.A.T.; Nixon, O.; Wendelaar Bonga, S.E.; Koven, W.M. The effects of arachidonic acid on the endocrine and osmoregulatory response of tilapia (Oreochromis mossambicus) acclimated to seawater and subjected to confinement stress. Fish Physiol. Biochem. 2012, 38, 703–713. [Google Scholar] [CrossRef] [PubMed]
- Hunt, A.Ö.; Özkan, F.; Engin, K.; Tekelioğlu, N. The effects of freshwater rearing on the whole body and muscle tissue fatty acid profile of the European sea bass (Dicentrarchus labrax). Aquac. Int. 2010, 19, 51–61. [Google Scholar] [CrossRef]


| Parameter | Group | p-Value | RSD 1 | |
|---|---|---|---|---|
| AFW | ASW | |||
| Left Fillet (g) | 9.12 | 6.84 | ns | 1.77 |
| Right Fillet (g) | 9.00 | 6.97 | ns | 1.80 |
| Fins (g) | 0.90 | 0.76 | ns | 0.17 |
| Skin (g) | 3.08 | 2.77 | ns | 1.00 |
| Skeletal Residual. (g) | 4.33 | 4.07 | ns | 1.15 |
| Fillets (%) | 74.09 | 71.00 | ns | 5.08 |
| Fins (%) | 3.67 | 3.96 | ns | 0.46 |
| Skin (%) | 12.48 | 14.19 | ns | 3.18 |
| Skeletal Res. (%) | 17.91 | 21.05 | ns | 3.53 |
| Parameter | Group | p-Value | RSD 1 | |
|---|---|---|---|---|
| AFW | ASW | |||
| Dorsal site | ||||
| L* 2 | 20.02 | 22.20 | ns | 10.96 |
| a* 3 | 1.07 | 1.70 | ns | 2.05 |
| b* 4 | −4.25 | −4.25 | ns | 2.20 |
| Chroma | 4.94 | 5.02 | ns | 2.27 |
| Hue | 244.67 | 240.39 | ns | 58.03 |
| Ventral Site | ||||
| L* 2 | 51.54 | 58.55 | ns | 10.19 |
| a* 3 | −0.41 | 0.003 | ns | 1.50 |
| b* 4 | −1.84 B | 0.45 A | 0.0195 | 1.98 |
| Chroma | 2.97 | 2.81 | ns | 1.34 |
| Hue | 203.80 | 154.48 | ns | 67.73 |
| Parameter | Group | p-Value | RSD 1 | |
|---|---|---|---|---|
| AFW | ASW | |||
| Left fillet | ||||
| L* 2 | 9.18 | 9.63 | ns | 8.36 |
| a* 3 | 3.37 | 3.12 | ns | 4.38 |
| b* 4 | 0.52 B | 2.98 A | <0.0001 | 2.02 |
| Chroma | 5.28 | 5.70 | ns | 3.23 |
| Hue | 156.83 B | 69.74 A | 0.0410 | 81.17 |
| Right fillet | ||||
| L* 2 | 8.57 | 11.90 | ns | 8.94 |
| a* 3 | 2.63 | 5.10 | ns | 4.08 |
| b* 4 | 0.69 B | 4.79 A | <0.0001 | 2.14 |
| Chroma | 4.33 B | 8.59 A | <0.0001 | 2.97 |
| Hue | 136.81 | 74.30 | ns | 65.79 |
| Parameter | Group | p-Value | RSD 1 | |
|---|---|---|---|---|
| AFW | ASW | |||
| SFA 2 | 21.85 B | 22.89 A | 0.0004 | 0.527 |
| MUFA 3 | 30.45 | 30.02 | 0.6685 | 1.490 |
| PUFA 4 | 47.70 | 47.09 | 0.4183 | 1.759 |
| PUFAn-6 | 12.16 | 12.19 | 0.1085 | 0.619 |
| PUFAn-3 | 34.24 | 33.52 | 0.2475 | 2.170 |
| PUFAn-4 | 0.97 | 1.01 | 0.0829 | 0.038 |
| Fatty Acid | Group | p-Value | RSD 1 | |
|---|---|---|---|---|
| AFW | ASW | |||
| C12:0 | 0.05 B | 0.05 A | 0.0230 | 0.009 |
| C14:1n-5 | 0.05 B | 0.06 A | 0.0064 | 0.010 |
| C15:0 | 0.36 B | 0.40 A | 0.0009 | 0.019 |
| C16:0 | 17.29 B | 18.20 A | 0.0016 | 0.564 |
| C16:1n-9 | 0.35 | 0.37 | ns | 0.030 |
| C16:1n-7 | 4.63 | 4.91 | ns | 0.371 |
| C16:2n-4 | 0.21 B | 0.26 A | 0.0086 | 0.033 |
| C17:0 | 0.23 B | 0.27 A | 0.0150 | 0.031 |
| C16:3n-4 | 0.47 | 0.47 | ns | 0.034 |
| C 17:1 | 0.06 | 0.10 | ns | 0.040 |
| C16:4n-1 | 0.26 | 0.29 | ns | 0.026 |
| C18:0 | 3.64 | 3.69 | ns | 0.161 |
| C18:1n-9(cis + trans) | 15.78 | 15.40 | ns | 1.080 |
| C18:1n-7 | 2.13 | 2.16 | ns | 0.080 |
| C18:2n-6 | 10.33 | 10.29 | ns | 0.678 |
| C18:2n-4 | 0.15 | 0.15 | ns | 0.010 |
| C18:3n-6 | 0.23 | 0.21 | ns | 0.075 |
| C18:3n-4 | 0.14 | 0.13 | ns | 0.011 |
| C18:3n-3 | 1.80 | 1.74 | ns | 0.119 |
| C18:4n-3 | 1.59 | 1.59 | ns | 0.103 |
| C18:4n-1 | 0.08 | 0.08 | ns | 0.019 |
| C20:0 | 0.18 | 0.19 | ns | 0.006 |
| C20:1n-11 | 0.42 | 0.40 | ns | 0.024 |
| C20:1n-9 | 3.14 | 3.05 | ns | 0.127 |
| C20:1n-7 | 0.14 | 0.14 | ns | 0.005 |
| C20:2n-6 | 0.41 | 0.44 | ns | 0.027 |
| C20:3n-6 | 0.08 | 0.07 | ns | 0.009 |
| C20:4n-6 | 0.81 B | 0.91 A | 0.0350 | 0.095 |
| C20:3n-3 | 0.08 | 0.07 | ns | 0.004 |
| C20:4n-3 | 0.52 | 0.50 | ns | 0.023 |
| C20:5n-3 | 9.71 | 9.89 | ns | 0.440 |
| C20:0 | 0.04 | 0.04 | ns | 0.012 |
| C22:1n-11 | 3.30 | 3.02 | ns | 0.231 |
| C22:1n-9 | 0.39 B | 0.36 A | 0.0069 | 0.020 |
| C22:1n-7 | 0.05 | 0.04 | ns | 0.010 |
| C22:2n-6 | 0.004 | 0.000 | ns | 0.011 |
| C22:4n-6 | 0.07 | 0.06 | ns | 0.009 |
| C22:5n-6 | 0.21 | 0.21 | ns | 0.019 |
| C22:5n-3 | 1.79 B | 1.66 A | 0.0159 | 0.103 |
| C24:0 | 0.07 B | 0.05 A | 0.0325 | 0.012 |
| C22:6n-3 | 18.74 | 18.07 | ns | 1.896 |
© 2016 by the authors; licensee MDPI, Basel, Switzerland. This article is an open access article distributed under the terms and conditions of the Creative Commons Attribution (CC-BY) license (http://creativecommons.org/licenses/by/4.0/).
Share and Cite
Nozzi, V.; Parisi, G.; Di Crescenzo, D.; Giordano, M.; Carnevali, O. Evaluation of Dicentrarchus labrax Meats and the Vegetable Quality of Beta vulgaris var. cicla Farmed in Freshwater and Saltwater Aquaponic Systems. Water 2016, 8, 423. https://doi.org/10.3390/w8100423
Nozzi V, Parisi G, Di Crescenzo D, Giordano M, Carnevali O. Evaluation of Dicentrarchus labrax Meats and the Vegetable Quality of Beta vulgaris var. cicla Farmed in Freshwater and Saltwater Aquaponic Systems. Water. 2016; 8(10):423. https://doi.org/10.3390/w8100423
Chicago/Turabian StyleNozzi, Valentina, Giuliana Parisi, Davide Di Crescenzo, Mario Giordano, and Oliana Carnevali. 2016. "Evaluation of Dicentrarchus labrax Meats and the Vegetable Quality of Beta vulgaris var. cicla Farmed in Freshwater and Saltwater Aquaponic Systems" Water 8, no. 10: 423. https://doi.org/10.3390/w8100423