Article

The Effect of Particle Size Distribution on the Design of Urban Stormwater Control Measures

U.S. Geological Survey—Wisconsin Water Science Center, 8505 Research Way, Middleton, WI 53562, USA
*
Author to whom correspondence should be addressed.
Water 2016, 8(1), 17; https://doi.org/10.3390/w8010017
Submission received: 20 October 2015 / Revised: 18 December 2015 / Accepted: 31 December 2015 / Published: 6 January 2016
(This article belongs to the Special Issue BMP Development, Implementation, and Performance)

Abstract

:
An urban pollutant loading model was used to demonstrate how incorrect assumptions on the particle size distribution (PSD) in urban runoff can alter the design characteristics of stormwater control measures (SCMs) used to remove solids in stormwater. Field-measured PSD, although highly variable, is generally coarser than the widely-accepted PSD characterized by the Nationwide Urban Runoff Program (NURP). PSDs can be predicted based on environmental surrogate data. There were no appreciable differences in predicted PSD when grouped by season. Model simulations of a wet detention pond and catch basin showed a much smaller surface area is needed to achieve the same level of solids removal using the median value of field-measured PSD as compared to NURP PSD. Therefore, SCMs that used the NURP PSD in the design process could be unnecessarily oversized. The median of measured PSDs, although more site-specific than NURP PSDs, could still misrepresent the efficiency of an SCM because it may not adequately capture the variability of individual runoff events. Future pollutant loading models may account for this variability through regression with environmental surrogates, but until then, without proper site characterization, the adoption of a single PSD to represent all runoff conditions may result in SCMs that are under- or over-sized, rendering them ineffective or unnecessarily costly.

Graphical Abstract

1. Introduction

Environmental managers depend on accurate water quality data to help identify sources of pollutants in the urban environment so they may better choose stormwater control measures (SCMs) that optimize reduced risk to receiving waters. The selection process has historically centered on the efficiency at which a device or structure can remove pollutants from stormwater runoff. Predictive models are currently being used to evaluate the efficiency of SCMs, their optimal placement and their aggregated impact on water quality compliance at both the reach and watershed scale. Accurate representation of pollutant concentrations and the distribution of particles in runoff are especially important to assure these models provide useful results. Once tested, models can be one of the only cost effective approaches to developing watershed plans in urban areas when confronted with the high cost of monitoring every source and SCM. For example, the Wisconsin Department of Natural Resources (WDNR) has promulgated a series of stormwater performance standards that will require qualifying cities to reduce the annual total suspended solids (TSS) load in urban runoff from newly-developed areas by 80 percent [1]. Models are used by permittees to help implement various SCMs to meet reduction targets. Another example is the development of total maximum daily loads (TMDLs) for impaired waters under Section §303(d) of the Clean Water Act [2]. Urban areas around the country are subject to the development of TMDLs that require the use of models to calculate the maximum amount of pollutant a water body can receive in order to maintain beneficial use and serve as metrics with which successful implementation of SCMs is determined.
In order to properly assess the pollutant removal capabilities of SCMs, the design and selection should account for accurate characterization of particle size, because it is one of the parameters having the greatest influence on sediment transport [3]. Inaccurate characterization of pollutant concentrations and distributions could generate erroneous results that can significantly reduce the effectiveness of watershed planning. The design of most SCMs available today generally makes use of settling as the primary form of treatment. The design of these structures is commonly based on theoretical principles that rely on assumed values when characterizing the range of particles they are designed to treat, such as density, distribution, flow rate, temperature and detention time [4]. The highly variable nature of urban runoff limits the adoption of a single particle size distribution (PSD), yet engineers and designers often resort to using some statistical representation of the average condition [5,6]. For example, Wisconsin and Minnesota recommend use of a generalized PSD reported by the Nationwide Urban Runoff Program (NURP) [7] when designing wet detention ponds (median particle diameter (d50) = 8 μm). Other regulating authorities call for the use of manufactured PSDs when sizing SCMs or to validate advertised removal efficiencies by manufacturers of proprietary stormwater technologies. The PSDs are often specified in state or local verification protocols. For example, the Washington Department of Ecology recommends use of U.S. Silica Sil-Co-Sil® 106 ground silica to be used during laboratory testing (d50 = 19 μm), whereas the city of Indianapolis requires the use of Oklahoma-110 silica sand (d50 = 90 μm) [8]. Under controlled laboratory conditions, simulating particles of known PSD, shape and density yields reliable performance results. In comparison, the dynamic distribution in the density gradient of inorganic and organic particles in urban runoff makes field validation of claimed removal efficiencies difficult. Given the wide range of median particle diameters for the NURP distribution, Sil-Co-Sil® 106 and Oklahoma-110, selection of a PSD becomes critical when determining the removal efficiency of various SCMs.
Previous studies recognized the need for characterization of PSD in runoff from urban sources [9,10,11], yet it remains a parameter that is seldom measured [12]. Many of the studies reporting PSDs from urban areas indicate substantial variability, both within and between runoff events [5,6,9,13]. To complicate matters, differences in sample collection, processing, analytical and reporting methods have resulted in a wide range of concentrations and distributions from similar sources [5,14]. A synthesis of over 800 literature sources on best management practice (BMP) performance identified the need for better guidance on proper monitoring and reporting of stormwater BMPs [15]. Some variation can be attributed to a combination of site conditions and rainfall/runoff characteristics that are both temporal and spatial [16,17]; however, the correlation of PSDs in urban runoff to potential explanatory variables, such as land use, rainfall characteristics, seasonality and geography, is sparse. Consequently, comparisons amongst and between SCMs become less informative because of the high level of uncertainty in the measured data. Furthermore, inaccurate representation of particulate matter and pollutants in urban runoff can lead to the design of under- or over-sized structures, rendering them either ineffective or unnecessarily costly.
One way to reduce uncertainty is to increase the number of samples used in data analysis [18]. This is often infeasible due to the associated increased costs of sampling campaigns. An alternative way to minimize uncertainty is to limit external sources common to methods used for sample collection, processing and analysis. Recent advancements in sample collection have greatly reduced variability and bias in urban runoff data (e.g., Selbig [6]), which have resulted in the ability to predict PSD through regression with common climatic variables [19]. While simulation of PSDs shows great promise, restrictions of the site-specific nature of the regression models limit their transferability; however, additional refinements may lead to continuous simulation of PSDs in existing urban pollutant loading models.
This study shows how land use and source area-based characterization of PSD in urban stormwater should be used when designing SCMs that use settling as the primary method to achieve pollutant reduction goals. An urban pollutant loading model was used to demonstrate how selection of the PSD in runoff influent to a simulated wet pond or catch basin can greatly alter the surface area needed to meet prescribed TSS reduction goals. Differences in SCM size were based on PSDs representing a single “one-size-fits-all” curve representative of all urban areas, PSDs that are specific to the modeled urban source areas or land use and seasonal PSDs developed using statistical regression with climate variables. Although the results are specific to each SCM, any device that uses PSD in the computation of sediment removal efficiency would likely produce similar results. The data presented herein are intended to help environmental managers understand some of the implications behind the selection of PSD datasets used in the design of SCMs for the removal of sediment in stormwater.

2. Materials and Methods

Data were compiled from two previous studies characterizing particle size distributions in urban runoff: (1) the Environmental Protection Agency’s early attempt to characterize pollutants in urban stormwater as part of the Nationwide Urban Runoff Program (NURP) [20]; and (2) a comparison of PSDs in stormwater using different sample collection technologies [6].

2.1. Site Description

2.1.1. Commercial Parking Lot

The 2.4-hectare commercial parking lot served an adjacent shopping center complex (Figure 1). The asphalt-based surface was approximately five years old at the time of study. Runoff is collected into multiple storm-sewer inlets throughout the drainage area, then conveyed through a common concrete, 0.91-m diameter circular pipe. There were no catch basins or other sediment removing structures in the drainage network upstream of the monitoring location. Roof runoff was internally drained directly to the storm sewer, but was not part of the flow measured from the parking lot. A more complete summary of the geographic setting and physical description can be found in Selbig [21].

2.1.2. Residential Basin

The medium-density residential basin (Figure 1) drained 21.2 hectares into a 1.07-m diameter storm sewer. Pervious surfaces (lawns) made up 66 percent of the basin area, and impervious surfaces (streets, roofs, driveways) made up 34 percent. The asphalt-based street widths were typically 10 m from curb to curb. There were no catch basins in the storm drainage network. A more complete summary of the geographic setting and physical description can be found in Selbig and Bannerman [16].

2.2. Development of PSDs

2.2.1. The Nationwide Urban Runoff Program

Between 1979 and 1983, the U.S. Environmental Protection Agency (USEPA) began a comprehensive effort to characterize urban stormwater pollution in 28 cities across the United States as part of NURP [7]. Water quality samples at monitored locations were collected by use of autosamplers with a fixed sample intake in a storm sewer. In addition to measuring pollutant concentrations, settling tests were done on a number of NURP samples to derive a range of settling velocities for particles found in urban runoff. The following is a brief summary of the methods used to determine the NURP PSD; additional details can be found in USEPA [22].
Figure 1. Location of the residential basin (1) and commercial parking lot (2) study areas, Madison, Wisconsin.
Water 08 00017 g001
Settling velocities were determined by use of a settling column of 15.2 cm in diameter and 1.8 m high fitted with a series of sample ports spaced vertically throughout the column. Measurements of solids concentration in the water were collected at each sampling port over time. The concentration measured in samples from each port location representing the settling depth and the sample time were used to calculate a settling velocity. A probability plot of results from all samples described the overall distribution of settling velocity. Resulting settling velocities were later converted to particle diameter using Stokes’ law [23]. The results of the Stokes’ law calculations showed a wide range in particle sizes in any sample of stormwater runoff. Analysis of these PSDs showed substantial variability between separate storms at a single site, as well as between individual storms at different sites. Because site-to-site differences were of the same order as storm-to-storm variations at a particular site, all data were combined to develop a single PSD representing “typical” urban stormwater runoff (Figure 2A,B). Although the final PSD was considered “typical”, it was intended only as an initial screening tool; recommendations for additional site-specific data were encouraged [22].
Figure 2. Individual event and median (bold) particle size distributions measured at the commercial parking lot (A) (n = 20) and residential basin (B) (n = 19) compared to the Nationwide Urban Runoff Program (NURP) (blue).
Water 08 00017 g002

2.2.2. Measured Distributions Using Improved Sample Collection Technology

Stratification of sediment by particle size in a flowing water column has previously been identified as a potentially major source of variability and bias in urban stormwater [24,25,26]. In 2008, the USGS developed a depth-integrated sample arm (DISA) as a means to collect water quality samples from multiple points throughout the water column, thereby reducing bias associated with the stratification of solids in stormwater [24]. This is an important distinction from NURP sample collection methods, which acquired a water sample from a single point in the water column. Laboratory testing showed that the DISA was able to measure sediment concentrations within 7 percent of the true value [27]. The DISA has been used to improve the characterization of sediment concentrations and PSDs in urban stormwater runoff from several different urban source areas and land uses that have consistently shown large departures from the NURP PSD [6]. For brevity, this paper presents measured PSDs from one source area (commercial parking lot) and one land use (residential), both illustrated in Figure 2A,B, respectively.
Water quality samples were collected by use of an automated sampler and DISA. Flow-paced sub-samples covering the storm hydrograph were combined into a single, composite sample. Samples were preserved at 4 °C and delivered to the Wisconsin State Laboratory of Hygiene (WSLH) within 48 h. Upon receipt of the sample, the WSLH determined the total mass of water after correcting for the weight of the container. The sample was then wet sieved through a series of stacked nylon mesh sieves, which separated the solid-phase material from the sample into five separate particle size fractions: ≥500, 250 to <500, 125 to <250, 63 to <125 and 32 to <63 μm. Material retained on each sieve was transferred into a clean, tared, heat-tolerant container and dried overnight at 105 °C. The mass of dried material recovered from each sieve was measured and recorded. This process was repeated for each of the five size fractions. The mass of particles <32 μm was quantified by use of a 0.4-μm filter. An aliquot of the <32-μm filtrate was characterized by use of a Coulter counter into five additional particle size fractions: 14 to <32, 8 to <14, 5 to <8, 2 to <5 and <2 μm. The Coulter counter counts the number of particles in each fraction and reports them as a percentage of the total. Each percentage was then multiplied by the mass of the <32-μm sample to determine the mass of each fraction. The complete distribution of particles was then reported in terms of the percentage of all particles in a water sample that is finer (by mass) than a specific particle size.
A total of 20 precipitation events were sampled for the determination of PSD at the commercial parking lot and 19 at the residential basin. Table 1 categorizes the number of sampled events by season. Tests for normality by use of the Shapiro–Wilk test [28] showed that most of the individual particle size fractions, across all samples, did not fit a normal or log-normal distribution, indicating skewness and variability. The degree of variability is most apparent in Figure 2, which illustrates particle size distributions from all samples collected at each study location. Given the degree of variability and lack of normality in the data, the median distribution was chosen as the most accurate representation of each particle size fraction from each study area, because the median is a better representation of the population center in highly skewed datasets than the mean [28].
Table 1. Number of precipitation events sampled for the determination of PSD by season in the commercial parking lot and residential basin study areas.
Study SiteSpring (April–May)Summer (June–August)Fall (September–October)
Commercial Parking Lot695
Residential Basin883

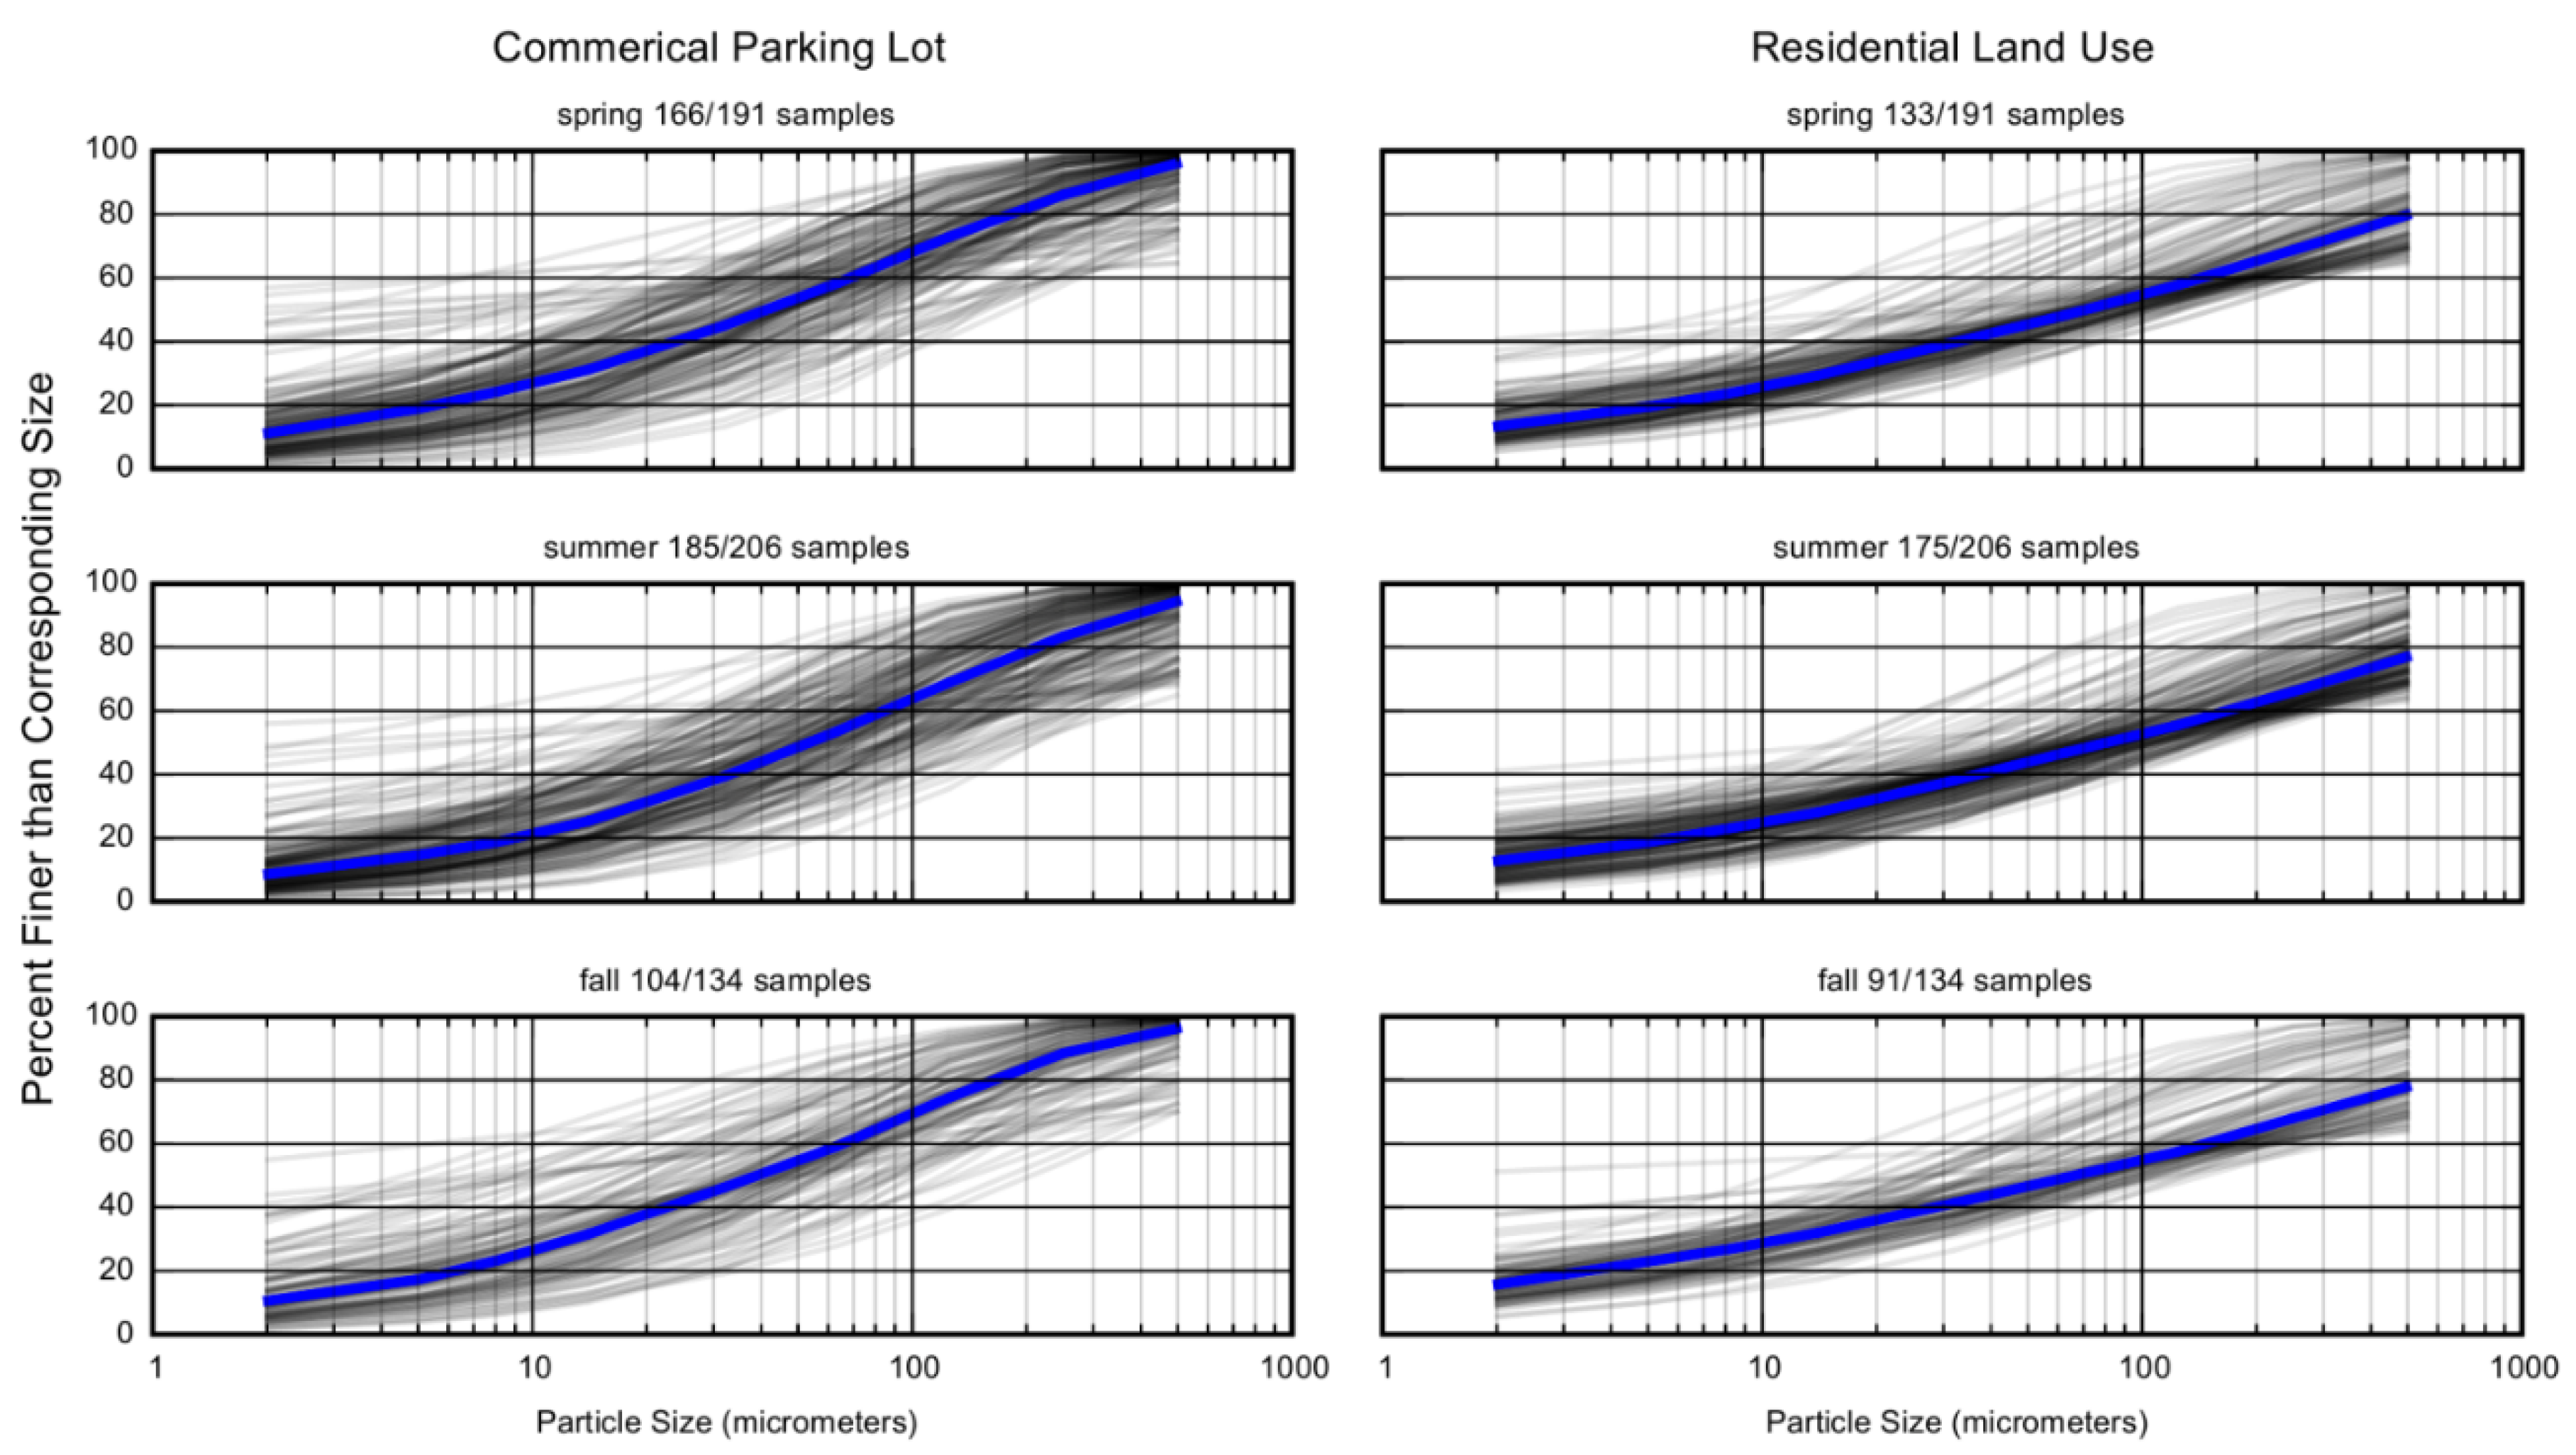
2.2.3. Predicted Seasonal Distributions Using Regression Techniques

The regression technique to predict distributions from site-specific surrogate parameters was performed as part of the work documented by Selbig and Fienen [19]. This technique is reprised here and extended to result in seasonal representative distributions based on long-term precipitation data measured from a nearby U.S. Geological Survey monitoring station (Pheasant Branch at Middleton, WI, USA, Station # 05427948) located 9.2 and 16.9 km from the residential and commercial parking lot study areas, respectively (Figure 1). Individual event data measured at the Pheasant Branch station are available in the supplementary online material. PSDs were predicted over a 13-year period from October 1999 to September 2012 using surrogate precipitation data from the Pheasant Branch site. This site was chosen because it had the longest continuous period of record within close proximity to the study sites. These predictions take advantage of the regression-based relations determined by Selbig and Fienen [19] for events where both measurements of environmental surrogate parameters and DISA PSD measurements were available. The 13-year period for predictions uses the regression relations to make predictions of PSD in the absence of direct PSD measurements.
To use regression on surrogate parameters to predict PSDs, first the PSDs were summarized by fitting a Rosin–Rammler (also known as Weibull) distribution [29,30]. This equation, expressing the cumulative distribution function of mass fraction less than a sieve size value (x) in micrometers (μm), has two free parameters—λ and k—which fully describe the PSD using the Weibull equation:
W (x,λ,k) = 1 − exp(−x⁄λ)k
where: λ is the shape parameter and k is the scale parameter.
Once each PSD was summarized by a value for λ and k, linear regression was performed to estimate regression coefficients (βλi and βki) to predict λ and k from the various surrogate parameters. The predictions are made using:
i = 1 m x i β λ i = λ
i = 1 m x i β k i = k
where m is the number of surrogate parameters, x i are the environmental surrogate parameters, and the values of λ and k are predicted for translation into PSDs using β λ i and β k i as estimated by Selbig and Fienen [19]. The regression to estimate the coefficients was performed as weighted least-squares using the parameter estimation model PEST [31], and the environmental surrogate parameters included: event duration (h), precipitation depth (in), 15-min precipitation intensity (in/h), 60-min precipitation intensity (in/h), erosivity index (unitless), preceding dry days (days), ln (event volume) (ft3), peak discharge (ft3/s) and sine(time) (h). An important finding of the Selbig and Fienen [19] work was that the coefficients for predicting PSDs from environmental surrogate parameters are site specific. This means that a set of coefficients estimated for one site cannot be used at another. The same is not true for the forcing functions. Provided that weather conditions are similar enough between the two sites evaluated in this work and the Pheasant Branch site, the surrogate data from Pheasant Branch can be used at both the commercial parking lot and residential basin study locations. This does not violate the site specificity highlighted in Selbig and Fienen [19]. Two exceptions to this transferability of surrogate data are the event volume and peak discharge. These parameters were estimated for the 531 precipitation events recorded at Pheasant Branch based on equations developed through linear regression with measured environmental parameters at the commercial parking lot and residential basin study sites.
Resulting predicted PSDs were parsed by season, where spring was defined as March–May, summer as June–August and fall as September–November, inclusive. Winter PSDs were excluded due to lack of data. Parsing by seasons was done to evaluate whether there are appreciable seasonal differences in PSDs. Figure 3 shows PSDs predicted for each season and the median of each over a range of 2–500 μm. The variability is shown by presenting each predicted PSD as a light gray line with the representative median PSD as a thick dark blue line. The variability of the predicted PSDs generally clusters around the median value and is of a similar range as the variability of measured PSDs in Figure 2. All but a few predicted PSDs have the same general shape as the measured PSD. Several predicted PSDs were rejected from the analysis due to unrealistic values (typically flat line distributions at probability values of 0, 60 or 100). These were encountered in cases where the event volume or peak discharge estimated at Pheasant Branch exceeded values that were used to estimate the regression coefficients by Selbig and Fienen [19]. The rejected predicted PSDs were removed prior to calculating the median (representative) PSDs.

2.3. Model Development

The Source Loading and Management Model for Windows (WinSLAMM) was used to demonstrate how the distribution of particles in stormwater can affect the required size (and cost) of an SCM used to meet pollutant reduction goals. WinSLAMM is an event-based urban stormwater quality model that calculates a mass balance for pollutants and runoff volumes from different source areas (e.g., roofs, streets, parking areas, landscaped areas, undeveloped areas) and land use categories [32]. A number of structural and non-structural SCMs are available for the user to add to the storm drainage network as a way to simulate water quality improvement at the end of the pipe. This allows for gaming scenarios to optimize the water quality benefits of SCM implementation in a defined urban catchment. WinSLAMM was configured to represent the commercial parking lot and a residential area. The sites were selected to represent runoff volume and sediment transport processes at the plot scale (source area) to a larger catchment scale (land use). Each model was calibrated to minimize differences in predicted and observed runoff volumes.
Figure 3. Predicted seasonal particle size distribution curves in the commercial parking lot and residential basin study areas using regression equations described in Selbig and Fienen [19] over 13 years of measured climate data. The text above each panel details the number of simulated distributions retained after regression analysis over the total number of storm events evaluated by season. The blue line represents the median value.
Water 08 00017 g003

2.3.1. Wet Pond Design

One major criterion in the design and function of a wet pond is the expected range of particle size influent to the pond. Oftentimes, a theoretical PSD is used without regard to actual conditions. The resulting performance will depend on how well the design PSD reflects actual conditions. A wet pond was simulated in each study area to simulate how changes in PSD can affect the surface area needed to meet state prescribed TSS reduction targets.
A detention pond water quality analysis program is already built into WinSLAMM and is recognized by the state of Wisconsin as an acceptable tool to evaluate the efficiency of wet pond design in reducing TSS [33]. WinSLAMM tracks changes in TSS load at discrete time intervals (usually every 6 min) over the duration of each storm event. The model first calculates the upflow velocity, defined as the pond outfall rate divided by the pond surface area [34]. For an ideal sedimentation pond, any particle that has a settling velocity greater than the upflow velocity will be retained in the pond. Only increasing the surface area or decreasing the pond outflow rate will increase pond settling efficiency. To use the detention pond or catch basin routine in WinSLAMM, the user must define the particle size distribution for the influent water. WinSLAMM uses the particle size distribution to calculate particle settling rates using Stoke or Newton settling equations depending on whether flow is laminar or turbulent, respectively. The model assumes all particles have a specific gravity of 2.5 g/cm3. Default water temperatures vary by month ranging from 1.7 °C in winter months to 18.3 °C in summer months and are used to calculate water density and kinematic viscosity. Because the model assumes a constant specific gravity, the resulting settling velocities may not necessarily reflect actual conditions. For this reason, WinSLAMM was used as a tool to evaluate changes in seasonal storm patterns and associated variation in PSD rather than differences in settling velocities. WinSLAMM calculates the critical particle size retained in each calculation interval during the runoff event and sums the mass of particles trapped for each event. All of the influent and effluent loads for the individual events are then summed to calculate the percent removal for the pond.
The particle size distribution in runoff influent to the pond was modified in each simulation to represent either the NURP, measured or seasonal curves. Adjustments to the pond surface area were made until an 80 percent reduction in annual TSS load at the outlet was achieved. The 80 percent reduction target was based on a state prescribed reduction in TSS load required for new development, based on the average annual rainfall, compared to no runoff management controls [1]. The simulation period was one year using precipitation characteristics representative of the average annual rainfall for Madison, Wisconsin [35].

2.3.2. Catch Basin Design

Catch basins are typically precast flow-through structures placed in line with storm drains to remove sediment entrained in runoff, primarily through settling; however, other forms of capture, such as screening or centrifuge, are also used. Similar to wet detention ponds, algorithms used to define the hydraulic properties of catch basins are built into WinSLAMM, and it is recognized by the state of Wisconsin as an acceptable tool to evaluate their efficiency in reducing TSS [36].
Two catch basins with a by-pass were added to the commercial parking lot storm drain network in WinSLAMM. Each catch basin received runoff from approximately 1.2 hectares of the parking lot, one-half of the total drainage area. The particle size distribution in runoff influent to each catch basin was modified to represent either the NURP, measured or seasonal curves. Using the state-prescribed reduction in TSS load required for existing developed urban areas, the diameter of simulated catch basins was incrementally increased from 1.2 to 3.0 m until a 40 percent reduction in TSS load, compared to no treatment, was achieved at the outfall [1]. The simulation period was one year using precipitation characteristics representative of the average annual rainfall for Madison, Wisconsin [35]. The particle settling process in a single catch basin is similar to a wet detention pond (see Section 2.2.1). Therefore, the calculations performed by WinSLAMM provide a reasonable way to predict the sediment removal efficiency of these small devices [37].

3. Results and Discussion

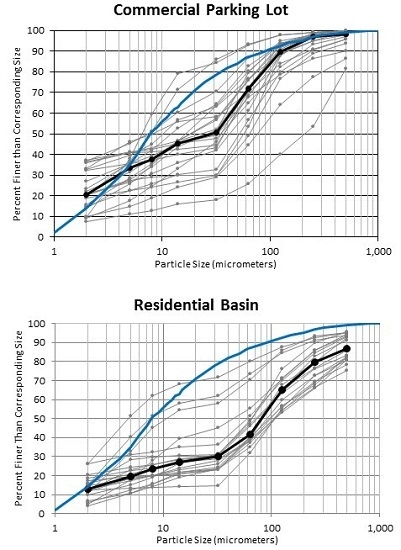
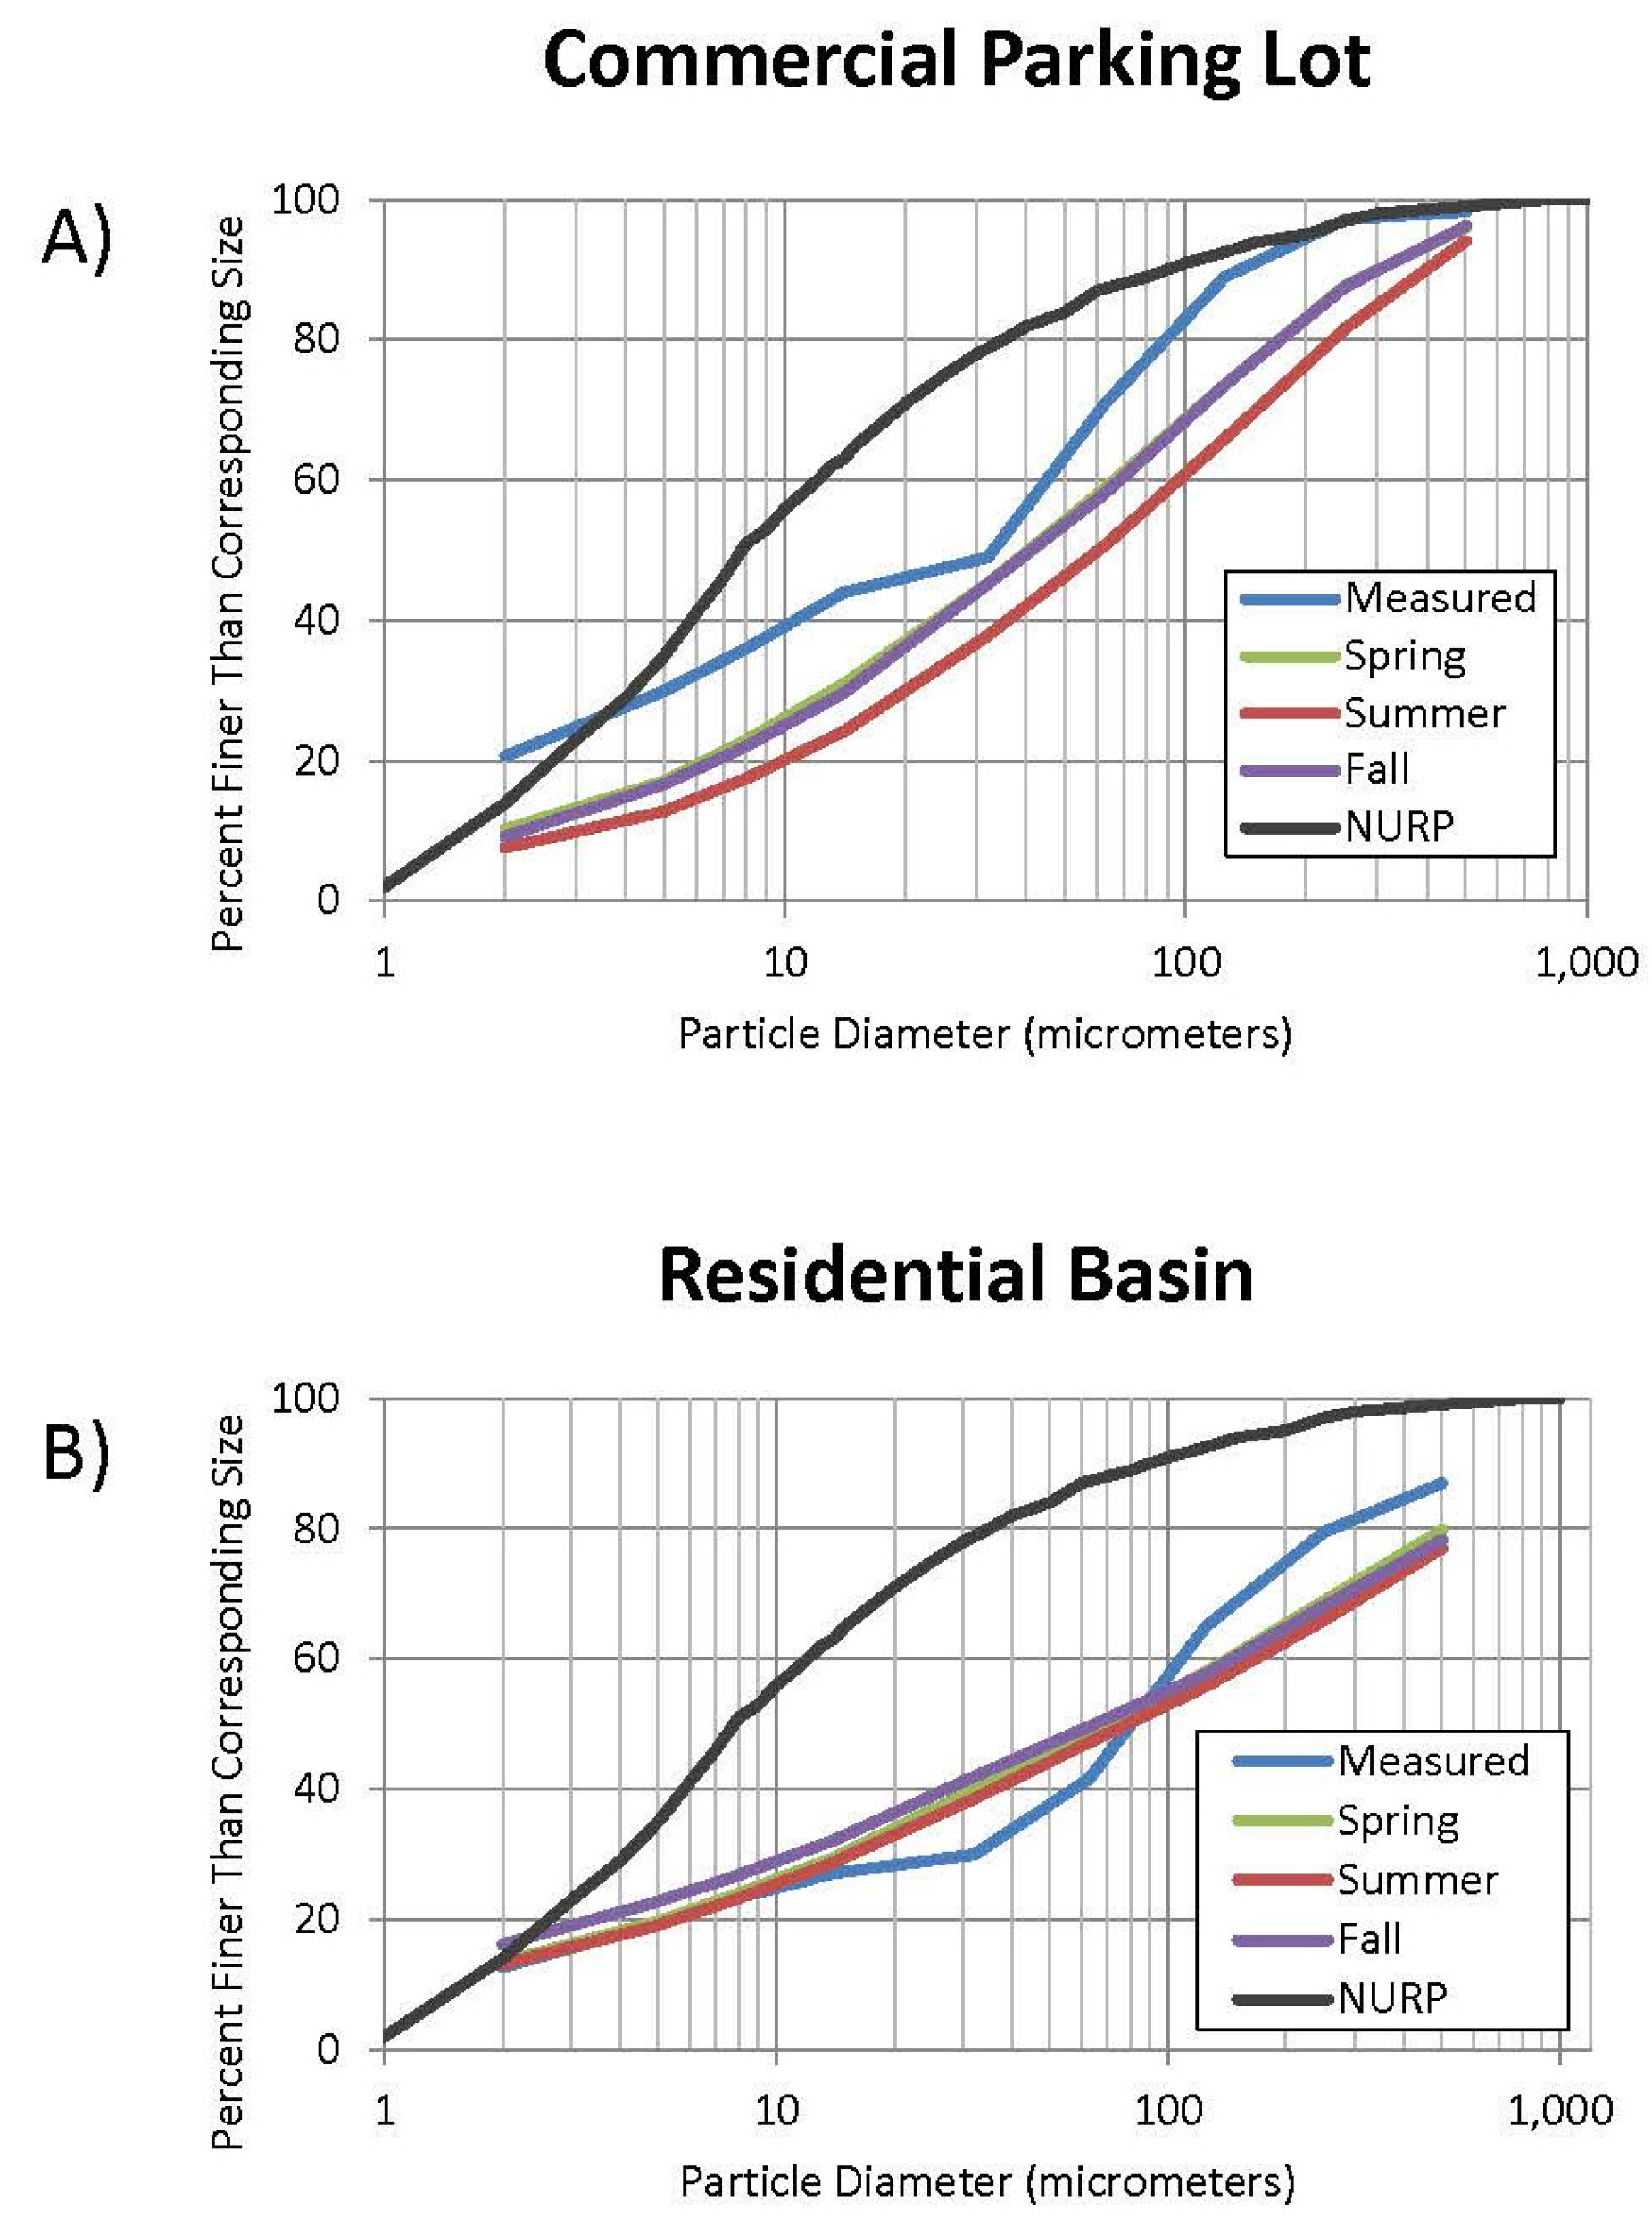
3.1. Differences in Particle Size Distribution

The gradation of particles in urban stormwater measured at both the commercial parking lot and residential basin exhibit a coarser distribution than NURP (Figure 4A,B). The convex pattern of the NURP distribution has a much smaller percentage of sand (>63 μm) compared to the concave shape of all measured and seasonal distributions. This pattern is especially apparent in the residential basin. This distinction remains until the curves intersect one another near the boundary between clay and silt, approximately 2 and 3 μm in the residential basin and commercial parking lot, respectively. The percentage of particles in the sand fraction is greatest in the residential basin ranging from 50 to 57 percent for the seasonal (averaged) and measured PSD curves, respectively. The commercial parking lot had slightly lower amounts of sand, with 43 and 28 percent in the seasonal (averaged) and measured curves, respectively. Both study sites were appreciably coarser than the NURP, having only 13 percent of sand-sized particles. The curves presented in Figure 4A,B can be used to estimate a range of particle diameters to consider when designing SCMs intended to attain an expected level of solids reduction (Table 2). For example, from Table 2, an SCM in a commercial parking lot must be sized to capture a 113-μm particle in order to achieve 20 percent TSS reduction.
Figure 4. Measured and seasonal median particle size distributions in the commercial parking lot (A) and residential basin (B) study areas compared to NURP.
Water 08 00017 g004
Table 2. Particle diameter associated with varying levels of solids reduction. All values, with the exception of percent control, are expressed in terms of micrometers. Values were calculated by linear interpolation from particle size distributions (PSDs) in Figure 4A,B (rounding was applied).
Percent ControlNURPCommercial Parking LotResidential Basin
MeasuredSpringSummerFallMeasuredSpringSummerFall
803271076564
6061123352553303325
401240659470100150170150
2035113171225171250500565545
1090138275367275615750780770
Statistical regression with climate variables showed little variation in resulting seasonal distributions. In general, curves representing spring and fall were nearly identical to one another at both study locations with only slight deviations at the residential basin. The “summer” distribution, though similar in shape, was only slightly coarser than spring and fall curves in the residential basin, but was more pronounced at the commercial parking lot (Figure 4A,B). Seasonal and measured distributions overlapped in the residential basin, but not in the commercial parking lot. This may be due, in part, to differences in precipitation patterns between the two study sites and Pheasant Branch. Because the seasonal PSDs were determined using climate variables at Pheasant Branch, any differences between measured and seasonal curves would be a reflection of spatial differences in precipitation patterns between sites. In this case, the commercial parking lot, at nearly twice the distance to Pheasant Branch than the residential basin, would be more likely to show signs of bias in predicted PSDs due to spatial differences in rainfall. An evaluation of correlation coefficients between the measured climate variables at all three sites confirmed that the residential basin was more similar to Pheasant Branch than the commercial parking lot. Despite this limitation, we can still gain insight as to whether there are significant differences in PSD by season. Both the seasonal and NURP curves are generally smoother than the measured curves, showing fewer abrupt changes between particle size fractions. This is likely due to differences in the sample size used to create each distribution. While the seasonal curves were produced using regression techniques from measured values, variability between each fraction was reduced by the large population of individual storm events over multiple years (Figure 3), whereas the measured curve represents events from only a single year (Figure 2A,B).

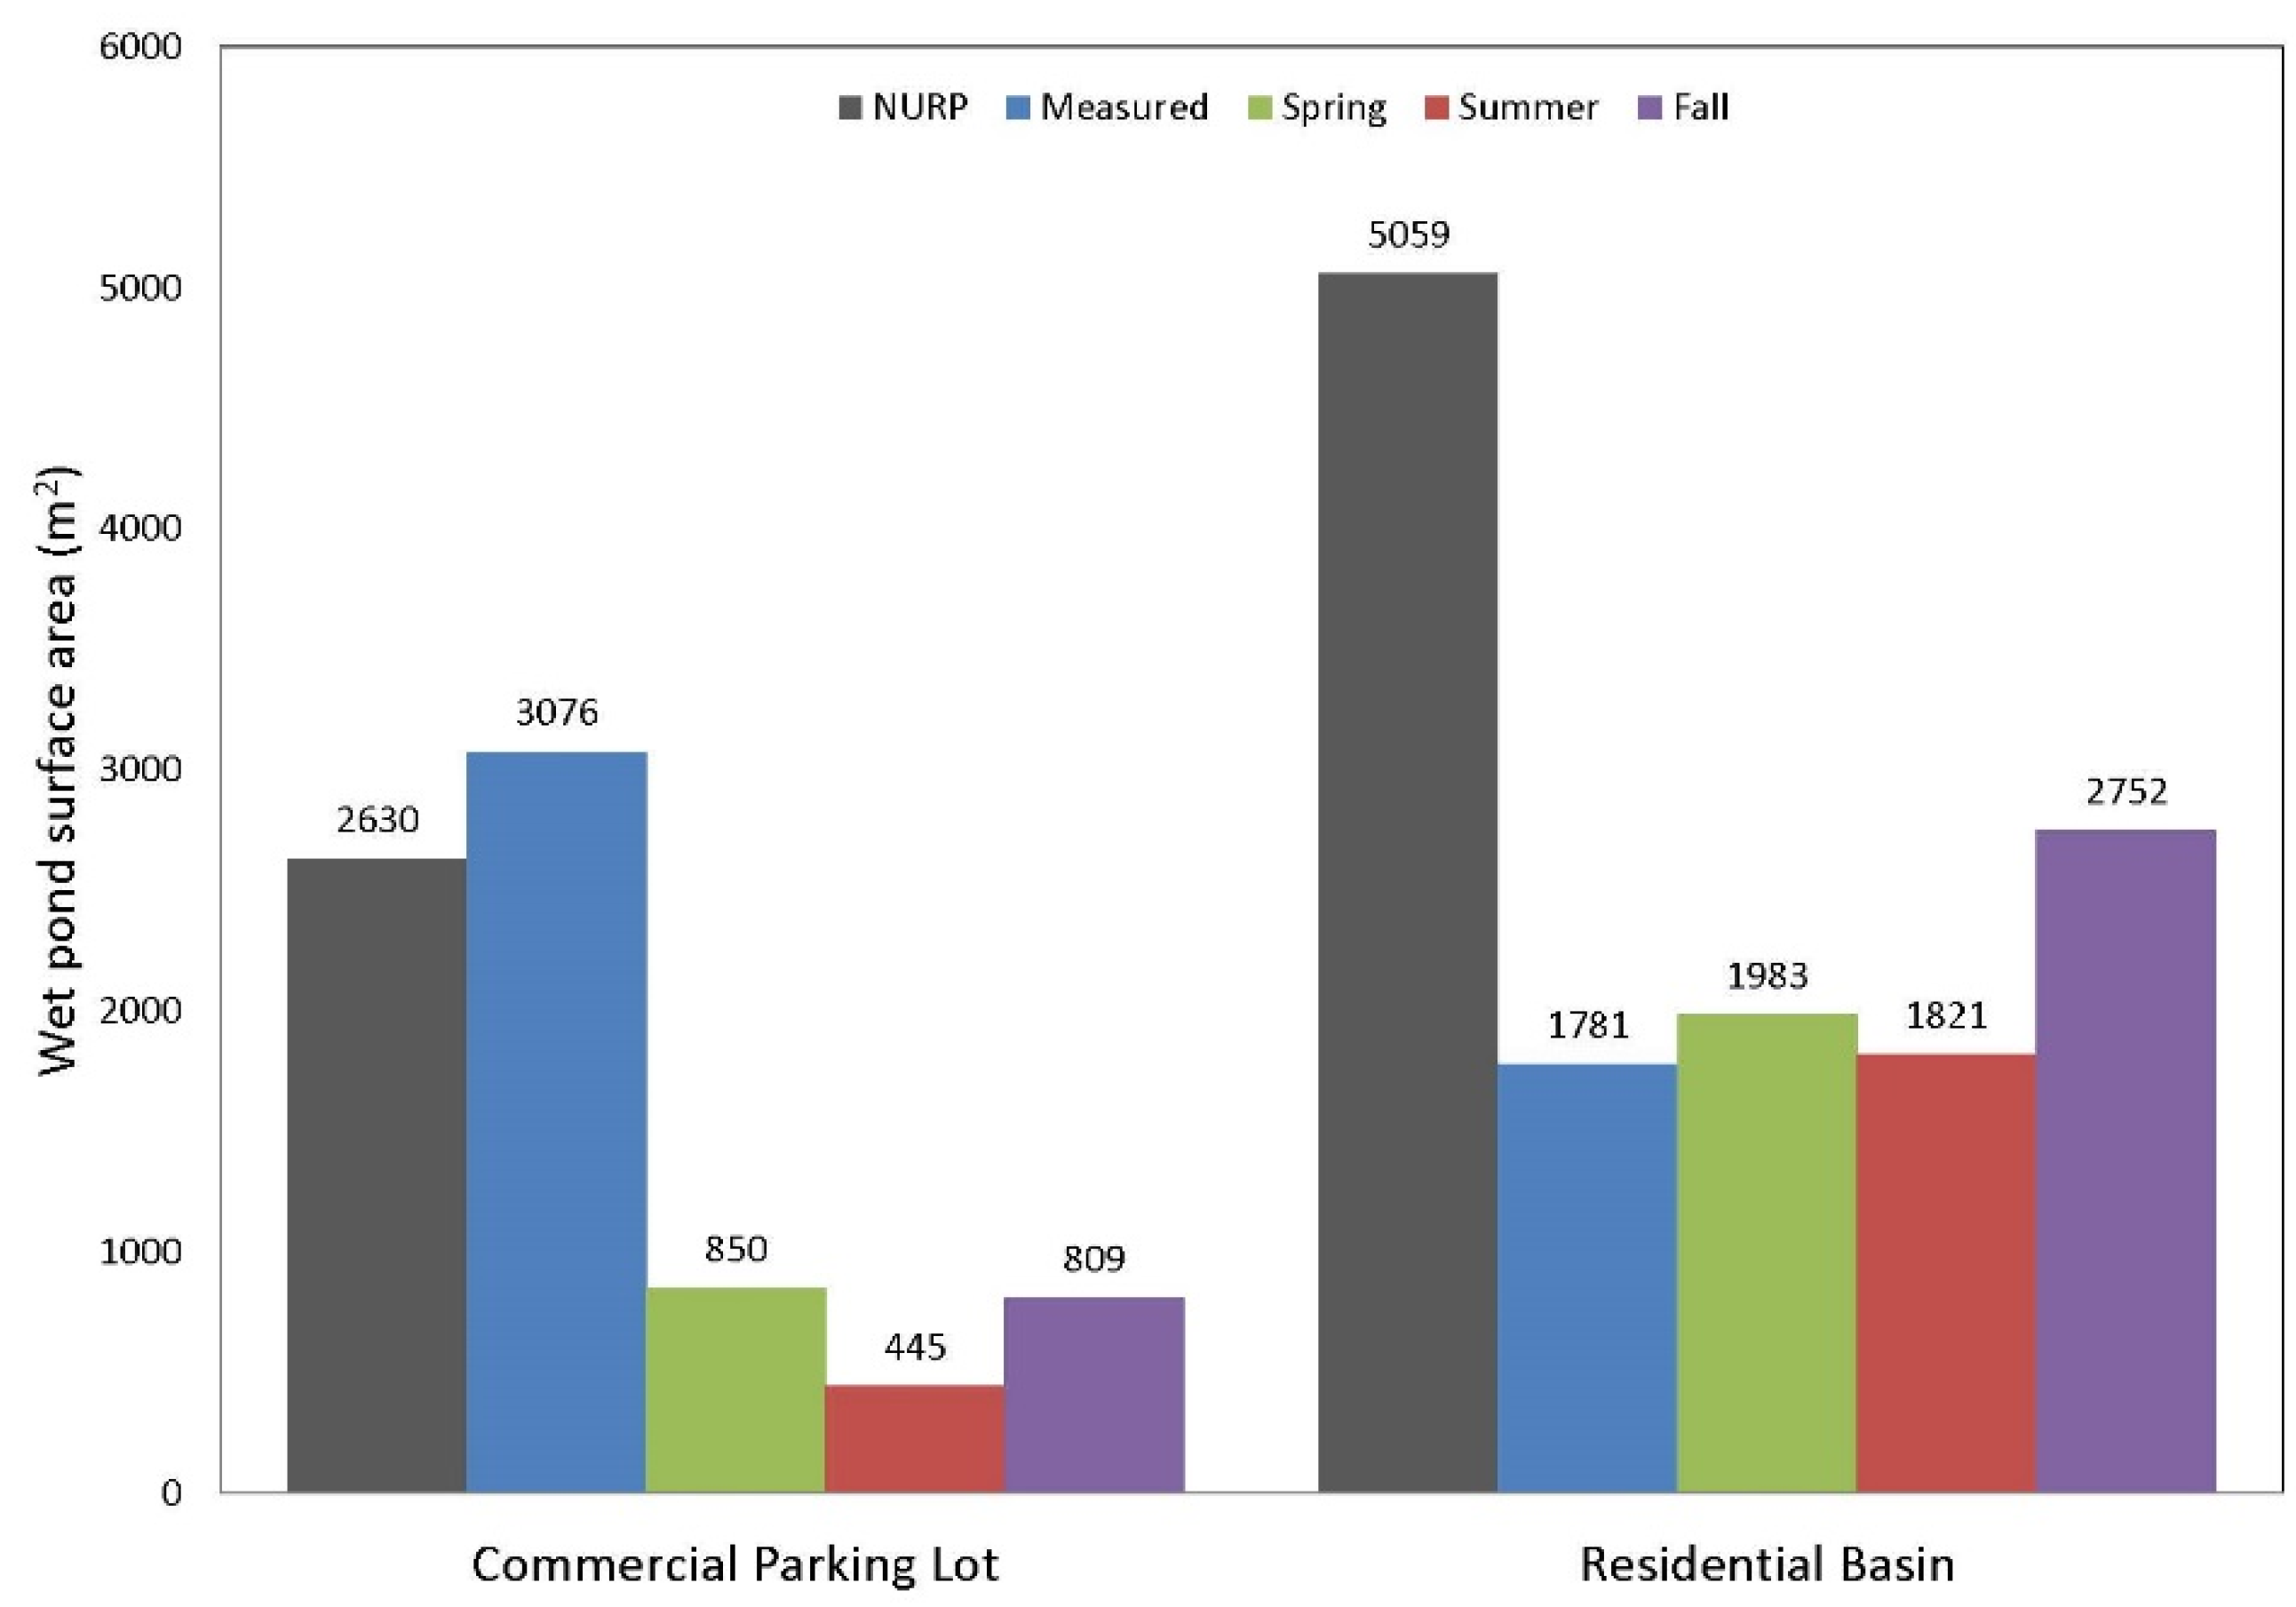
3.2. The Effect of Particle Size Distribution on Wet Pond Surface Area

Table 2 shows the range of minimum particle diameters that must be captured in order to achieve increasing percentages of solids reduction for SCMs that use settling as the primary form of treatment. For the wet pond simulations, a reduction target of 80 percent was used based on state prescribed standards for new construction. The range of particle diameters corresponding to this target ranged from 2 to 10 μm, depending on the selected PSD in the commercial parking lot, and 4–6 μm in the residential basin (Table 2). Adjustments to the wet pond surface area were made for each PSD simulation until the difference in annual effluent and influent TSS load equaled or exceeded 80 percent.
Small changes in the targeted particle diameter produced large differences in required wet pond surface area (Figure 5). Although the NURP particle diameter associated with 80 percent TSS control was only a few micrometers smaller than those for the seasonal distributions, the surface area of the wet pond increased by more than a factor of three in the commercial parking lot and more than double in the residential basin. The size of the pond needed to achieve 80 percent TSS control was accentuated by the amount of runoff influent to the pond, a function of drainage area. The residential basin, having a much larger drainage area and rate of discharge than the commercial parking lot, required a considerably larger wet pond to achieve the same TSS reduction as the commercial parking lot, even though the differences in particle diameter for similar PSDs was less than a few micrometers. The difference of a single micrometer between the fall seasonal and NURP PSDs in the residential basin resulted in an 84 percent increase in wet pond surface area. Only the measured PSD in the commercial parking lot had a particle diameter smaller than NURP for 80 percent control (Table 2).
Figure 5. Surface area of a wet pond design required removing 80 percent of the total suspended solids load using NURP, the median of the measured and seasonal PSDs in the commercial parking lot and residential basin study areas.
Water 08 00017 g005

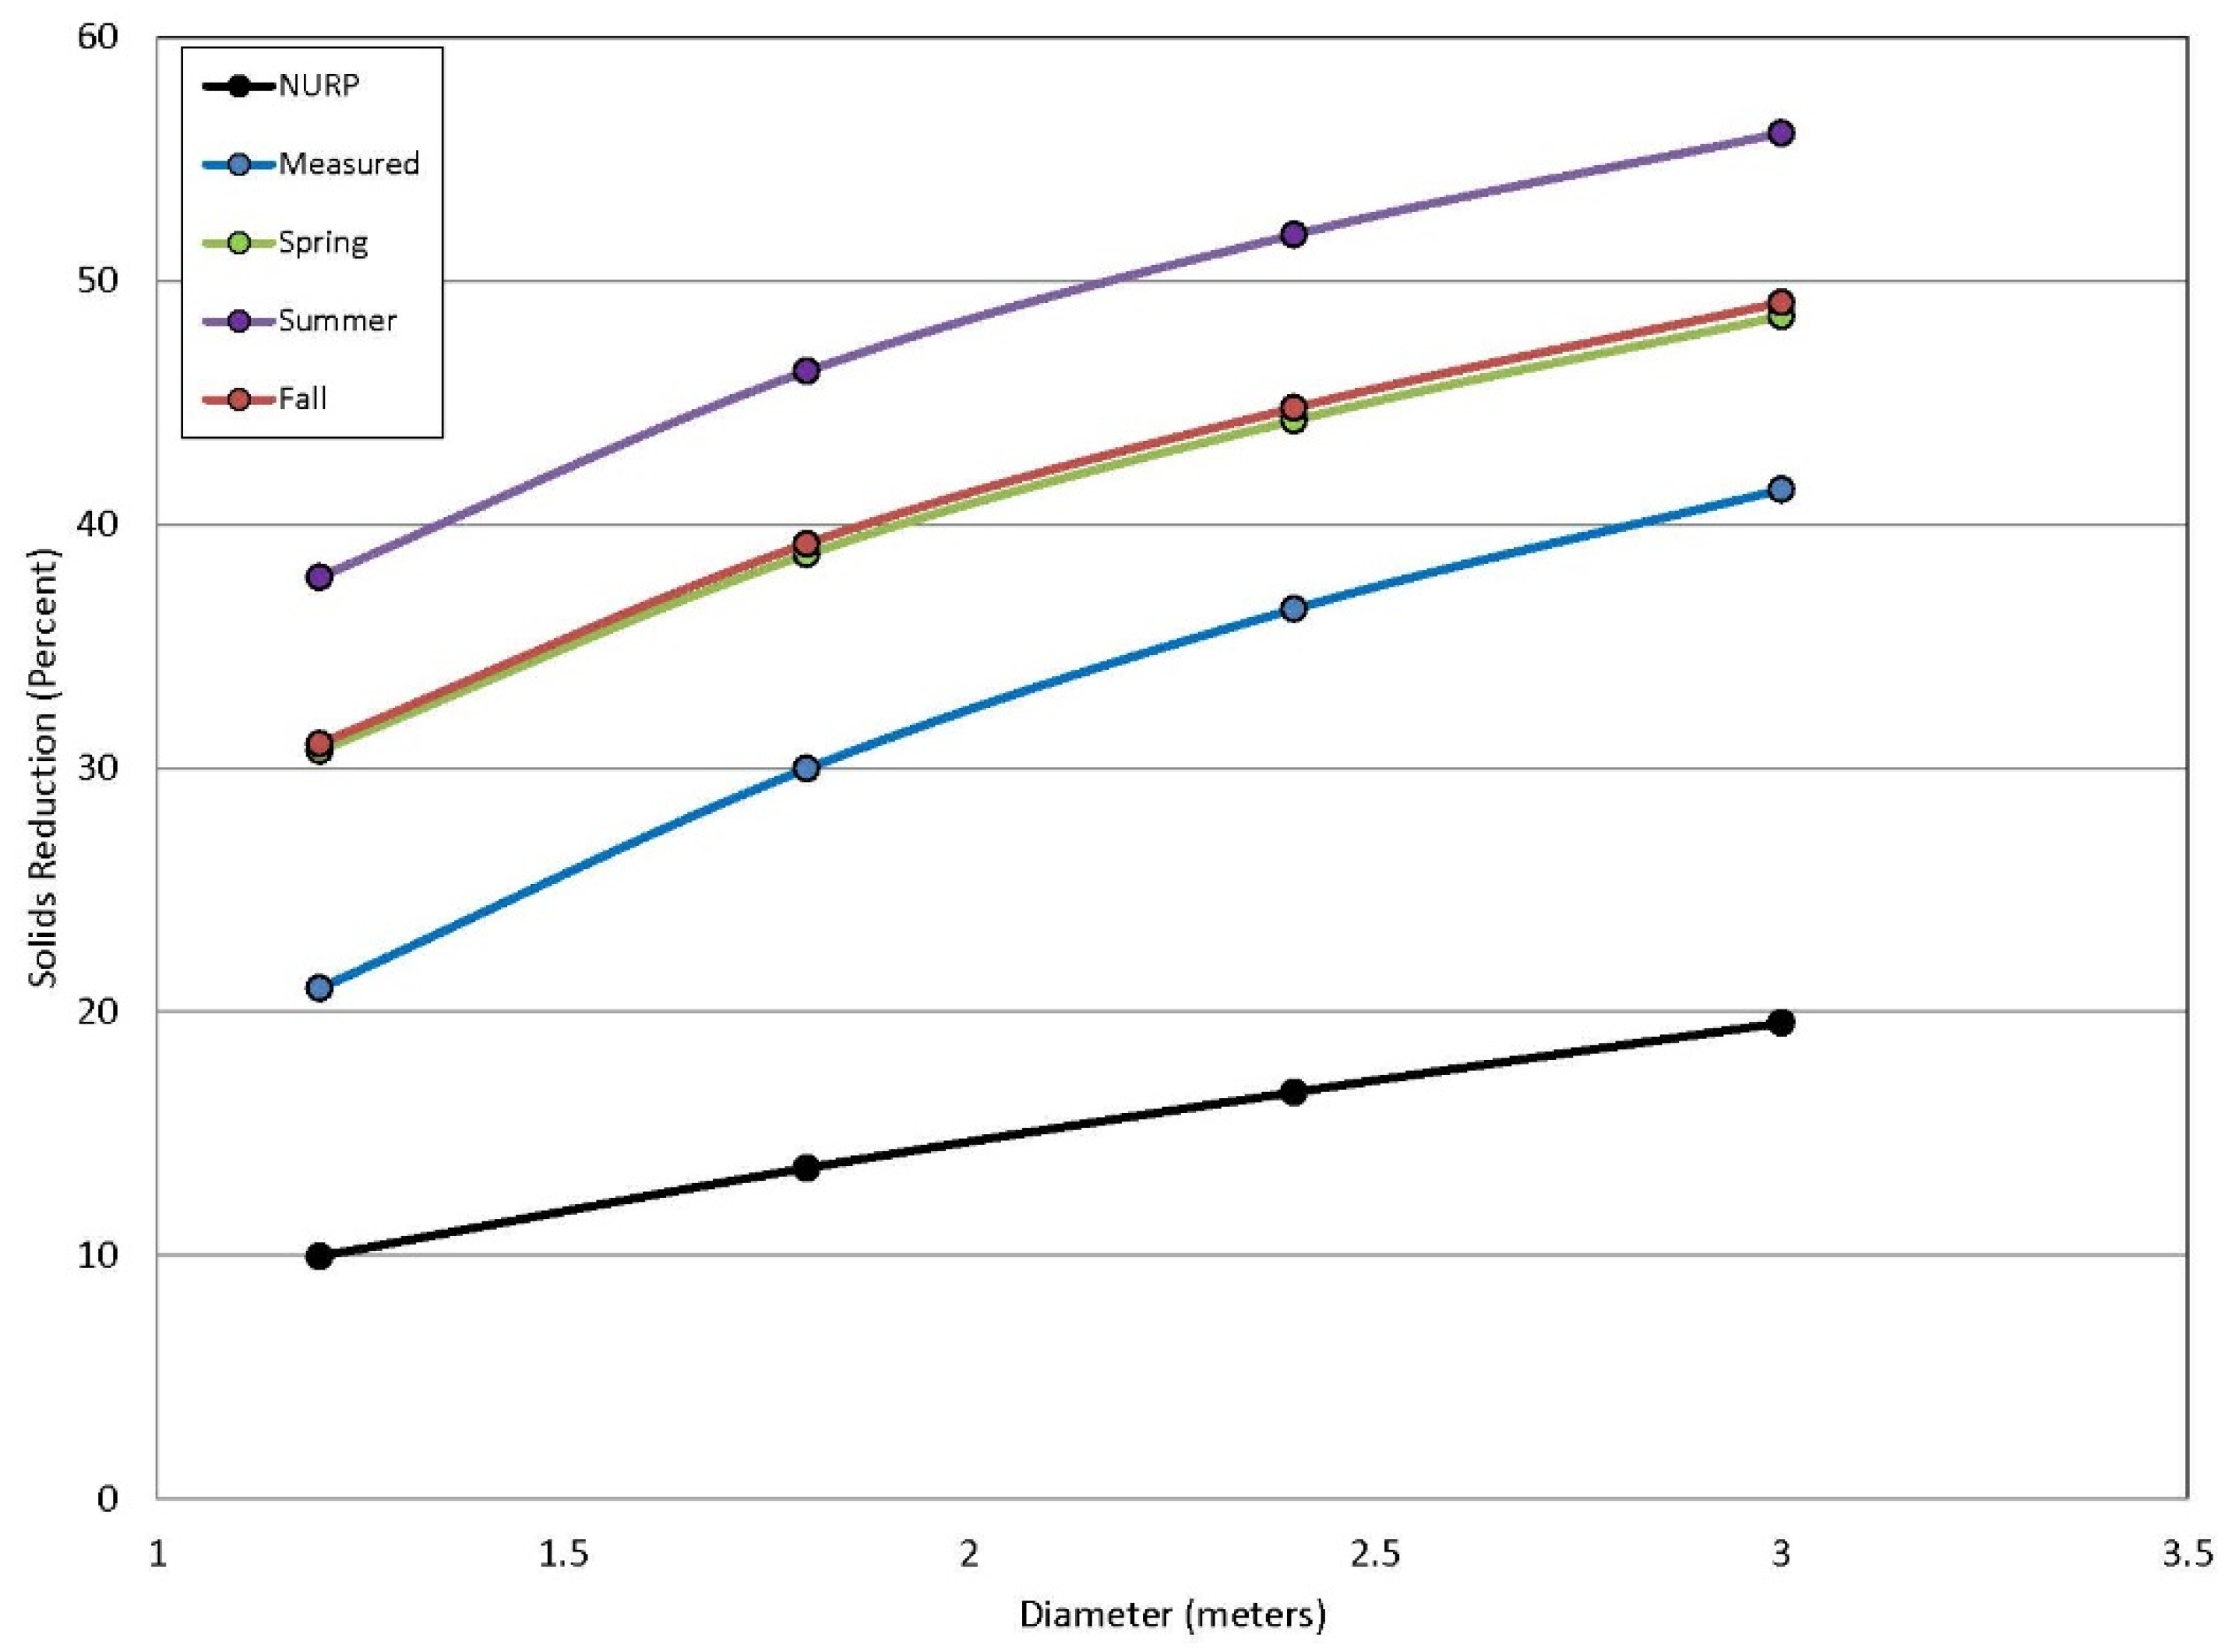
3.3. The Effect of Particle Size Distribution on Catch Basin Diameter

For catch basin simulations, a reduction target of 40 percent was used based on state-prescribed standards for existing developed areas [1]. From Table 2, particle diameters corresponding to this target ranged from 40 to 94 μm for the commercial parking lot, 100–170 μm for the residential basin and 12 μm for NURP. Figure 6 shows the positive correlation between an increasing catch basin diameter, and thus, surface area, and the percentage of solids removed. The “summer” PSD, having the coarsest distribution of particles, was nearly able to meet the 40 percent solids reduction target using the smallest diameter catch basin. As the gradation of particles became finer, the diameter of the catch basin increased. The spring and fall seasonal curves required a catch basin diameter of 2.4 m, while the measured PSD required 3.0 m. Despite the differences in the measured and seasonal curves, they were all able to meet the 40 percent solids reduction target using reasonable design criteria for catch basins. This level of control was unattainable using the NURP distribution until the number of catch basins serving the parking lot increased to 20 (not shown in Figure 6), an unlikely scenario.
Figure 6. Increasing percentage of solids removed with increasing diameter of two catch basins in the commercial parking lot.
Water 08 00017 g006

4. Discussion

Incorrect assumptions of PSDs in urban stormwater could have detrimental consequences when SCMs use settling as the primary unit process, since particle diameter is a contributing factor in the overall solids removal efficiency [7]. If a coarse distribution is assumed during the design process, the size or number of SCMs may be undersized, rendering it ineffective at providing proper treatment. Using a distribution with smaller grain sizes may ensure more protective measures, but could also result in excess cost. On site measurements of particle characteristics would provide the most accurate assessment of stormwater attributes.
Results from this study show that, based on measured data, PSDs representing individual source areas and land use categories may better represent site conditions than NURP. The range of particle sizes in Table 2 highlight the importance of selecting the most appropriate PSD when building SCMs designed to meet prescribed solids reduction requirements. Using the median value for PSDs measured at the residential basin showed the same level of TSS control can be achieved with a much smaller wet pond than if the NURP PSD were used. Similarly, fewer catch basins were needed to achieve solids reduction goals in the commercial parking lot when using measured values. The median PSD, while more site-specific than NURP, is still a statistical representation of a highly variable dataset, whereby the distribution of particles in stormwater runoff is static. The same can be said of seasonal distributions. Even though there is evidence of seasonal variation in some stormwater pollutant concentrations, as reported by Brezonik and Stadelmann [38], based on our modeling, it is difficult to make the same interpretation for PSD. Seasonal curves at both the residential basin and commercial parking lot showed only minor differences when simulated over a 13-year period.
Based on comparisons with data using modern sample collection methods, NURP may not adequately capture the site-specific nature of particle size fractions found in urban stormwater. Although the NURP distribution may not accurately describe actual site conditions, it does provide a conservative estimate when designing SCMs because of the relatively small particle sizes in the NURP PSD. The size and/or number of SCMs designed using the NURP distribution would provide a greater level of sediment control by capturing a greater percentage of fines. If, however, the actual PSD is coarser than NURP, the same level of treatment could be attained with fewer resources. A more cost-effective design of SCMs would make use of PSDs characterizing specific categories of land use or source areas. Adoption of these PSD categories would be more representative of actual site conditions than the NURP PSD, which could translate into considerable cost savings, since the same level of sediment control can be achieved with fewer or smaller SCMs. This option may suffice in the short term until a monitoring program can sufficiently describe PSD for a specific site.
A more accurate representation of PSD in the design of treatment devices would include the ability to capture variability specific to individual runoff events. To illustrate this point, model simulations for the wet detention ponds were repeated using measured data from the 20 and 19 runoff events at the commercial parking lot and residential basin, respectively. The distribution of particles for each storm event was represented by NURP, the median of the measured and individually-measured PSDs specific to each event. Figure 7A illustrates the cumulative mass of sediment retained in a wet pond for each PSD over the 19 runoff events in the residential basin. While little difference was observed between the median and individual PSDs, they both resulted in approximately 360 kg more sediment retained in the wet pond than NURP. The differences can be attributed to the relatively narrow range of PSD shown in Figure 2A. Since NURP and median PSDs do not change for each runoff event, the percentage of sediment retained in the wet pond predictably decreases as the calculated critical particle size increases. The individual PSDs, however, do not follow the same predictable behavior, since they are dynamically related to external variables for each runoff event. In this case, given the relatively low degree of variability in measured PSDs (Figure 2B), slight deviations from the median value did not translate into appreciable gains in removed sediment mass.
A larger degree of variability in PSDs measured in the commercial parking lot (Figure 2A) had a more appreciable effect on the mass of accumulated sediment in the catch basins. Figure 7B illustrates the cumulative mass of sediment retained in two catch basins for each PSD over the 20 runoff events in the commercial parking lot study site. Using NURP, the catch basins were predicted to remove 180 kg of sediment. This value more than doubled to 400 kg when applying the median curve and increased to over 450 kg after incorporating the inter-event variability represented by individual PSDs. Much of the difference can be linked to only a few events of high precipitation intensity. For example, Event Number 10 had a calculated critical particle size of 64 μm. For this event, 14, 34 and 53 percent of the particles were greater than 64 μm based on the NURP, median and individual PSDs, respectively. Since the PSD measured for this event has a greater percentage of particles larger than the calculated critical particle size, more sediment was captured. The resolution of event-based performance becomes muted without knowledge of the relationship between runoff event characteristics and PSD.
Figure 7. Accumulated sediment mass retained in a wet pond in the residential basin (A) and two catch basins in the commercial parking lot study area (B) using the individually-measured, the median of the measured and NURP PSDs.
Water 08 00017 g007
The measurement of PSD for every runoff event is an unrealistic endeavor; therefore, environmental managers and engineers often rely on models to simulate the long-term sediment removal performance of SCMs. The results presented in Figure 7B support the importance of developing a model than can predict the dynamic behavior of PSD by means of regression with climate parameters. Given the link between precipitation characteristics and PSD identified by Selbig and Fienen [19], a catch basin (or any SCM that used settling as the primary form of treatment) designed using a single PSD representative of all runoff events, such as the median of measured data or NURP, could potentially over- or under-estimate the overall efficiency of the SCM. Horwatich and Bannerman [39] made a similar conclusion when evaluating the sediment removal efficiency of a proprietary hydrodynamic SCM. Of the 23 runoff events measured during their study, 70 percent of the sediment load inlet to the SCM came from two events. Analysis of PSD for those two events showed the majority of particles to be larger than 500 μm. Comparison of inlet and outlet loads by particle size showed essentially no reduction for particles less than 125 μm and about a 90 percent reduction for particles greater than 250 μm [39]. This was supported by noting that more than 80 percent of the particles trapped in the sump were also greater than 250 μm. Ferreira and Stenstrom [12] similarly found that a hydrodynamic SCM was nearly 100 percent efficient at removing particles greater than 200 μm, but only 20 percent for particles smaller than 150 μm. Without knowledge of the site-specific nature of PSD, the predicted removal efficiency for these SCMs would have had very different outcomes if the design were based on an average or median PSD. The WinSLAMM model, in its current version (v.10), allows the user to describe singular PSDs for source areas and land use categories; however, the ability to predict PSDs that fluctuate on an event-by-event basis through regression with climate parameters is not yet available.
Particle size is only one characteristic that determines how well an SCM captures sediment. The real range of particles removed in a wet pond, catch basin or other SCM that uses settling would be a function of size, shape and density. WinSLAMM assumes the basic principles of sedimentation and, therefore, treats particles as being spherical with a specific density of 2.5 g/cm3. Particles in stormwater are dependent on the material carried in runoff, which can be a mixture of both organic and inorganic fractions ranging from 1.5 to 2.65 g/cm3 [4,12,40]. More organic material suspended in stormwater will lower the overall particle density, while more mineral content will increase the density. Prior knowledge of the densities associated with particles in each fraction would optimize the settling efficiencies of SCMs; however, this parameter is rarely measured as part of a monitoring program and often oversimplified by assuming a static value. As such, the actual removal of particles in the wet pond and catch basins would likely be lower than predicted by WinSLAMM. Future research should validate WinSLAMM simulations using a dataset that includes specific density.
While creating a single PSD representative of major source areas and land use categories may reduce some variability between sites, it still does not adequately capture the variability within a site from individual runoff events. The ability to predict PSD using regression techniques is promising, but currently suffers from its site-specific and non-transferable nature. It does however highlight the important relationship between source material and precipitation variables. Development of this process will ultimately replace the adoption of a single PSD that is uniformly applied to all urban environments.

5. Conclusions

The particle size distribution can have a significant impact on the sediment removal performance of SCMs that use settling as the primary form of treatment. The design of SCMs without prior knowledge of the size and density of particles in runoff specific to site conditions could be under- or over-sized. The generalized PSD characterized by NURP was much finer than the median PSD measured at a residential basin and commercial parking lot. As a result, adoption of the NURP PSD in the design of a simulated wet detention pond resulted in a surface area that was twice as large as was necessary to achieve an 80 percent reduction in TSS. Similarly, using the median value of measured PSD data, two catch basins with a diameter of 3 m were able to achieve a 40 percent reduction in TSS from a commercial parking lot compared to 20 catch basins of a similar size needed when using the NURP PSD. A more detailed analysis of individual PSDs measured at each study site showed the potential for only a few storms with a coarse distribution to produce the largest gains in sediment removal.
These results demonstrate that use of a single PSD representative of all hydraulic conditions may result in under treatment or over design. A more cost-effective design of SCMs should include PSDs that represent land use and source area categories that are more specific to the contributing drainage area the SCM will serve. This upfront investment could have long-term savings through reduced size or number of SCMs needed to meet water quality objectives. These results also demonstrate the importance of developing a model that can predict PSDs from storm to storm or season to season. In this paper, regression of PSDs with climate parameters was used to evaluate potential differences in the long-term effectiveness of treatment designs. These methods can be used by decision-makers, regulators and engineers to evaluate the potential cost and benefits of SCMs with more accurate information than a single PSD can provide.

Supplementary Files

Supplementary File 1

Acknowledgments

The authors would like to thank Greg Granato and David Rus of the U.S. Geological Survey for their helpful comments. The Wisconsin Department of Natural Resources provided financial support necessary to complete this paper. Any use of trade, firm or product names is for descriptive purposes only and does not imply endorsement by the U.S. Government.

Author Contributions

This study is part of an ongoing effort to characterize particle size distribution in urban stormwater runoff. Roger Bannerman conceived of the idea to improve model simulations of SCMs using measured data. William Selbig undertook the experimental design to measure particle size distributions in urban stormwater and analyzed the resulting data. Michael Fienen performed the statistical analyses for seasonal distributions. Judy Horwatich performed all model simulations. The paper was written by William Selbig with statistical interpretation provided by Michael Fienen.

Conflicts of Interest

The authors declare no conflict of interest.

References

  1. Wisconsin State Legislature. NR 151: Runoff Management. In Wisconsin Administrative Code and Register 35.93; Wisconsin State Legislature: Madison, WI, USA, 2013; pp. 399–408. [Google Scholar]
  2. U.S. Environmental Protection Agency. Total Maximum Daily Load Program. Available online: http://water.epa.gov/lawsregs/lawsguidance/cwa/tmdl (accessed on 1 July 2015).
  3. Greb, S.R.; Bannerman, R.T. Influence of particle size on wet pond effectiveness. Water Environ. Res. 1997, 69, 1134–1138. [Google Scholar] [CrossRef]
  4. Minton, G. Stormwater Treatment: Biological, Chemical, and Engineering Principles, 3rd ed.; Sheridan Books: Schaumburg, IL, USA, 2011; p. 416. [Google Scholar]
  5. Selbig, W.R.; Bannerman, R.T. Characterizing the Distribution of Particles in Urban Stormwater Using Fixed-point Sample Collection Methods; Open-File Report 2011-1052; U.S. Geological Survey: Reston, VA, USA, 2011; p. 14.
  6. Selbig, W.R. Characterizing the distribution of particles in urban stormwater: Advancements through improved technology. Urban Water J. 2013, 12, 111–119. [Google Scholar] [CrossRef]
  7. U.S. Environmental Protection Agency. Results of the Nationwide Urban Runoff Program: Volume 1—Final Report. Available online: http://www.epa.gov/npdes/pubs/sw_nurp_vol_1_finalreport.pdf (accessed on 29 June 2015).
  8. Lin, H. How well do we know “particle size” in urban runoff pollution control? In Proceedings of the World Environmental and Water Resources Congress, Honolulu, HI, USA, 12–16 May 2008.
  9. Li, Y.; Lau, S.-L.; Kayhanian, M.; Stenstrom, M. Particle size distribution in highway runoff. J. Environ. Eng. 2005, 131, 1267–1276. [Google Scholar] [CrossRef]
  10. Piro, P.; Carbone, M.; Garofalo, G.; Sansalone, J. Size distribution of wet weather and dry weather particulate matter entrained in combined flows from an urbanizing sewershed. Water Air Soil Pollut. 2010, 206, 83–94. [Google Scholar] [CrossRef]
  11. Garofalo, G.; Carbone, M.; Piro, P. Sampling, testing and modeling particle size distribution in urban catch basins. Water Sci. Technol. 2014, 70, 1873–1879. [Google Scholar] [CrossRef] [PubMed]
  12. Ferriera, M.; Stenstrom, M.K. The importance of particle size characterization in stormwater runoff. Water Environ. Res. 2013, 85, 833–842. [Google Scholar] [CrossRef]
  13. Sansalone, J.J.; Kim, J-Y. Transport of particulate matter fractions in urban source area pavement surface runoff. J. Environ. Qual. 2008, 37, 1883–1893. [Google Scholar] [CrossRef] [PubMed]
  14. Clark, S.E.; Siu, C.Y.S. Measuring solids concentration in stormwater runoff: Comparison of analytical methods. Environ. Sci. Technol. 2008, 42, 511–516. [Google Scholar] [CrossRef] [PubMed]
  15. International Stormwater BMP Database. Available online: http://www.bmpdatabase.org/Docs/FAQ%20Background%20v1.pdf (accessed on 11 January 2013).
  16. Selbig, W.R.; Bannerman, R.T. Evaluation of Street Sweeping as a Stormwater-quality Management Tool in Three Residential Basins in Madison, Wisconsin; Scientific Investigations Report 2007-5156; U.S. Geological Survey: Reston, VA, USA, 2007; p. 103.
  17. Horowitz, A.J. The Use of Suspended Sediment and Associated Trace Elements in Water Quality Studies; International Association of Hydrological Sciences Press: Wallingford, UK, 1995; pp. 1–58. [Google Scholar]
  18. Burton, A.G.; Pitt, R. Stormwater Effects Handbook: A Toolbox for Watershed Managers, Scientists, and Engineers, 1st ed.; CRC Press: Boca Raton, FL, USA, 2002; pp. 451–453. [Google Scholar]
  19. Selbig, W.R.; Fienen, M.N. Regression modeling of particle size distributions in urban stormwater: Advancements through improved sample collection methods. J. Environ. Eng. 2012, 138, 1186–1193. [Google Scholar] [CrossRef]
  20. Driscoll, E.D. Detention and retention controls for urban stormwater. In Urban Runoff Quality—Impact and Quality Enhancement Technology, Proceedings of the Engineering Foundation Conference, Heinniker, NH, USA, 23–27 June 1986; Urbonas, B., Roesner, L.A., Eds.; American Society of Civil Engineers: New York, NY, USA, 1986; pp. 145–163. [Google Scholar]
  21. Selbig, W.R. Concentrations of Polycyclic Aromatic Hydrocarbons (PAHs) in Urban Stormwater, Madison, Wisconsin 2005-08; Open-File Report 2009-1077; U.S. Geological Survey: Reston, VA, USA, 2009; p. 45.
  22. U.S. Environmental Protection Agency. Methodology for Analysis of Detention Basins for Control of Urban Runoff Quality; EPA A440/5-87-001; U.S. Environmental Protection Agency: Washington, DC, USA, 1985; p. 72.
  23. Pitt, R.; University of Alabama-Birmingham, Birmingham, AL, USA. Personal communication, 2015.
  24. Selbig, W.R.; Bannerman, R.T. Development of a Depth-Integrated Sample Arm (DISA) to reduce solids stratification bias in stormwater sampling. Water Environ. Res. 2011, 83, 347–357. [Google Scholar] [CrossRef] [PubMed]
  25. Smith, K.P. Effectiveness of Three Best Management Practices for Highway-Runoff Quality along the Southeast Expressway, Boston, Massachusetts; Water-Resources Investigations Report 02-4059; U.S. Geological Survey: Reston, VA, USA, 2002; p. 62.
  26. Fowler, G.D.; Roseen, R.M.; Ballestero, T.P.; Guo, Q.; Houle, J. Sediment monitoring bias by autosampler in comparison with whole volume sampling for parking lot runoff. In Great Rivers, Proceedings of the World Environmental and Water Resources Congress, Kansas City, MO, USA, 17–21 May 2009; p. 9.
  27. Selbig, W.R.; Cox, A.; Bannerman, R.T. Verification of a depth-integrated sample arm as a means to reduce solids stratification bias in urban stormwater sampling. J. Environ. Monit. 2012, 14, 1137–1143. [Google Scholar] [CrossRef] [PubMed]
  28. Helsel, D.R.; Hirsch, R.M. Statistical methods in water resources. In Techniques in Water Resources Investigations; U.S. Geological Survey: Reston, VA, USA, 2002. [Google Scholar]
  29. Rosin, P.; Rammler, E. The laws governing the fineness of powdered coal. J. Inst. Fuel 1933, 7, 29–36. [Google Scholar]
  30. Weibull, W. A statistical theory of the strength of materials. In Ingeniörs Vetenskaps Akademiens; Swedish Institute of Engineering Research: Stockholm, Sweden, 1939; p. 151. (In German) [Google Scholar]
  31. Doherty, J. PEST, Model-independent Parameter Estimation—User Manual, 5th ed.; Watermark Numerical Computing: Brisbane, Australia, 2010. [Google Scholar]
  32. Pitt, R.; Vorhees, J. SLAMM, the Source Loading and Management Model. In Wet-weather Flow in the Urban Watershed; Field, R., Sullivan, D., Eds.; CRC Press: Boca Raton, USA, 2002; pp. 103–139. [Google Scholar]
  33. Wisconsin Department of Natural Resources. Conservation Practice 1001: Wet Detention Ponds. Available online: http://dnr.wi.gov/topic/stormwater/documents/WetPondStd1001.pdf (accessed on 23 July 2015).
  34. Pitt, R. The Design, Use, and Evaluation of Wet Detention Ponds for Stormwater Quality Management: Using WinDETPOND. 2003. Available online: http://unix.eng.ua.edu/~rpitt/Publications/StormwaterTreatability/Detention ponds with WinDETPOND.pdf (accessed on 31 August 2015).
  35. U.S. Geological Survey. Description of Wisconsin WinSLAMM Parameter Files. Available online: http://wi.water.usgs.gov/slamm/slamm_parameter_descriptions.htm#ran (accessed on 24 July 2015).
  36. Wisconsin Department of Natural Resources. Conservation Practice 1006: Method for Predicting the Efficiency of Proprietary Storm Water Sedimentation Devices. Available online: http://dnr.wi.gov/topic/stormwater/documents/prop_devices_standard_v2_040909.pdf (accessed on 1 September 2015).
  37. Bannerman, R. Verification of a method for sizing all proprietary single chamber treatment devices with settling as a unit process. In Proceedings of the StormCon05, Orlando, FL, USA, 18–21 July 2005.
  38. Brezonik, P.L.; Stadelmann, T.H. Analysis and predictive models of stormwater runoff volumes, loads, and pollutant concentrations from watershed in the Twin Cities metropolitan area, Minnesota, USA. Water Res. 2002, 36, 1743–1757. [Google Scholar] [CrossRef]
  39. Horwatich, J.A.; Bannerman, R.T. Parking Lot Runoff Quality and Treatment Efficiencies of a Hydrodynamic-settling Device in Madison, Wisconsin, 2005-6; Scientific Investigations Report 2011-5145; U.S. Geological Survey: Reston, VA, USA, 2012; pp. 1–35.
  40. Granato, G.E. Stochastic empirical loading and dilution model (SELDM) version 1.0.0. In Techniques and Methods 4-C3 [CD–ROM]; U.S. Geological Survey: Reston, VA, USA, 2013; p. 112. [Google Scholar]

