3.1. Present Water Quality
Nutrient loads delivered by the Szamos River were relatively low in a European comparison [
17], thanks to the low population density (88 inhabitants km
−2) and dominantly extensive agriculture. Yet, the loads delivered by the Upper Tisza River were even lower by 25%–30%, although the catchments of the two rivers are neighbouring and have similar landuse patterns. Therefore the medium-term (10–15 years) management objective should be a 25%–30% reduction in nutrient loads delivered by the Szamos River to the Tisza River. Easily controllable point sources were responsible for 60% of N and 80% of P loads in the Szamos catchment. This high share of point emissions was due to inefficient management of municipal wastewater and to the high number of industrialized animal farms (poultry, pig) that were usually deployed close larger rivers without proper effluent treatment.
Figure 2.
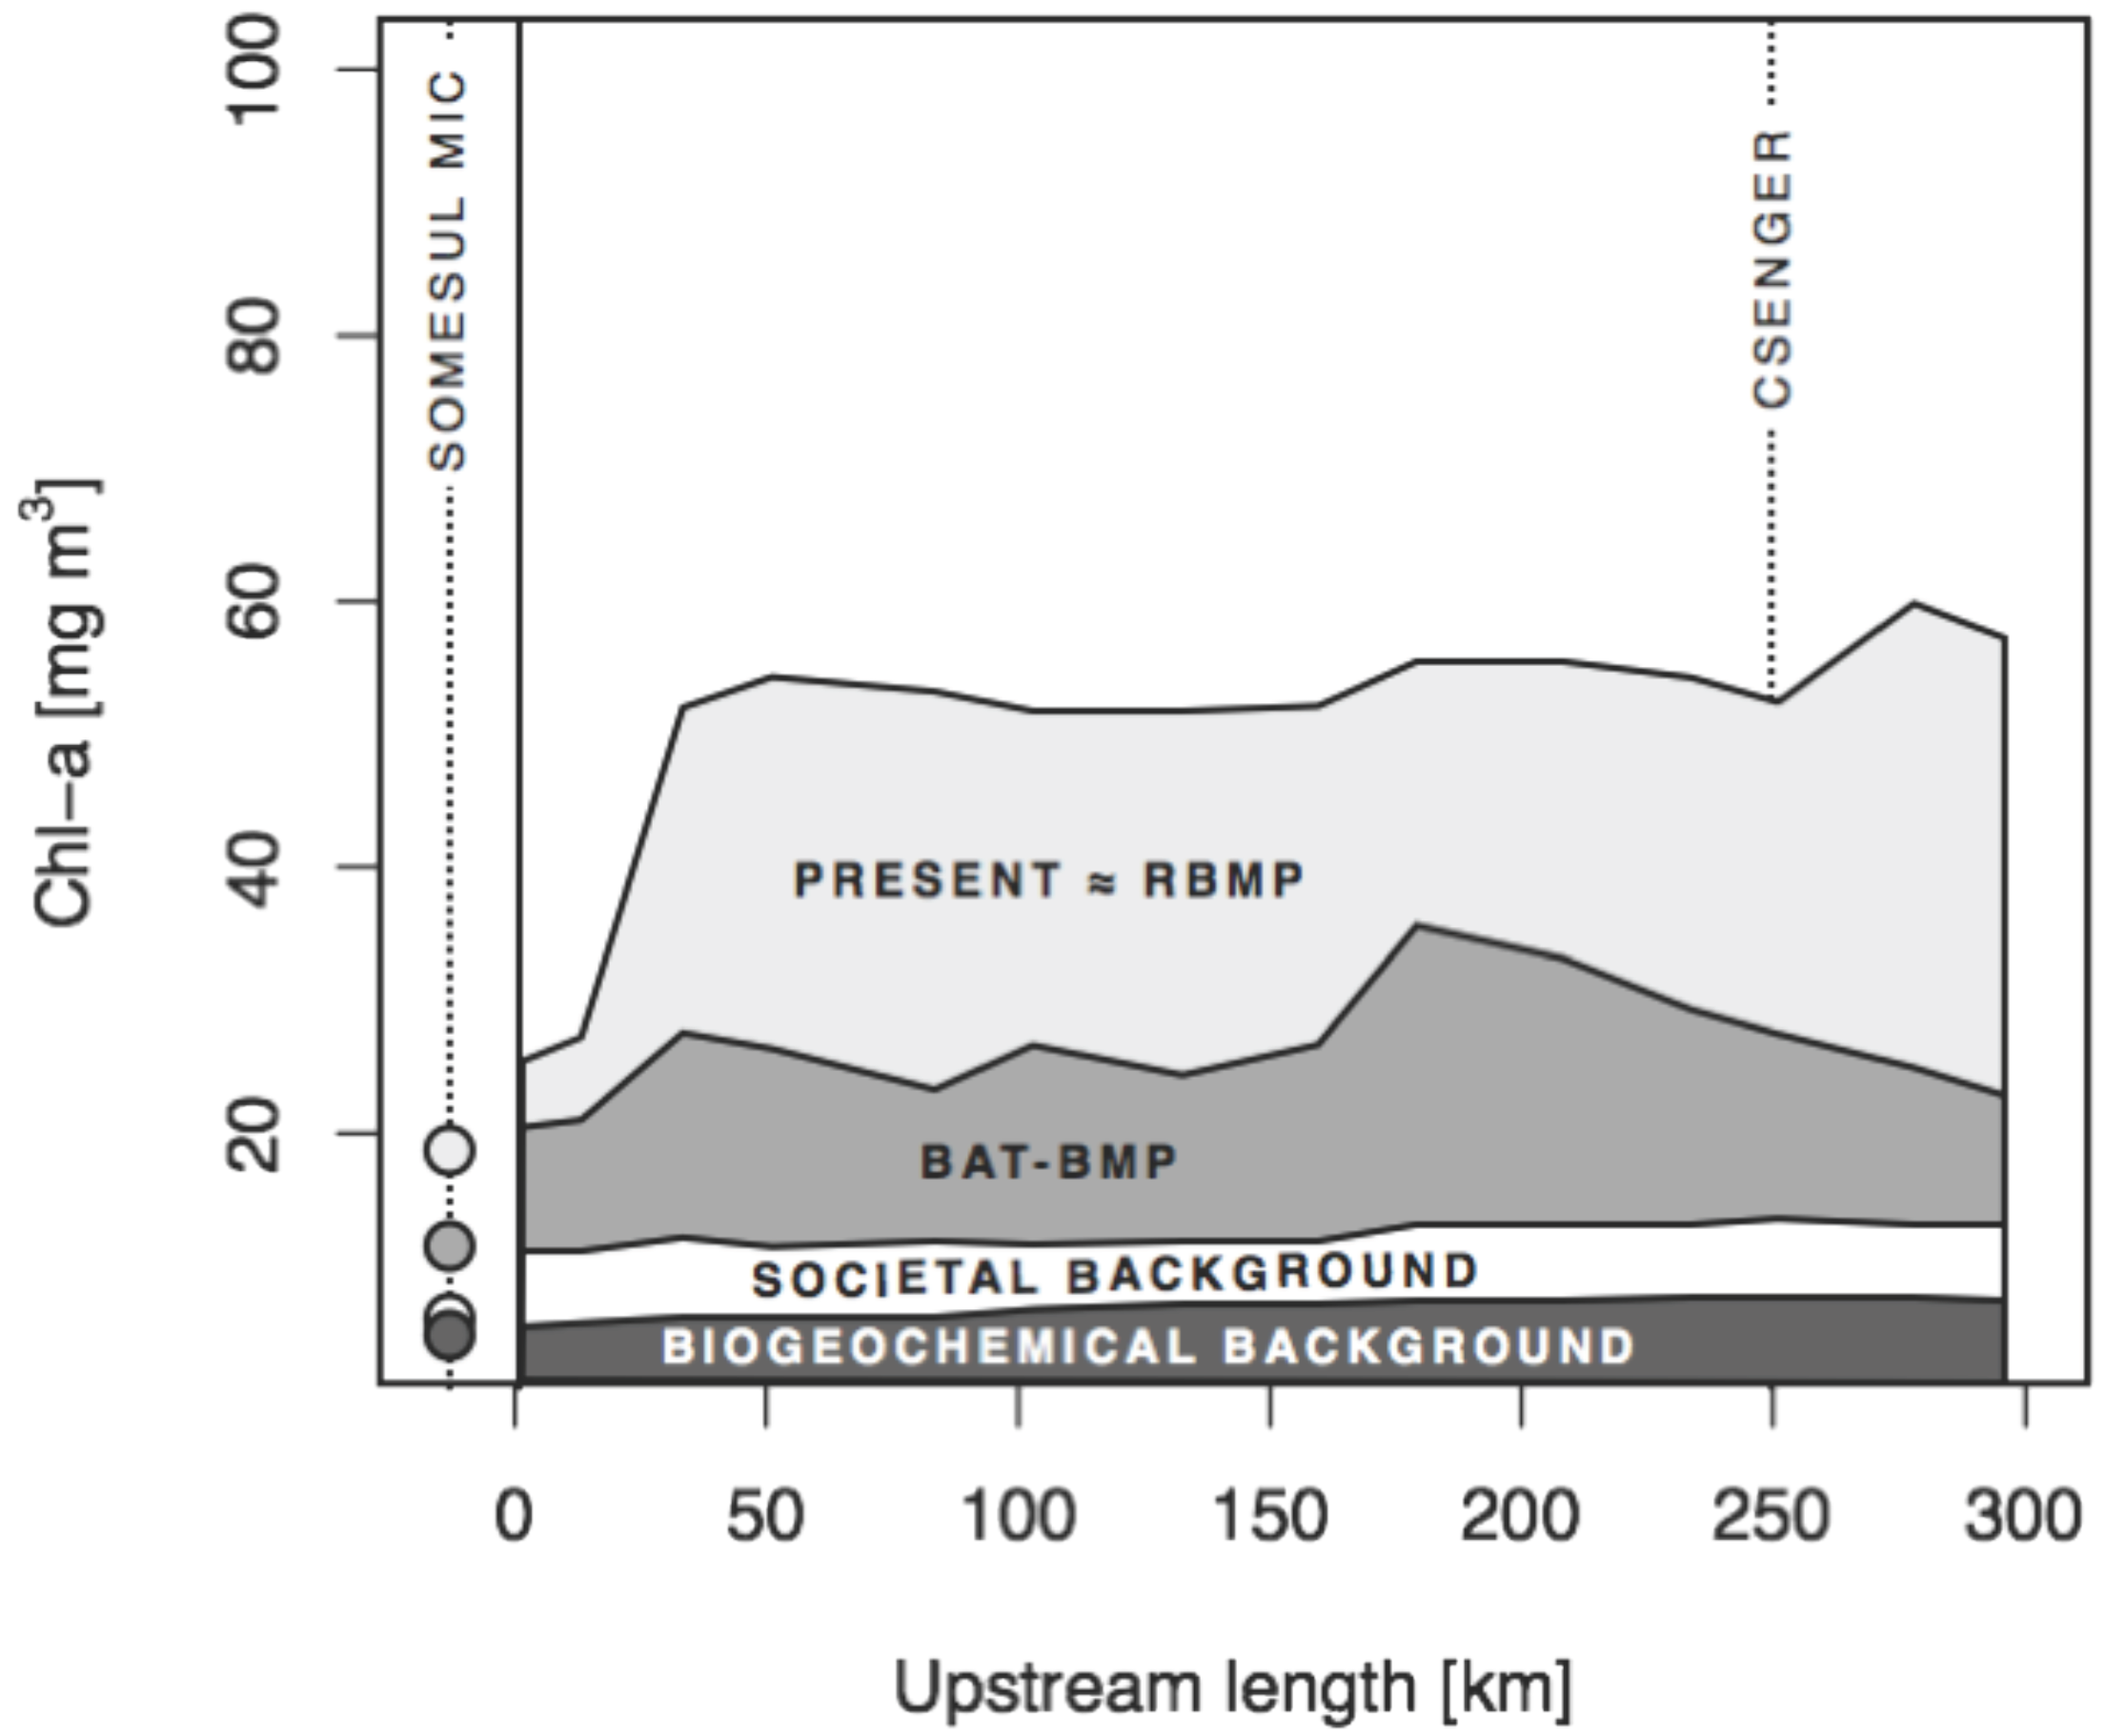
Observed and simulated summer mean Chl profiles along the Szamos River. Closed circles: observed in the extremely dry year of 2012. Grey region: simulated long-term summer mean; Dotted line: simulated mean for 2012; “Upstream length” is 0 km at the city of Dej and maximal at the confluence with River Tisza.
Figure 2.
Observed and simulated summer mean Chl profiles along the Szamos River. Closed circles: observed in the extremely dry year of 2012. Grey region: simulated long-term summer mean; Dotted line: simulated mean for 2012; “Upstream length” is 0 km at the city of Dej and maximal at the confluence with River Tisza.
While nutrient loads were moderate, summer algal growth was fast in the main channel (
Figure 2). This was explained by the almost pristine hydromorphology of the upper two thirds of the Szamos River. The unregulated channel provided a diverse array of habitats with highly variable depths and flow velocities. Meroplanktonic diatoms, which dominated the phytoplankton downstream of Dej in the summer, escape rapid washout by temporarily settling to the well-illuminated bottom along the extended shallow areas of the channel [
7]. Thus, advanced eutrophication paradoxically indicated the high ecological potential of the Szamos River. After the initial fast growth downstream of Dej, mean summer algal biomass remained high along most of the sections to the catchment outlet, except for a temporary drop from km 200 to 250 (
Figure 2). The drop may have been caused by the toxic pollution delivered by a tributary coming from the mines and industries of Baia Mare, but precise reasons are still unknown [
12].
3.2. Agricultural Nutrient Balance
Balanced fertilization dominated in arable land and plantations in the Szamos catchment; 77.5% of arable land and 56.1% of plantations belonged to this category. Simultaneously, 91.5% of grasslands were estimated to loose nutrients (insufficient fertilization). As a whole, 793,102 ha of agricultural land (89% of total) experienced insufficient or balanced nutrient supply. Over-fertilization was estimated only in 40,529 ha, equivalent to 4.5% of total agricultural area. This strongly contrasted many other regions of the World where the agro-economic boom is characterized by increasing yields and steady nutrient surpluses [
18].
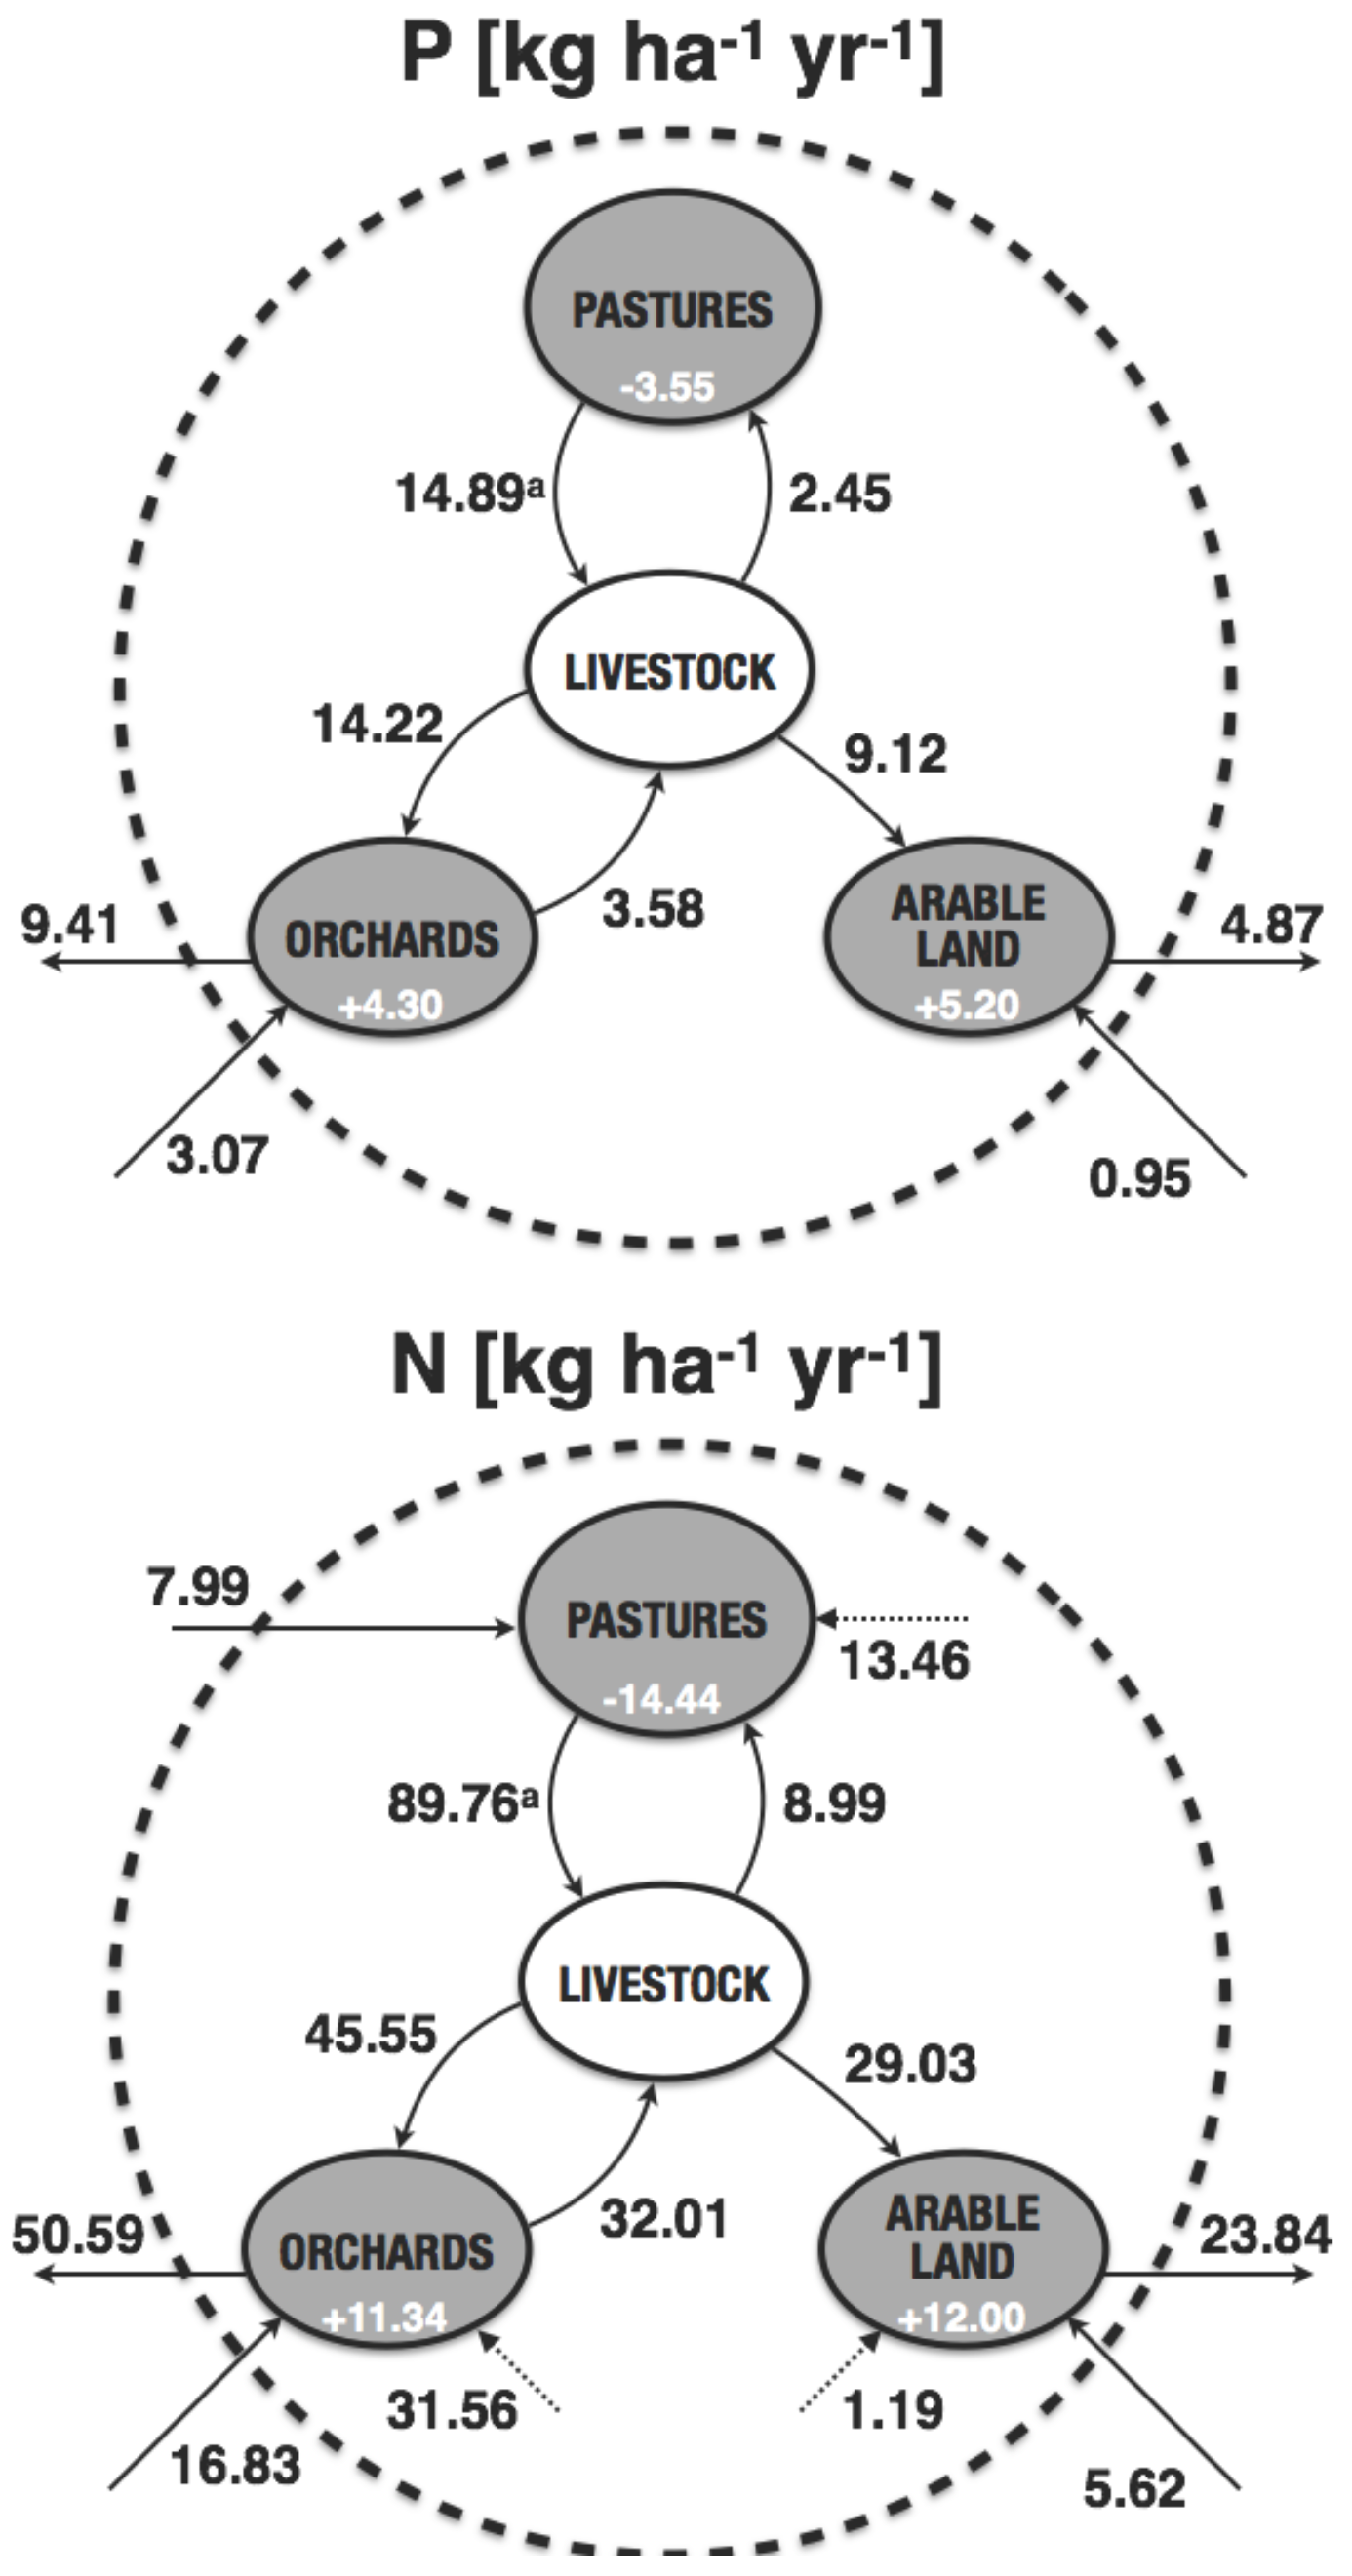
Under the present economic constraints, a basically closed regional nutrient cycling was the key feature of agricultural production in the Szamos catchment (
Figure 3). The close to zero overall nutrient balance would, however, be unsustainable since the nutrient supply in arable land and plantations was maintained by nutrient withdrawal from grasslands.
Figure 3.
Long-term annual mean agricultural budgets in the Szamos/Someş catchment. a—half of yield is supported by natural nutrient supply of soils. An internal utilization of fodder crops and an export of other arable crops is assumed. Arrows pointing into the circle indicate the import of mineral fertilizers; dotted arrows denote N2 fixation).
3.3. Catchment Modeling
The delineated catchment area of the Szamos River showed an almost perfect agreement with the catchment map of Apele Romane (2009). The length of streams totalled at 10,631 km in the area of 15,650 km
2, resulting in a modelled stream density of 0.68 km·km
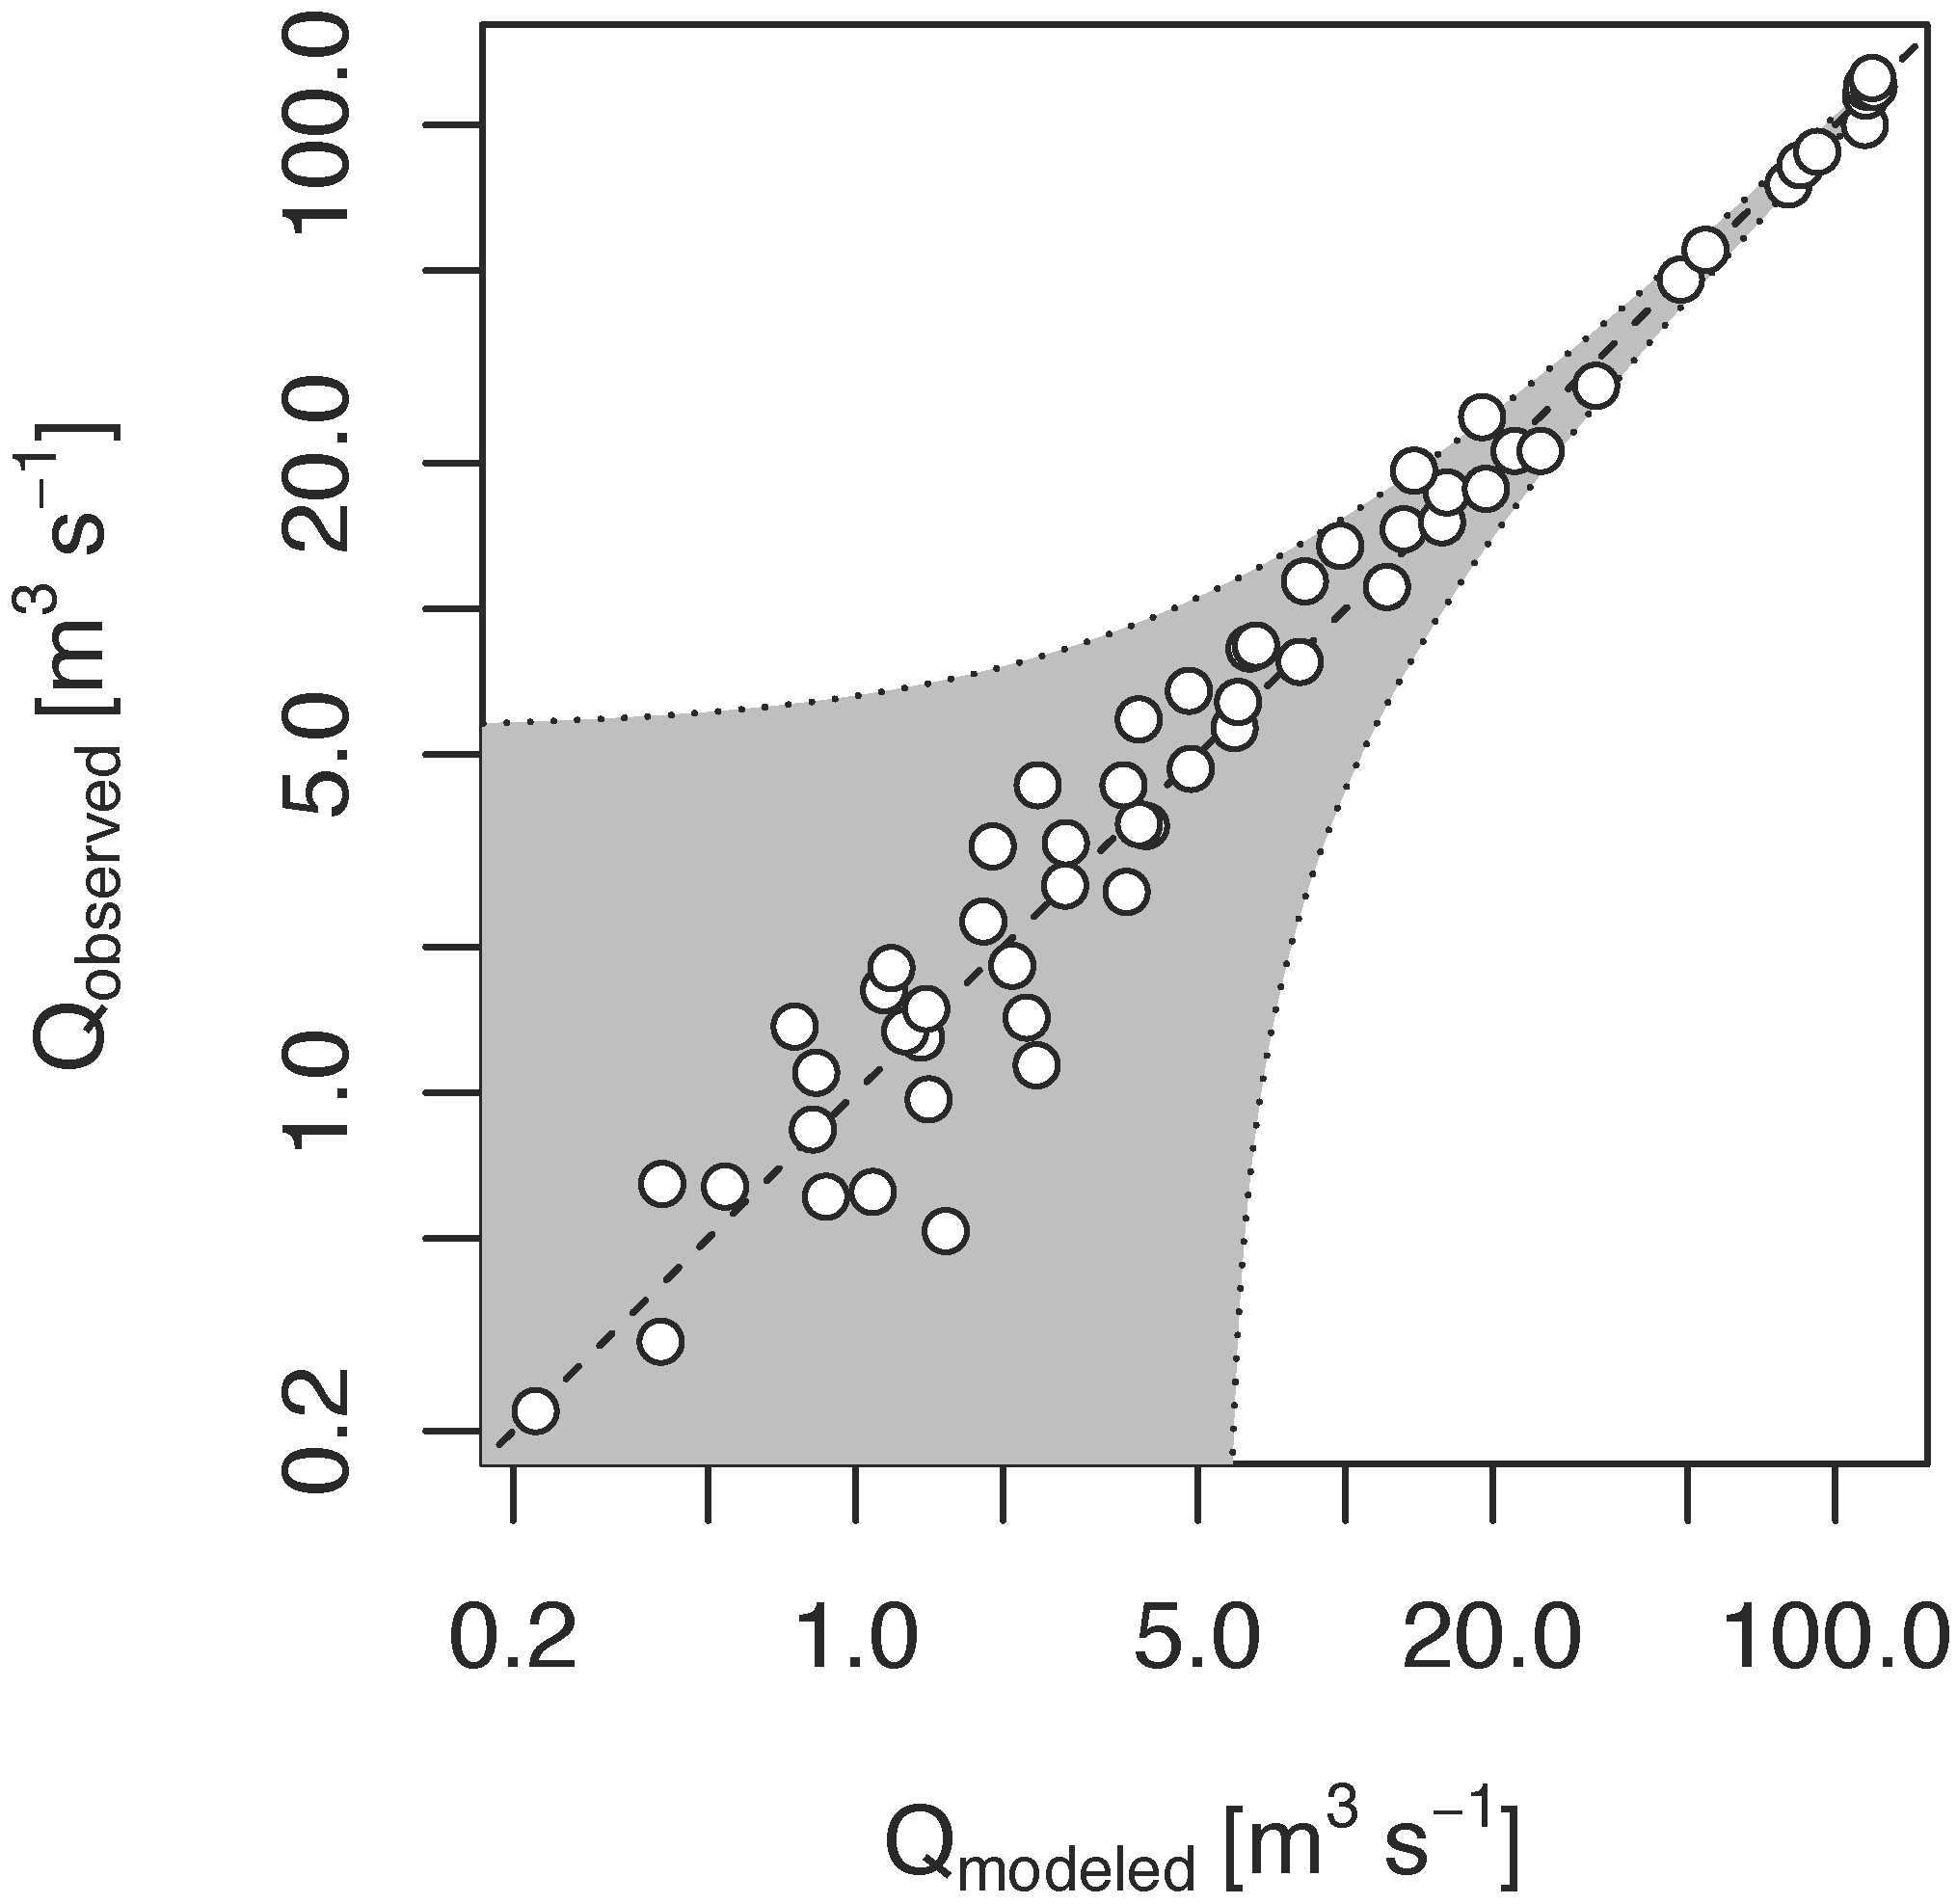
−2. Mean annual discharge agreed reasonably with the observations [
14] (
Figure 4). The relative error of the model results was significantly higher for smaller streams than for larger ones.
Figure 4.
Comparison of observed and modeled mean annual discharges at different gauging sites in the stream network. (Regression: Qobserved = 0.99 × Qmodeled, r2 = 0.99, N = 59. Shaded area is the 95% confidence band. Note that both scales are logarithmic).
Figure 4.
Comparison of observed and modeled mean annual discharges at different gauging sites in the stream network. (Regression: Qobserved = 0.99 × Qmodeled, r2 = 0.99, N = 59. Shaded area is the 95% confidence band. Note that both scales are logarithmic).
Annual rate of soil loss ranged from 0.01 to 390 t ha
−1·year
−1. Variability through many orders of magnitude is a widely observed feature of erosion. This huge variability is the basis for the common catchment management practice that aims at identifying and controlling erosive hotspots. Hotspots occupy only a negligible portion of a catchment, yet they are responsible for the bulk of sediment and diffuse nutrient loads [
19]. The average rate of soil loss was 9.1 t ha
−1·year
−1 across the entire Szamos catchment. This converted into a soil loss of 14.2 million tons or into the loss of a 0.48 mm thick soil layer annually, assuming the specific density of soil particles (2.7 t·m
−3) and a mean porosity of 30%. This average soil loss fell into the tolerable range [
20].
Estimated sediment flux agreed reasonably with the observed flux at the outlet of the Szamos catchment. The adjusted retention constants were kSS,t = 8×10⁻⁴·s−1 during overland flow and kSS,ch = 8×10⁻⁶·s−1 during in-stream transport. Only a small fraction of total soil loss was delivered to the catchment outlet (delivery ratio was 1:13). The adjusted deposition rate of the SS flux also applied to the PP flux. Simulated annual PP load (451 t P·year−1) fitted well to the observed load at the outle (444 t P·year−1).
Loss constants of DP and DIN during river transport were calibrated from the estimated point emissions and summer fluxes of these nutrient forms at the outlet. The adjusted constant for DP loss excluding phytoplankton uptake was kloss,DP = 8.4×10⁻⁶·m−1. Since travel velocity showed little variability around an average value of about 1 m·s−1 in the bulk of the stream network, the loss rate of DP was almost identical to the deposition rate of PP (and SS) during in-stream transport. While the retention mechanisms are different for DP (adsorption by sediments and/or uptake by benthic microorganisms) and PP (net settling), the similarity of the adjusted kSS,ch and kloss,DP values indicated that the two processes were closely coupled. This suggested that adsorption might have dominated DP retention, whereas biotic processes played a subordinate role. Due to the dominance of abiotic mechanisms, DP loss is a process that takes place throughout the year. The simulated annual DP + algal P load of 380 t P·year−1 favourably compares with the observed mean load of 393 t P·year−1. In spite of the high in-stream retention efficiency (64%), 86% of the simulated DP + AP load originated from point sources.
Phytoplankton growth was calibrated against the observed mean biomass profile along the Szamos River. The adjusted apparent net growth rate was as high as 2.5 day
−1. The model reasonably reproduced spatial growth pattern of phytoplankton along the Szamos River, including rapid growth downstream of Dej (
Figure 2). The high apparent net growth rate was indicative of the importance of benthic retention mechanism that enabled meroplanktonic algae to sustain high recruitment rate in the water by maintaining a large benthic stock that reproduced at a realistic low growth rate of 0.2–0.25 day
−1. The temporary drop in mean algal biomass between 200 and 250 km could not be simulated as neither toxic effects were not included in the model.
3.4. Evaluation of Management Alternatives
In Scenario RBMP, the sewer network would be extended significantly. With the exception of regional facilities, low efficiency mechanical and biological treatment would be installed. This would result in a 36% and 16% increase in annual municipal emissions of DP and DIN, respectively. Mean annual loads of these nutrients (DP + AP and DIN + AN) would increase at the catchment outlet by 43 t P·year
−1 and 265 t N·year
−1 (
Table 2). Elevated loads would result in a slightly higher mean algal biomass (
Table 2). The largest deterioration would be expected in the trophic status of the Someşul Mare River and in the Szamos River between Dej and the confluence of the Lapuş River. Thus, Scenario RBMP would increase both present nutrient loads and phytoplankton input into the Tisza River.
Table 2.
Annual mean nutrient fluxes and summer mean algal biomass (Chl) at Csenger according to observations and in different alternatives.
Table 2.
Annual mean nutrient fluxes and summer mean algal biomass (Chl) at Csenger according to observations and in different alternatives.
| Alternative | Q
(m3·s−1) | SS
(kt·year−1) | TP
(t P·Year−1) | PP
(t P Year−1) | DP + AP
(t P·Year−1) | DIN+AN
(t N·Year−1) | Summer Chl
(mg Chl·m−3) |
|---|
| Observations | 120 | 1100 | 853 | 444 | 393 | 5847 | 45 |
| PRESENT | 120 | 1070 | 831 | 451 | 380 | 5148 | 44 |
| BIOGEOCHEMICAL BACKGROUND | 109 | 88 | 65 | 19 | 46 | 748 | 5 |
| SOCIETAL BACKGROUND | 120 | 1177 | 474 | 332 | 142 | 2270 | 9 |
| RBMP | 120 | 1070 | 874 | 451 | 423 | 5413 | 49 |
| BAT-BMP | 120 | 600 | 541 | 264 | 277 | 3889 | 20 |
Scenario BAT-BMP assumed the introduction of state-of-the-art sewage treatment in nine major WWTPs planned to operate by 2018 and introduced BMPs in 1% of the catchment. Optimized management would decrease annual mean loads PP and SS by 44% from diffuse sources (
Table 2). In most cases, the optimization algorithm prioritized establishment of buffer strips along low order streams. The preference for enhancing retention near low-order streams over reducing erosion on steep slopes coincided with our previous findings in a much smaller catchment (the Zala River; [
10]). DIN + algal N loads decreased to 1259 t N·year
−1, primarily due to the reduction in point emission. As a consequence, summer mean biomass of phytoplankton decreased by more than 50% in the Szamos River (
Table 2;
Figure 5). To realize the largest improvement in the trophic status of both the Szamos and the Tisza Rivers, priority must be given to achieve the highest P removal efficiency allowed by the best available technology in WWTPs (95%), because algae are P limited along the main channel. Considering the high distance-specific in-stream loss coefficient of DP, WWTPs closer to the catchment outlet should be upgraded first.
Figure 5.
Longitudinal algal profiles along the Szamos River in different scenarios. “Upstream length” is 0 km at the city of Dej and maximal at the confluence with River Tisza.
Figure 5.
Longitudinal algal profiles along the Szamos River in different scenarios. “Upstream length” is 0 km at the city of Dej and maximal at the confluence with River Tisza.
Scenario SOCIETAL BACKGROUND highlighted that the present pollution mostly originated from point sources. The elimination of all wastewater inputs halved both P and N loads (
Table 2).
Scenario BIOGEOCHEMICAL BACKGROUND suggested that nearly all of the present PP load and 85%–90% of the DP+AP and DIN+algal N loads were due to human impact (
Table 2). River algae were P-limited in most of the stream network. Mean summer biomass of phytoplankton was about 5 mg Chl·m
−3, 10% of the present value (
Table 2). Presently (1995–2012) summer mean biomass of algae was 3.6 ± 1.0 mg Chl·m
−3 in the Tisza River at the nearest monitoring site upstream of the confluence with the Szamos River. Therefore it is clear that the Szamos River has been more productive than the Tisza River even under pristine conditions. Human activity, however, substantially magnified the extent of this impact.
In both BACKGROUND alternatives reduced nutrient availability was not the only factor that influenced algal growth. Large lakes and reservoirs represent a very important hydro-morphological modification factor inside a stream network in terms of nutrient balance and algal growth [
21]. The large reservoirs situated in the mountainous upstream parts of both the Someşul Mic and Mare subcatchments were absent from these two alternatives. Therefore mean water age at the mouth of the Szamos River decreased from the present 55 days to 4.3 days. As a consequence, phytoplankton could not exhaust nutrient-determined carrying capacity in many streams and rivers. This, together with diminished nutrient supply has led to a general improvement in trophic conditions across the stream network.
Based on the evaluation of alternatives, the application of BAT-BMP measures would meet the medium-term nutrient management objective, while executing RBMP would be a step in the wrong direction with respect to water quality. Implementing BAT-BMP would mean that the negative impacts of human activities would drop to less than half, a significant step towards the best attainable status with the presence of humankind on the catchment.


