Technical Note

A Web-Based Tool to Estimate Pollutant Loading Using LOADEST

1
Department of Rural Construction Engineering, Kongju National University, 54 Daehak-ro, Yesan-gun, Chungcheongnam-do 32439, Korea
2
Department of Agricultural and Biological Engineering, Purdue University, 225 South University Street, West Lafayette, IN 47907-2093, USA
3
National Institute of Environmental Research, 42 Hwankyoung-ro Seo-gu Incheon 404-708, Korea
*
Author to whom correspondence should be addressed.
Water 2015, 7(9), 4858-4868; https://doi.org/10.3390/w7094858
Submission received: 22 July 2015 / Revised: 26 August 2015 / Accepted: 2 September 2015 / Published: 8 September 2015

Abstract

:
Collecting and analyzing water quality samples is costly and typically requires significant effort compared to streamflow data, thus water quality data are typically collected at a low frequency. Regression models, identifying a relationship between streamflow and water quality data, are often used to estimate pollutant loads. A web-based tool using LOAD ESTimator (LOADEST) as a core engine with four modules was developed to provide user-friendly interfaces and input data collection via web access. The first module requests and receives streamflow and water quality data from the U.S. Geological Survey. The second module retrieves watershed area for computation of pollutant loads per unit area. The third module examines potential error of input datasets for LOADEST runs, and the last module computes estimated and allowable annual average pollutant loads and provides tabular and graphical LOADEST outputs. The web-based tool was applied to two watersheds in this study, one agriculturally-dominated and one urban-dominated. It was found that annual sediment load at the urban-dominant watershed exceeded the target load; therefore, the web-based tool identified correctly the watershed requiring best management practices to reduce pollutant loads.

1. Introduction

Total Maximum Daily Load (TMDL) is a governmental regulation designed to preserve and protect water quality of waterbodies in the USA. The Clean Water Act indicates that the states and the authorities need to establish priority rankings and to develop TMDL plans to improve water quality of contaminated streams and rivers. TMDL planning is composed of the identification of pollutant sources, watershed monitoring, and an effort to reduce pollutant sources to meet water quality target [1,2,3]. Thus, it is fundamental process for TMDL planning to estimate existing pollutant loads in a watershed and to define allowable pollutant loads, since it is required to identify the required reduction needed to meet water quality targets. To estimate pollutant loads, water quality samples would ideally have an identical temporal resolution to the streamflow data, but water quality samples are typically collected less frequently than streamflow because of collection and analysis costs.
A wide range of approaches are used to estimate pollutant loads, including watershed models. One of the benefits of using watershed models is that they allow consideration of the specific characteristics or conditions of a watershed, using temporal and spatial data. However, this is also somewhat of a disadvantage, because such models require a wide range of inputs and expertise for the input preparation and model runs [1,4].
Another approach uses regression models to identify a relationship between streamflow and water quality data and to estimate water quality data on days for which water quality samples are not available. Regression models evolved from simple linear relationships between streamflow and water quality data and now can use logarithmic transformations to estimate water quality concentrations (e.g., mg/L) or loads (e.g., kg) [5,6,7]. Furthermore, regression models provided acceptable pollutant load estimates with biweekly or monthly with storm chasing water quality data [8,9,10], although regression results should be used with caution on smaller watersheds [11]. LOAD ESTimator (LOADEST) [12] is software to estimate pollutant loads by regression models using streamflow, water quality concentration data, and regression model coefficients. LOADEST has been widely used for various water quality parameters with various sampling frequencies [1,13,14,15,16,17]. For instance, LOADEST was used monthly sampling for mercury [14], bimonthly sampling for suspended sediment [15], monthly sampling of total nitrogen and total phosphorus [16].
LOADEST has eleven regression models (Equations (1)–(11)), and the regression model coefficients are calibrated by three statistical methods: adjusted maximum likelihood estimation (AMLE), maximum likelihood estimation (MLE), and least absolute deviation (LAD) [12]. LOADEST provides three pollutant load estimations. The estimated pollutant loads by AMLE and MLE can be used when the residuals (or model error) follow a normal distribution, and both methods allow use of water quality datasets with censored data. The LAD method assumes that model errors are identically and independently distributed random variables. Park and Engel [17] and Park [1] applied the regression models of LOADEST to estimate annual nitrogen, phosphorus, and sediment load estimations from 21, 69, and 211 water quality datasets, respectively. LOADEST displayed less than 10% error in annual phosphorus and sediment load estimations when water quality datasets include approximately 30% storm samples. Furthermore, the regression models numbered 1, 3, 4, and 7 in LOADEST provided smaller differences relative to measured loads compared to the regression models numbered 2, 5, 6, 8, and 9 in LOADEST.
a 0 + a 1 ln Q
a 0 + a 1 ln Q + a 2 ln Q 2
a 0 + a 1 ln Q + a 2 d t i m e
a 0 + a 1 ln Q + a 2 sin ( 2 π d t i m e ) + a 3 cos ( 2 π d t i m e )
a 0 + a 1 ln Q + a 2 ln Q 2 + a 3 d t i m e
a 0 + a 1 ln Q + a 2 ln Q 2 + a 3 sin ( 2 π d t i m e ) + a 4 cos ( 2 π d t i m e )
a 0 + a 1 ln Q + a 2 sin ( 2 π d t i m e ) + a 3 cos ( 2 π d t i m e ) + a 4 d t i m e
a 0 + a 1 ln Q + a 2 ln Q 2 + a 3 sin ( 2 π d t i m e ) + a 4 cos ( 2 π d t i m e ) + a 5 d t i m e
a 0 + a 1 ln Q + a 2 ln Q 2 + a 3 sin ( 2 π d t i m e ) + a 4 cos ( 2 π d t i m e ) + a 5 d t i m e + a 6 d t i m e 2
a 0 + a 1 p e r + a 2 ln Q + a 3 lnQ  p e r
a 0 + a 1 p e r + a 2 ln Q + a 3 ln Q   p e r + a 4 ln Q 2 + a 5 ln Q 2 p e r
where, a0–6 are coefficients; Q is streamflow, dtime is decimal time; and per is the period defined by the user.
LOADEST is an efficient software to estimate pollutant loads and requires only streamflow and water quality data as model inputs, but it often requires significant effort to prepare the model inputs (i.e., streamflow and water quality data) and to handle input data format for the software runs. Thus, the objective of the study was to develop a web-based tool using LOADEST as a core engine to: (1) estimate pollutant loads associated with streamflow and (2) provide streamflow and water quality data retrieval via web access.

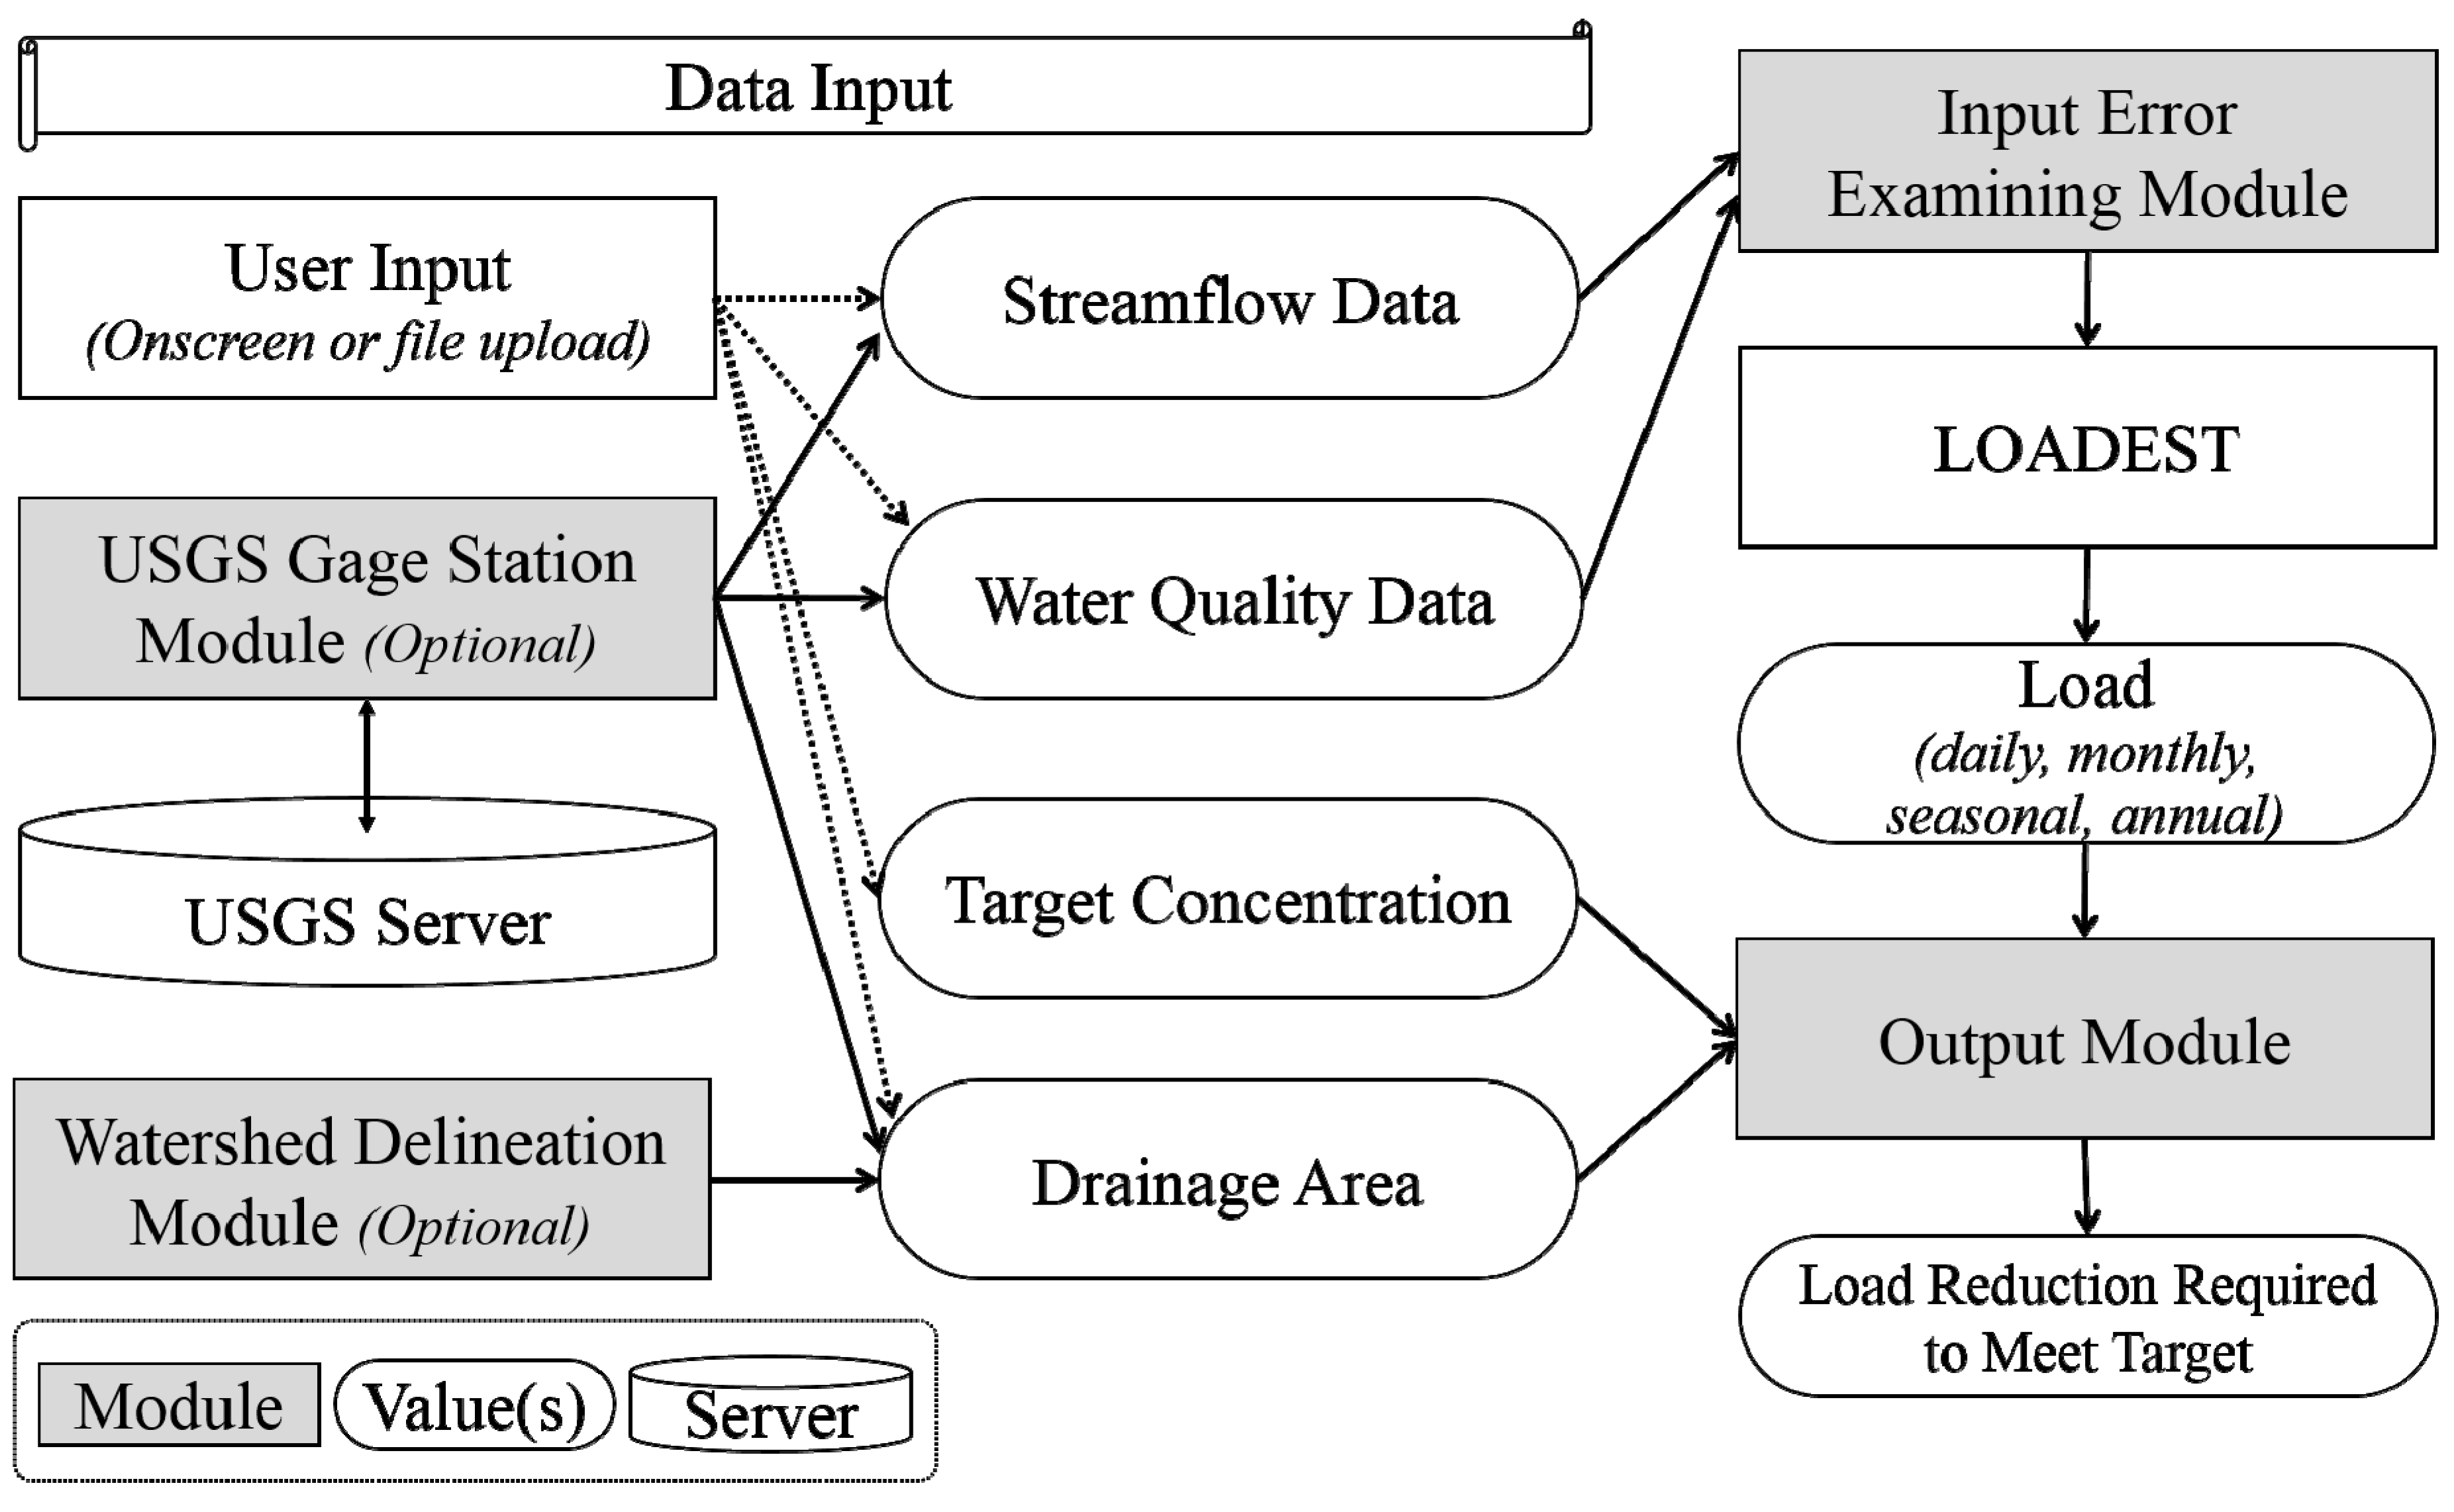
2. Materials and Methods

A web-based tool was developed in this study, providing user-friendly interfaces and input data collection via web access (Web-based Load Calculation using LOADEST; LOADEST WEB) [18] (Figure 1). Three modules were developed to collect and to handle input data, and one module was imported and modified from another web-based tool (Long-Term Hydrology Impact Analysis Tool; L-THIA) [19] to retrieve watershed area (Figure 2).
Streamflow and water quality data required to run LOADEST can be input by users, or obtained from the U.S. Geological Survey (USGS) by the first module. The datasets can be prepared by the user or can be collected from USGS through web access (USGS Water-Quality Data for the Nation) [20]. The module provides a Google map interface displaying USGS stations in all U.S. states. The module requests and receives streamflow and water quality data from the USGS server by the station number of which the user finds and selects the USGS station of interest on the Google map. Then, the user selects one of the water quality parameters, since the datasets from USGS are for many water quality parameters. Once the user selects the water quality parameter, the module extracts the water quality data and makes the dataset available for use in LOADEST WEB without data formatting.
Figure 1. Web interfaces of LOADEST WEB.
Water 07 04858 g001
The second module, Watershed Delineation Module, retrieves watershed area to be used for computing the pollutant loads per unit area. LOADEST WEB computes the pollutant loads per unit area from watershed area and estimated pollutant load by LOADEST. There are three ways to input watershed area: watershed area can be given by the user if it is known, can be retrieved by the USGS gage Station Module, or can be retrieved by the Watershed Delineation Module. The module to delineate watershed in the web-based L-THIA was imported and integrated with LOADEST WEB. The module delineates a watershed using the thirty-meter resolution digital elevation model (DEM) from the USGS National Elevation Dataset.
The third module examines potential error of input datasets for LOADEST runs. LOADEST requires both streamflow and water quality data to calibrate the regression model coefficients, and uses logarithm terms. Therefore, streamflow data must be given for the date at which water quality data are given, and streamflow cannot be a negative value. Such errors occur occasionally due to user typographical mistakes. In addition, the USGS datasets may have missing data or negative values for streamflow due to dramatic changes in atmospheric pressure or by a sudden drop in the wind speed [21]. The module examines both streamflow and water quality datasets and allows correcting the error manually or automatically.
Figure 2. Schematic depicting LOADEST WEB to provide model inputs from USGS.
Water 07 04858 g002
The Output Module computes estimated average annual load and allowable average annual load (i.e., target load), and provides user-friendly table and graphical interfaces from LOADEST outputs (Figure 3). The module computes the estimated average annual load from the IND file which is one of LOADEST outputs and which is estimated daily loads, and computes the allowable daily load from target concentration (i.e., water quality target) and daily streamflow. The module computes estimated and allowable average annual loads per unit area dividing the estimate and allowable loads by watershed area. In addition, the module allows downloading all input and output files of LOADEST.
Figure 3. Output interfaces of LOADEST WEB.
Water 07 04858 g003

3. Application of LOADEST WEB

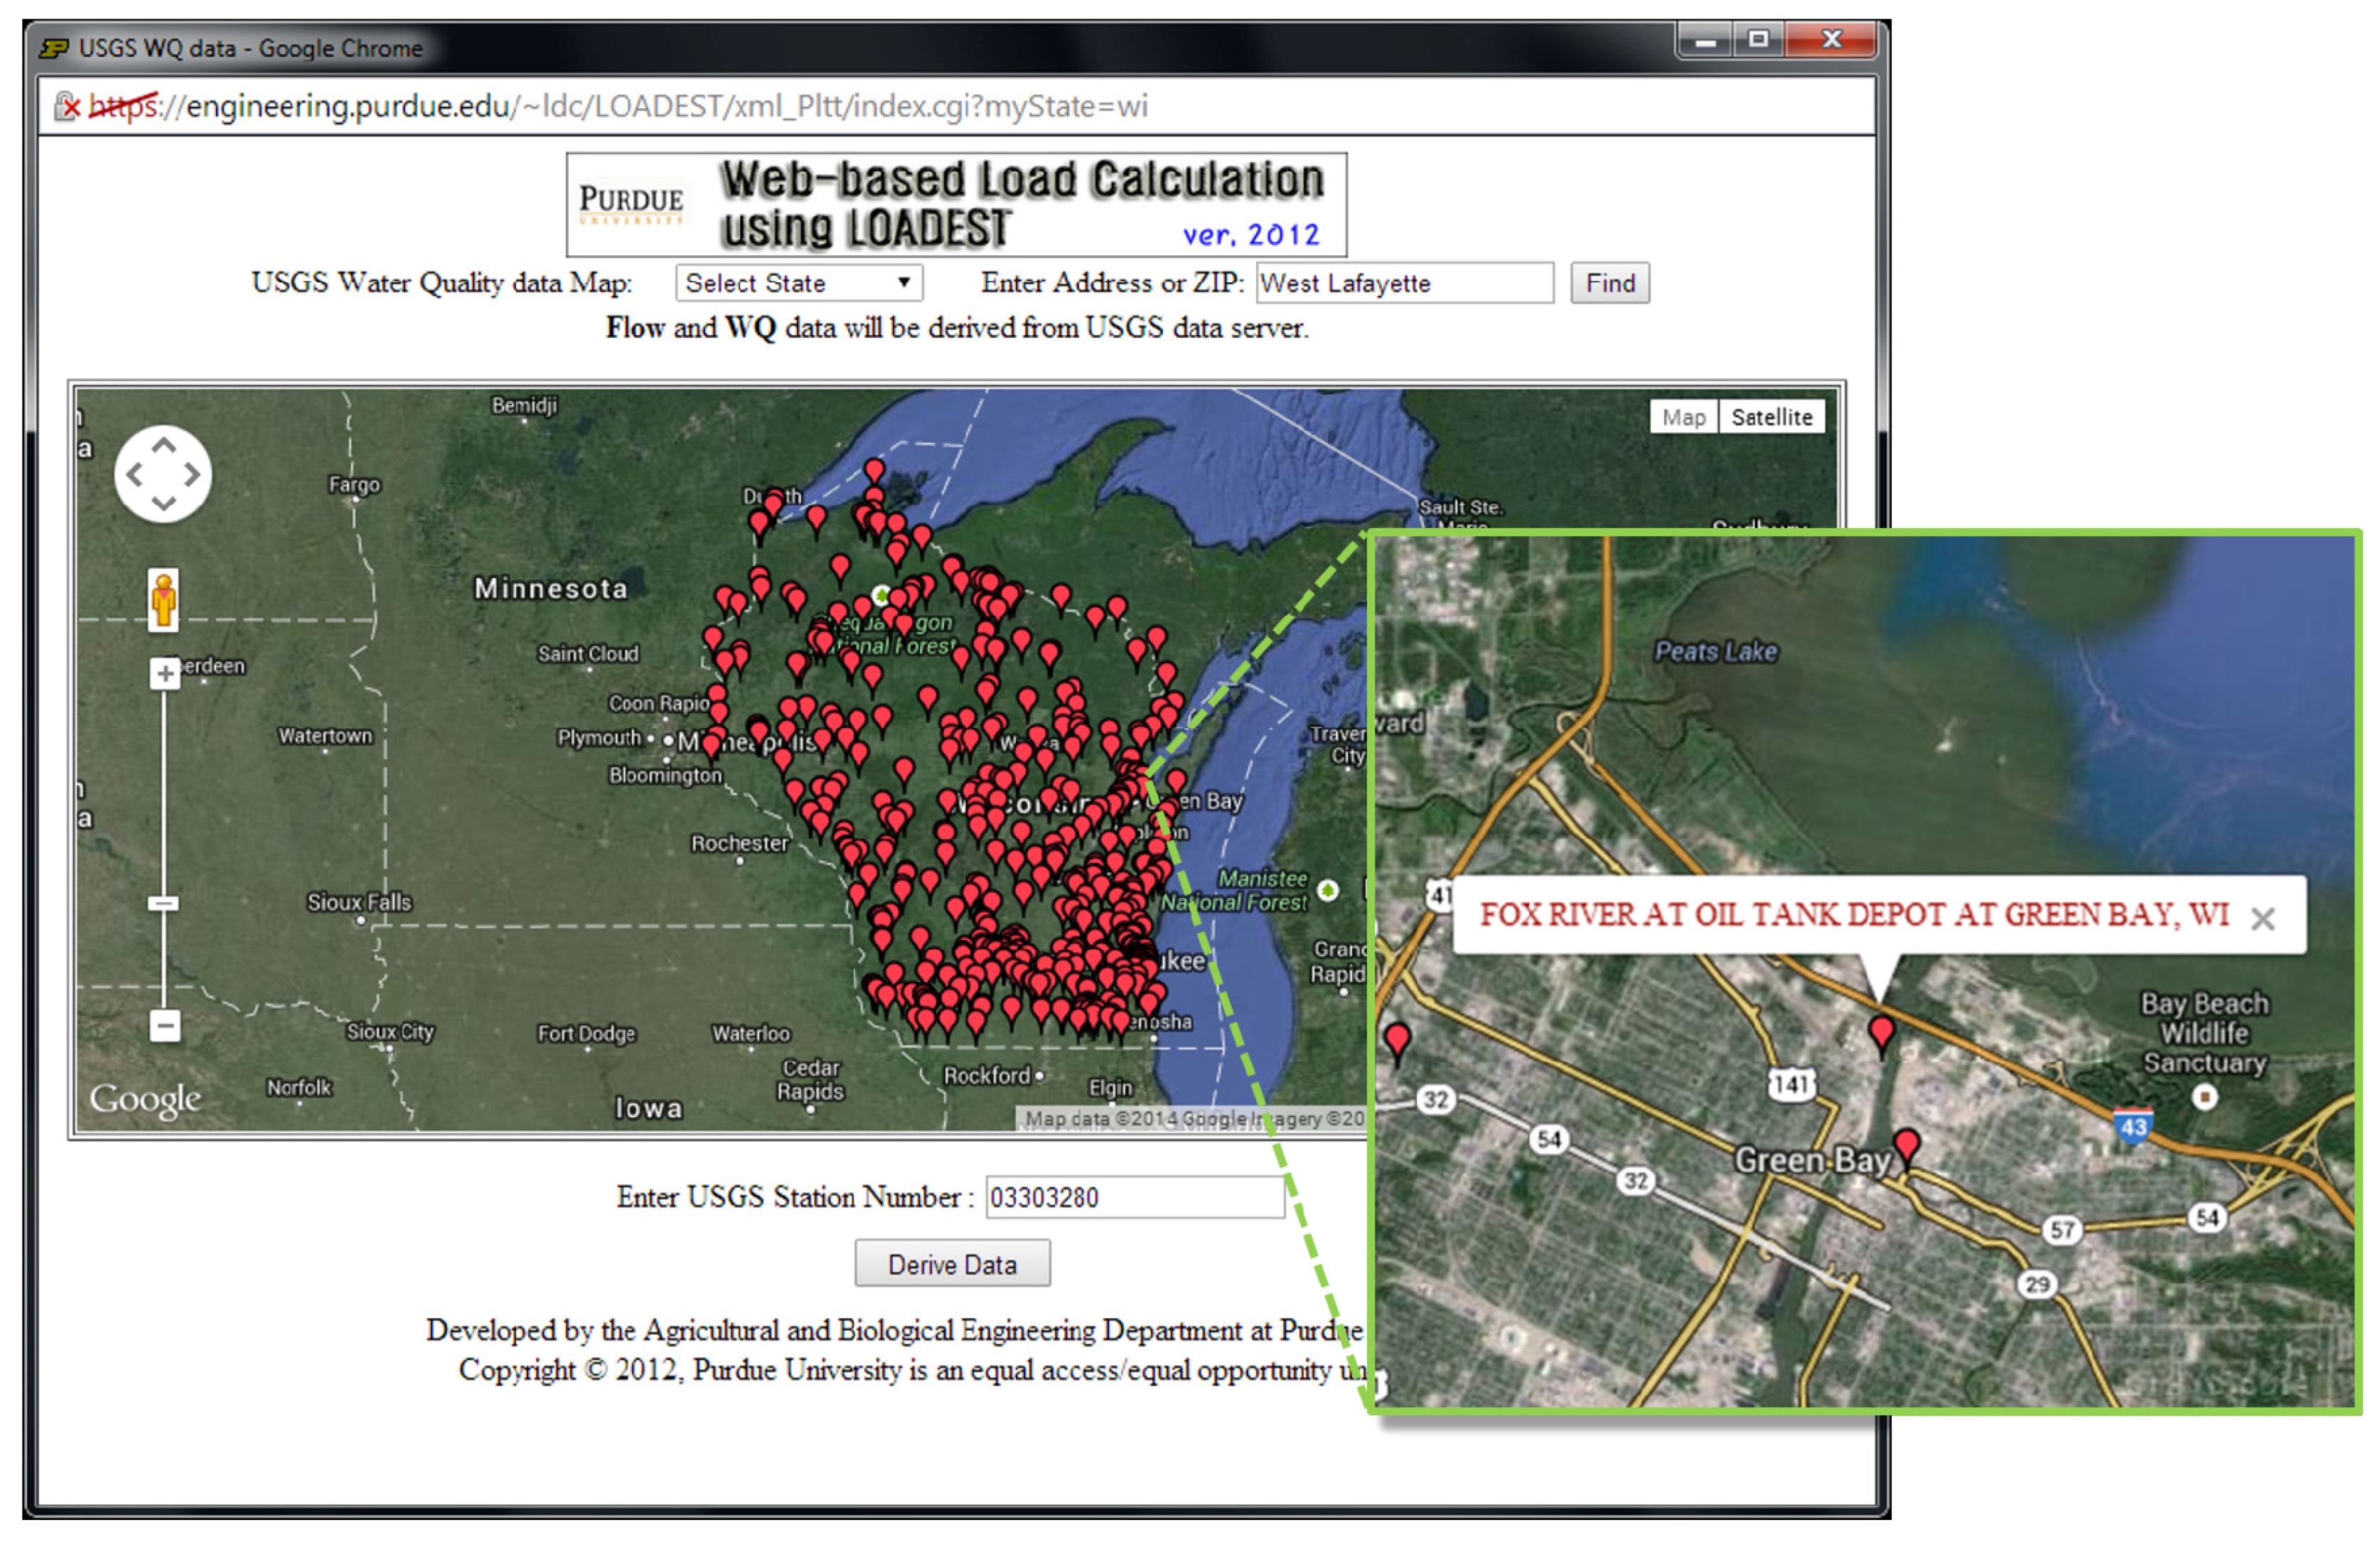
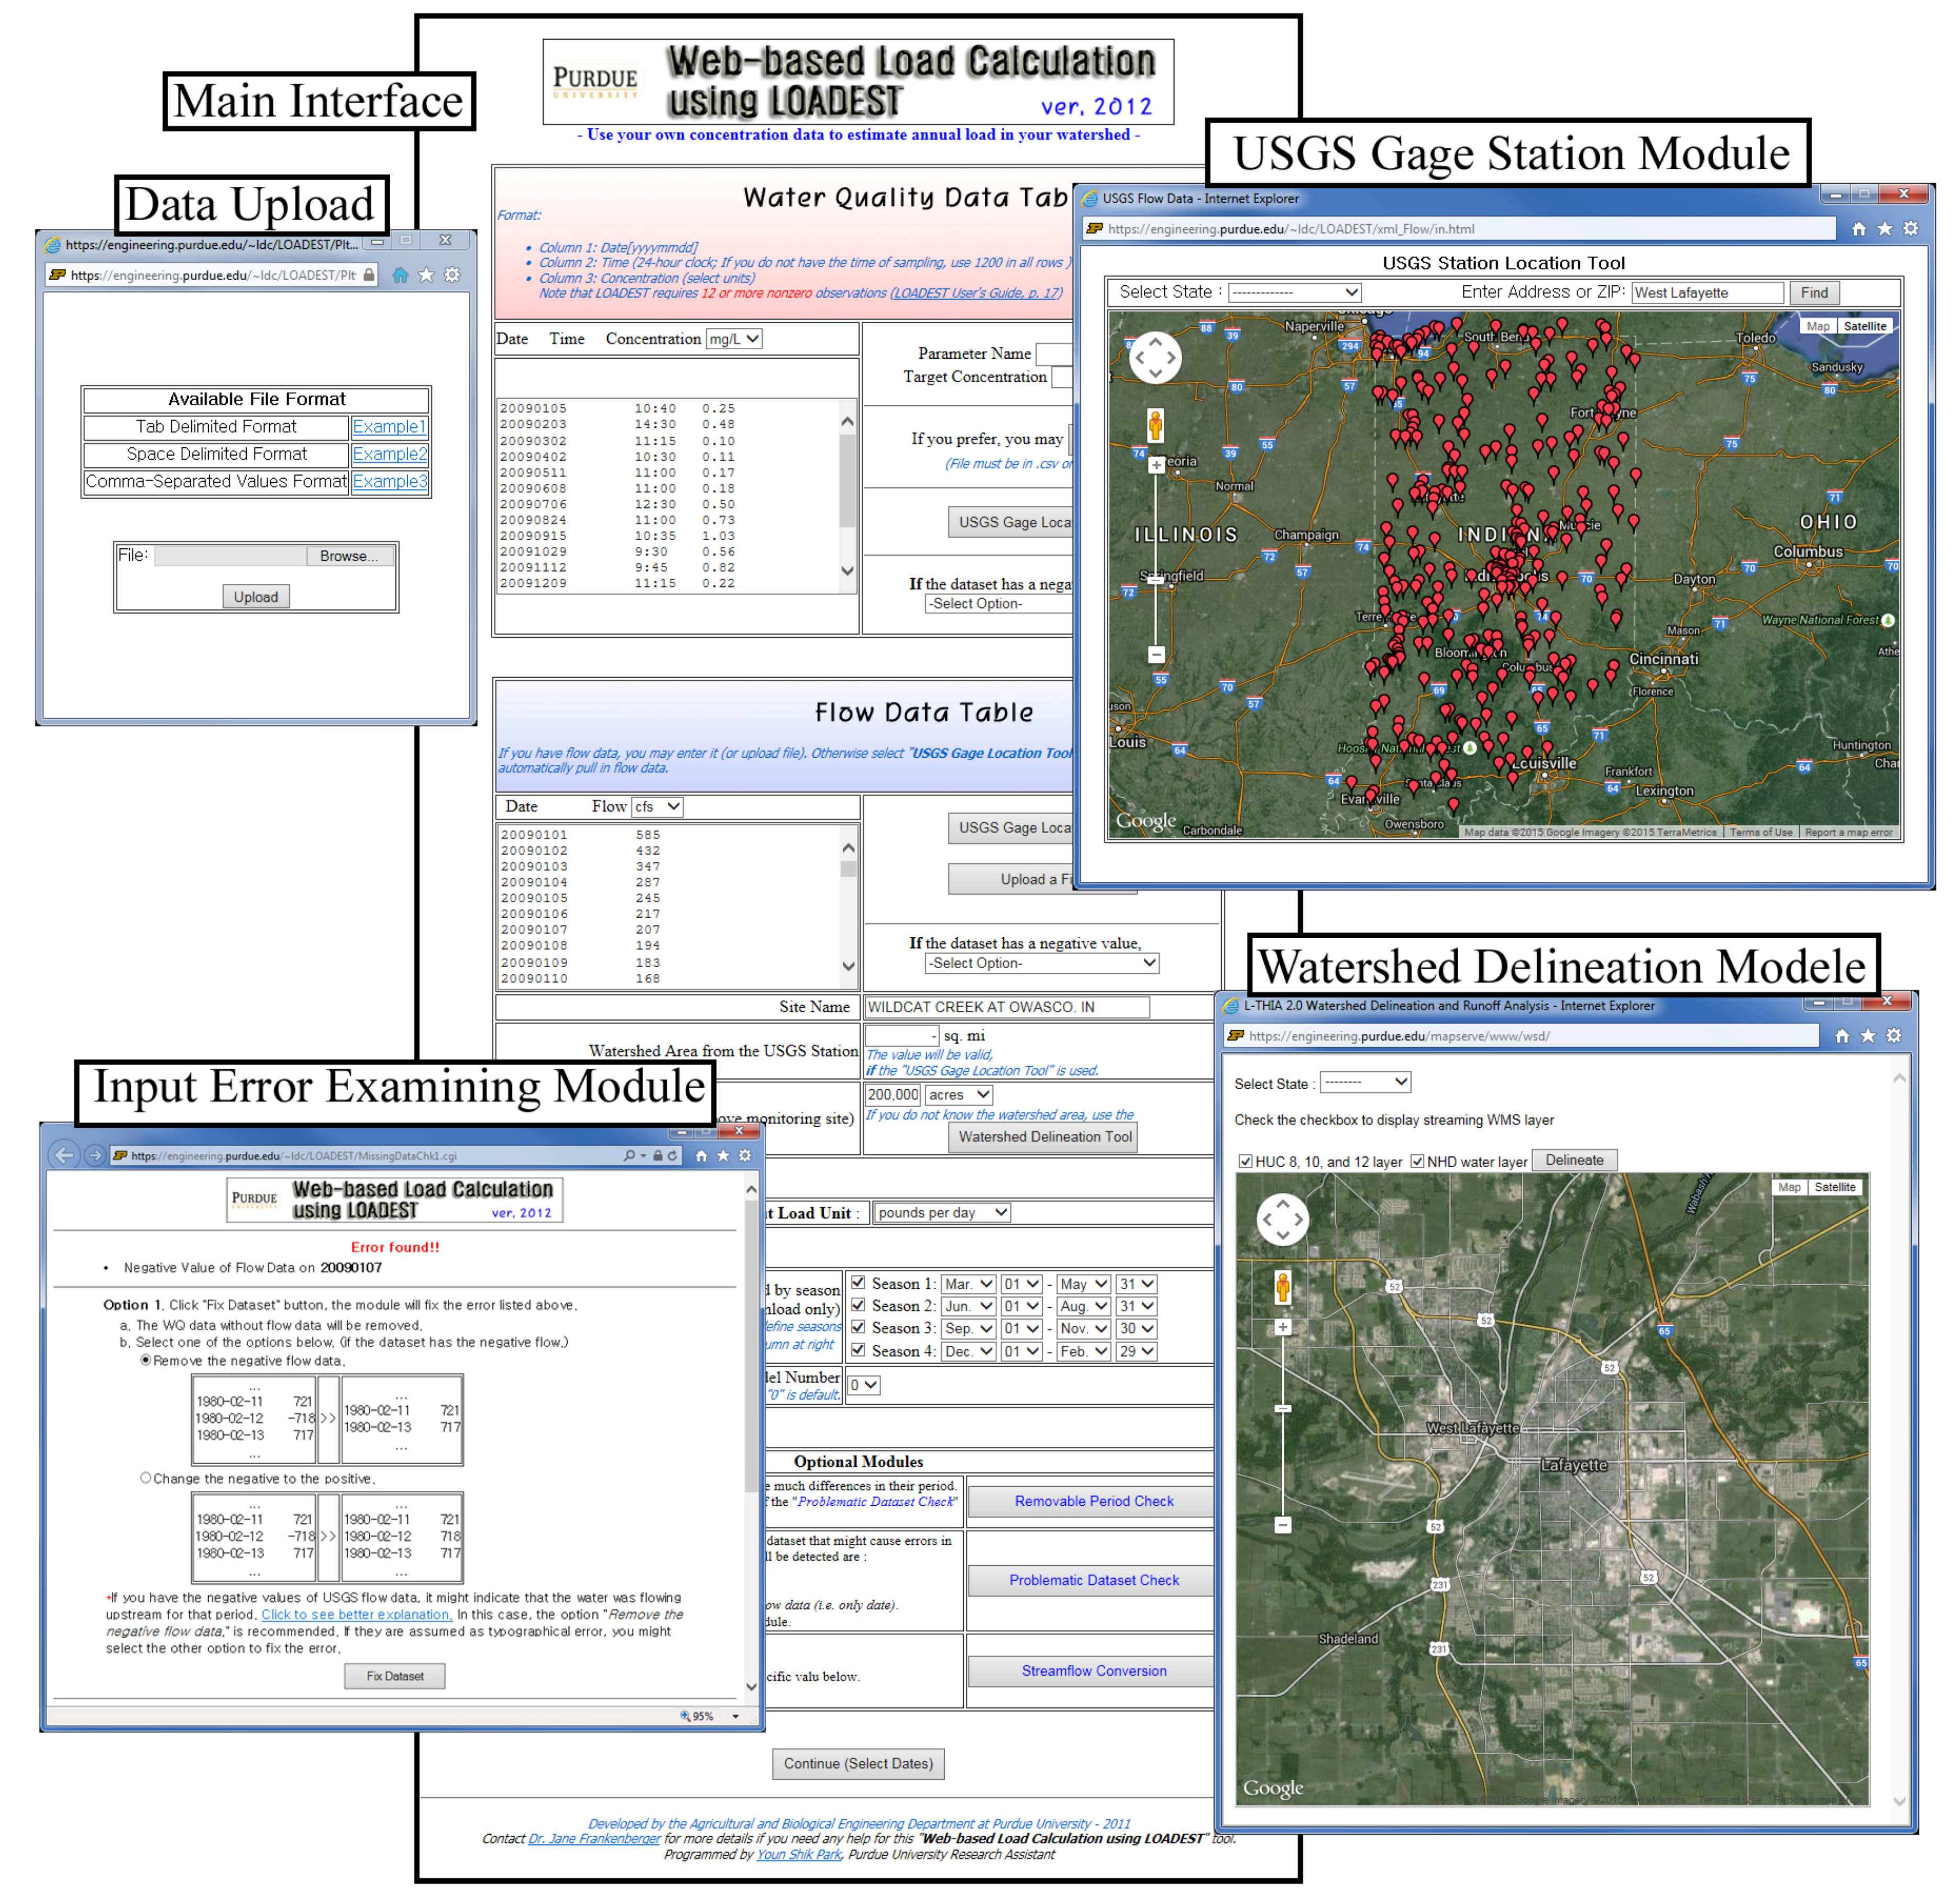
3.1. Demonstration of USGS Data Retrievals and Input Error Checking

One of the benefits of using the web-based tool is that the web-based tool examines potential error of input datasets for LOADEST runs. A USGS station was selected to demonstrate use of the Input Error Examining Module. The USGS station 040851385 is located at Brown County (Figure 4). Streamflow data were retrieved by the USGS gage Station Module, and were examined by the Input Error Examining Module. The module reported that streamflow data from the USGS station had twelve missing data from 17 June 2014 to 20 August 2014 (accessed 25 August 2014) and had thirty-five negative values from 17 October 1989 to 3 August 2014. USGS streamflow data file has only date for missing data; therefore, the dates without streamflow values needed to be removed before LOADEST runs.
Two options for negative streamflow data are given by the module, one is to convert the negative value to positive value if it is typographical error. The other is to remove the streamflow data, in other words, not to use the streamflow data for LOADEST run. It is suggested that the negative streamflow data be removed if the data was from USGS gage station, instead of converting the data into positive values for reasons expressed in [21].
Figure 4. Location of USGS station named Fox River at Oil Tank Depot at Green Bay.
Water 07 04858 g004

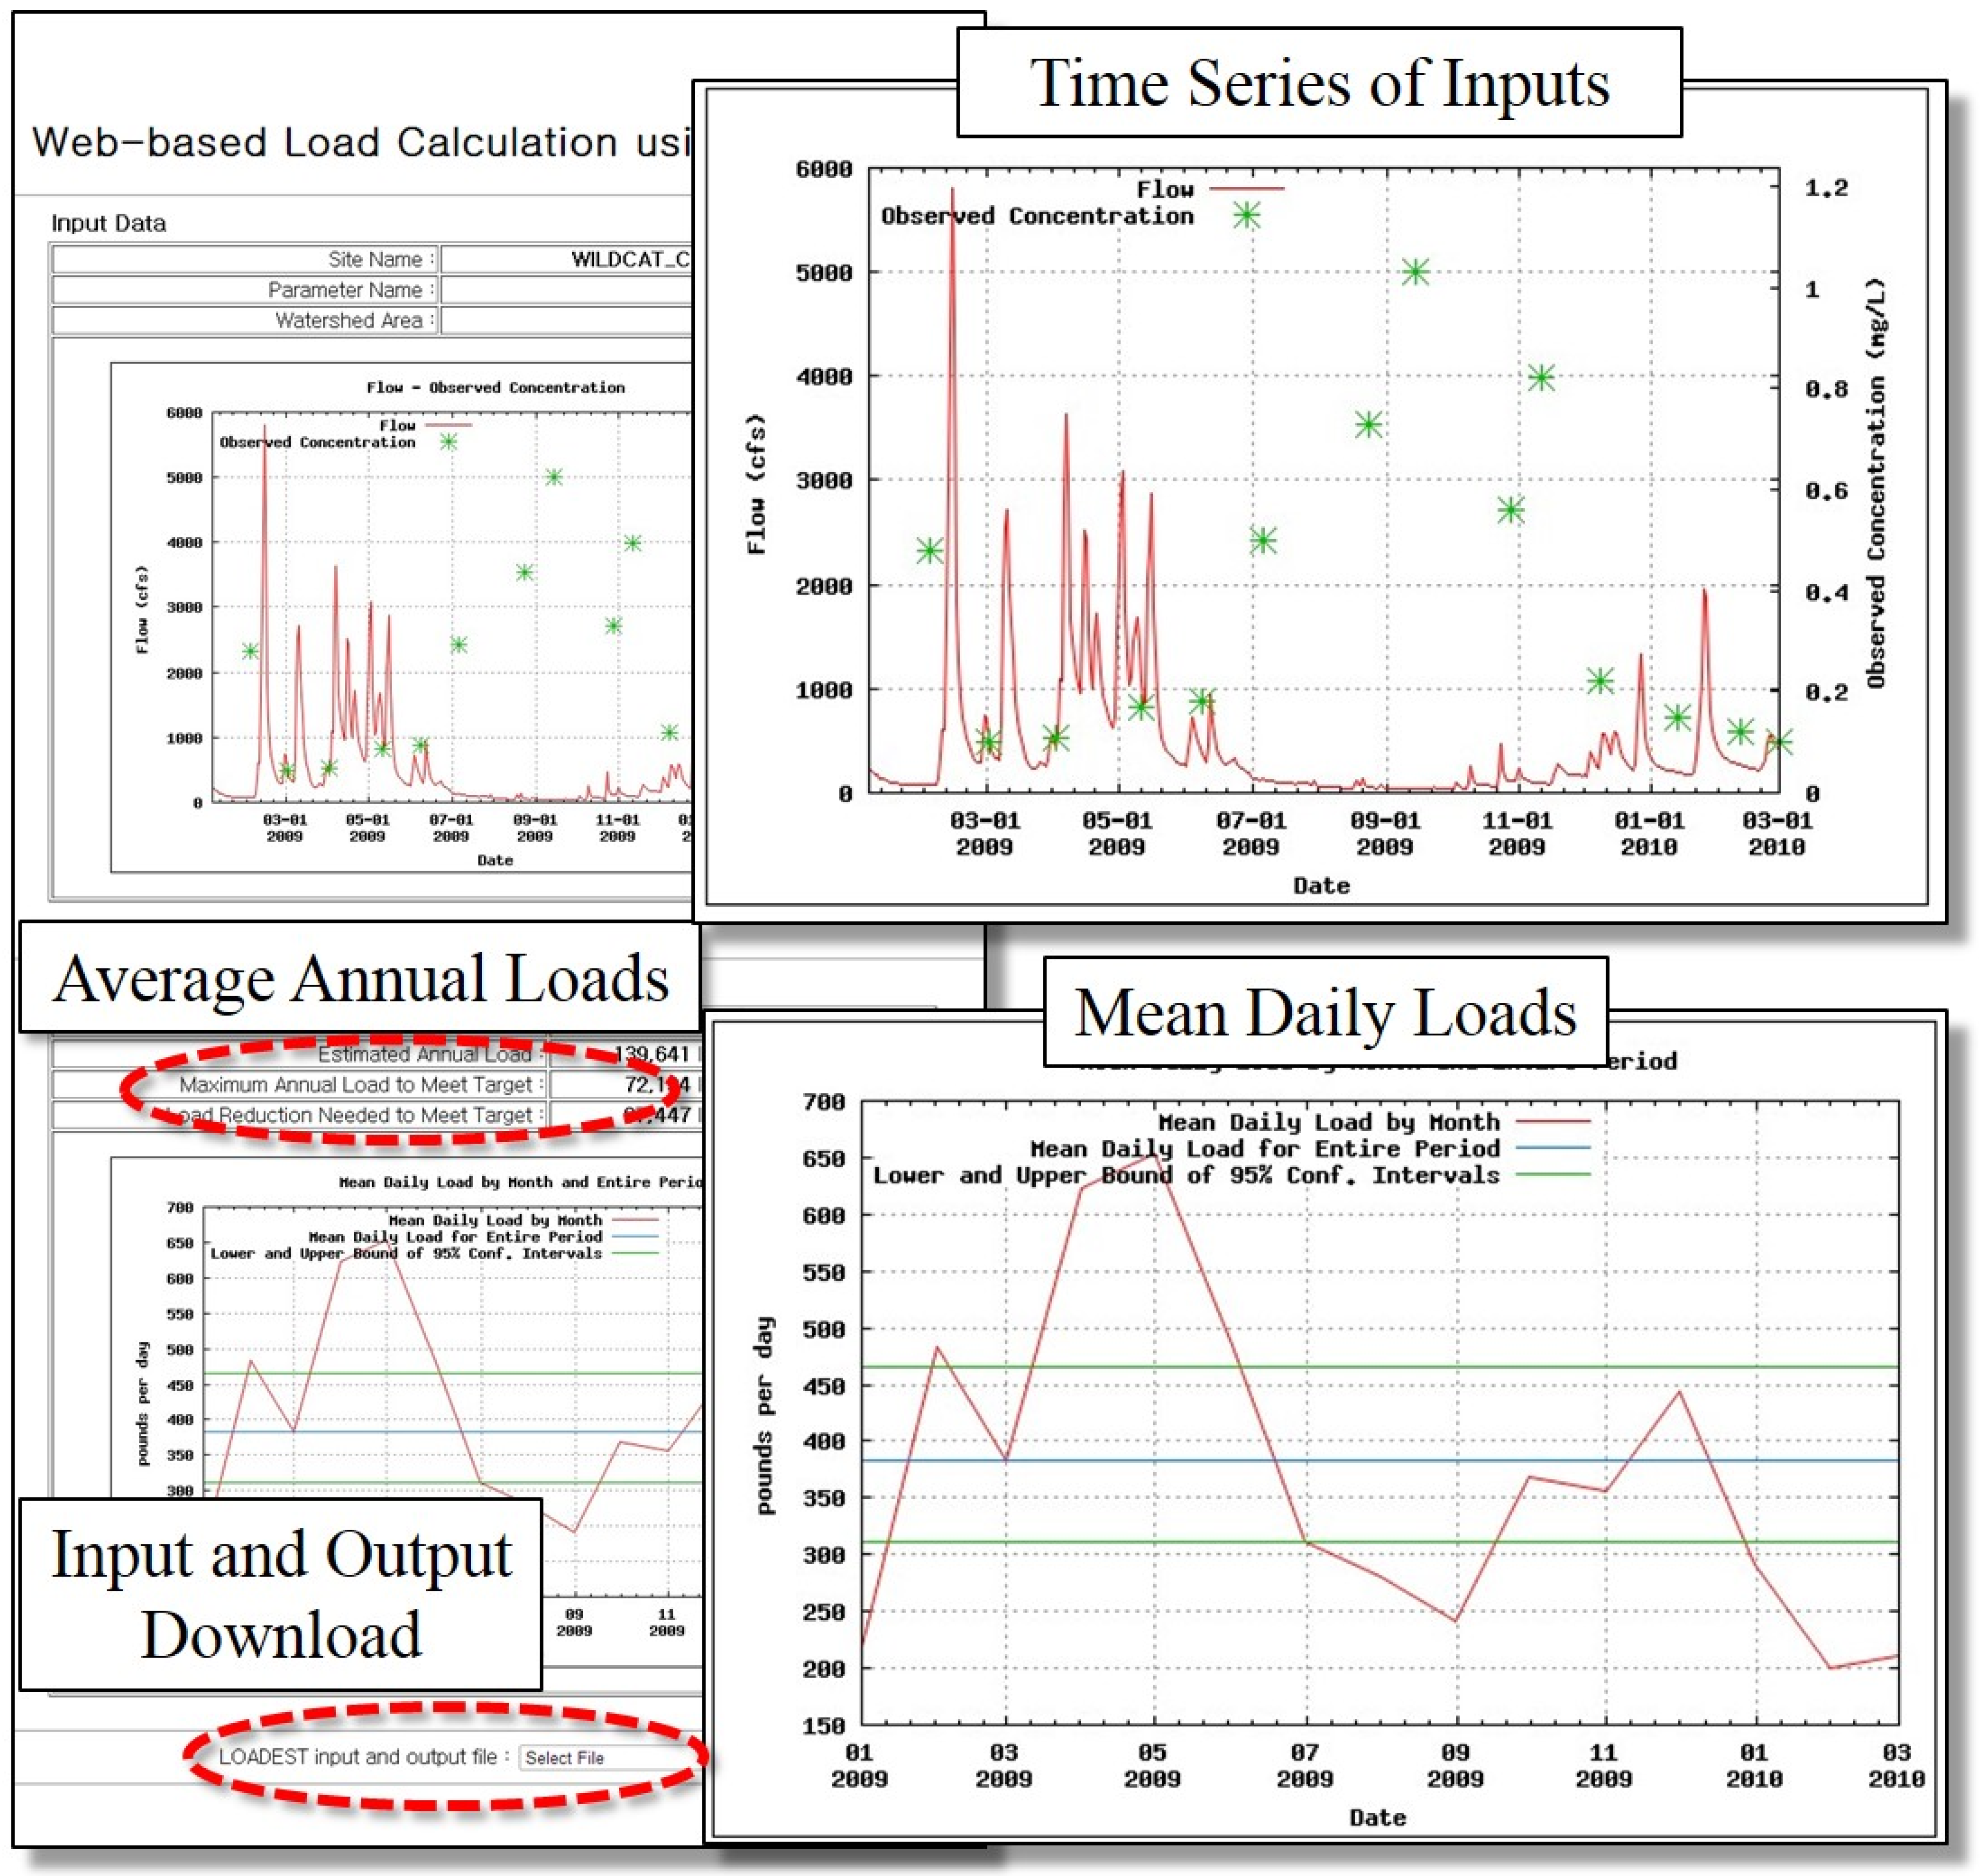
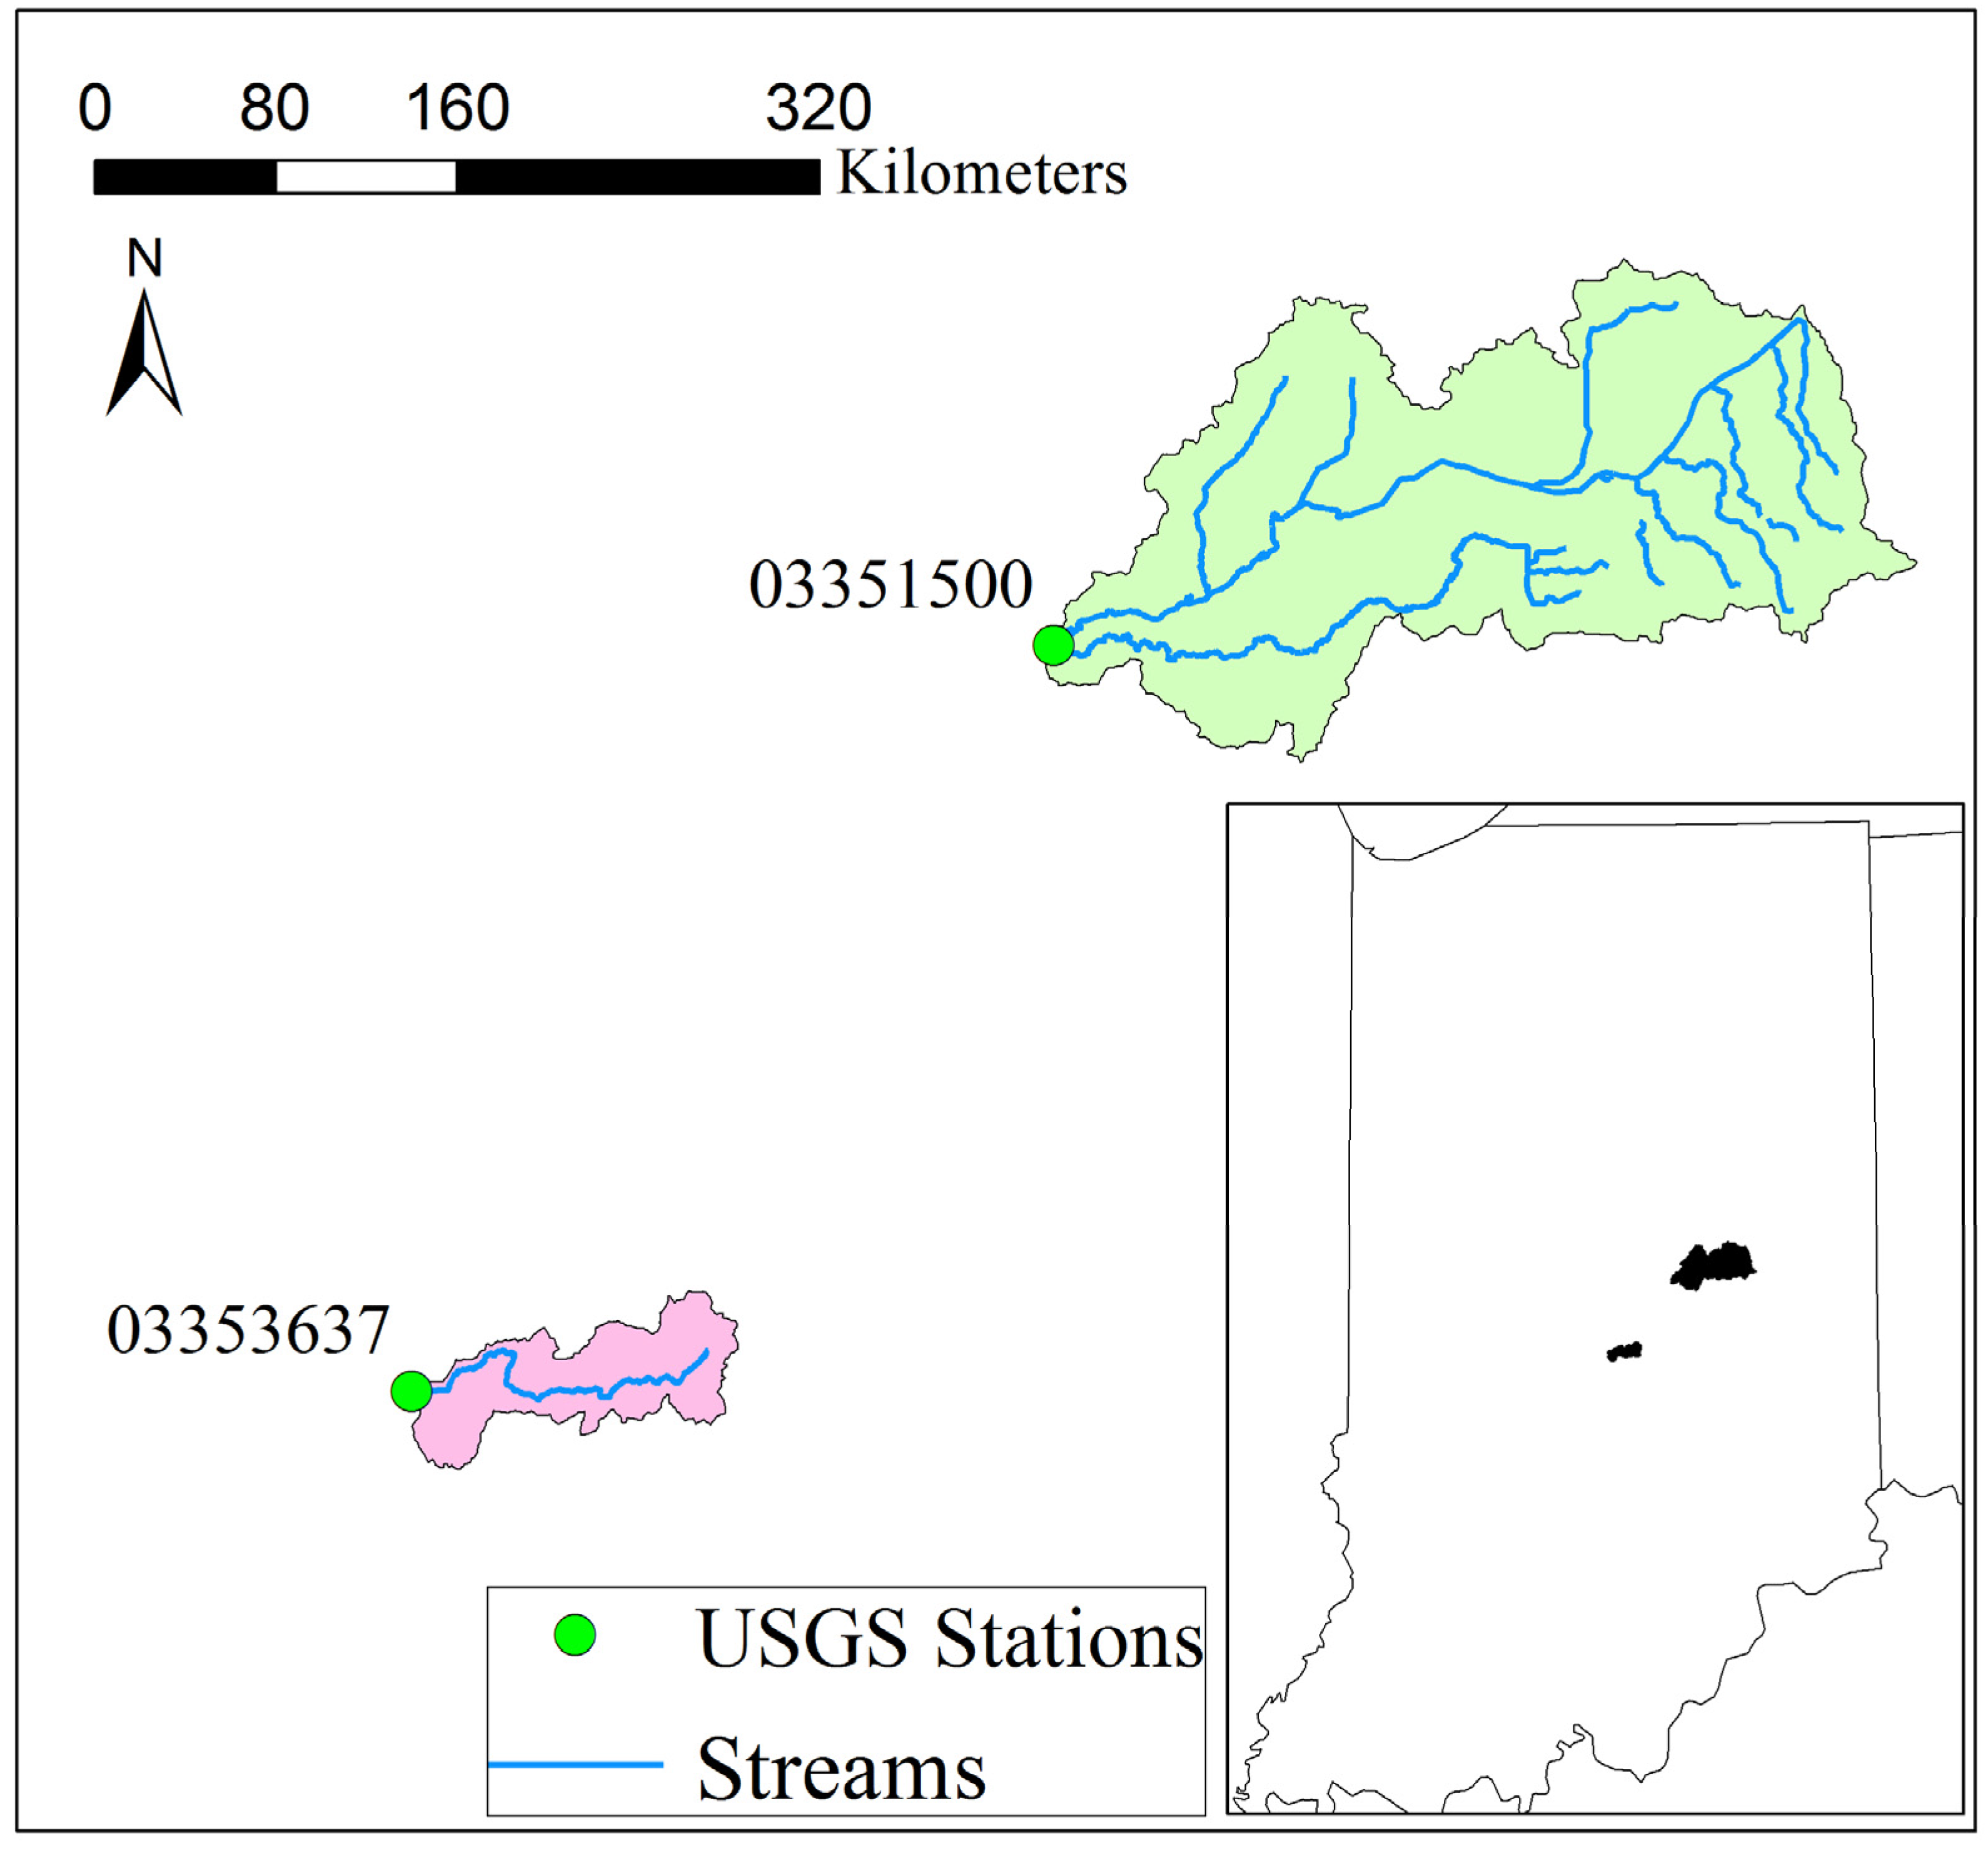
3.2. Application for Average Annual Sediment Load Reduction

Two watersheds were selected to demonstrate sediment load estimations using LOADEST WEB, Fall Creek near Fortville (FCF; USGS Station Number 03351500) and the Little Buck Creek near Indianapolis (LBC; USGS Station Number 03353637) watersheds in Indiana (Figure 5). The FCF watershed area was 438 km2, with 74% (326 km2) of the watershed land use being agricultural area (Table 1). The LBC watershed area was 52 km2, with 90% (47 km2) of the watershed land use being urban area (Table 1). Streamflow and sediment data (‘Suspended sediment concentration, milligrams per liter’, USGS water quality parameter code: 80154) were retrieved from USGS server via web access by LOADEST WEB. Sediment data from 27 February 2007 to 7 December 2009 for USGS station 03351500 and sediment data from 6 January 2000 to 7 September 2004 for 03353637 with streamflow data from 1 January 2000 to 31 December 2013 were used to estimate average annual sediment loads. The water quality target was set to 80.0 mg/L [22]. Park and Engel [17] suggested to select the regression model numbered 3 in LOADEST for average annual sediment load estimations, since the regression model provided the most accurate and precise sediment load estimates. Therefore, the regression model 3 was selected for sediment load estimations. Daily sediment load predictions by LOADEST and observed data at USGS station 03351500 had Nash-Sutcliffe efficiency (NSE) of 0.84 and coefficient of determination (R2) of 0.88. And, NSE and R2 at USGS station 03353637 were 0.51 and 0.97.
Figure 5. Location of USGS stations to estimate annual sediment loads.
Water 07 04858 g005
Table 1. Dominant land uses in watersheds.
USGS StationWatershed NameTotal Area (km2)Agriculture (km2)Urban (km2)
03351500Fall Creek near Fortville, IN43832651
03353637Little Buck Creek near Indianapolis, IN52347
Estimated average annual sediment load in the FCF watershed was 12.6 × 10⁹ kg/year (or 288.6 kg/ha/year), while target average annual sediment load (or allowable load) was 17.2 × 10⁹ kg/year (or 391.8 kg/ha/year); therefore, the required reduction for the FCF watershed was 0.0% (Table 2). However, estimated average annual sediment load in the LBC watershed was 2.5 × 10⁹ kg/year (or 487.3 kg/ha/year), while target average annual sediment load (or allowable load) was 1.8 × 10⁹ kg/year (or 336.9 kg/ha/year); therefore, the required reduction for the LBC watershed was 30.9% (Table 2).
The average annual sediment load in the FCF watershed did not exceed water quality target; in other words, existing sediment load in the watershed already met the water quality target. However, the average annual sediment load in the LBC watershed exceeded the water quality target; therefore, best management practices (BMPs) to reduce sediment load are required for the watershed.
Table 2. Target and estimated annual sediment loads.
USGS StationWater Quality TargetEstimated LoadRequired Reduction
(109 kg/year)(kg/ha/year)(109 kg/year)(kg/ha/year)
0335150017.2391.812.6288.60%
033536371.8336.92.5487.331%

4. Conclusions

Typically, TMDL plans include the identification of pollutant sources, watershed monitoring, and reduction of pollutant sources to meet water quality target. Various approaches or models are used to estimate pollutant loads, and LOADEST is one widely used approach. However, LOADEST often requires considerable effort to prepare and format model inputs.
A web-based tool using LOADEST as a core engine was developed in this study to integrate four modules and provide user-friendly interfaces and input data collection via web access. The first and second modules allow preparing LOADEST model inputs (i.e., streamflow and water quality data) from USGS server via web access and watershed area, and both modules provide a Google Maps interface. The third module examines inputs to reduce potential errors. Finally, the fourth module provides user-friendly tabular and graphical interfaces from LOADEST outputs. These modules facilitate the use of LOADEST by providing a user-friendly interface. In addition, the tool does not require installation on users’ computers since it runs on the web server. In this study, the module to examine input data was demonstrated, and the web-based tool was applied to two watersheds for the required sediment reduction to meet water quality target.
Currently, the web-based tool provides streamflow and water quality data retrievals from USGS; however, the National Water Quality Monitoring Council [23] provides use of water quality data from the U.S. Environmental Protection Agency Storage and Retrieval (EPA STORET). Therefore, the web-based tool will be upgraded to provide water quality data from EPA STORET.

Acknowledgement

This subject is supported by the Korea Environmental Industry & Technology Institute as “Development of Topsoil Erosion Model for Korea” (2014000540004).

Author Contributions

Youn Shik Park developed the web-programming and initiated the manuscript writing. Bernie Engel contributed in configuring easy-to-use program flow. Jane Frankenberger initiated developing the web tool. Hasun Hwang configured and built scenarios in practices.

Conflicts of Interest

The authors declare no conflict of interest.

References

  1. Park, Y.S. Development and Enhancement of Web-Based Tools to Develop Total Maximum Daily Load. Ph. D. Thesis, Purdue University, West Lafayette, IN, USA, 18 May 2014. [Google Scholar]
  2. Babbar-Sebens, M.; Karthikeyan, R. Consideration of sample size for estimating contaminant load reductions using load duration curves. J. Hydrol. 2009, 372, 118–123. [Google Scholar] [CrossRef]
  3. Henjum, M.B.; Hozalski, R.M.; Wennen, C.R.; Novak, P.J.; Arnold, W.A. A comparison of total maximum daily load (TMDL) calculations in urban streams using near real-time and periodic sampling data. J. Environ. Monitor. 2010, 12, 234–241. [Google Scholar] [CrossRef] [PubMed]
  4. Park, Y.S.; Engel, B.A.; Harbor, J. A web-based model to estimate the impact of best management practices. Water 2014, 6, 455–471. [Google Scholar] [CrossRef]
  5. Cohn, T.A.; Caulder, D.L.; Gilroy, E.J.; Zynjuk, L.D.; Summers, R.M. The validity of a simple statistical model for estimating fluvial constituent loads: An empirical study involving nutrient loads entering Chesapeake Bay. Water Resour. Res. 1992, 28, 2353–2463. [Google Scholar] [CrossRef]
  6. Gilroy, E.J.; Hirsch, R.M.; Cohn, T.A. Mean square error of regression-based constituent transport estimates. Water Resour. Res. 1990, 26, 2069–2077. [Google Scholar] [CrossRef]
  7. Johnson, A.H. Estimating solute transport in streams from grab samples. Water Resour. Res. 1979, 15, 1224–1228. [Google Scholar] [CrossRef]
  8. Horowitz, A.J. An evaluation of sediment rating curves for estimating suspended sediment concentrations for subsequent flux calculations. Hydrol. Proc. 2003, 17, 3387–3409. [Google Scholar] [CrossRef]
  9. Robertson, D.M.; Roerish, E.E. Influence of various water quality sampling strategies on load estimates for small streams. Water Resour. Res. 1999, 35, 3747–3759. [Google Scholar] [CrossRef]
  10. Robertson, D.M. Influence of different temporal sampling strategies on estimating total phosphorus and suspended sediment concentration and transport in small streams. J. Am. Water Resour. Assoc. 2003, 39, 1281–1308. [Google Scholar] [CrossRef]
  11. Toor, G.S.; Harmel, R.D.; Haggard, B.E.; Schmidt, G. Evaluation of regression methodology with low-frequency water quality sampling to estimate constituent loads for ephemeral watersheds in Texas. J. Environ. Qual. 2008, 37, 1847–1854. [Google Scholar] [CrossRef] [PubMed]
  12. Runkel, R.L.; Crawford, C.G.; Cohn, T.A. Load Estimator (LOADEST): A Fortran Program for Estimating Constituent Loads in Streams and Rivers; U.S. Geological Survey Techniques and Methods: Reston, VA, USA, 2004.
  13. Duan, S.; Kaushal, S.S.; Groffman, P.M.; Band, L.E.; Belt, K.T. Phosphorus export across an urban to rural gradient in the Chesapeake Bay watershed. J. Geophys. Res. 2012, 117. [Google Scholar] [CrossRef]
  14. Brigham, M.E.; Wentz, D.A.; Aiken, G.R.; Krabbenhoft, D.P. Mercury cycling in stream ecosystems. Water column chemistry and transport. Environ. Sci. Technol. 2009, 43, 2720–2725. [Google Scholar] [CrossRef] [PubMed]
  15. Dornblaser, M.M.; Striegl, R.G. Suspended sediment and carbonate transport in the Yukon River basin, Alska: Flouxes and potential future responses to climate change. Water Resour. Res. 2009, 45. [Google Scholar] [CrossRef]
  16. Oh, J.; Sankarasubramanian, A. Interannual hydroclimatic variability and its influence on winter nutrients variability over the southeast United States. Hydrol. Earth Syst. Sci. Discuss. 2011, 8, 10935–10971. [Google Scholar] [CrossRef]
  17. Park, Y.S.; Engel, B.A. Use of pollutant load regression models with various sampling frequencies for annual load estimation. Water 2014, 6, 1685–1697. [Google Scholar] [CrossRef]
  18. Purdue University. Web-based Load Calculation using LOADEST. Available online: https://engineering.purdue.edu/~ldc/LOADEST (accessed on 19 July 2015).
  19. Purdue University. Long-Term Hydrologic Impact Analysis. Available online: https://engineering.purdue.edu/mapserve/LTHIA7/index.html (accessed on 10 January 2013).
  20. U. S. Geological Survey. USGS Water-Quality Data for the Nation. Available online: http://waterdata.usgs.gov/nwis/qw (accessed on 19 July 2015).
  21. Michigan State University. Sieches on the Great Lakes. Available online: http://geo.msu.edu/extra/geogmich/seiches.htm (accessed on 6 September 2015).
  22. Indiana Department of Environmental Management (IDEM). Water quality targets. Available online: http://www.in.gov/idem/nps/3484.htm (accessed on 1 August 2014).
  23. National Water Quality Monitoring Council. Water Quality Portal. Available online: http://www.waterqualitydata.us/ (accessed on 1 August 2013).

