
Impacts of the 2013 Extreme Flood in Northeast China on Regional Groundwater Depth and Quality


Abstract
:
1. Introduction
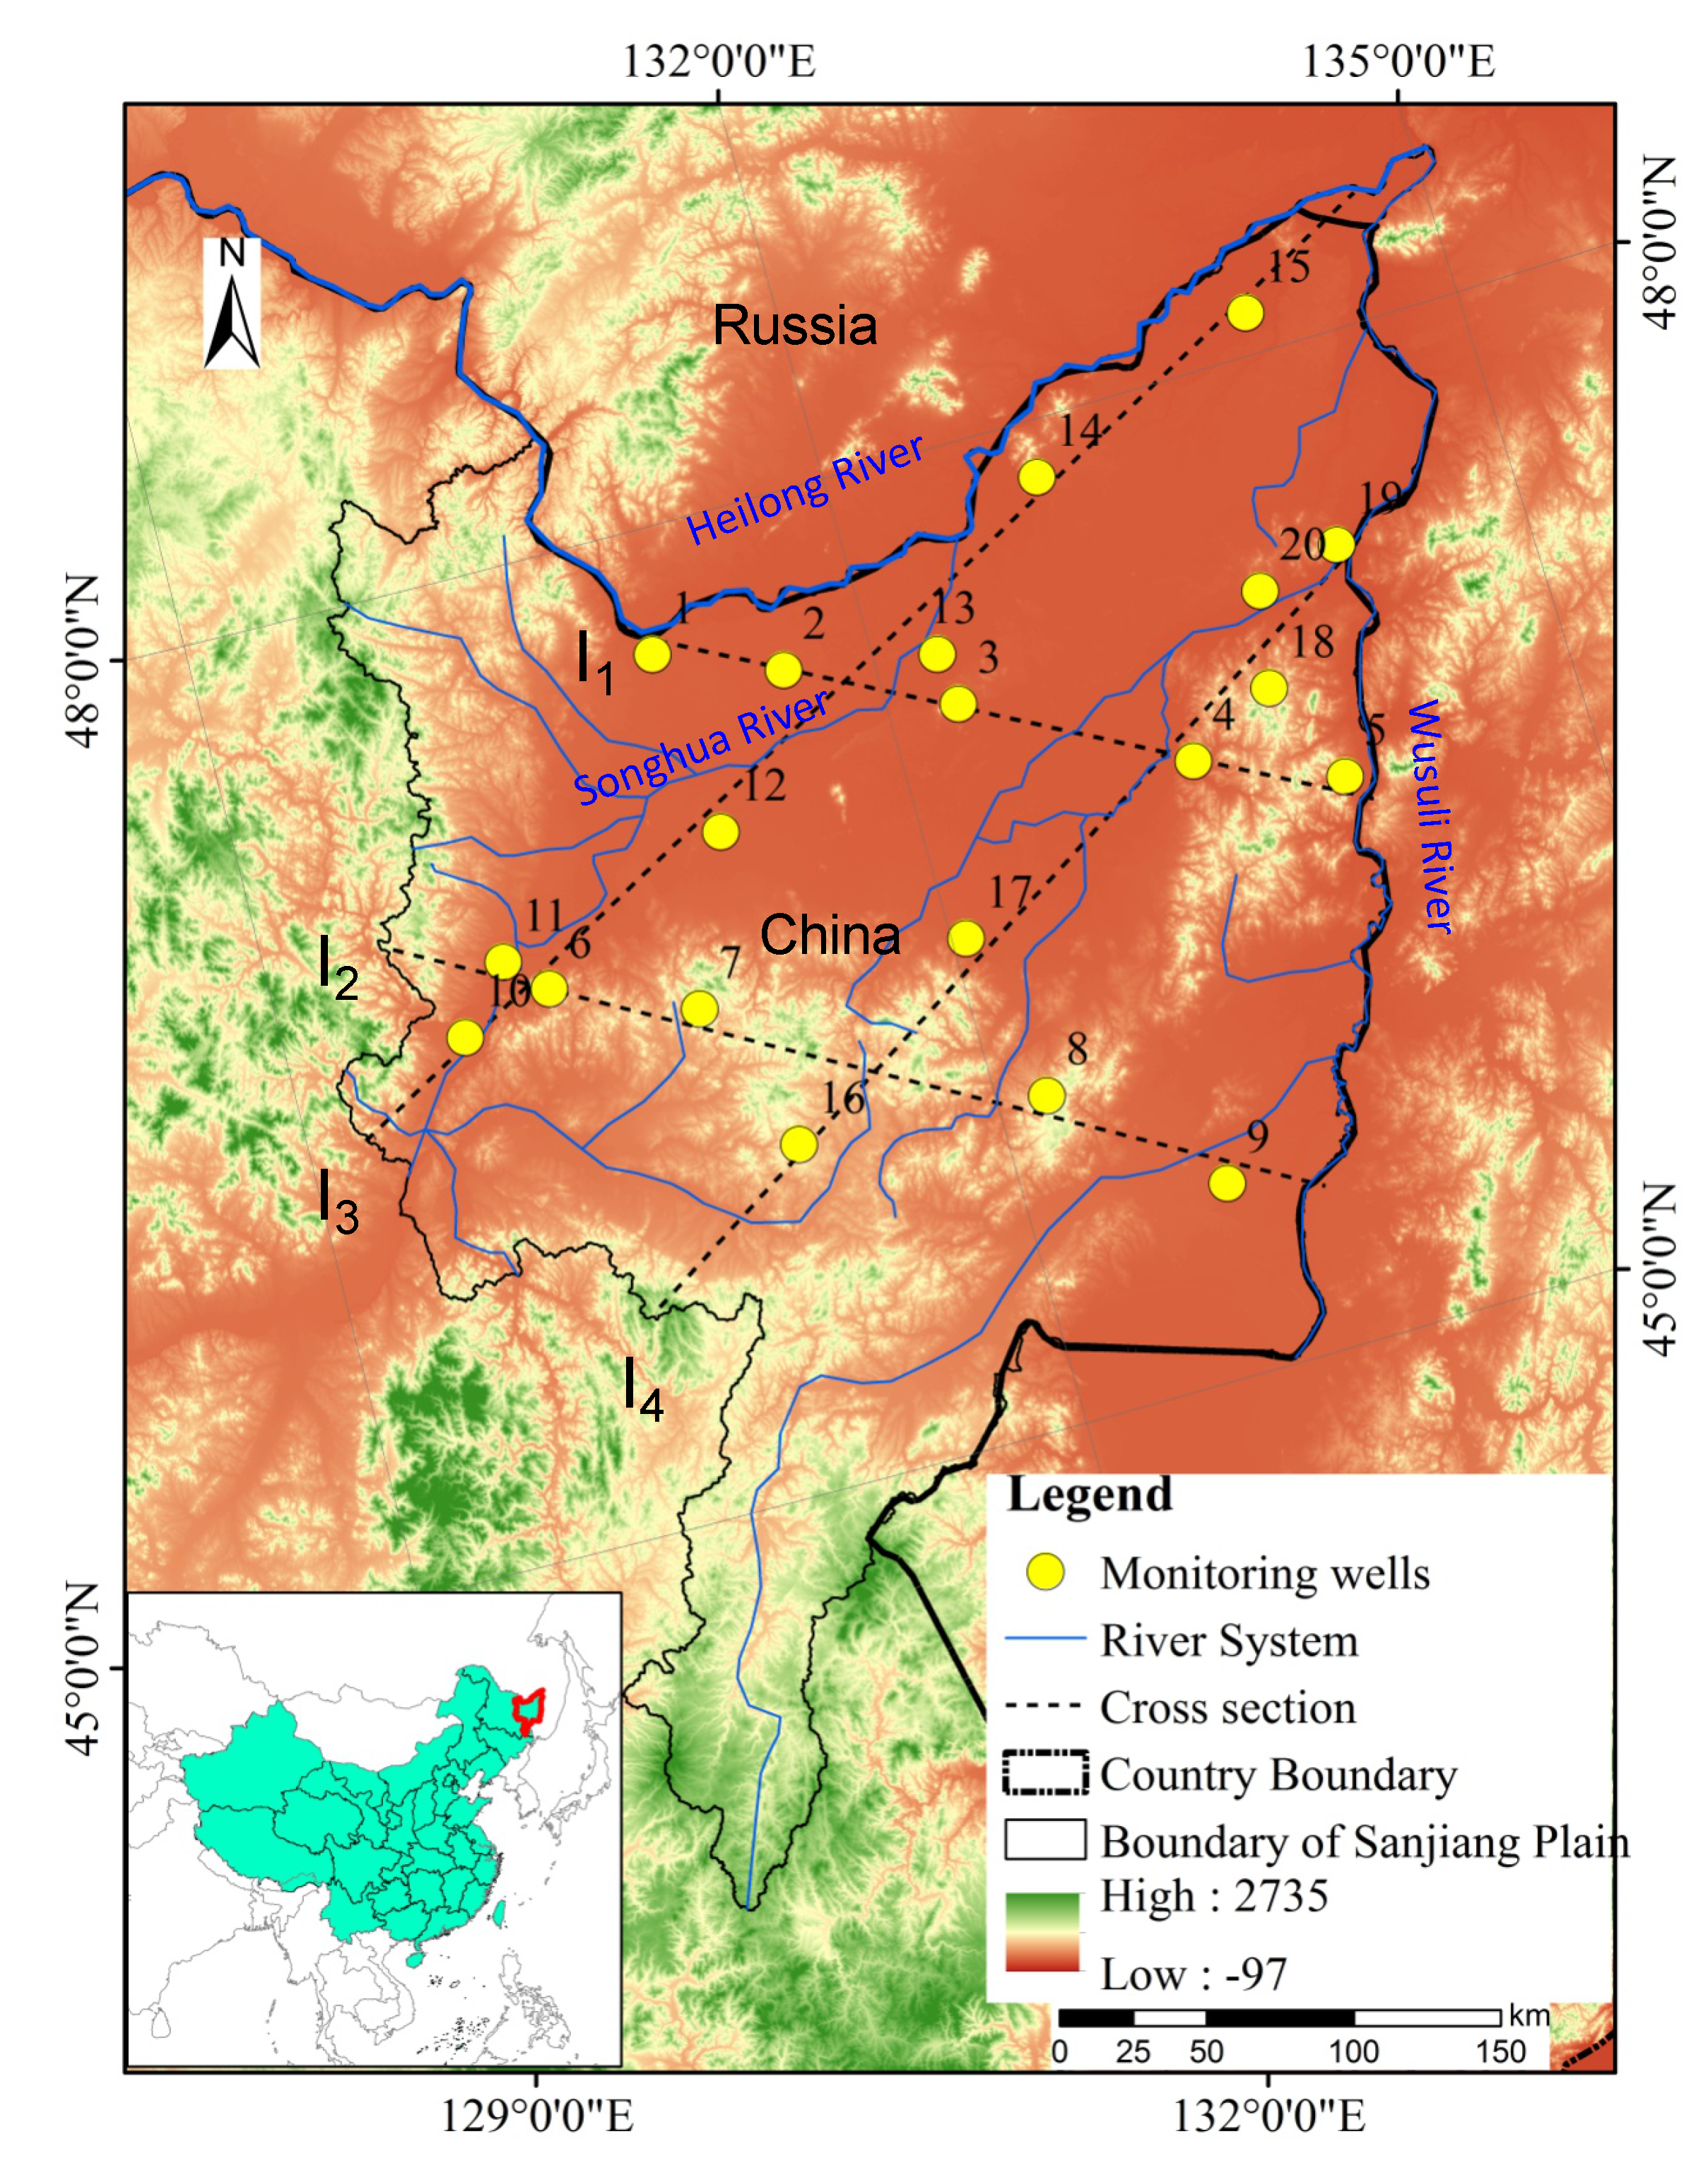
2. Study Area
3. Methodology
3.1. Field Water Depth Records and Chemical Analysis
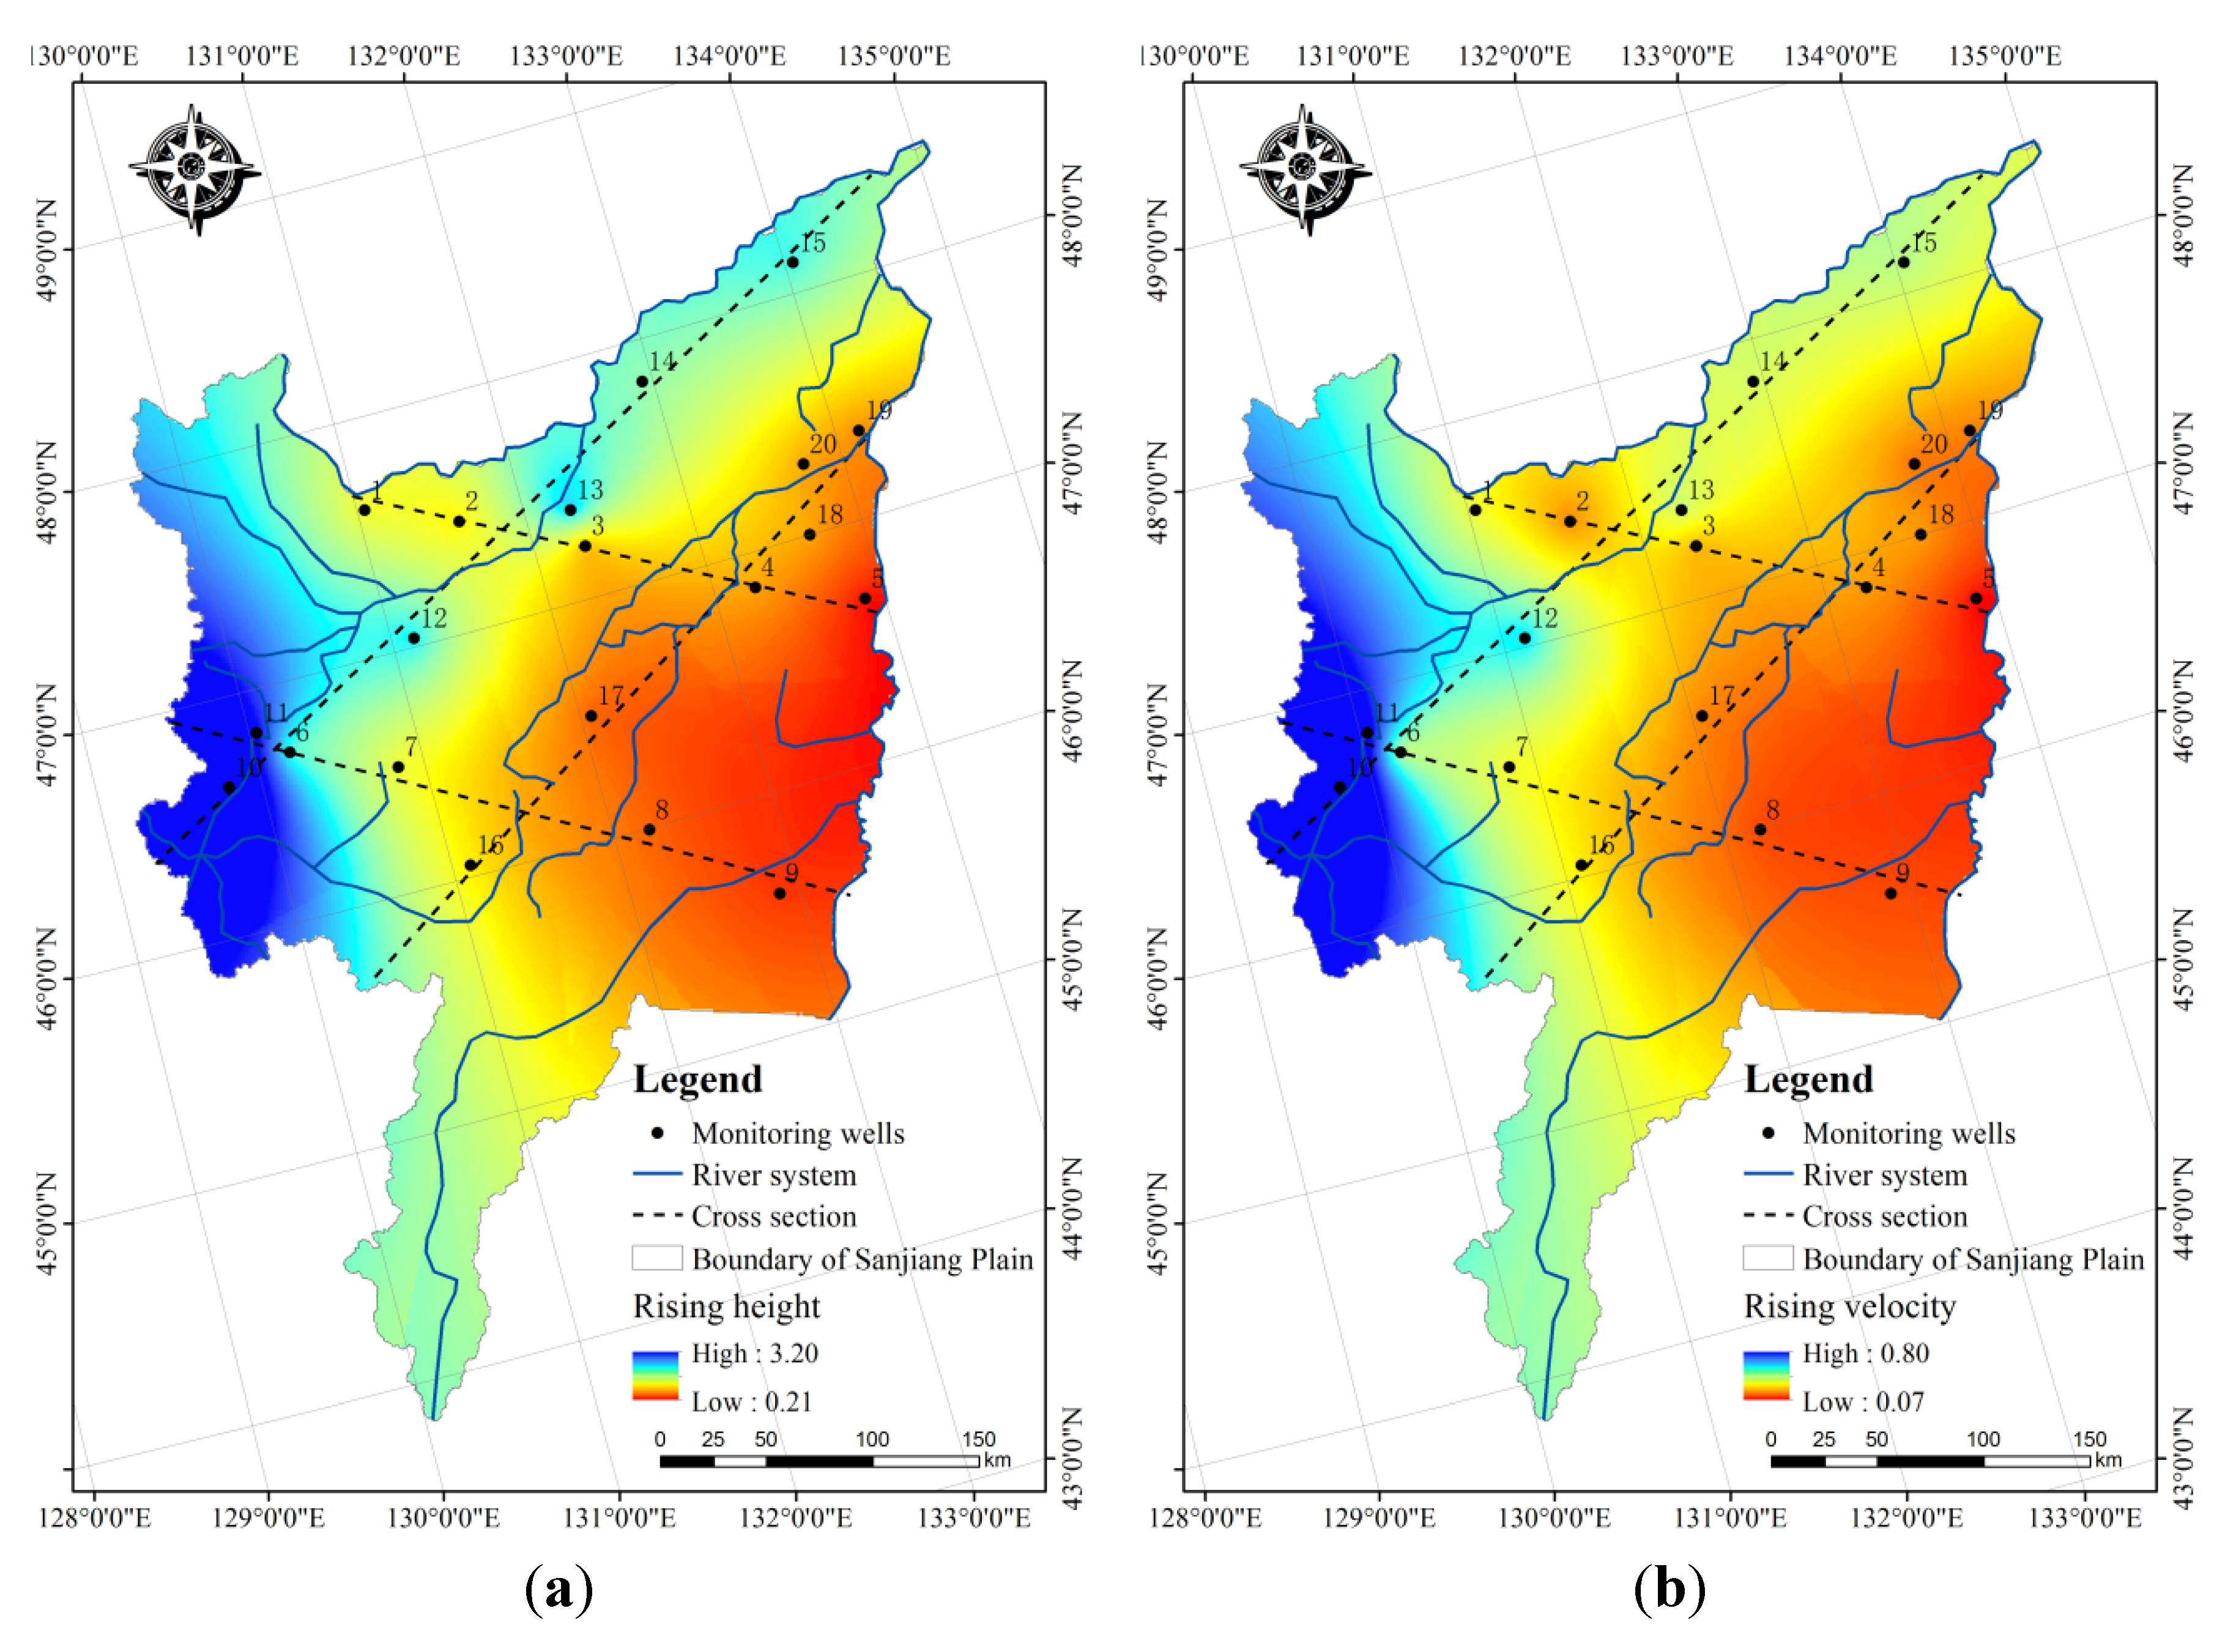
3.2. Estimation of Recharge Height and Flow to Shallow Groundwater from the 2013 Flood
3.3. Estimation of Shallow Groundwater Rising Velocity from the 2013 Flood
4. Results
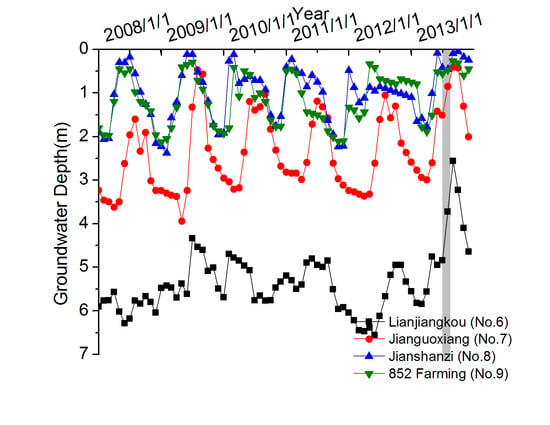
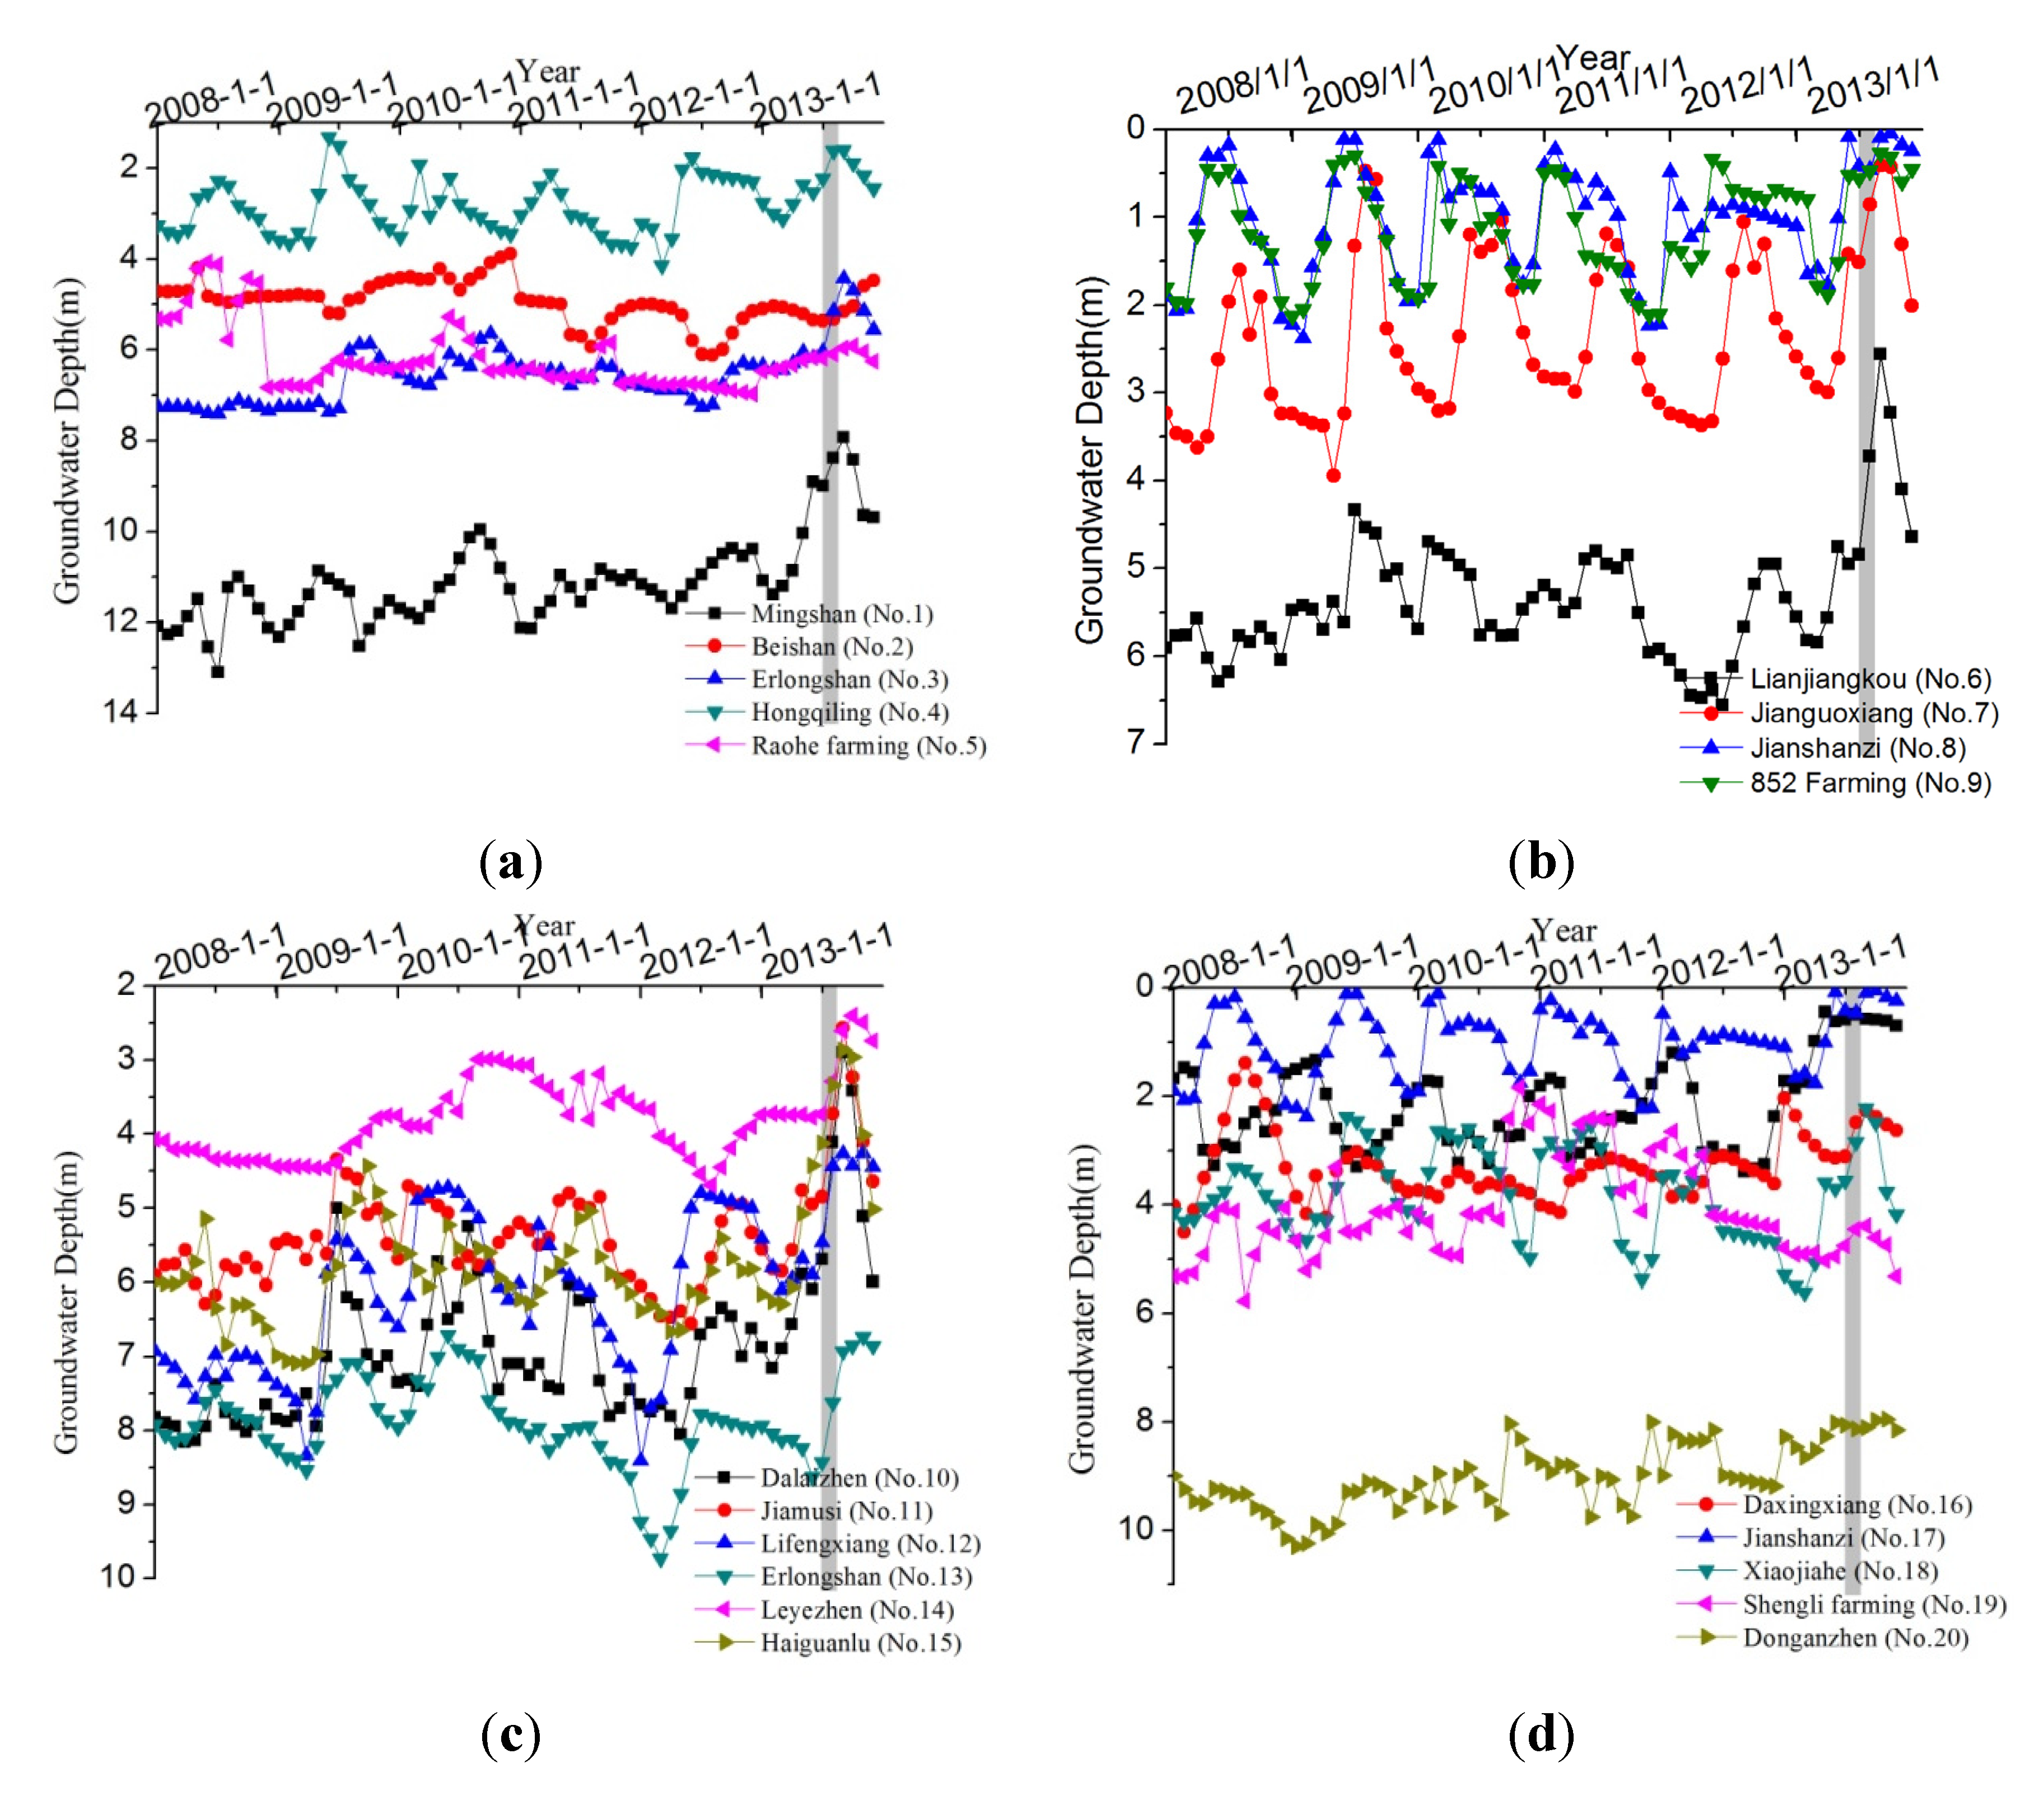
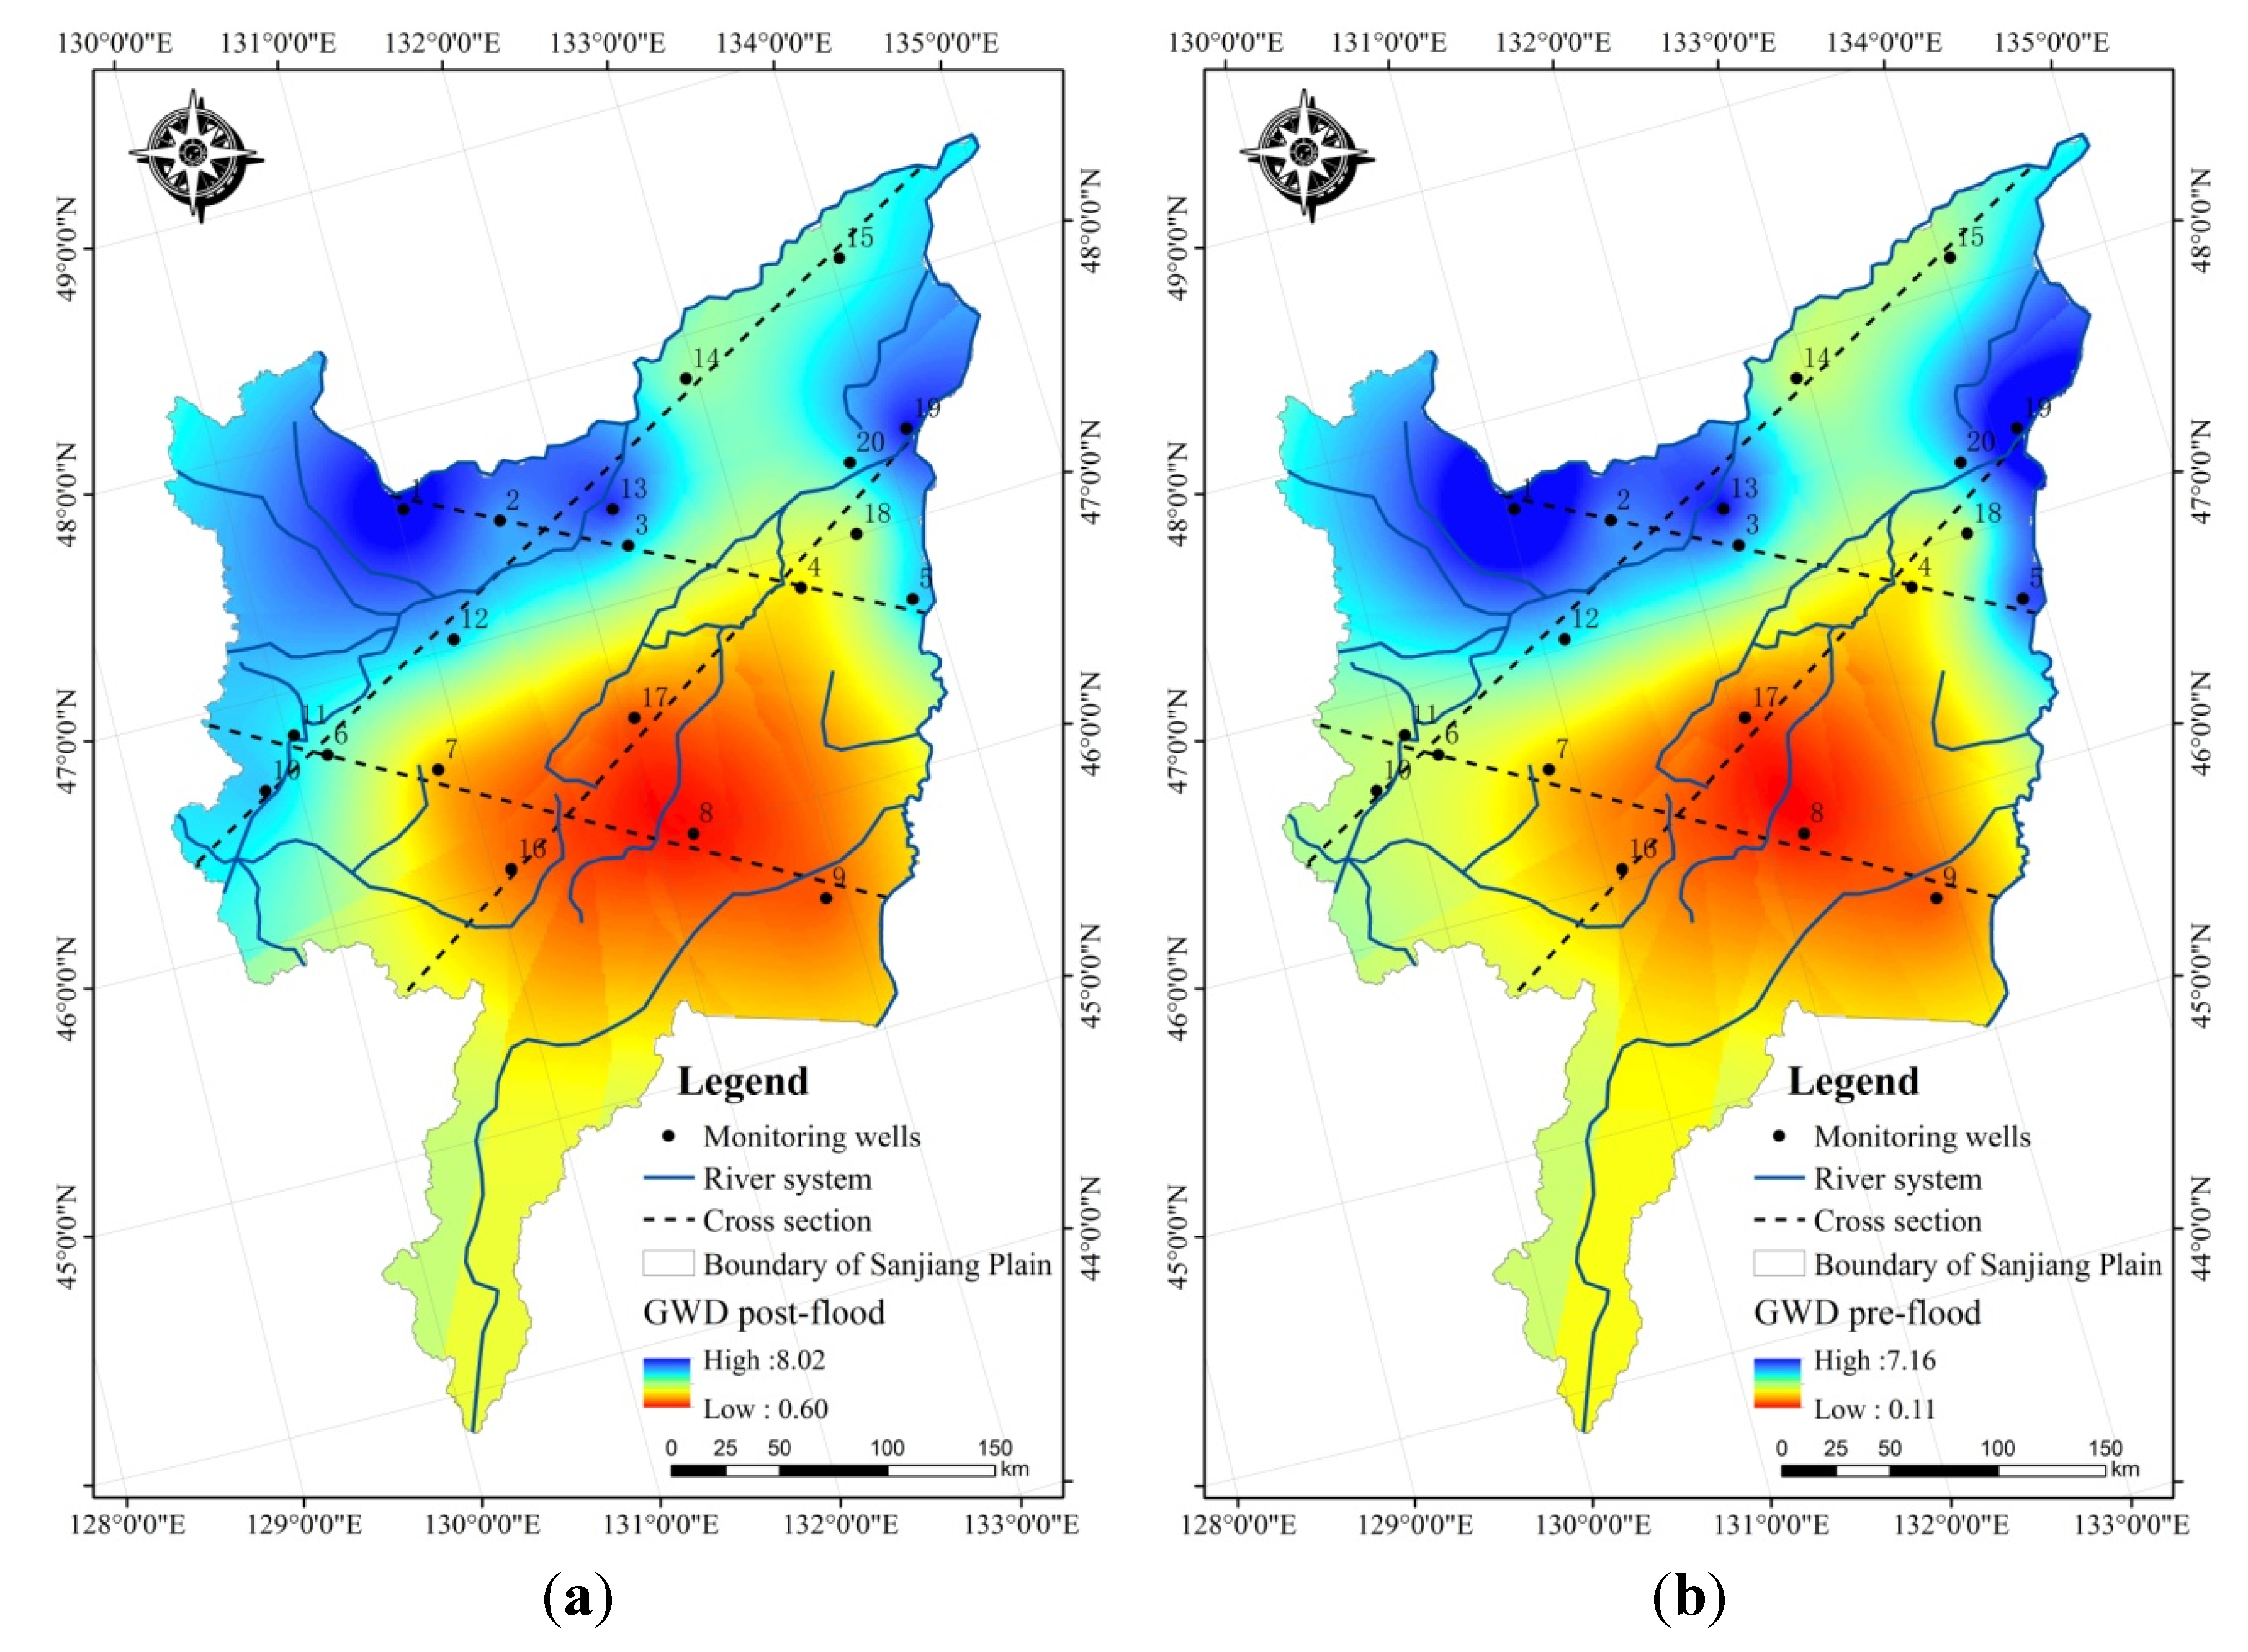
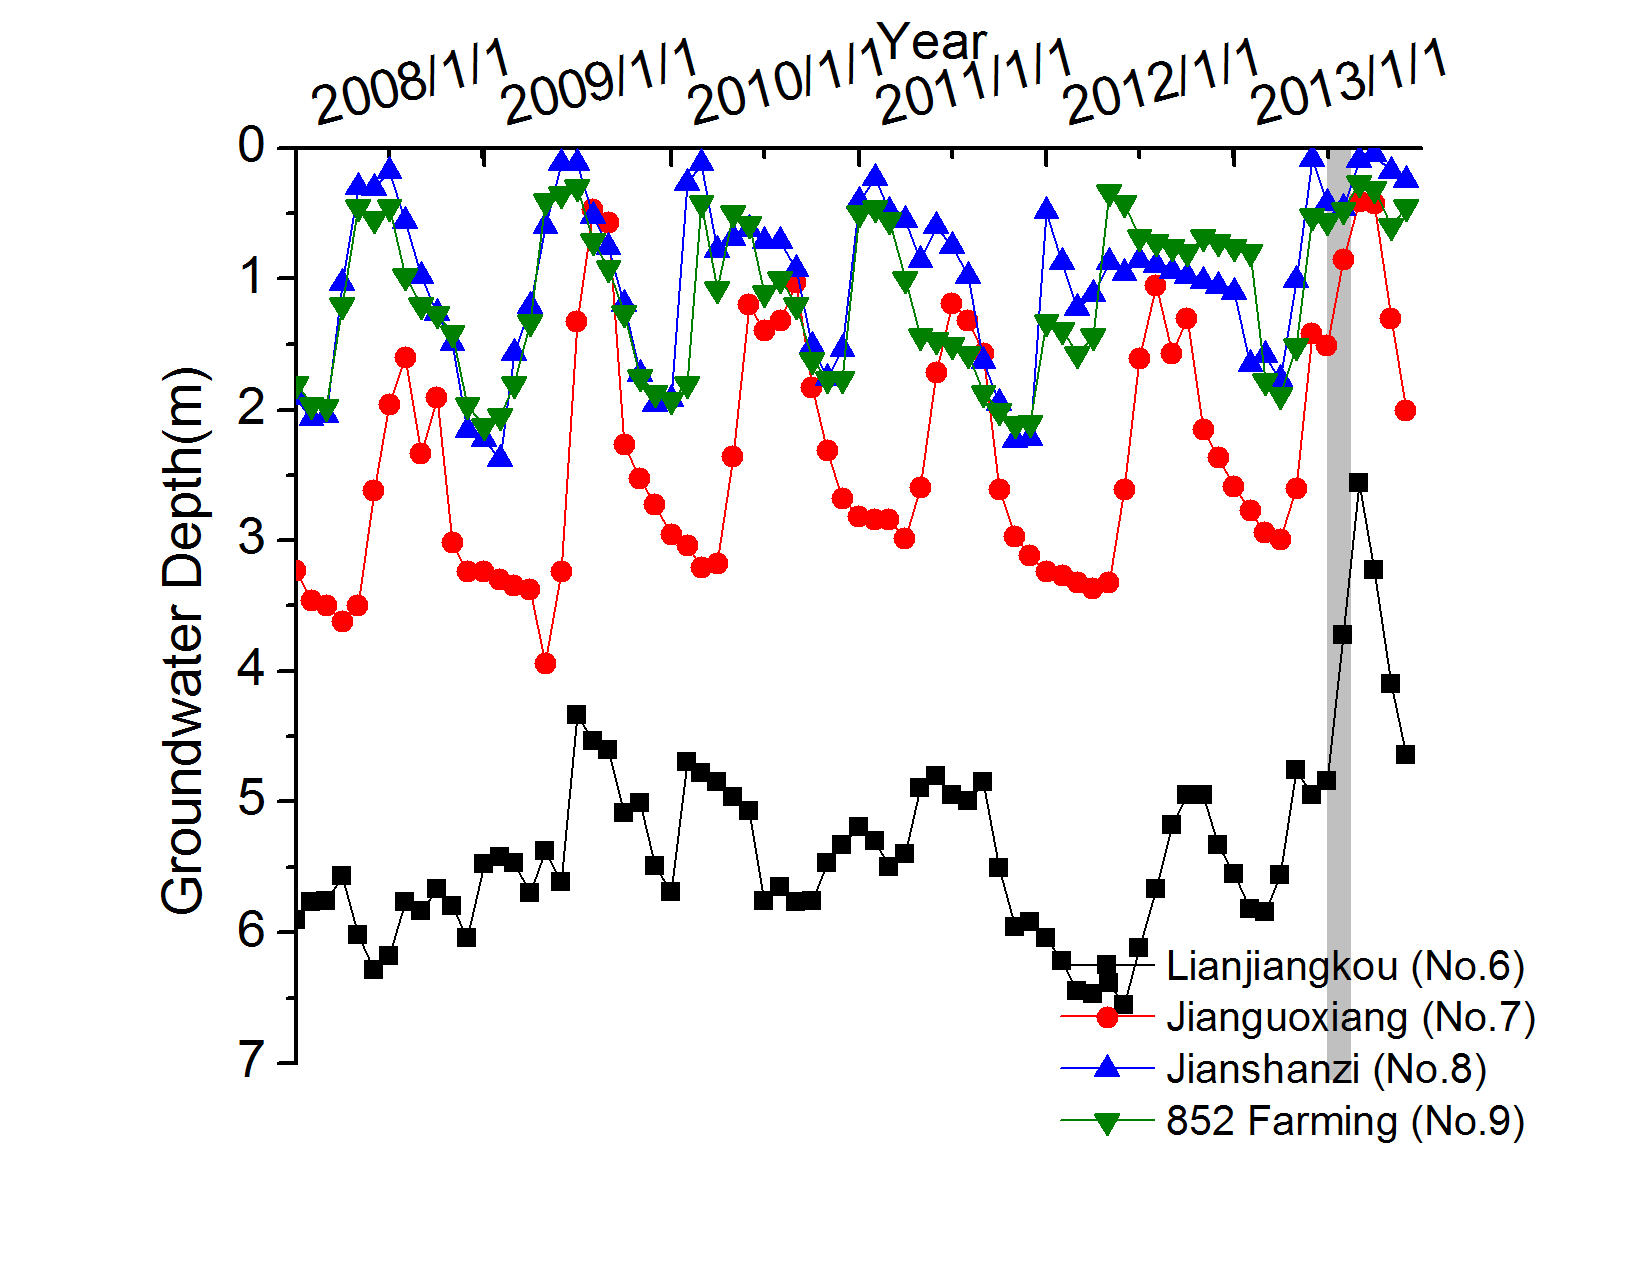
4.1. Water Depth Change Following the 2013 Summer Flood

| I1 | Mingshan (No. 1) | Beishan (No. 2) | Erlongshan (No. 3) | Hongqiling (No. 4) | Farm Raohe (No. 5) | |
|---|---|---|---|---|---|---|
| Deepest/m | 8.91 | 5.36 | 5.14 | 2.23 | 6.18 | |
| Average/m | 7.93 | 4.47 | 4.43 | 1.6 | 5.96 | |
| Δh/m | 0.98 | 0.89 | 0.71 | 0.63 | 0.22 | |
| I2 | Lianjiangkou (No. 6) | Jianguoxiang (No. 7) | Jianshanzi (No. 8) | Farm 852 (No. 9) | ||
| Deepest/m | 4.76 | 1.42 | 0.43 | 0.56 | ||
| Average/m | 2.56 | 0.41 | 0.05 | 0.27 | ||
| Δh/m | 1.53 | 1.01 | 0.42 | 0.29 | ||
| I3 | Dalaizhen (No. 10) | Jiamusi (No. 11) | Lifengxiang (No. 12) | Longshan (No. 13) | Leyezhen (No. 14) | Haiguanlu (No. 15) |
| Deepest/m | 6.1 | 4.95 | 5.9 | 8.63 | 3.78 | 4.43 |
| Average/m | 2.89 | 2.57 | 4.27 | 6.74 | 2.4 | 2.87 |
| Δh/m | 3.2 | 2.39 | 1.64 | 1.75 | 1.38 | 1.56 |
| I4 | Daxingxiang (No. 16) | Jianshanzi (No. 17) | Xiaojiahe (No. 18) | Farm Shengli (No. 19) | Donganzhen (No. 20) | |
| Deepest/m | 3.14 | 0.47 | 2.85 | 5.03 | 8.52 | |
| Average/m | 2.27 | 0.05 | 2.22 | 4.39 | 7.95 | |
| Δh/m | 0.87 | 0.42 | 0.63 | 0.64 | 0.57 |

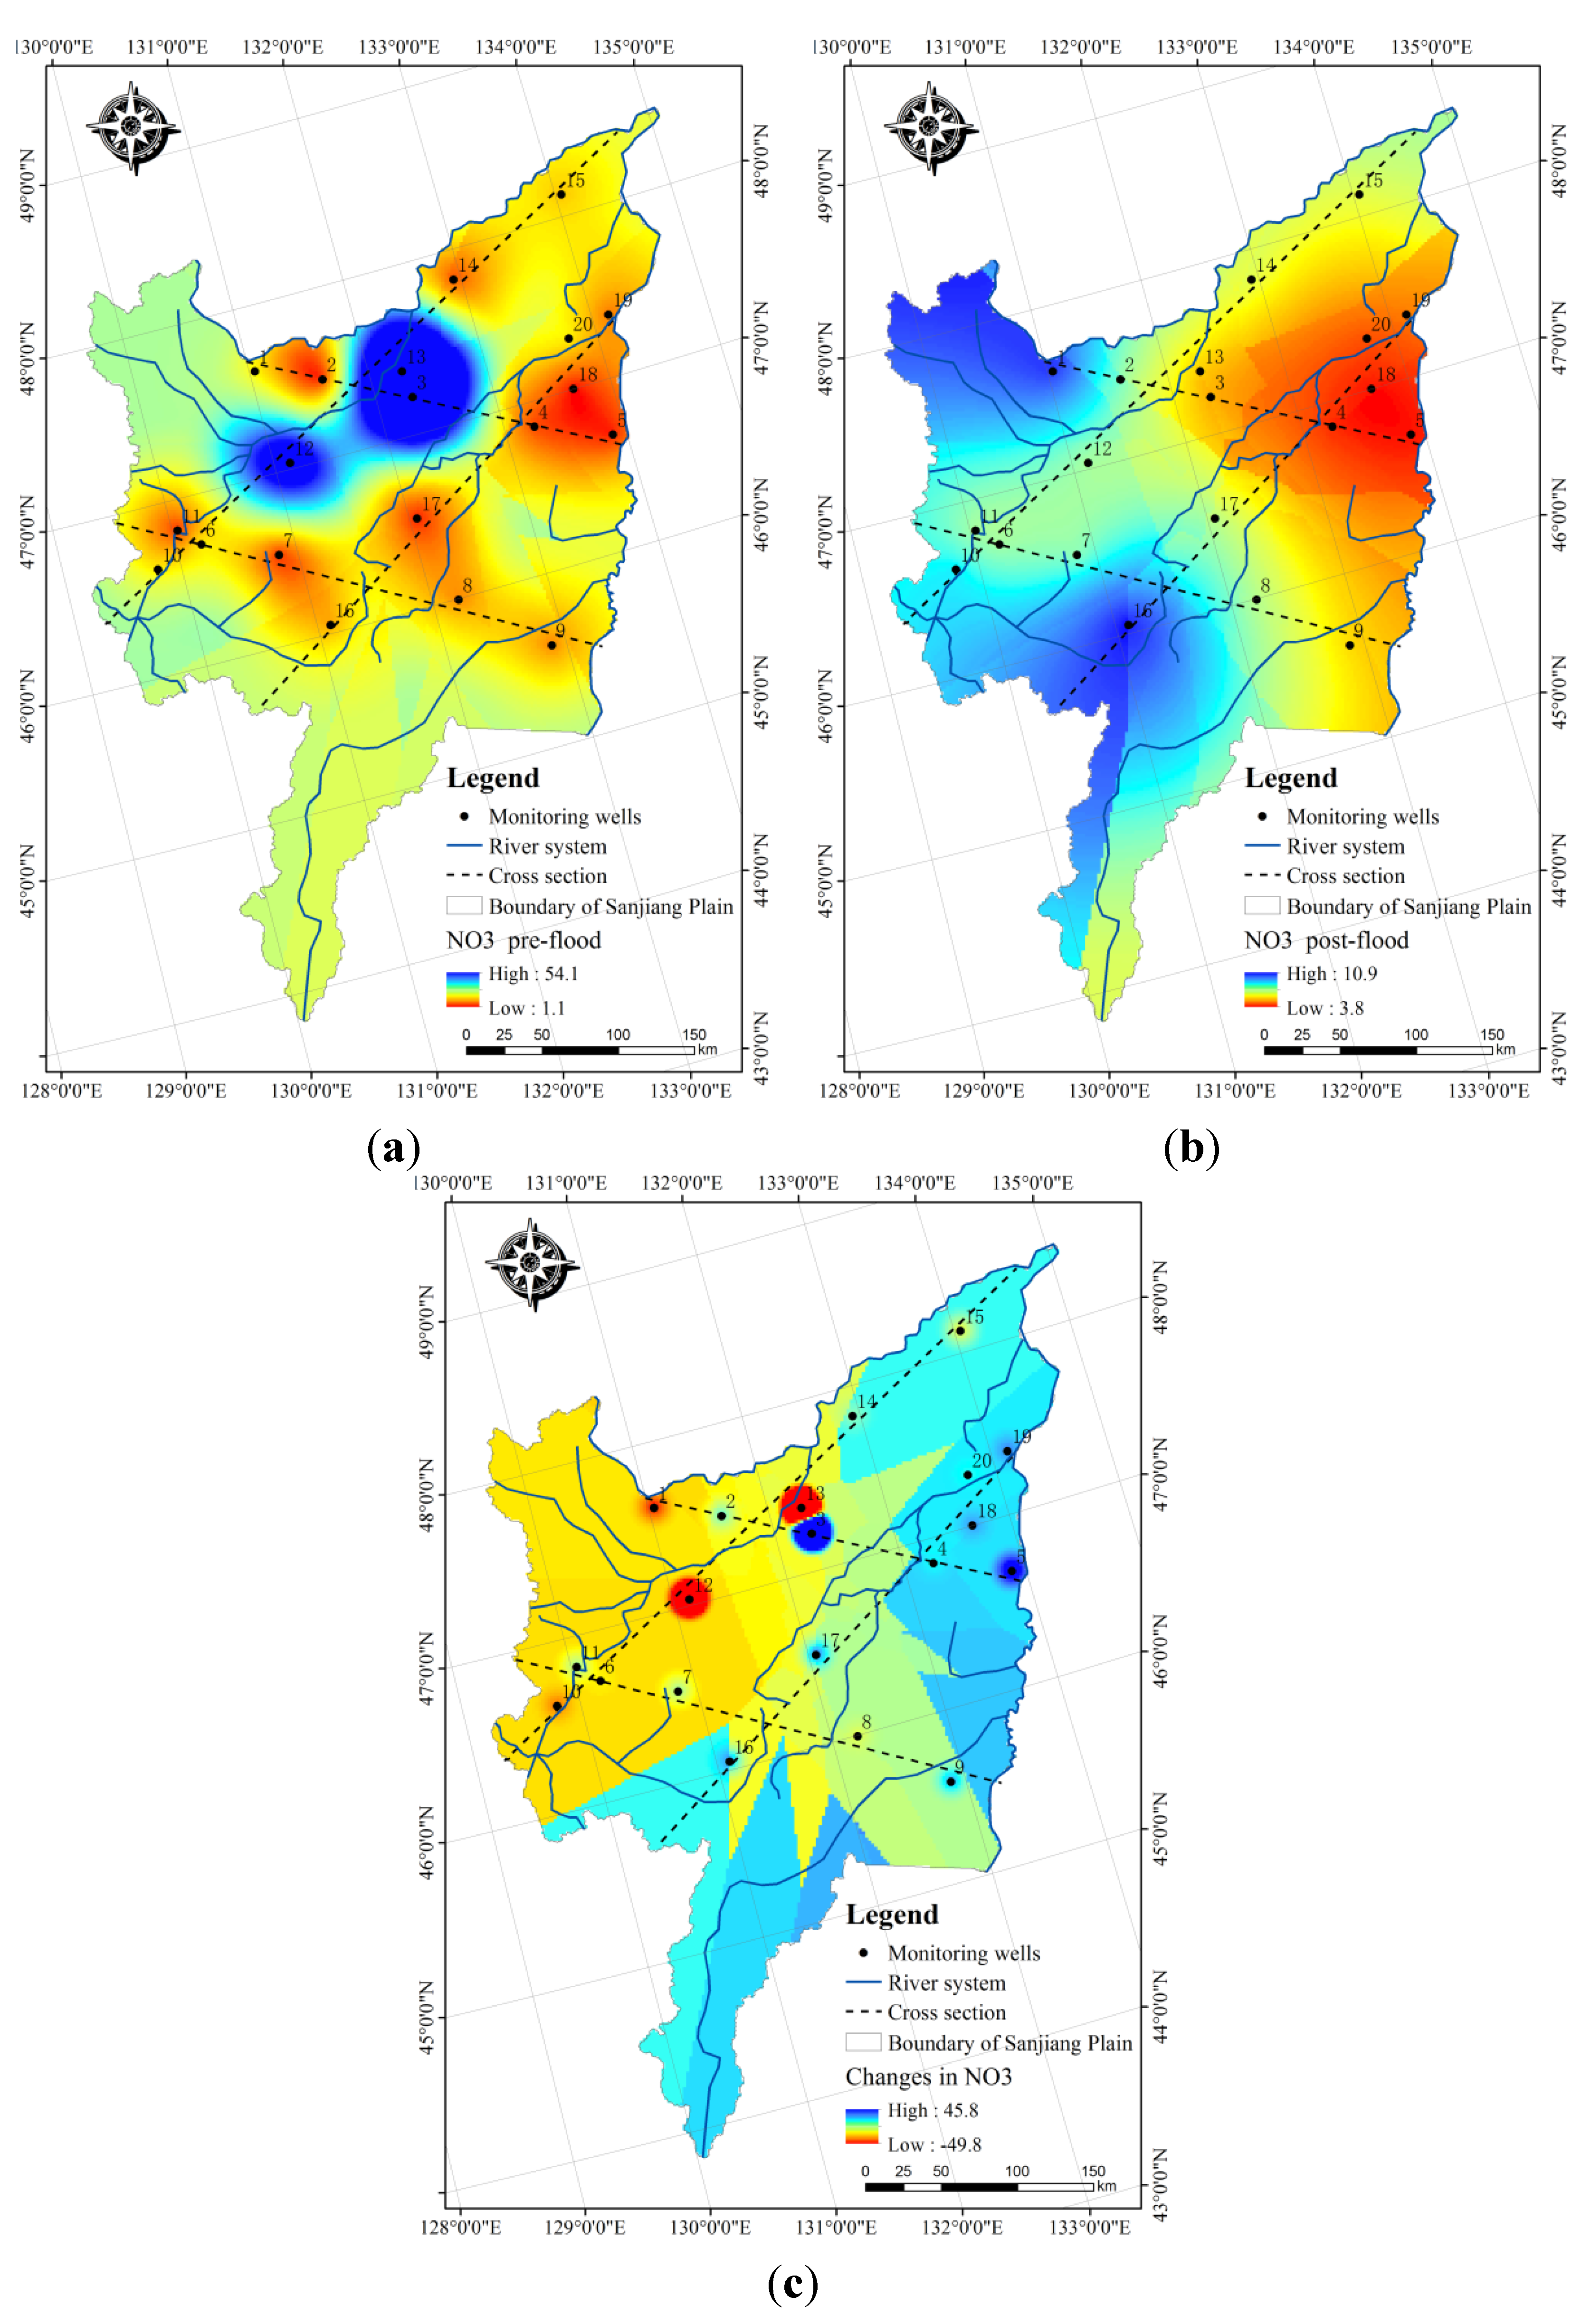
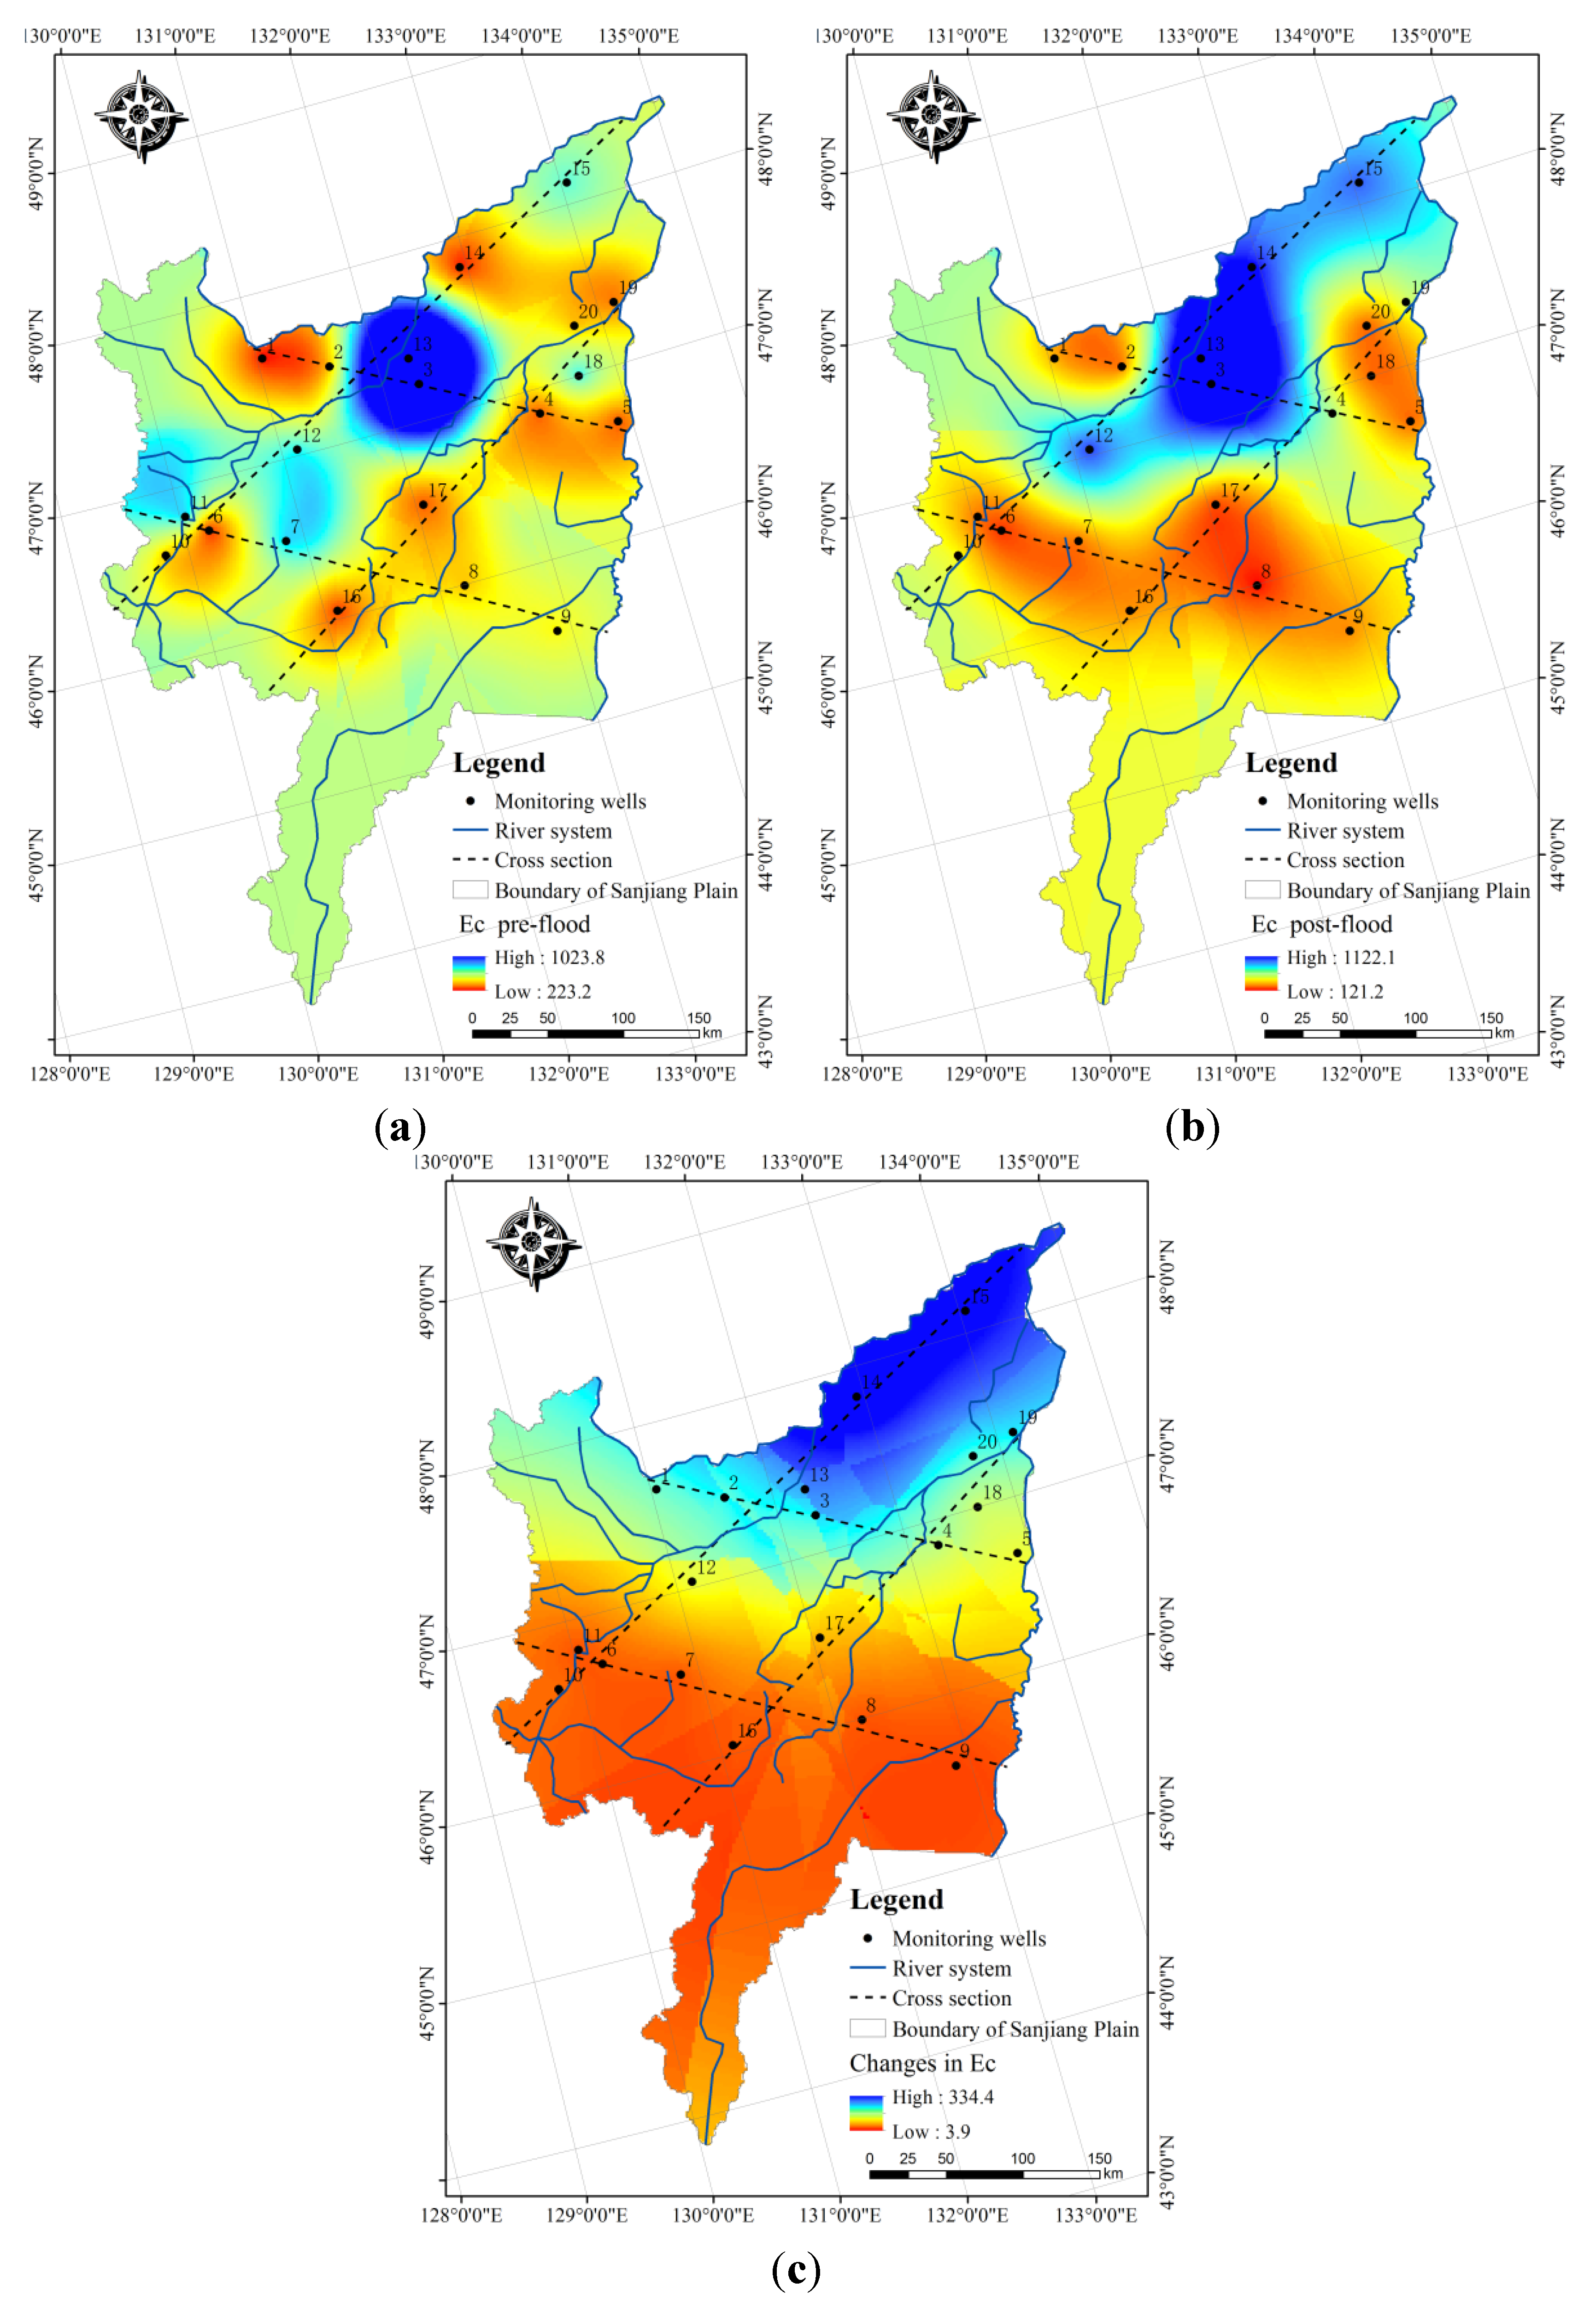
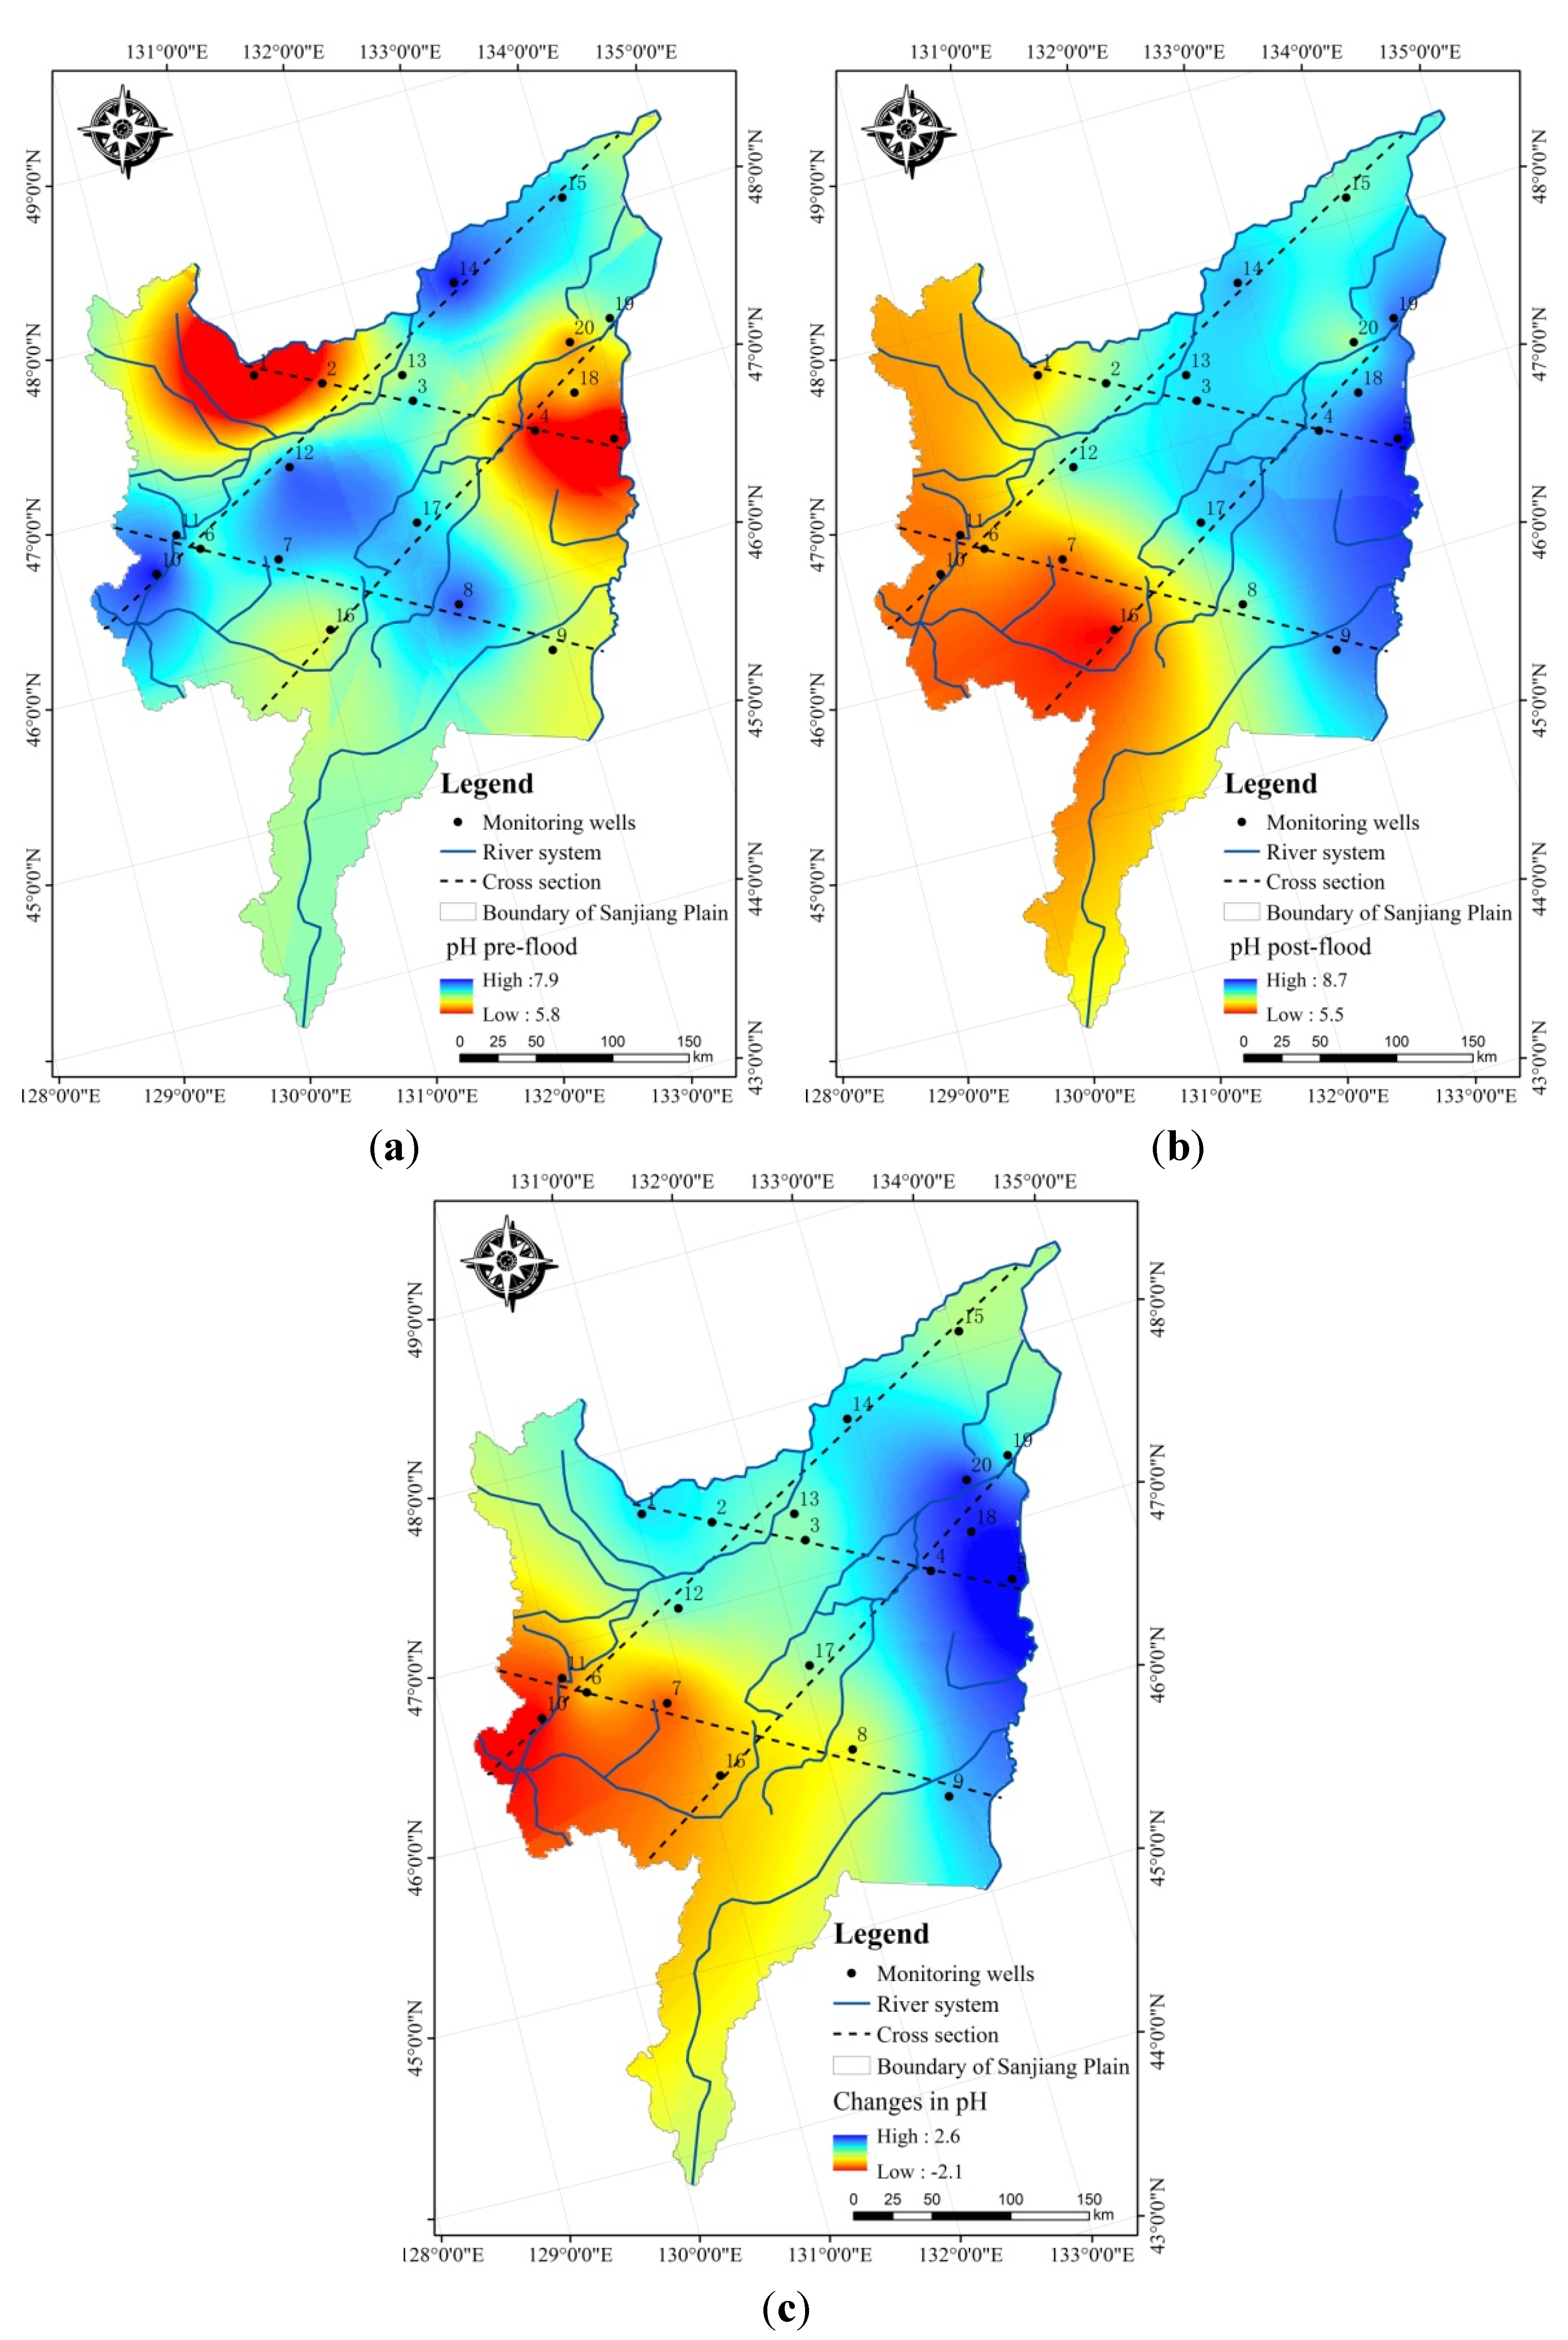
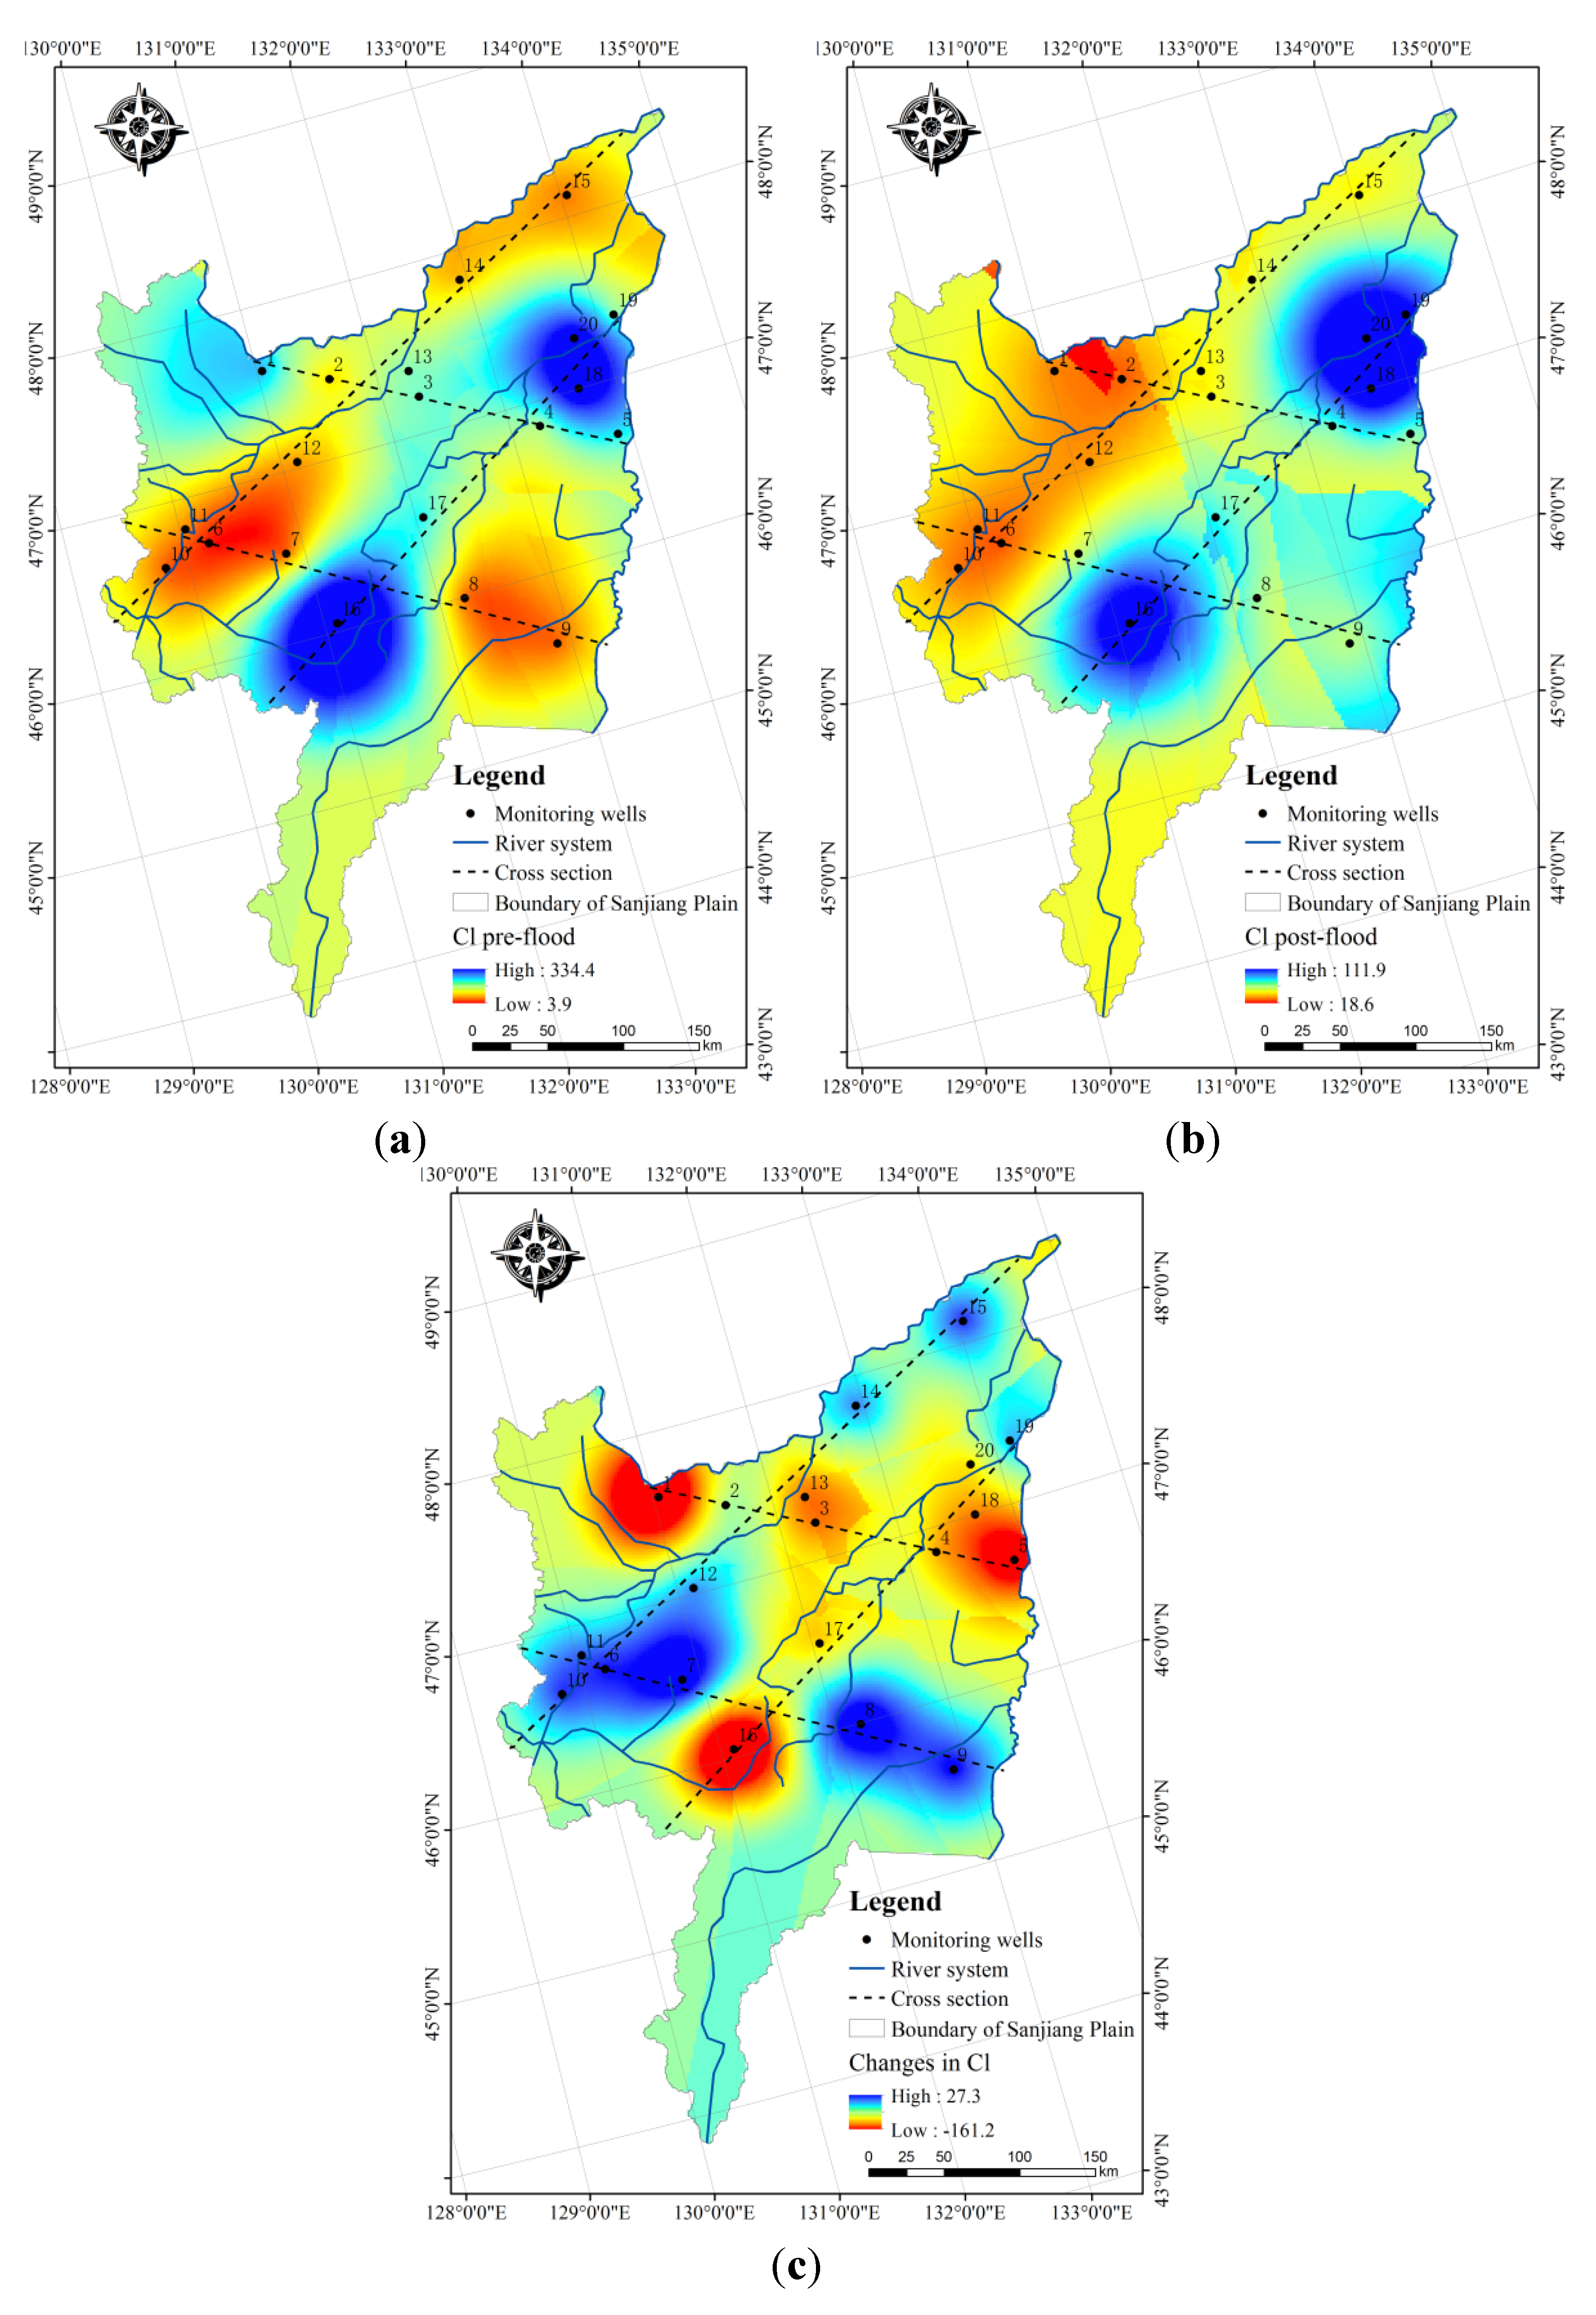
4.2. Changes in Shallow Groundwater Chemistry Following the 2013 Summer Flood
| Well ID | Name | Rising Height (m) | Area (km2) | Area Weighting (100%) | Area × AW |
|---|---|---|---|---|---|
| 1 | Mingshan | 0.98 | 13,218.76 | 12.13 | 0.12 |
| 2 | Beishan | 0.89 | 2384.82 | 2.19 | 0.02 |
| 3 | Erlongshan | 0.71 | 1842.50 | 1.69 | 0.01 |
| 4 | Hongqiling | 0.63 | 2669.14 | 2.45 | 0.02 |
| 5 | Raohe Farm | 0.22 | 2911.46 | 2.67 | 0.01 |
| 6 | Lianjiangkou | 1.53 | 1156.85 | 1.06 | 0.02 |
| 7 | Jianguoxiang | 1.01 | 2054.73 | 1.89 | 0.02 |
| 8 | Jianshanzi | 0.42 | 3870.55 | 35.51 | 0.15 |
| 9 | 852 Farm | 0.29 | 20,716.39 | 19.01 | 0.06 |
| 10 | Dalaizhen | 3.2 | 9063.66 | 8.32 | 0.27 |
| 11 | Jiamusi | 2.39 | 2965.64 | 2.72 | 0.07 |
| 12 | Lifengxiang | 1.64 | 2365.67 | 2.17 | 0.04 |
| 13 | Longshan | 1.75 | 1464.61 | 1.34 | 0.02 |
| 14 | Leyezhen | 1.38 | 7785.64 | 7.14 | 0.10 |
| 15 | Haiguanlu | 1.56 | 5873.09 | 5.39 | 0.08 |
| 16 | Daxingxiang | 0.87 | 21,218.71 | 19.47 | 0.17 |
| 17 | Jianshanzi | 0.42 | 2974.27 | 2.73 | 0.01 |
| 18 | Xiaojiahe | 0.63 | 877.50 | 8.05 | 0.05 |
| 19 | Shengli Farm | 0.64 | 1493.22 | 1.37 | 0.01 |
| 20 | Donganzhen | 0.57 | 2092.78 | 1.92 | 0.01 |
| Average recharge height/m | 1.24 | ||||


5. Discussion
5.1. Relevance of the 2013 Summer Flood to Groundwater Resources
5.2. Effect of the 2013 Summer Flood on Water Quality
5.3. Methods
6. Conclusions
Acknowledgments
Author Contributions
Conflicts of Interest
References
- Ghazavi, R.; Vali, A.B.; Eslamian, S. Impact of flood spreading on infiltration rate and soil properties in an semi-arid wetlands and the consequences of salinity for wetland ecology. Ecohydrology 2010, 1, 43–58. [Google Scholar]
- Belousova, A.P. Risk assessment of underflooding of areas by groundwater during floods. Water Resour. Regime Water Bodies 2011, 38, 30–38. [Google Scholar] [CrossRef]
- Kreibich, H.; Thieken, A. Assessment of damage caused by high groundwater inundation. Water Resour. Res. 2008, 44. [Google Scholar] [CrossRef]
- Becker, B.P.J.; Jansen, M.; Sinaba, B.P.; Schüttrumpf, H. On the Modeling of Bank Storage in a Groundwater Model: The April, 1983, Flood Event in the Neuwieder Becken (Middle Rhine). Water 2015, 7, 1173–1201. [Google Scholar] [CrossRef] [Green Version]
- May, R.; Kenji, J.; Atsushi, T. Influence of flooding on groundwater flow in central Cambodia. Environ. Earth Sci. 2011, 63, 151–161. [Google Scholar] [CrossRef]
- Simpson, S.C.; Thomas, M.; James, F.H. The role of flood size and duration on stream flow and riparian groundwater composition in a semi-arid basin. J. Hydrol. 2013, 488, 126–135. [Google Scholar] [CrossRef]
- Cobby, D.; Morris, S.; Parkes, A.; Robinson, V. Groundwater flood risk management: Advances towards meeting the requirements of the EU floods directive. J. Flood Risk Manag. 2009, 2, 111–119. [Google Scholar] [CrossRef]
- Xu, H.S.; Zhao, T.Q.; Meng, H.Q.; Xu, Z.X.; Ma, C.Y. Relationship between groundwater quality index of physics and chemistry in riparian zone and water quality in river. Environ. Sci. 2011, 32, 632–640. [Google Scholar]
- Isaac, R.S.; de Jason, W.; Douglas, R.T.; Bradley, D.E. The contribution of groundwater discharge to nutrient experts from a coastal catchment: Post-flood seepage increases estuarine N/P ratios. Estuar. Coasts 2013, 36, 56–73. [Google Scholar]
- Wang, E.L.; Yan, X.X. An experimental study on frost-heave characteristics of albic soils. Chin. J. Geot. Eng. 2004, 26, 851–853. [Google Scholar]
- Dong, L.; Qiang, F.; Ma, Y.S.; Sun, A.H. Annual precipitation series wavelet analysis of well-irrigation area in Sanjiang Plain. Comput. Comput. Technol. Agric. II 2009, 1, 563–572. [Google Scholar]
- Yang, X.; Yang, W.; Zhang, F.; Chu, Y.; Wang, Y. Investigation and Assessment of Groundwater Resources Potential and Eco-Environment Geology in Sanjiang Plain. China Geology Survey; Geological Publishing House: Beijing, China, 2010. [Google Scholar]
- Wang, X.; Zhang, G.; Xu, Y.J. Spatiotemporal groundwater recharge estimation for the largest rice production region in Sanjiang Plain, northeast China. J. Water Supply 2014, 63, 630–641. [Google Scholar] [CrossRef]
- Zhao, Q.; Han, Y.M. Analysis of stimulated recharge of groundwater on the Jiansanjiang Farming Bureau, Sanjiang Plain. J. Heilongjiang Hydraul. Eng. Coll. 2008, 3, 1–4. [Google Scholar]
- Pan, X.F.; Yan, B.X. Effects of land use and changes in cover on the transformation and transportation of iron: A case study of the Sanjiang Plain, Northeast China. Sci. China Earth Sci. 2011, 54, 686–693. [Google Scholar] [CrossRef]
- Wang, X.; Yan, B.X. The spatial variation and factors controlling the concentration of total dissolved iron in rivers, Sanjiang Plain. Clean Soil Air Water 2012, 40, 712–717. [Google Scholar] [CrossRef]
- Cao, Y.J.; Tang, C.Y.; Song, X.F.; Liu, C.M.; Zhang, Y.H. Characteristics of nitrate in major rivers and aquifers of the Sanjiang Plain, China. J. Environ. Monit. 2012, 14, 2624–2633. [Google Scholar] [CrossRef] [PubMed]
- Song, K.; Liu, D.; Wang, Z.; Zhang, B.; Jin, C.; Li, F.; Liu, H. Land use change in Sanjiang Plain and its driving forces analysis since 1954. J. Geogr. Sci. 2008, 63, 93–104. [Google Scholar]
- Wang, R.; Yin, Z.J.; Zhu, C.Z. Analysis of rainstorms and floods occurred in Heilong and Songhua River basin in 2013. J. China Hydrol. 2014, 34, 67–76. (in Chinese). [Google Scholar]
- Xinhua News Agency. Xi Demands All-Out Efforts to Help Flood Victims. Available online: http://news.xinhuanet.com/english/china/2013-08/19/c_132644459.htm (accessed on 28 December 2014).
- Xinhua News Agency. Worst Flood in Decade Causes Havoc in NE China. Available online: http://news.xinhuanet.com/english/china/2013-08/20/c_132647709.htm (accessed on 28 December 2014).
- Li, F.P.; Zhang, G.X.; Xu, Y.J. Spatiotemporal variability of climate and streamflow in the Songhua River Basin, northeast China. J. Hydrol. 2014, 514, 53–64. [Google Scholar] [CrossRef]
- Li, Y.F. Study on the eco-environmental changes in Sanjiang Plain during recent years. Environ. Sci. Manag. 2013, 38, 42–46. [Google Scholar]
- Wang, X.H.; Zhang, G.X.; Xu, Y.J.; Sun, G.Z. Assessing the regional-scale groundwater-surface water interaction on the Sanjiang Plain, Northeast China. Environ. Sci. Pollut. Res. 2015. [Google Scholar] [CrossRef]
- Pinder, G.; Sauer, S. Numerical simulation of flood wave modification due to bank storage effects. Water Resour. Res. 1971, 7, 63–70. [Google Scholar] [CrossRef]
- Thiessen, A.H. Precipitation averages for large areas. Mon. Weather Rev. 1911, 39, 1082–1089. [Google Scholar] [CrossRef]
- Xing, F.M.; Sun, B.Y. Situation analysis about groundwater overdraft in Songnen plain of Jilin Province. Jilin Geol. 2014, 33, 85–89. [Google Scholar]
- Doble, R.C.; Crosbie, R.S.; Smerdon, B.D. Aquifer recharge from overbank floods, in conceptual and modeling studies of integrated groundwater, surface water and ecological systems: Proceedings of symposium H01 held during the IUGG GA in Melbourne. IAHS Publ. 2011, 345, 169–174. [Google Scholar]
- Doble, R.C.; Crosbie, R.S.; Smerdon, B.D.; Peeters, L.; Cook, F. Groundwater recharge from overbank floods. Water Resour. Res. 2012, 48, W09522. [Google Scholar] [CrossRef]
- McCallum, J.L; Cook, P.G.; Brunner, P.; Berhane, D. Solute dynamics during bank storage flows and implications for chemical base flow separation. Water Resour. Res. 2010, 46, W07541. [Google Scholar] [CrossRef]
- Bachand, P.A.M.; Roy, S.B.; Choperena, J.; Cameron, D.; Horwath, W.R. Implications of using on-farm flood flow capture to recharge groundwater and mitigate flood risks along the King River, CA. Environ. Sci. Technol. 2014, 48, 13601–13609. [Google Scholar] [CrossRef] [PubMed]
© 2015 by the authors; licensee MDPI, Basel, Switzerland. This article is an open access article distributed under the terms and conditions of the Creative Commons Attribution license (http://creativecommons.org/licenses/by/4.0/).
Share and Cite
Wang, X.; Zhang, G.; Xu, Y.J. Impacts of the 2013 Extreme Flood in Northeast China on Regional Groundwater Depth and Quality. Water 2015, 7, 4575-4592. https://doi.org/10.3390/w7084575
Wang X, Zhang G, Xu YJ. Impacts of the 2013 Extreme Flood in Northeast China on Regional Groundwater Depth and Quality. Water. 2015; 7(8):4575-4592. https://doi.org/10.3390/w7084575
Chicago/Turabian StyleWang, Xihua, Guangxin Zhang, and Yi Jun Xu. 2015. "Impacts of the 2013 Extreme Flood in Northeast China on Regional Groundwater Depth and Quality" Water 7, no. 8: 4575-4592. https://doi.org/10.3390/w7084575