3.1. Monitored Hydrologic Events
The timeframe and range of discharge events monitored at each of the stations is shown on
Figure 2a. Although several years of data were collected at each site, it was inadequate to directly estimate flood recurrence intervals for the largest events contained within the data set. Thus, estimates were made using a parameteric model contained within the National Streamflow Statistics software created by US Geological Survey [
40]. More specifically, the largest flows on record at the three monitoring sites were compared to estimates generated using the Peak Southeastern US equation (which is applicable to rural basins in Western North Carolina) to determine the recurrence interval of the events. In the case of the Allen Creek #1 site, the majority of flows ranged between 0.4 and 1.0 cm (
Figure 2a). The largest flood event, which reached approximately 3.5 cm, occurred on 5 March 2008, and was estimated to be on the order of a 25 year flood. The largest monitored event at the remaining sites occurred on 17 January 2013. The recurrence intervals estimated for this event at both the Cherry Cove and Old Bald Creek #1 sites were also on the order of a 25- to 30-year event. The output from such parametric models is acknowledged to contain considerable uncertainty. Thus, the data should be interpreted with a great deal of caution. Nonetheless, the results suggest that water quality data at the sites were collected for a wide range of flow conditions, in spite of the fact that the data were obtained over a relatively short timeframe (about 7.5 years).
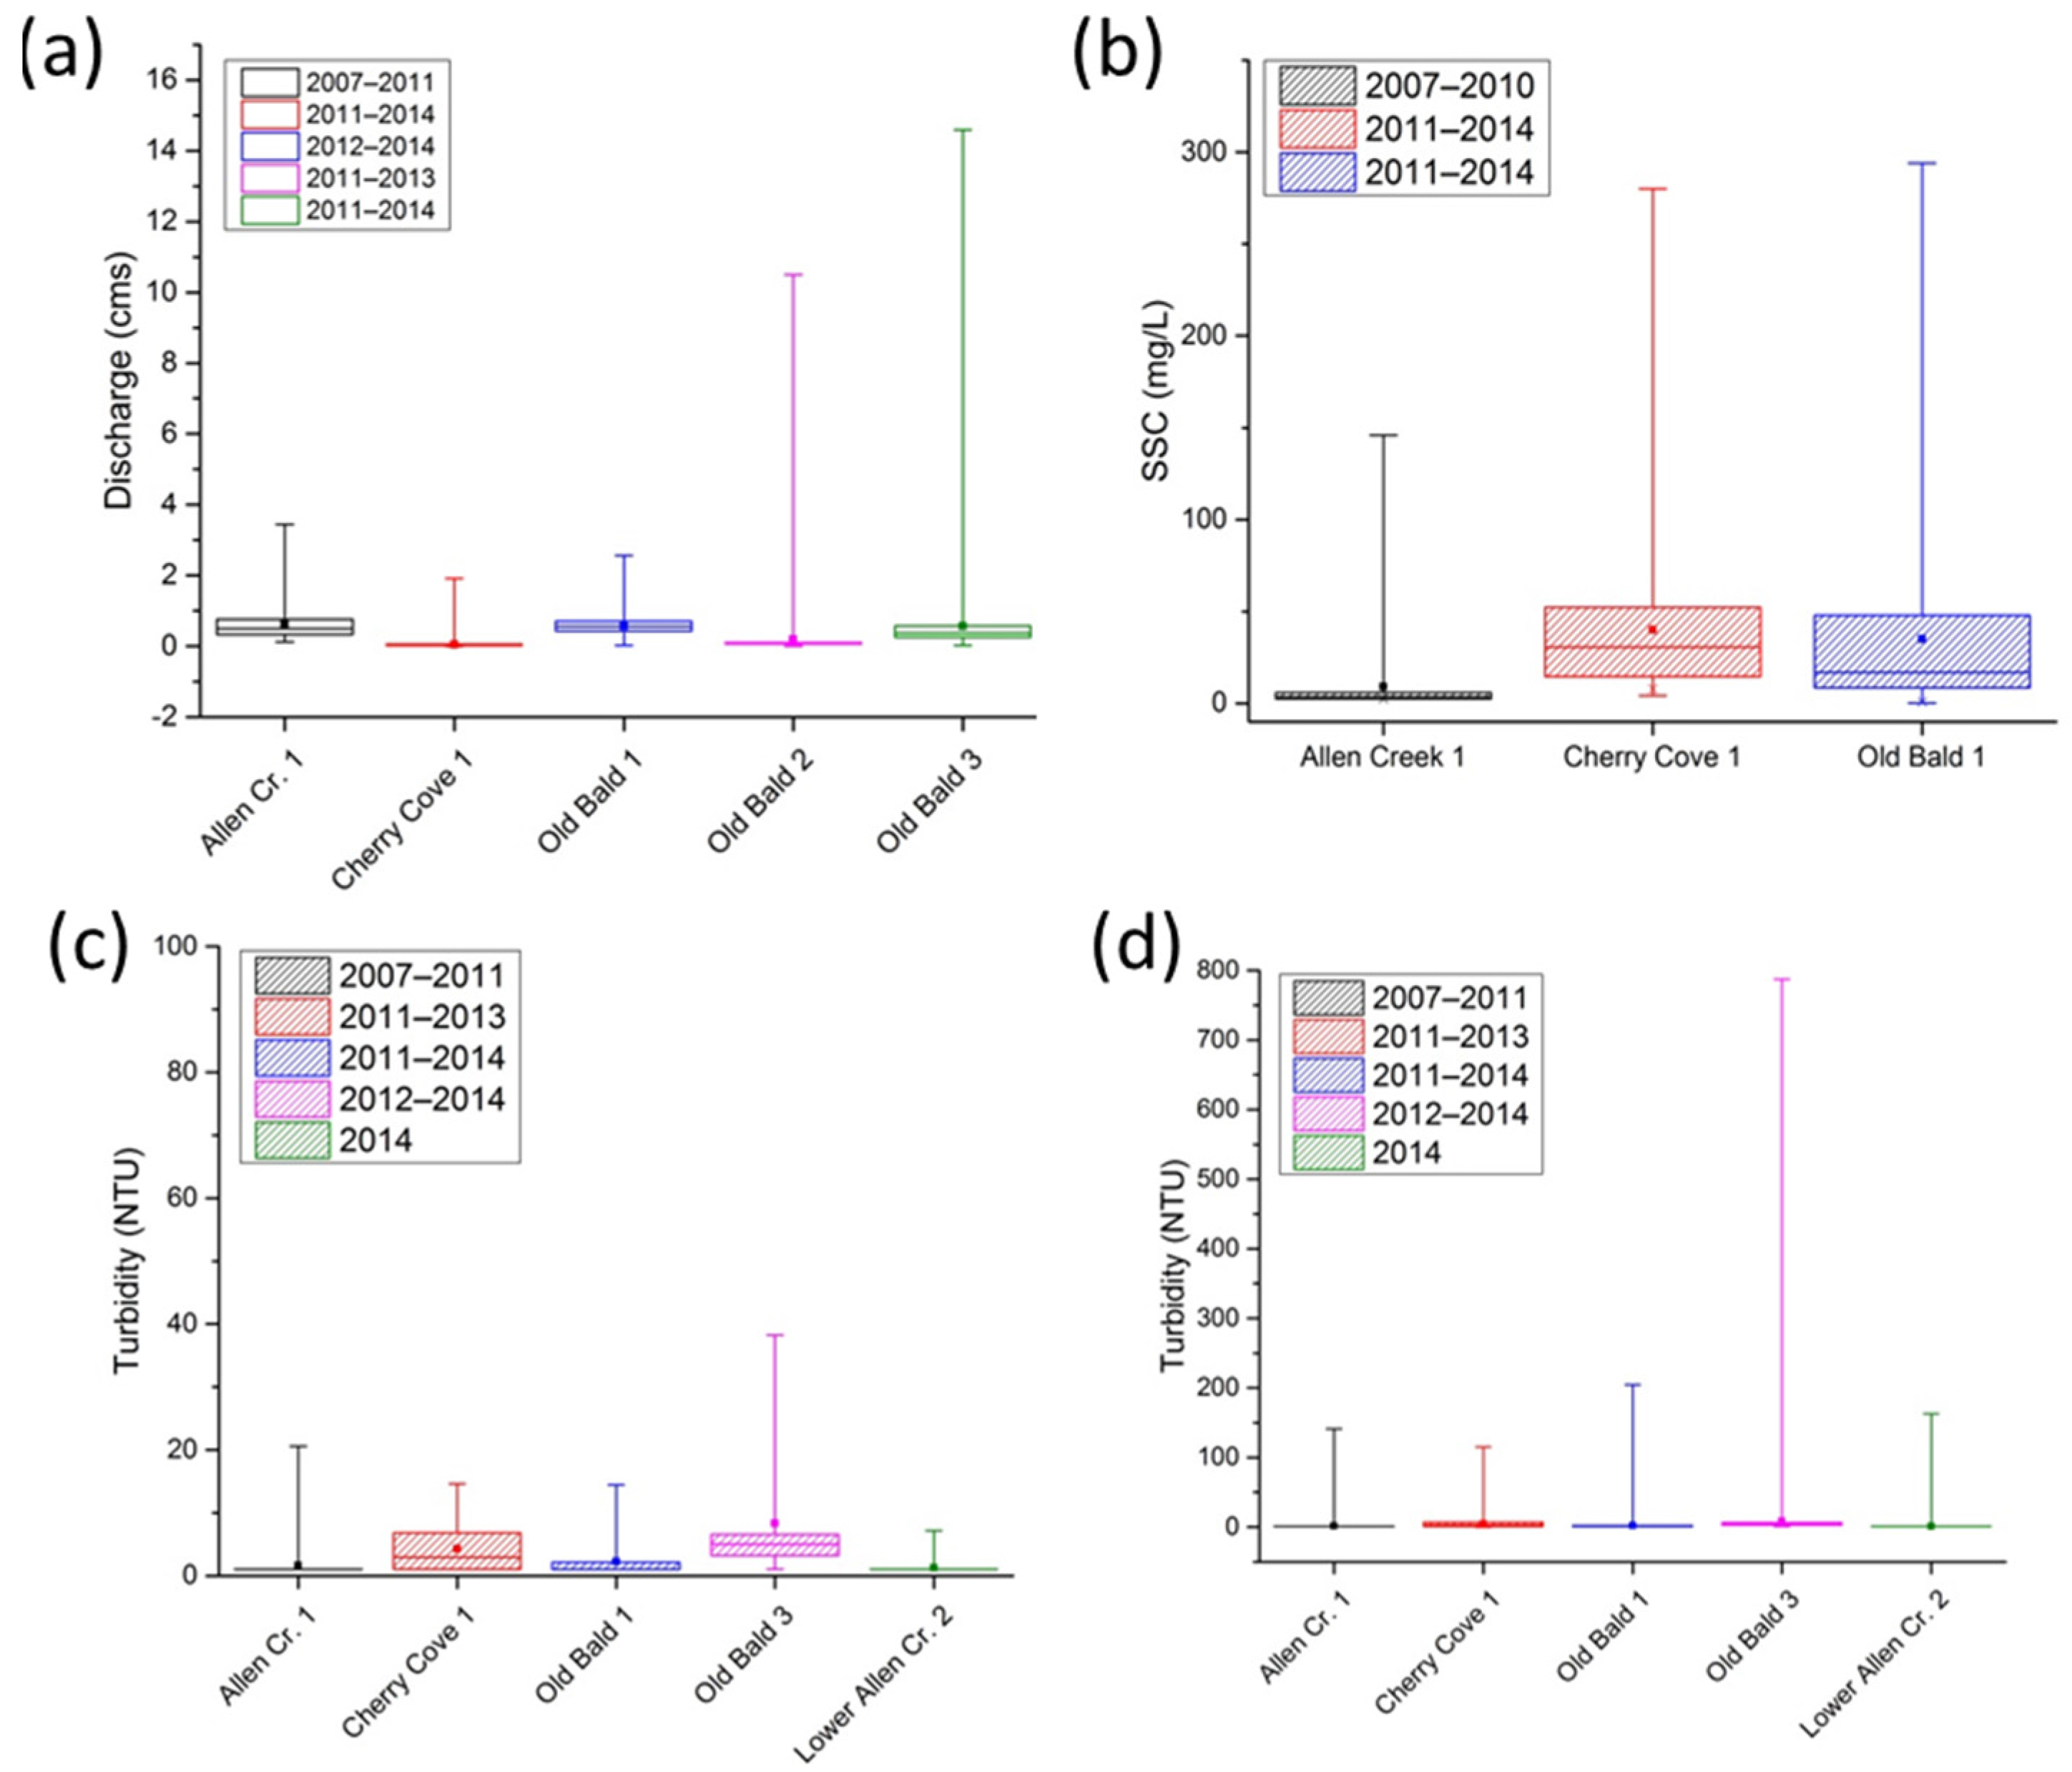
Figure 2.
Between site comparison of measured flow (discharge) (a); suspended sediment concentration (b); and turbidity (c, d). Box represents 25%–75% frequency interval, whereas whiskers repent maximum and minimum values for a, b, c. The 1%–99% range is shown by the whiskers in plot c. Discharge values for lower Allen Creek #2 site are currently unavailable.
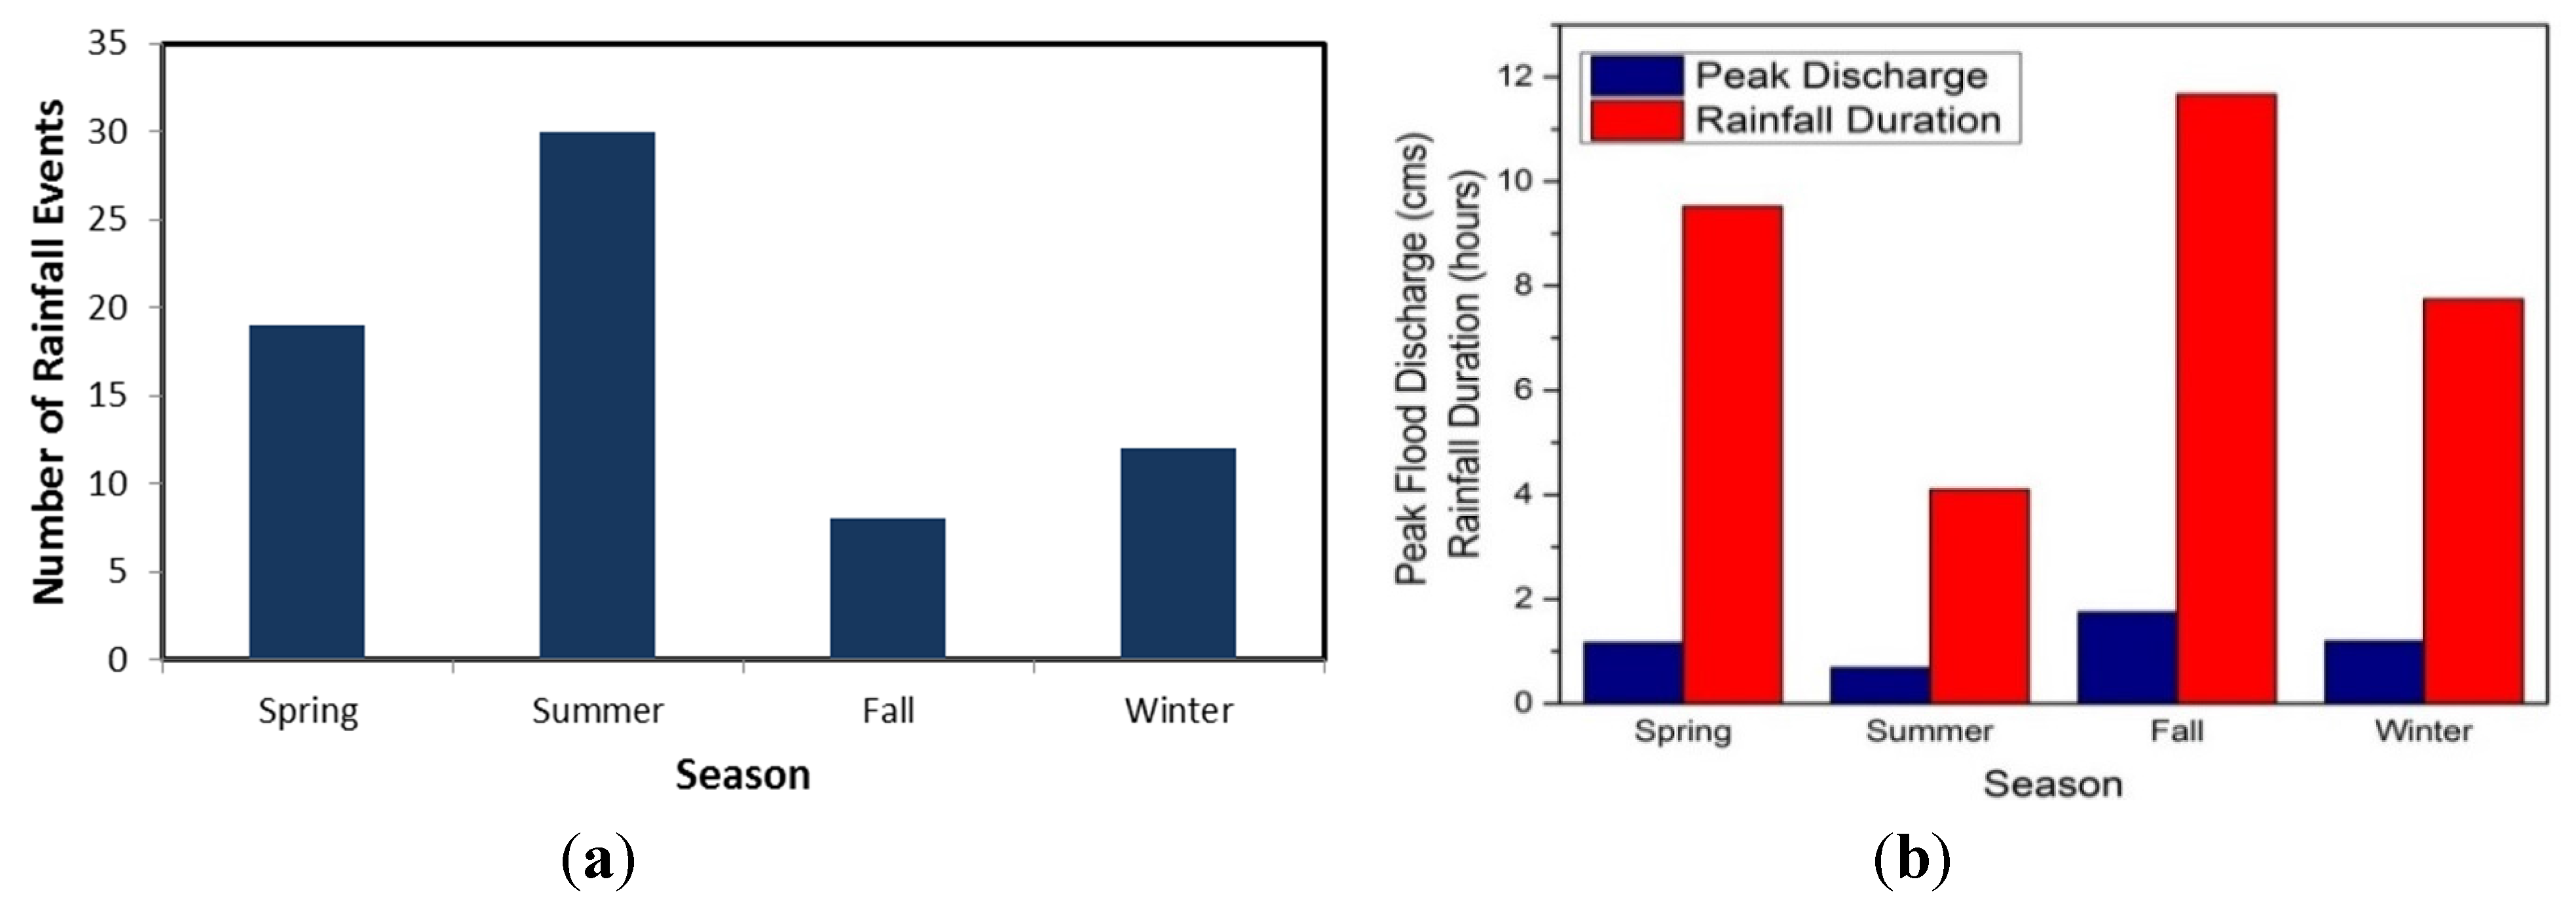
Analysis of the Allen Creek #1 data show that the peak flood magnitude and rainfall duration of the analyzed runoff events were typically lower during the summer than those that occurred during the remainder of the year; however, more storms were observed during the summer months (
Figure 3).
Figure 3.
(a) Number of rainfall events between March 2007 and July 2010 within the Allen Creek Watershed categorized by meteorological season. Includes a total of 69 events; (b) Average rainfall duration and the generated peak discharge associated with each precipitation event.
Figure 3.
(a) Number of rainfall events between March 2007 and July 2010 within the Allen Creek Watershed categorized by meteorological season. Includes a total of 69 events; (b) Average rainfall duration and the generated peak discharge associated with each precipitation event.
3.2. Suspended Sediment Concentration
The Allen Creek monitoring site was established along a bedrock reach located about 50 m downstream of a bedrock knickpoint. Between 7 March 2007 (when monitoring began) and 5 March 2008 the channel was stable. However, on 5 March 2008 the largest flood recorded during the monitoring period occurred. Although the magnitude of the event was only slightly larger than that which occurred about a year earlier (15 March 2007), it resulted in the movement of large quantities of gravel bedload, some of which was deposited along the bedrock reach in the vicinity of the monitoring station. In fact, more than 50 cm of deposition occur along the reach during the event, partially burying the intake to the ISCO automated sampler. For the next several months, the deposited bedload was eroded and transported downstream. SSC data collected during this period was discarded from our analysis. Neither the Cherry Cove nor Old Bald Creek #1 sites exhibited channel instability during or following the event.
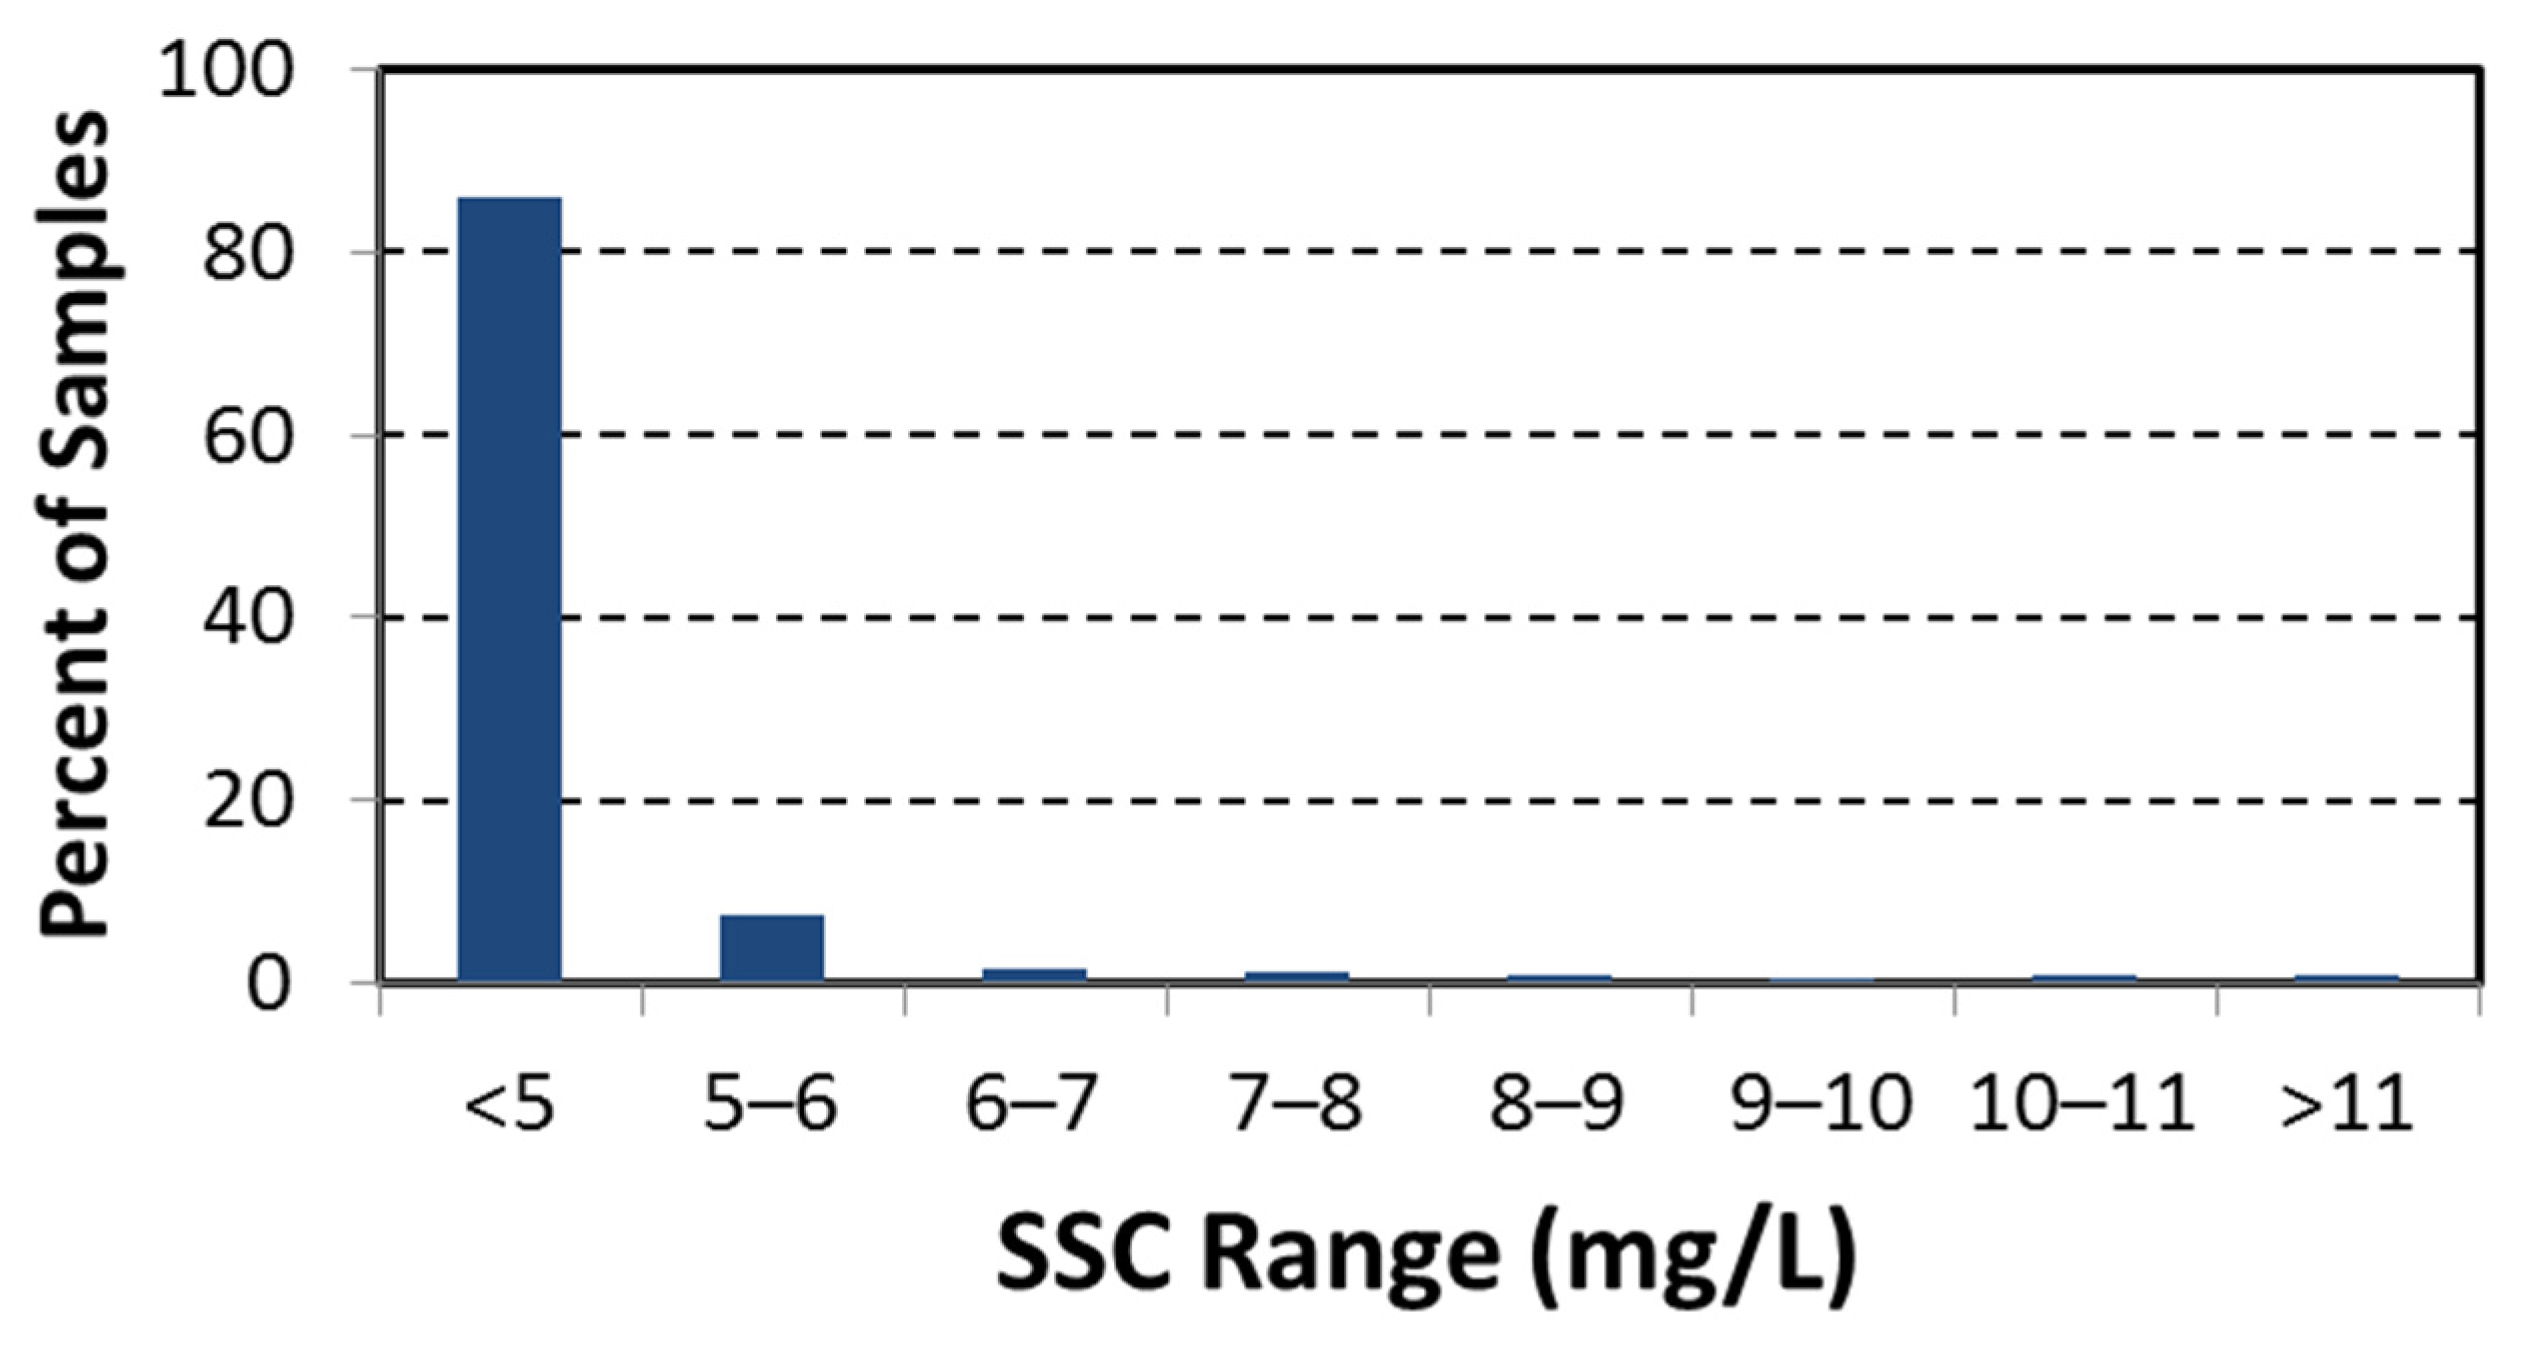
As expected for coarse-grained, gravel bed rivers, SSC during base flow conditions were minimal at all three of the monitoring sites where data were available (
Figure 4). At the Allen Creek #1 site, for example, nearly 85% of the more than 250 samples collected during base flow conditions between March 2007 and July 2010 exhibited concentrations <5 mg/L, whereas more than 99% exhibited concentrations < 10 mg/L. In most instances, the highest SSC values were measured immediately after peak discharge, and reached values approaching 145 mg/L at the Allen Creek site.
Based on the total 1051 water samples that were analyzed from the site, more than 90% exhibited sediment concentrations below 30 mg/L, whereas only 2.3% exhibited values exceeding 100 mg/L. Peak SSC values at the Old Bald Creek #1 and Cherry Cove sites were similar reaching values in excess of 280 mg/L (
Figure 2). More than 75% of the samples from these sites were below 50 mg/L (
Figure 2b).
The duration over which relatively high sediment concentrations occur is an important consideration with regards to the impacts of sediment on aquatic biota [
41,
42]. Relatively high SSC at all three sites tended to be short-lived. For instance, SSC during floods typically declined to values less than 50 mg/L within 10 h of a precipitation event, and SSC values exceeding 25 mg/L rarely lasted for more than 24 h, at the Allen Creek monitoring station (
Figure 5).
Figure 4.
Suspended sediment concentrations measured during base flow conditions at the Allen Creek #1 monitoring station between March 2007 and September 2011. Nearly 85% of the samples exhibited concentrations <5 mg/L; more than 99% exhibited concentration <10 mg/L.
Figure 4.
Suspended sediment concentrations measured during base flow conditions at the Allen Creek #1 monitoring station between March 2007 and September 2011. Nearly 85% of the samples exhibited concentrations <5 mg/L; more than 99% exhibited concentration <10 mg/L.
Figure 5.
SSC plotted as a function of time following precipitation for the Allen Creek #1 monitoring site. Based on 69 events analyzed between March 2007 and July 2010.
Figure 5.
SSC plotted as a function of time following precipitation for the Allen Creek #1 monitoring site. Based on 69 events analyzed between March 2007 and July 2010.
An alternative means of assessing the duration for which biota are subjected to a specific SSC is to determine the percentage of time (frequency) that a given concentration occurs. As pointed out by Simon
et al. [
43] and Simon and Klimetz [
44], the methods for documenting such a frequency metric are well established and based on the relationship between flow magnitude and sediment concentration (
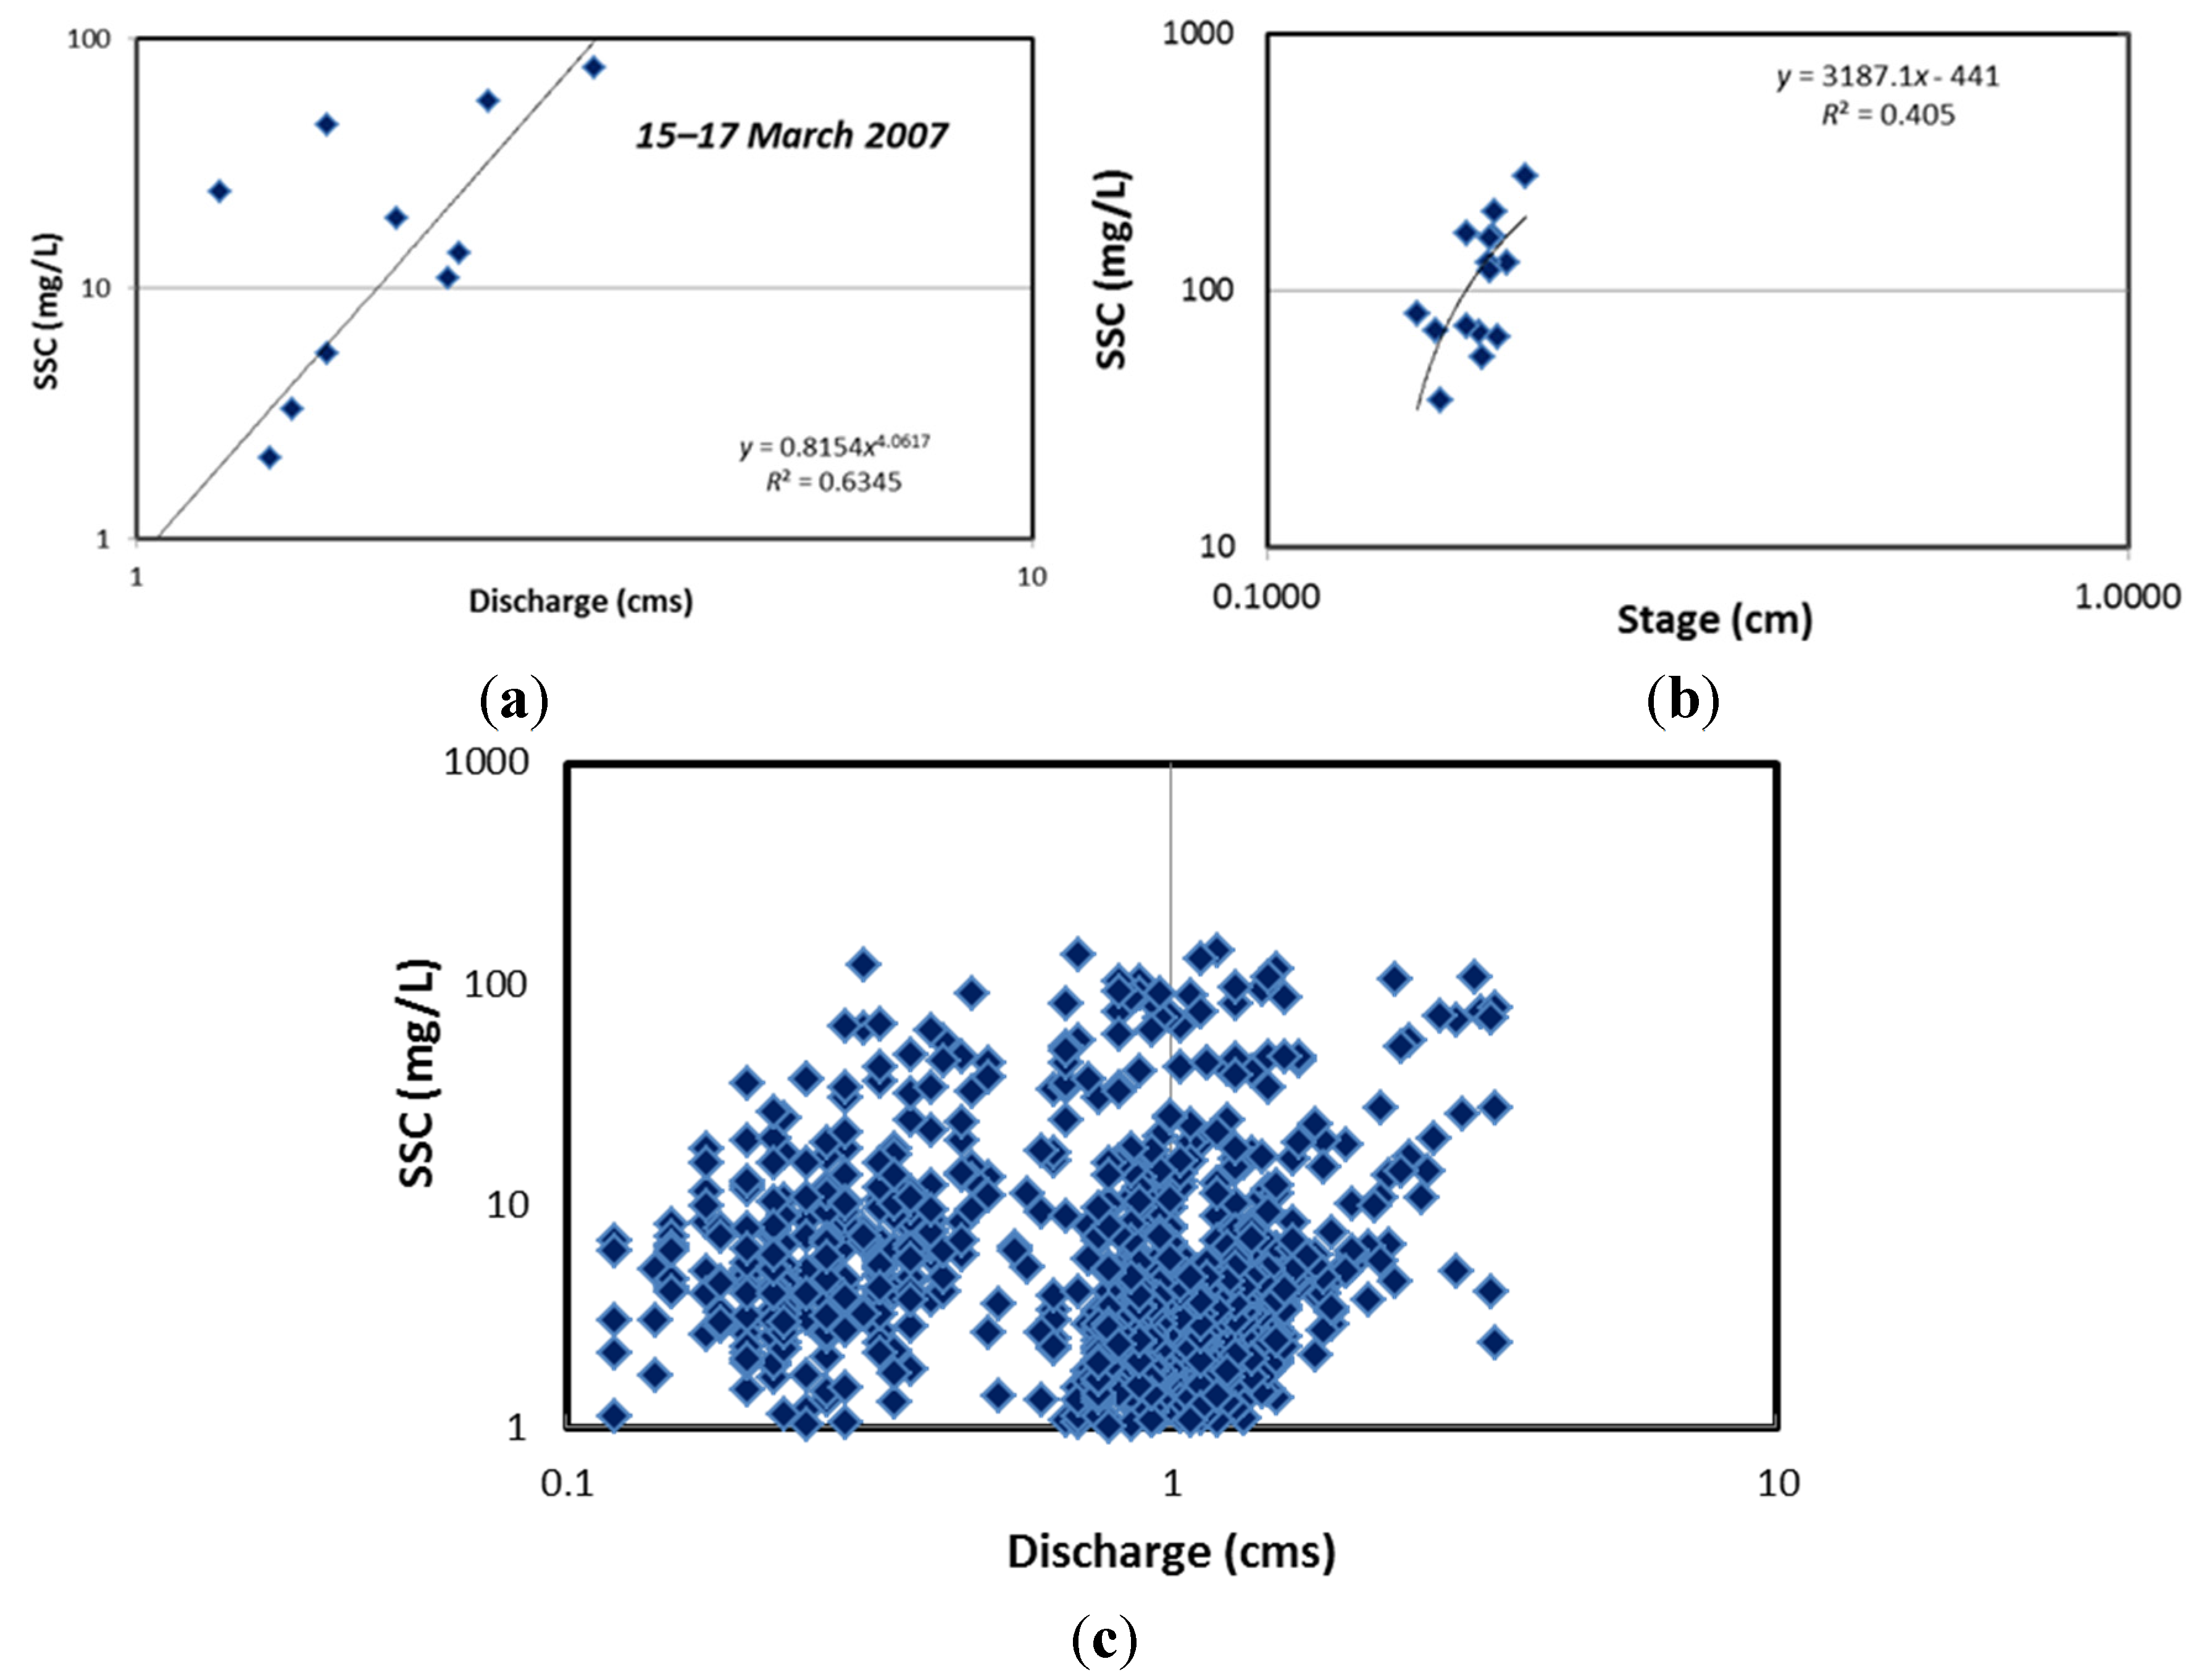
i.e., the establishment of a sediment rating curve). Within the Allen Creek watershed statistically significant sediment rating curves could be developed for individual runoff events at the three monitored sites (
Figure 6a,b). However, sediment rating curves could not be developed for data derived from multiple floods (
i.e., the total data set), in spite of the large numbers of samples collected at the sites for a range of flow conditions (
Figure 6c). Given that relationships could be developed for individual events, it was hypothesized that SSC varied through time according to the characteristics of the precipitation events.
To test the above hypothesis, the 69 distinct precipitation events occurring between 15 March 2007 and July 2010 were characterized in terms of total rainfall, maximum 24 h rainfall, total rainfall duration, average rainfall intensity, and peak 1 h rainfall intensity. The duration between events was also determined. These data were combined with stream flow (discharge) data, and analyzed using a stepwise multiple regression approach to determine which, if any, of the precipitation parameters influenced SSC. The analysis revealed that part of the variability in SSC could be explained by the total amount of rainfall (TPrec) associated with an event and the maximum hourly rainfall intensity (HrIt) of the event, such that:
While the relationship is statistically significant (p < 0.001), it explained a limited amount of the total variability in SSC values (26%), suggesting that other factors are also important.
Figure 6.
Statistically significant relationships were identified between SSC and discharge during individual events at the monitoring sites, such as shown for the Allen Creek #1 during an event in March 2007 (a); and at the Cherry Cove site during an 3–13 April 2010 event (b); Similar relationships do not exist when data are combined for multiple events at a site as shown for Allen Creek #2 (c).
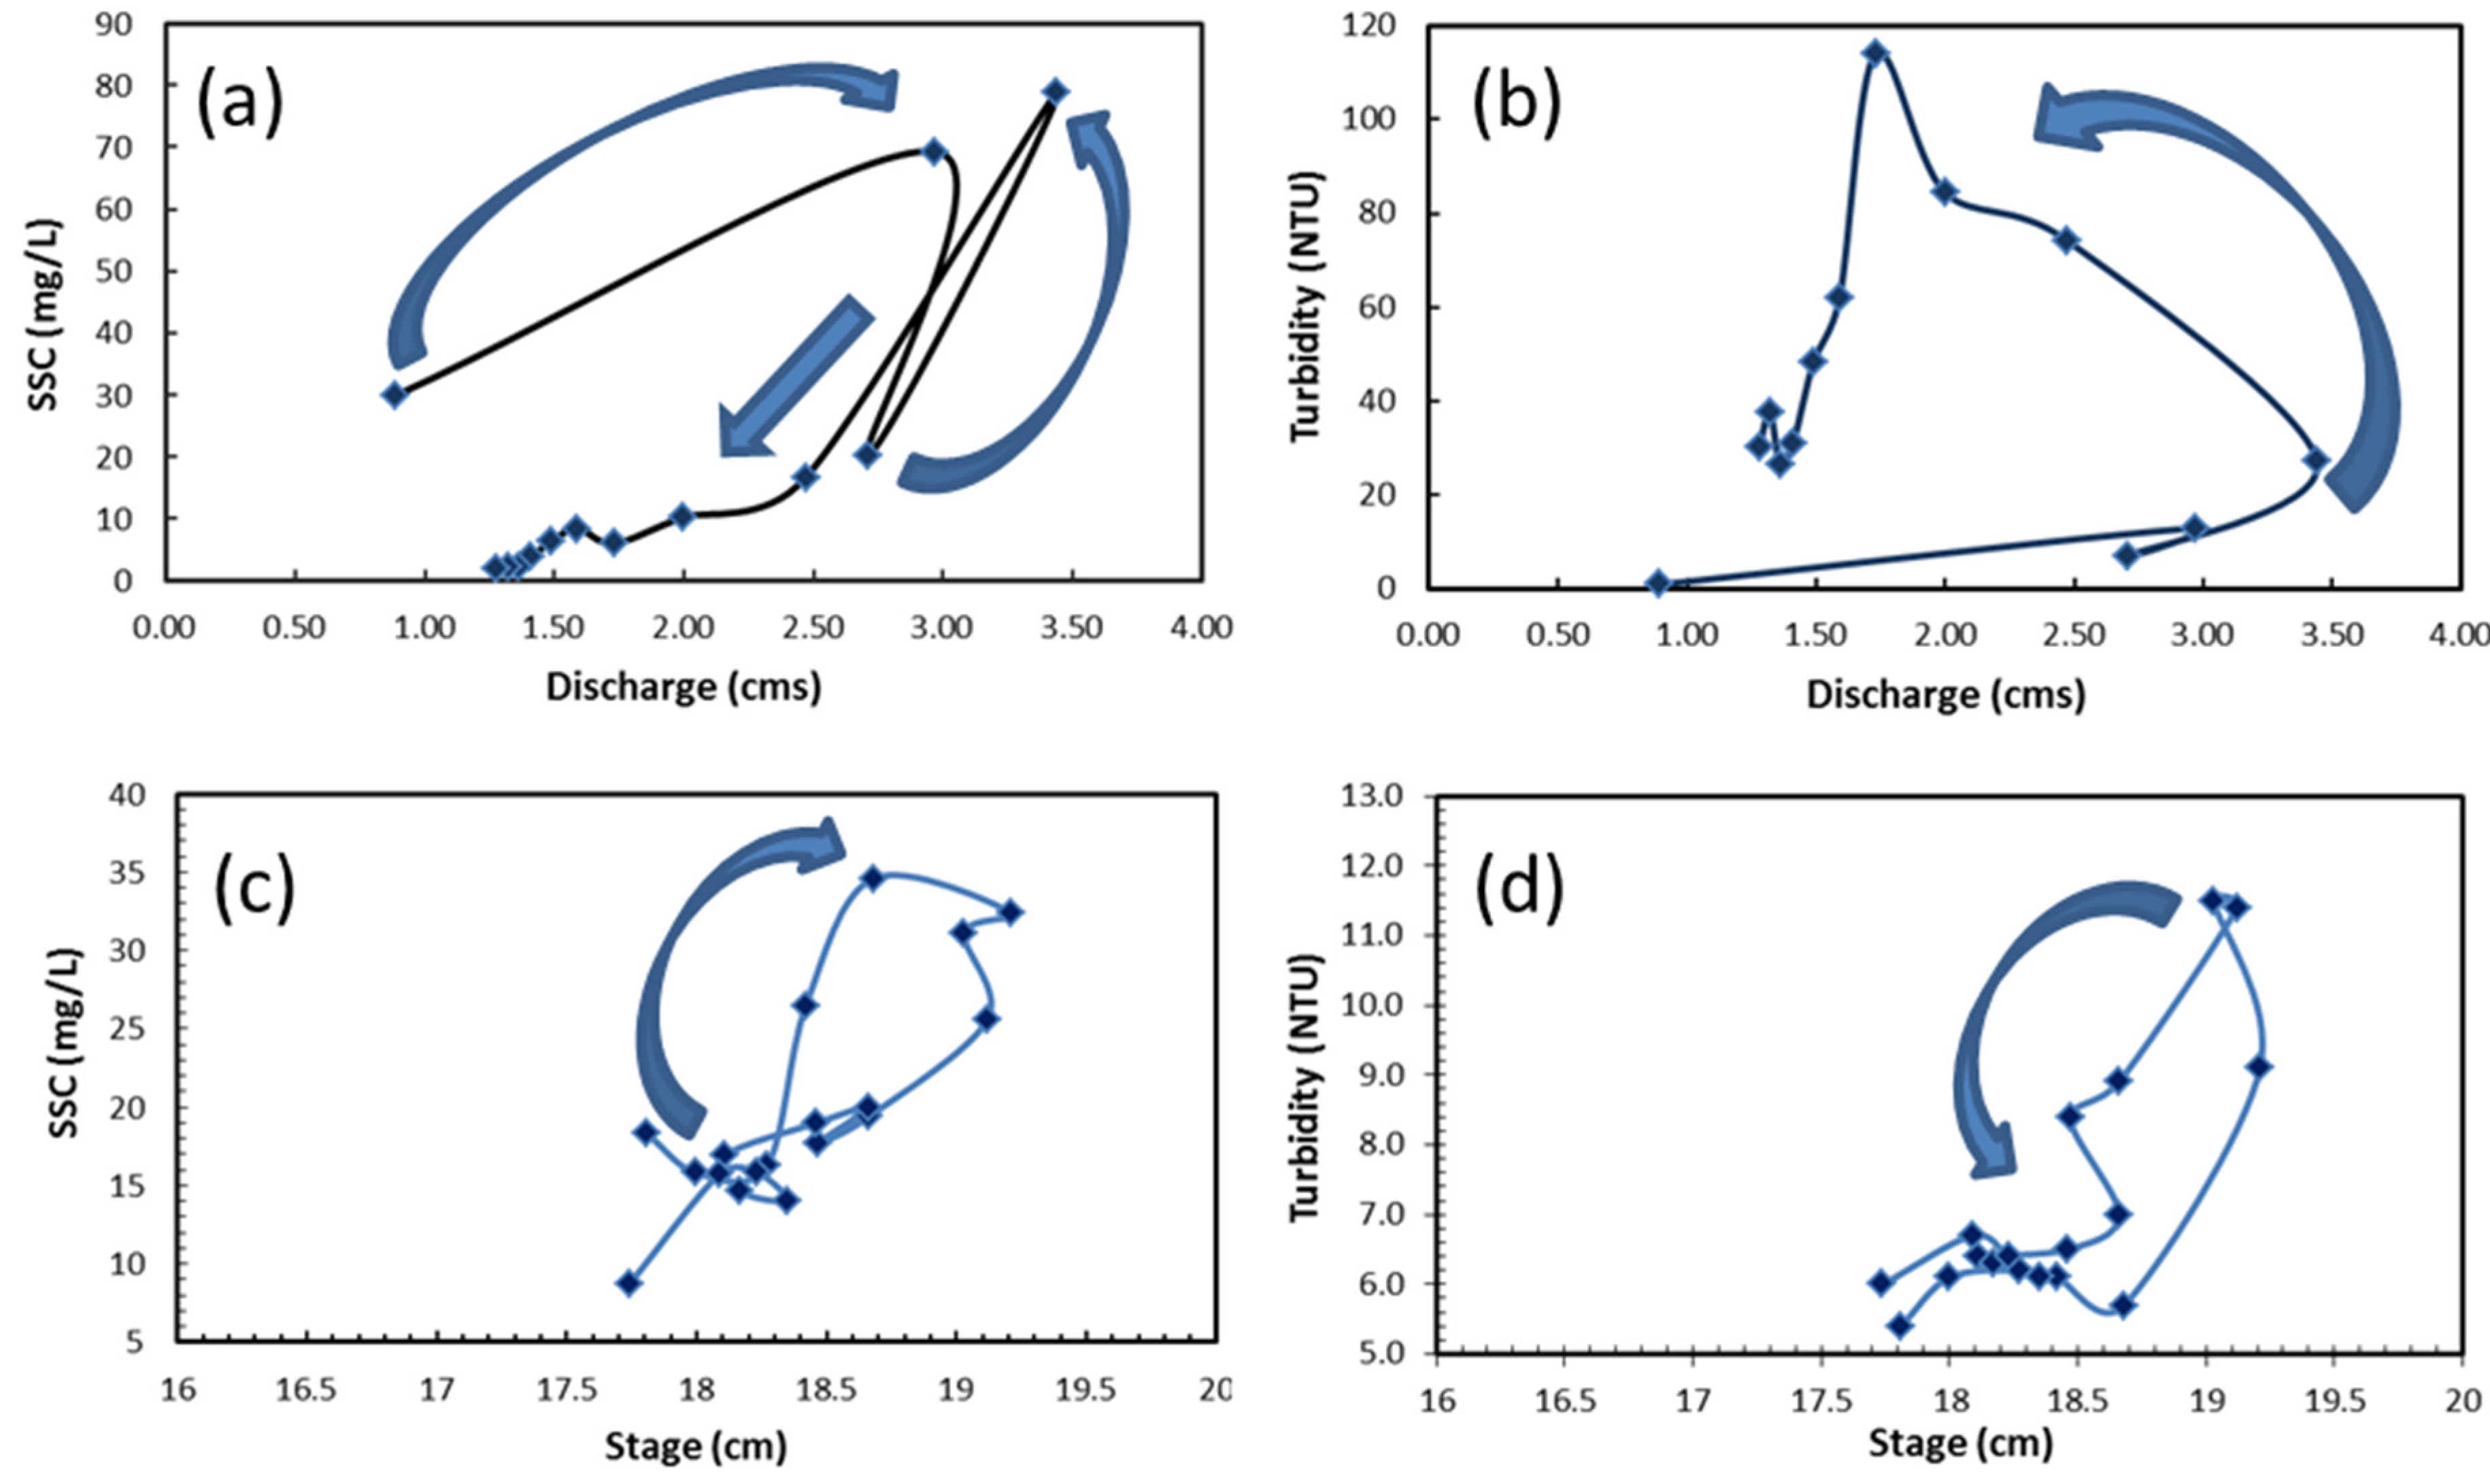
A portion of the noted event-scale variability in SSC appears to be related to the phenomenon known as hysteresis in which SSC for a given discharge differ between the rising and falling stage of an event. It occurs because as discharge and SSC increase, the peak in SSC does not precisely correspond to peak discharge. The form of the hysteretic loops varied between events and sites for a given event, and included figure-eight loops (
Figure 7b), straight-lines with a loop (
Figure 7c), and clockwise and counter-clockwise loops. Williams [
45] notes that the nature of these loops depends on a large number of factors including: (1) the intensity and areal distribution of precipitation within the basin; (2) the amount and rate of runoff; (3) the quantity of sediment stored within and along the channel; and (4) differences in the source and rate of downstream sediment transport. Regardless of the cause, some form of hysteresis was associated with most events and contributed significantly to the variability observed between SSC and discharge.
Figure 7.
Examples of hysteresis loops observed for Allen Creek #1 (a,b) during the 4–5 March 2008 flood and Old Bald Creek #3 during the 28 April 2014 flood (c,d). Turbidity often exhibits a hysteretic loop that differs from that observed for SSC.
Figure 7.
Examples of hysteresis loops observed for Allen Creek #1 (a,b) during the 4–5 March 2008 flood and Old Bald Creek #3 during the 28 April 2014 flood (c,d). Turbidity often exhibits a hysteretic loop that differs from that observed for SSC.
Student
t-tests, performed under the assumption of unequal variance, suggest that SSC at Allen Creek was statistically different from, and lower than, those measured at either Cherry Cove or Old Bald Creek #1 (as suggested by the box and whisker plots presented in
Figure 2b). There was no evidence to suggest that SSC values between Cherry Cove and Old Bald Creek #1 were different (
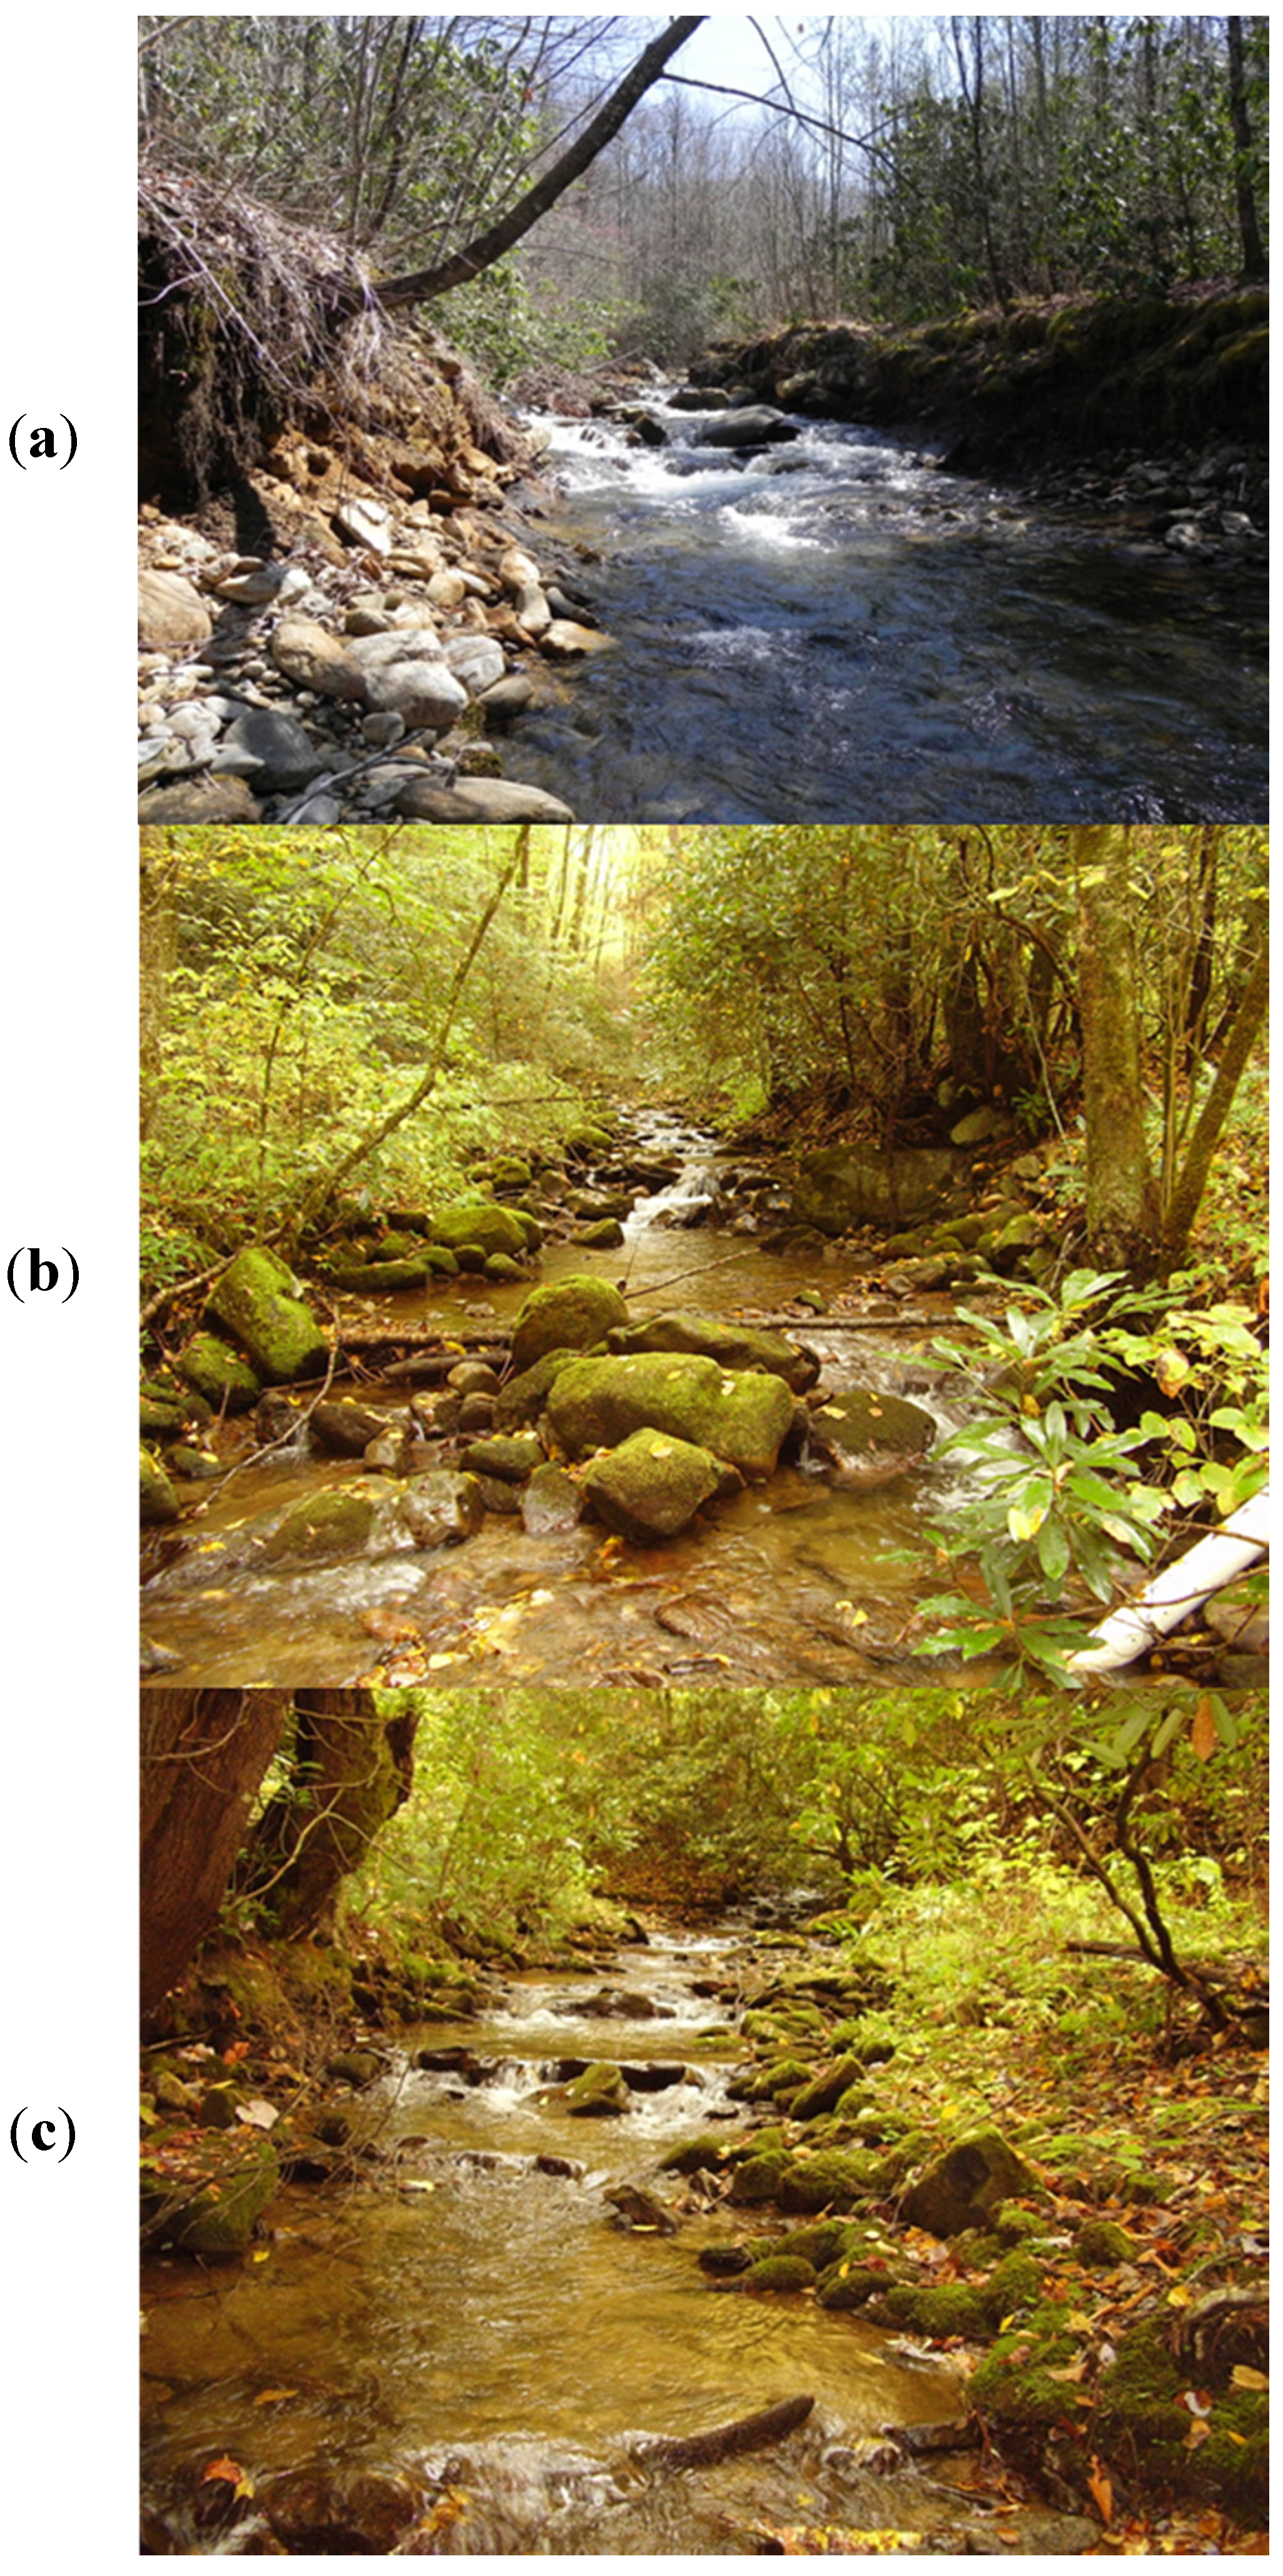
p < 0.05). The lower values obtained at the Allen Creek site were surprising because in contrast to either of the other sites the Allen Creek #1 site (1) is lower in the drainage system and therefore possess a larger upstream basin area; and (2) occurs along an relatively unstable channel reach characterized by channel incision, local bedrock knickpoints, and eroding, near vertical channel walls (
Figure 8). However, Equation (1) shows that the maximum hourly rainfall intensity is an important parameter controlling the concentration of suspended sediments within the channel of Allen Creek. The identification of rainfall intensity as a control on SSC suggests that at least part of the suspended sediment load is derived from upland areas as higher rainfall intensities are often associated with the development of overland flow and an increased ability of runoff to erode and transport sediment from hillslopes to the channel. Thus, the higher upstream SSC associate with Cherry Cove and Old Bald #1 is likely to be related to the steeper headwater hillslopes that generated more water and sediment during intense rainfall events. It also suggests that sediments eroded from the channel banks in the vicinity of Allen Creek #1 contribute little to the total sediment load.
Figure 8.
Photographs showing differences in channel stability between the Allen Creek #1 (a); Cherry Cove (b) and Old Bald Creek #1 (c) monitoring sites. Notice moss covered boulders at Cherry Cove and Old Bald Creek, indicating their recent lack of movement, and the eroding banks and bedrock knickpoint in Allen Creek photograph.
3.3. Influence of Connectivity on Suspended Sediment Concentrations
Significant attention has been given in recent years to the concept of connectivity [
46,
47,
48,
49,
50]. Connectivity, in general, describes the physical coupling between landforms and landform elements within a catchment (e.g., a hillslope to the channel), and as such influences the movement of water, sediment, and the chemical substances that they possess through the drainage basin. The linkages between landform elements can be defined from a landscape, hydrological, and sedimentological perspective, each forming a separate type of connectivity [
46,
50]. Landscape connectivity defines the physical coupling between the units, whereas hydrological connectivity describes the ability of water to move from one landform or landform element to another. Hydrologic connectivity is clearly enhanced by increases in landscape connectivity. Sedimentological connectivity refers to the ability of sediments and the constituents attached to them to be moved between elements and ultimately downstream through the catchment. As sediments are transported through the basin by water, sedimentological connectivity requires at least some degree hydrological connectivity.
With regards to sediments, Fryirs
et al. [
47] defined several types of impediments that limit connectivity, in general, and the conveyance of sediment from one element to another in particular. Of importance to this analysis are the effects that historic timber harvests have had on (1) buffers, which limit the delivery of sediment to the channel, particularly from hillslopes via overland flow; and (2) barriers, which inhibit the downstream transport of sediment through the channel network.
The methods used to extract timber from the watershed have been synthesized in an historical analysis conducted by Flucher [
51]. During early timbering operations, the Quinlan-Monroe Company utilized a variety of approaches to transport cut logs to the sawmill in Quinlantown (located at the current site of the reservoir,
Figure 1). In steep headwater areas, underbrush and small trees were removed so that logs could be rolled or skidded downslope to the “moist spongy” soils that characterized the riparian corridor. From here the logs were often pulled by oxen down the valley. Where the logs could not be easily transported by skidding through the wet riparian corridors, they used a combination of log chutes, wooden flumes, or splash dams, all of which were known to significantly impact stream channels. In fact, the Quinlan-Monroe Company, in an agreement with the Haywood Mining and Lumber Company, agreed ‘not to open up or cut timber upon’ more than three streams or gullies at any one time (Haywood County, North Carolina Book of Deeds, Book 25). The agreement presumably reflected a desire to reduce the impacts logging had on the physical and biotic conditions of the streams, including water quality. The use of slash dams was the most destructive of the utilized techniques. This method involved the construction of a wooden dam across a stream and its associated valley, creating a pond. Logs were then skidded into the pond, and once filled with timber, the dam was dynamited, flushing the logs downstream in a human induced torrent that was noted to cause significant damage to the riparian corridor.
Decreased downvalley gradients made it possible for the majority of logs to be transported the remainder of the way to the sawmill in Quinlantown through wooden chutes and flumes. From there the sawed timber was shipped to a lumberyard further downstream (and out of the study area) in Hazelwood via a narrow gauge railway. The Champion Fibre Company also built narrow gauge railways up the major drainages of the watershed, including Allen Creek, where the pulpwood could be shipped to the Champion paper plant [
52].
Oral histories of the basin indicate that timbering operations had a dramatic negative effect on the riparian corridor; the impacts included the severe erosion of the channel and valley floor, particularly within the steep, headwater areas, and the diversion of stream flow by dikes, berms, embankments and constructed channels. Many of these features, particularly the formation of ridges and berms within the riparian buffer zone remain within the watershed and, therefore, have had a long-term impact on connectivity as they physically disconnected hillslopes with the adjacent channels. These anthropogenic buffers include railway embankments (e.g., along Allen Creek near the Allen Creek #1 monitoring site), and a variety of other earthen ridges that sporadically parallel the channel and for which the origin is unclear. The dimensions of these ridges are highly variable, ranging from less than 1 m to more than 5 m in height. Although in some instances, water has been observed flowing through the earthen embankments during precipitation events, the hydrologic connectivity (and rate of flow) is presumably reduced from its natural condition. Moreover, the embankments inhibit the movement of particulate matter from the slopes to the channel where they occur such that the hillslopes are sedimentologically disconnected locally from the drainage network.
Anthropogenic barriers located along the drainage network also exist. For example, a number of tributary channels can be traced downstream to where they terminate in modern wetlands that appear to have formed in man-made depressions in the valley floor, or by earthen ridges/dams that cross the valley in a direction that is oblique to the downstream flow pattern. While water from these unintentionally created wetlands may find its way to the channel through subsurface routes, they have clearly decreased the hydrologic connectivity of the surficial flow system, and have resulted in the sedimentological disconnection of these tributaries with the axial channel.
In light of the above, one of the most significant impacts of the historic logging operations was a long-term reduction in hydrologic and, more importantly, sedimentologic connectivity within the basin. It is, perhaps, ironic that the reduction in connectivity that resulted from logging that occur occurred more than 60 years ago is now limiting the influx of sediment to the axial drainage system and is at least partly responsible for the relatively high quality waters observed within the watershed.
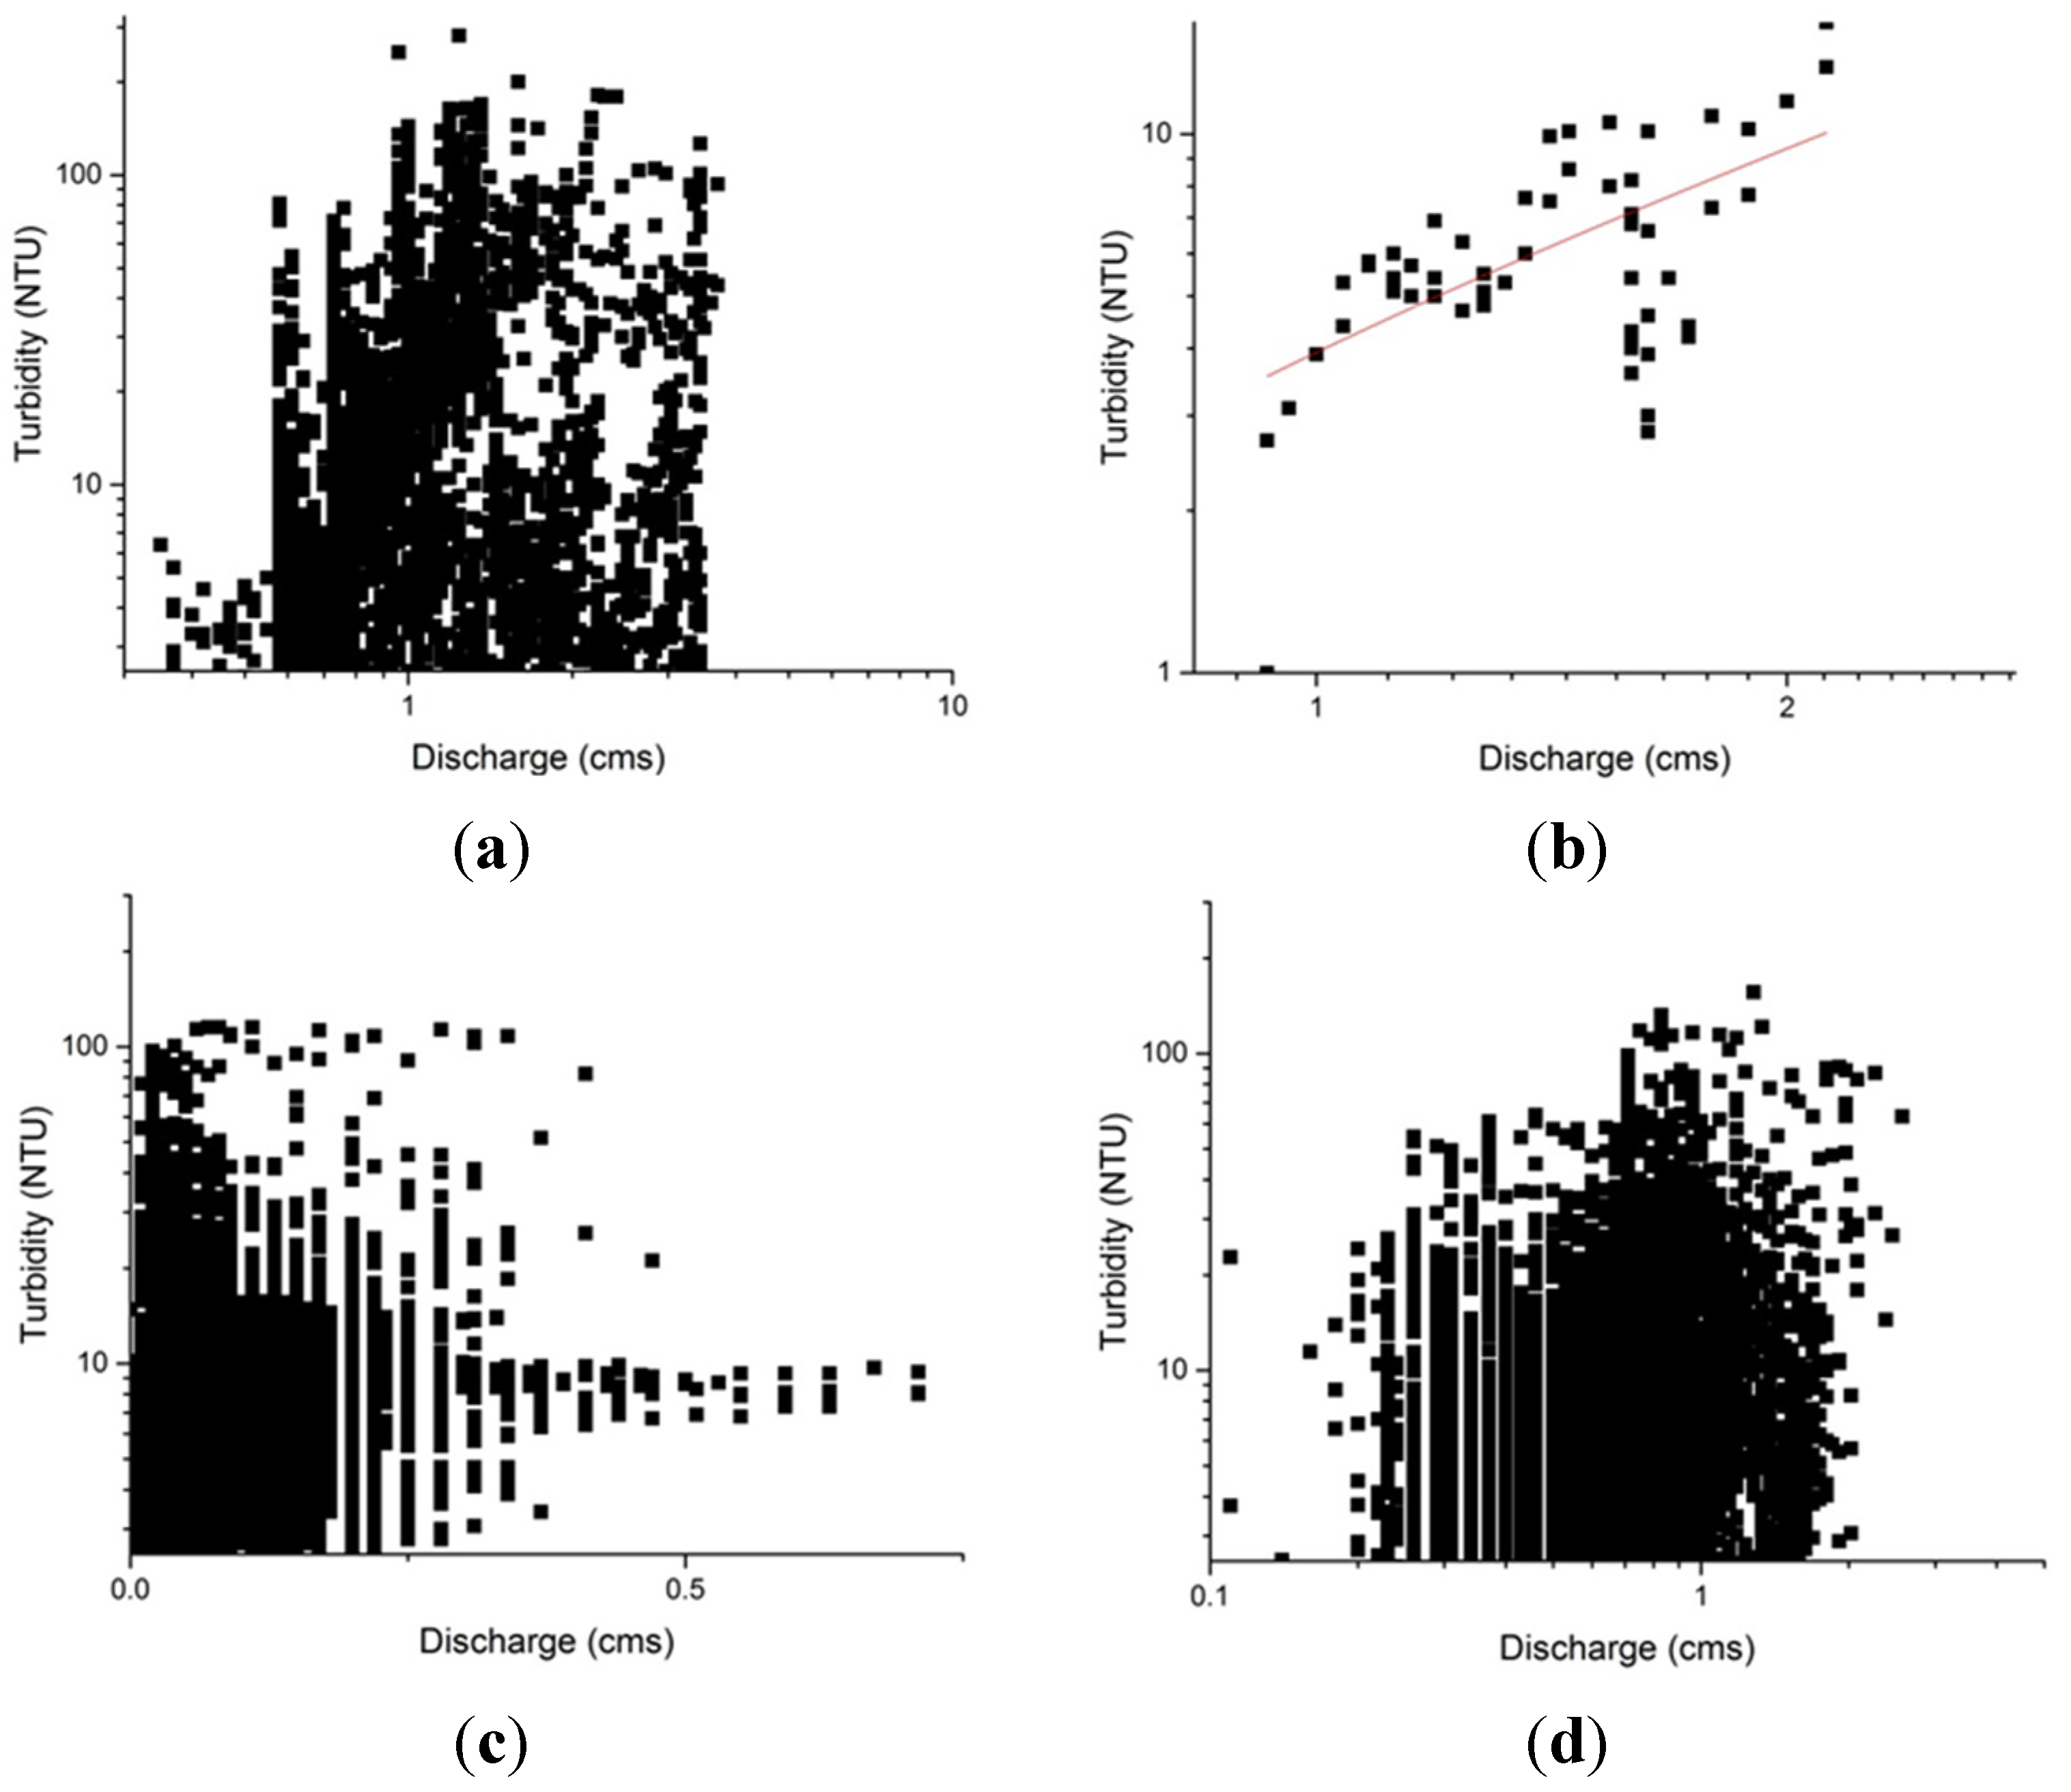
3.4. Controls on Turbidity
Turbidity is a measure of the general clarity of the river water and is typically reported in nephelometric turbidity units (NTU). Turbidity data were collected at the monitoring sites within the Allen Creek basin, in part because (1) North Carolina State regulations are based on turbidity rather than SSC data; and (2) the installed turbidity probes allowed for the collection of a dataset with a higher temporal resolution than is possible for SSC. Moreover, the collection of turbidity data is much less intensive in terms of both time and effort, and is often assumed to serve as an effective surrogate for SSC.
In general, turbidity values were low for all of the monitoring sites. At the Allen Creek site, for example, the majority of turbidity values measured at five minute increments between March 2007 and September 2011 are below 30 NTU; in fact, more than 75% of the time turbidity measurements were below 10 NTU (
Figure 2c,d). Similarly, more than 95% of the values measured at Cherry Cove and Old Bald #1 were below 20 NTU (
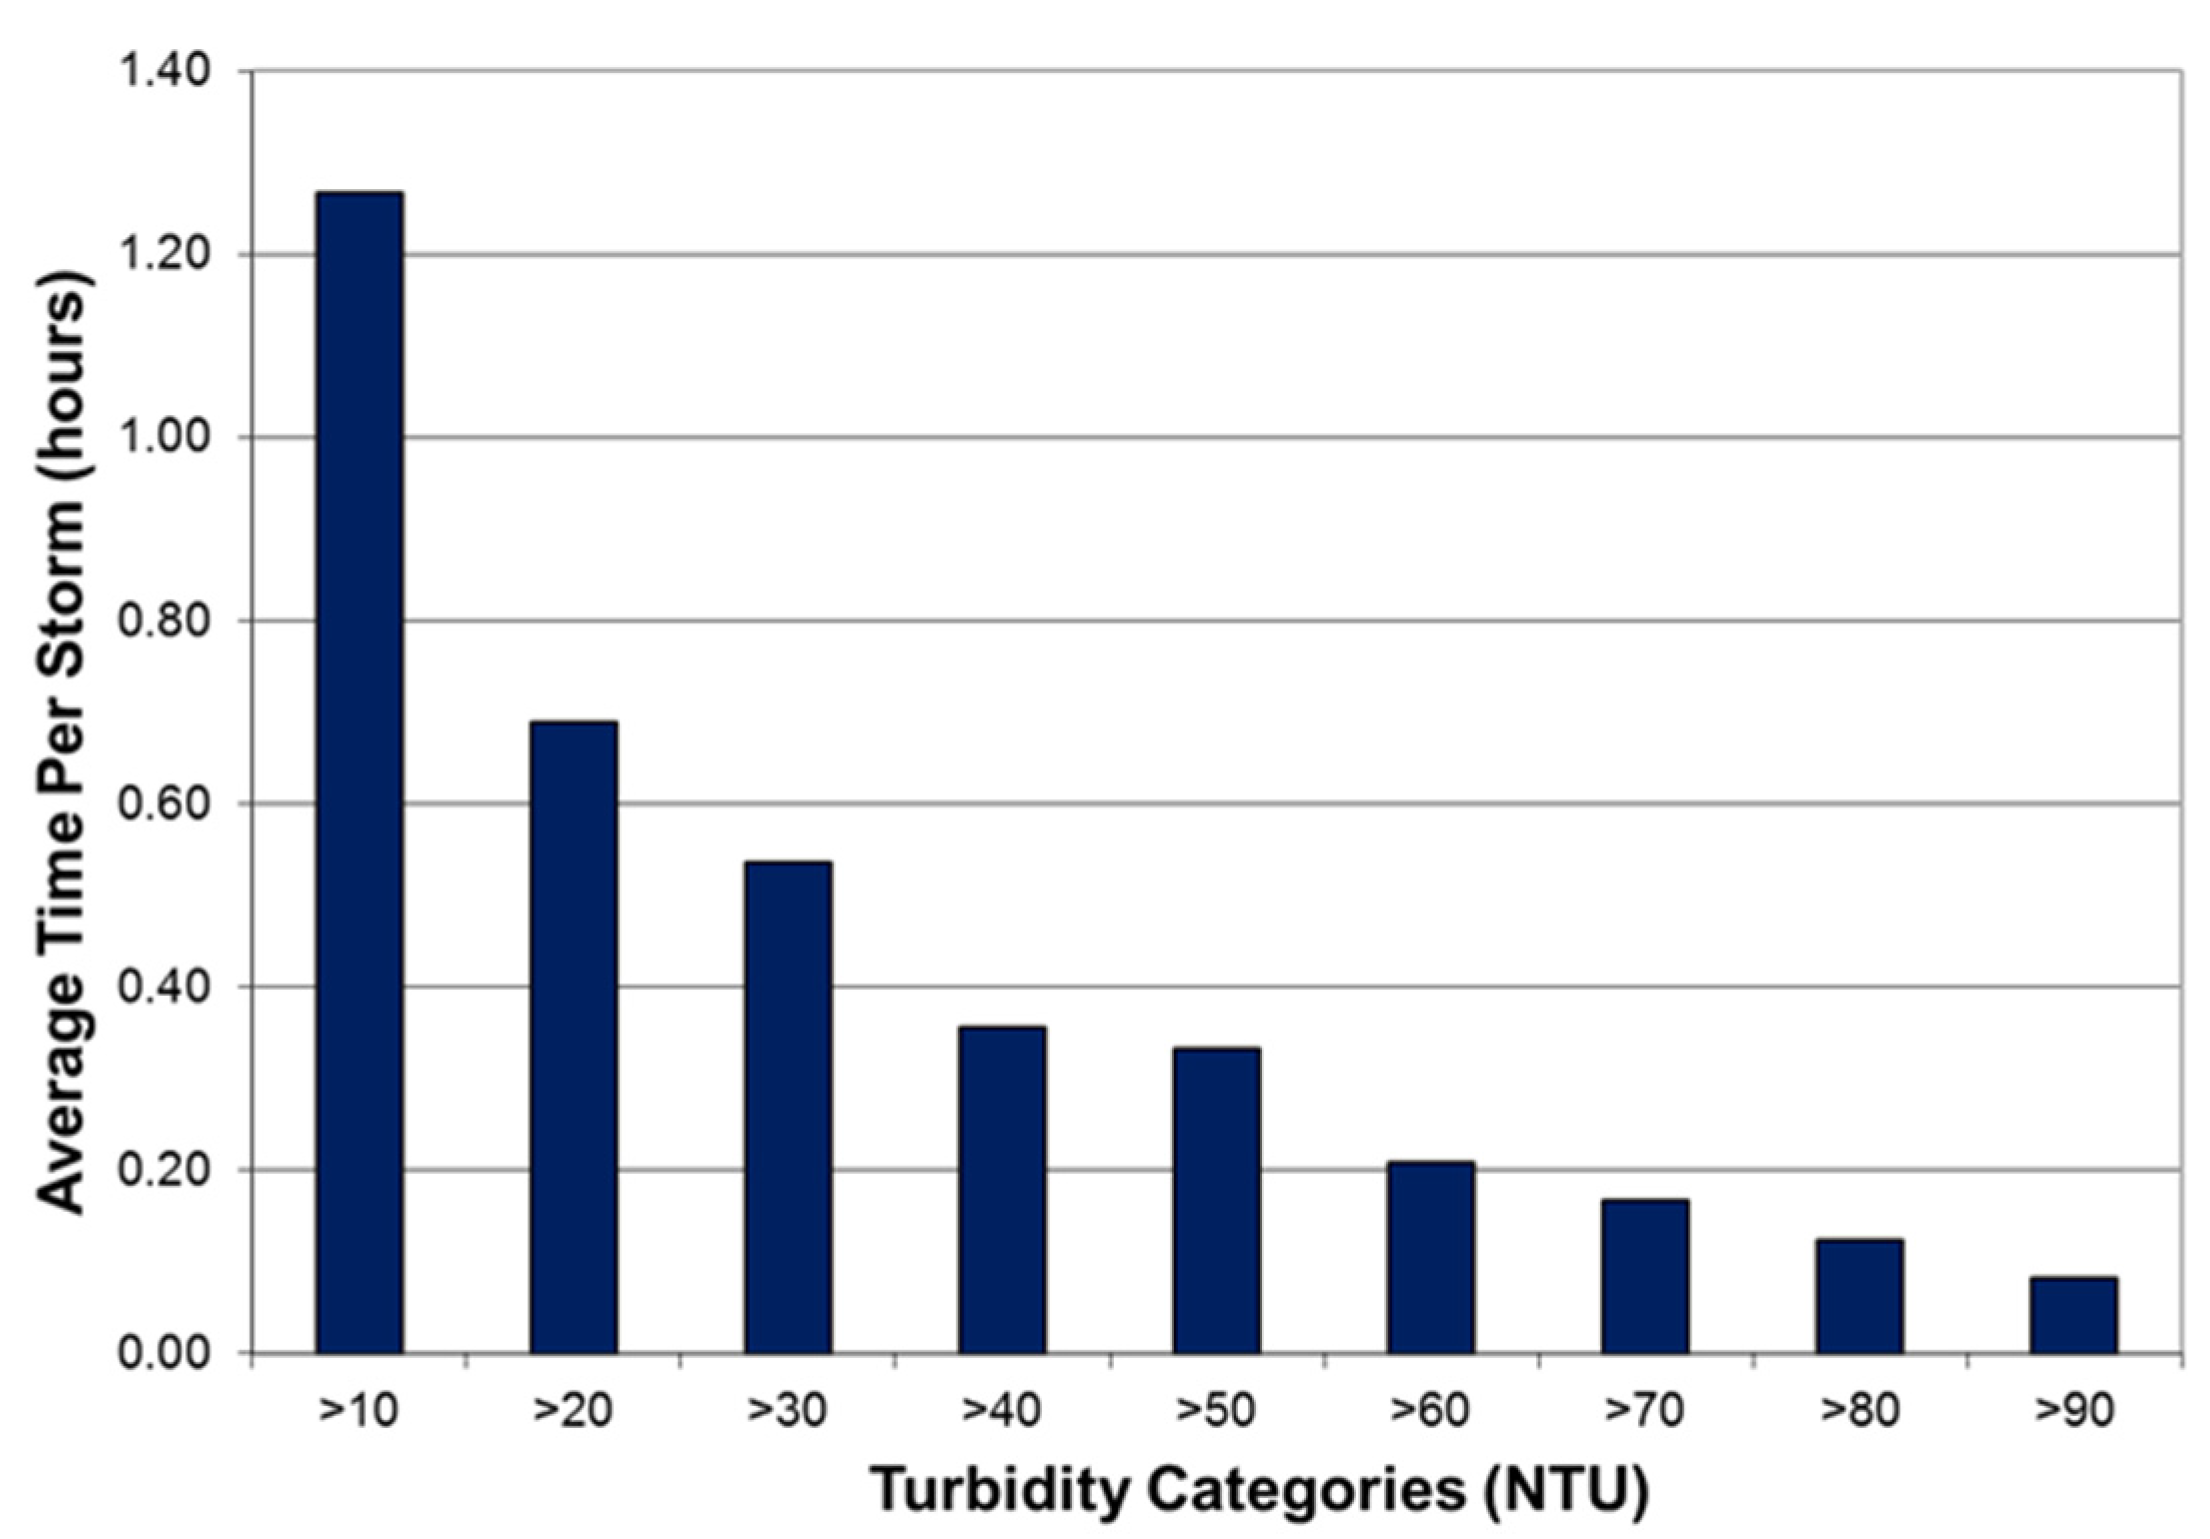
Figure 2c,d). As expected, the highest turbidity values occurred during floods, with the peak values occurring at or immediately after peak flow. For most events, turbidity tended to decline to near background values well before base flow conditions were reached. As a result, relatively high turbidity values were short-lived. In fact, the analysis of 69 flood events at the Allen Creek site between March 2007 and July 2010 showed that turbidity remained above 10 NTU on average, for less than 1.2 h. In all instances turbidity had decreased below 50 NTU within 25 min (
Figure 9). Comparison with
Figure 5 shows that while both SSC and turbidity decreased rapidly in comparison to discharge during the waning stages of an event, turbidity tends to decrease to pre-event values more quickly than SSC.
As was the case for SSC, statistically significant relationships between turbidity and discharge could be developed for individual flood events, but not for the dataset as a whole (
i.e., when data from multiple events are combined) (
Figure 10). Between sites,
t-tests demonstrated that mean turbidity values differed between all of the sites and were higher at the Cherry Cove site than at the Allen Creek or Old Bald 1 sites (
p < 0.05) (
Figure 2c,d). The highest mean and maximum turbidity values occurred at Old Bald #3, a site located within a channel that drains part of the valley floor of Old Bald Creek and that is located immediately upstream of the reservoir (
Figure 1).
Figure 9.
Average time turbidity was above a specified turbidity value at the Allen Creek #1 site between March 2007 and July 2010.
Figure 9.
Average time turbidity was above a specified turbidity value at the Allen Creek #1 site between March 2007 and July 2010.
Figure 10.
Variations in turbidity as a function of stream flow at the Allen Creek #1 (a); Cherry Cove (c); and Old Bald Creek #1 (d) monitoring stations; (b) variations in turbidity at the Allen Creek #1 site during the 15–16 March 2007 event only.
Figure 10.
Variations in turbidity as a function of stream flow at the Allen Creek #1 (a); Cherry Cove (c); and Old Bald Creek #1 (d) monitoring stations; (b) variations in turbidity at the Allen Creek #1 site during the 15–16 March 2007 event only.
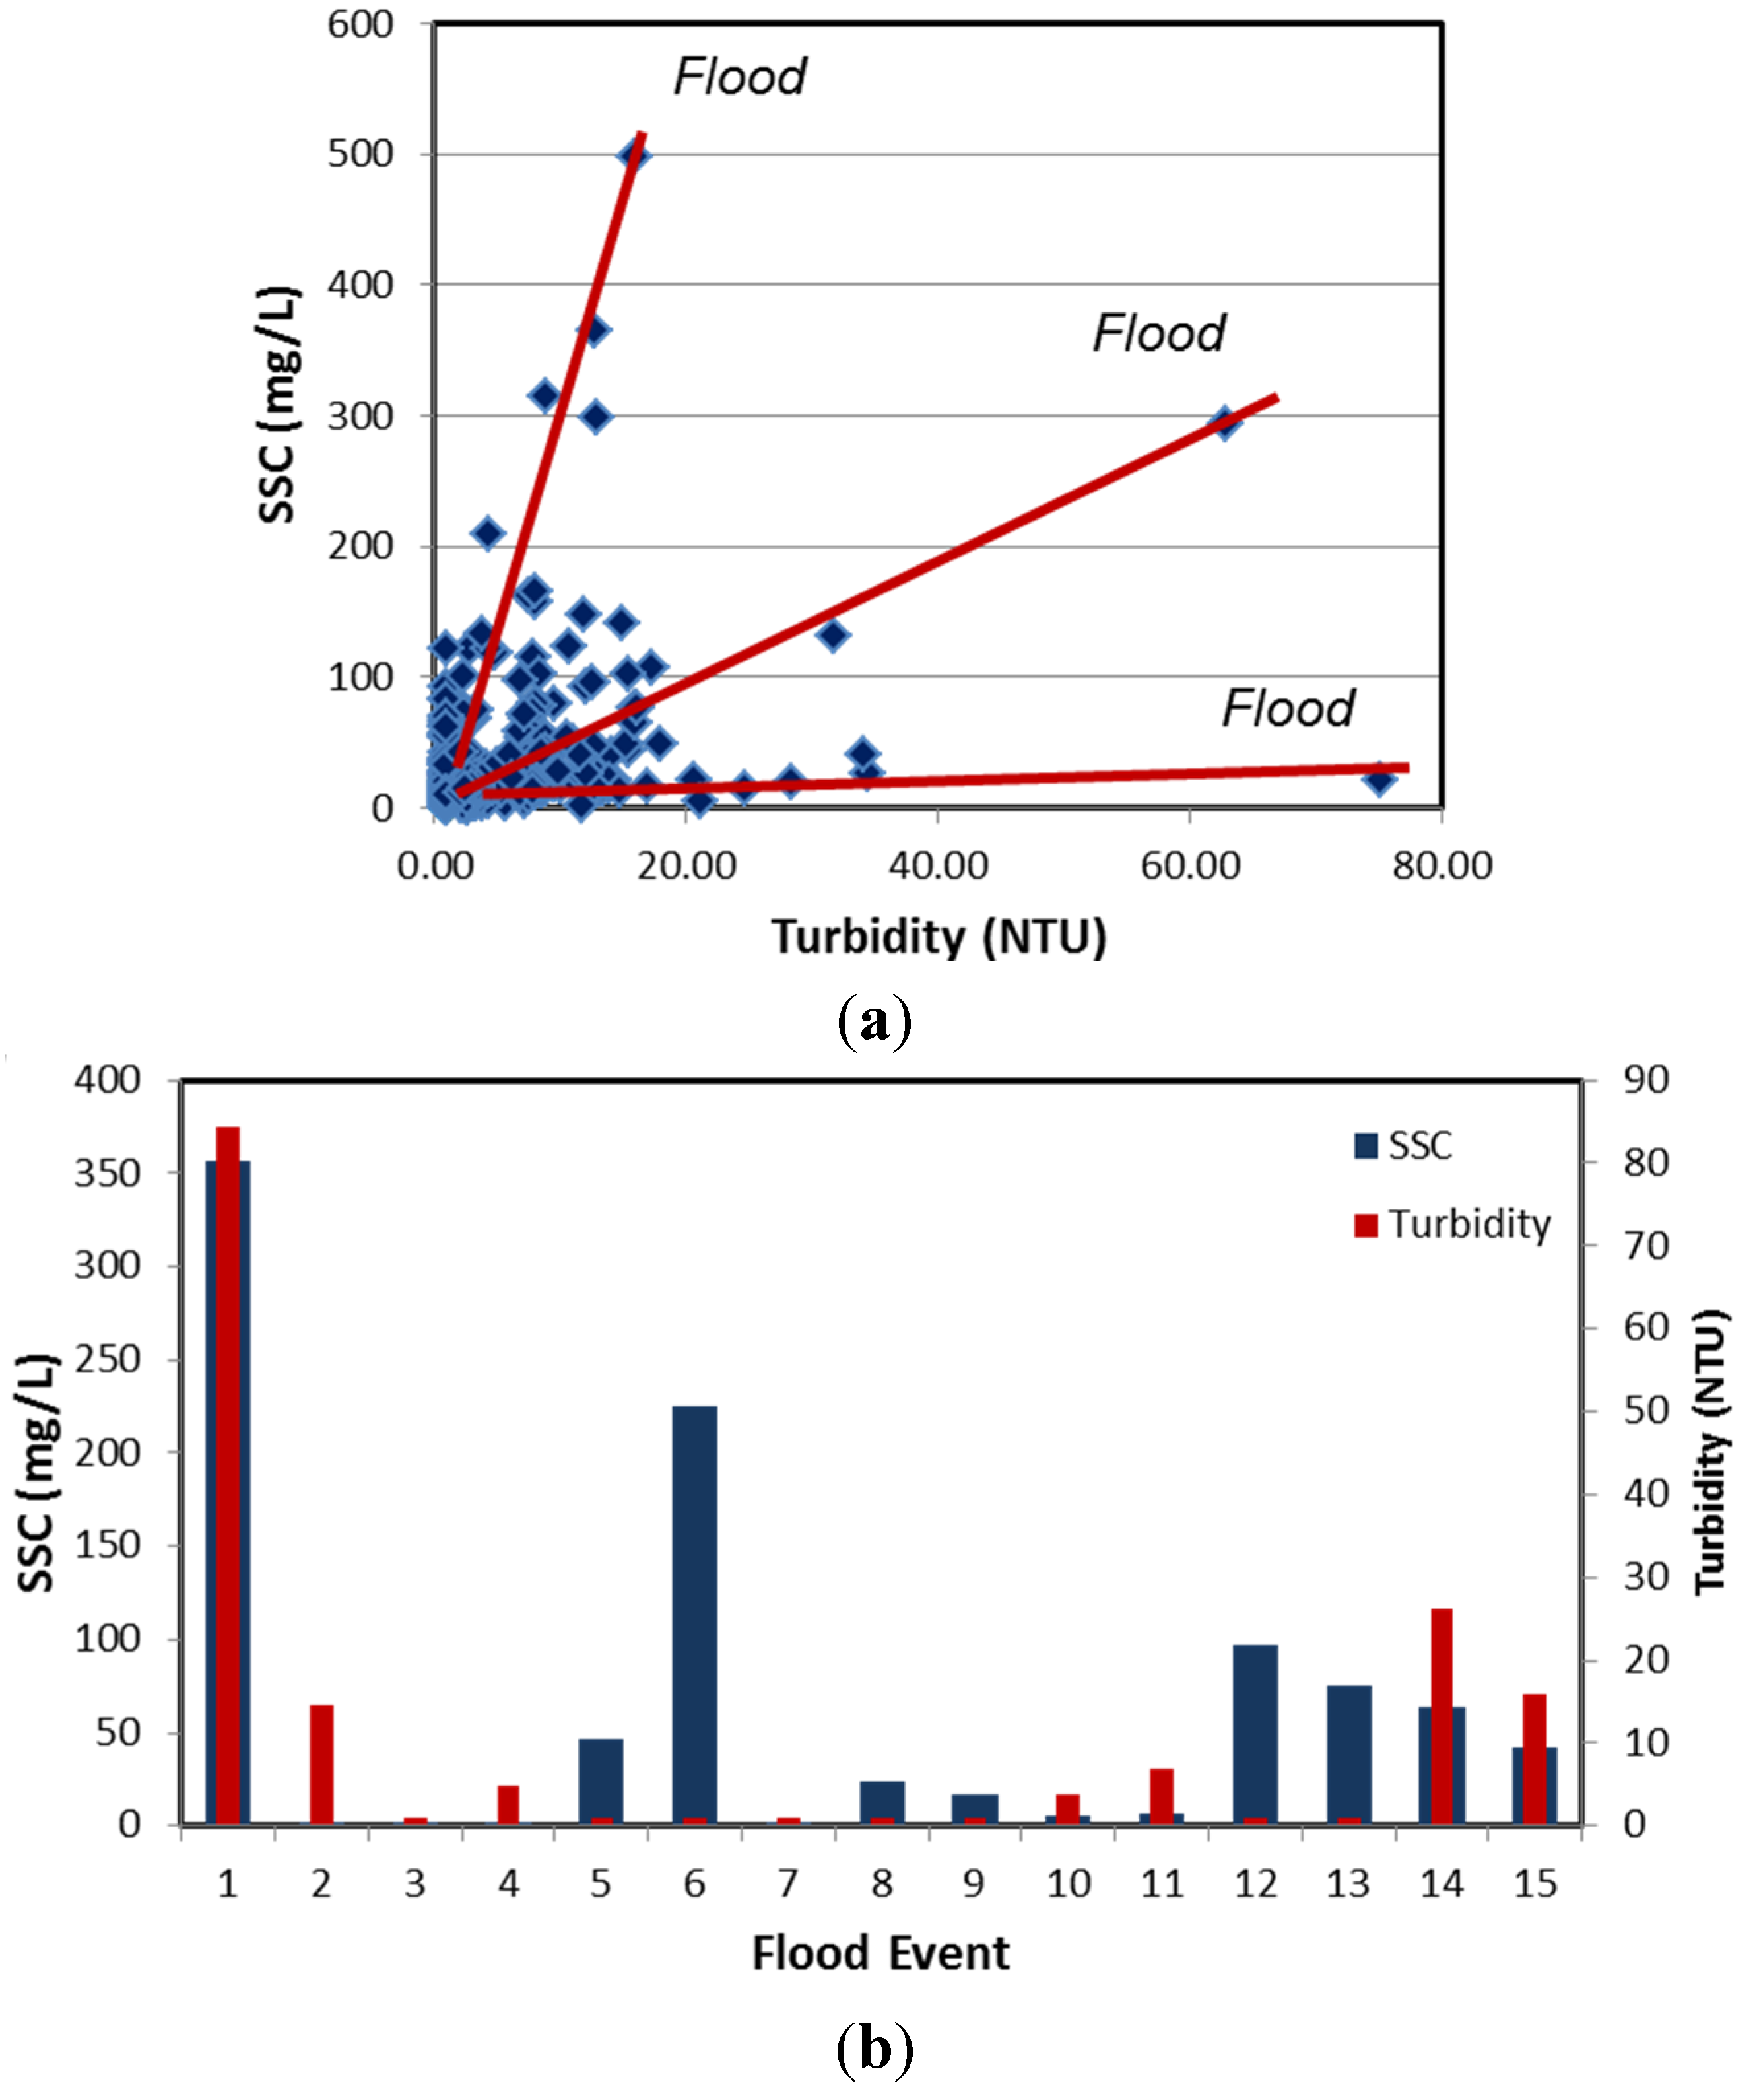
The use of turbidity as a surrogate for SSC within stream waters is based on the assumption that a direct relationship exists between the two. Although weak relationships occur between the two parameters for individual events within the Allen Creek Watershed, a statistically significant relationship between turbidity and SSC does not appear to exist at any of the monitoring sites when data from multiple events are combined (
Figure 11). This finding is not surprising given that neither SSC nor turbidity were found to increase systematically with discharge when data from multiple events were combined. It is interesting, however, that the factors controlling turbidity appear to differ from those controlling SSC. For example, the stepwise regression analysis presented earlier showed that SSC primarily varied as a function of total rainfall and maximum rainfall intensity. A similar regression approach applied to turbidity data collected at the Allen Creek #1 site for the same 69 precipitation events between March 2007 and July 2010 revealed that turbidity varied as a function stream flow (discharge, Q) and rainfall duration (RD) as expressed by:
Figure 11.
(a) Relationships between SSC and turbidity at the Old Bald #1 site (n = 511). Values are plotted in arithmetic scale to more effectively show that different relationships occur between events; (b) Peak SSC and turbidity values measured during 15 separate floods at the Allen Creek site between March 2008 and July 2010. Note that some precipitation events initiate a response in SSC, some a response in turbidity, and others a response in both.
As was the case for SSC, the influence of the examined hydrologic/meteorological parameters on turbidity was found to be rather weak, explaining less than 23% of the variation in turbidity (in spite of the fact that the regression was statically significant, p = 0.05).
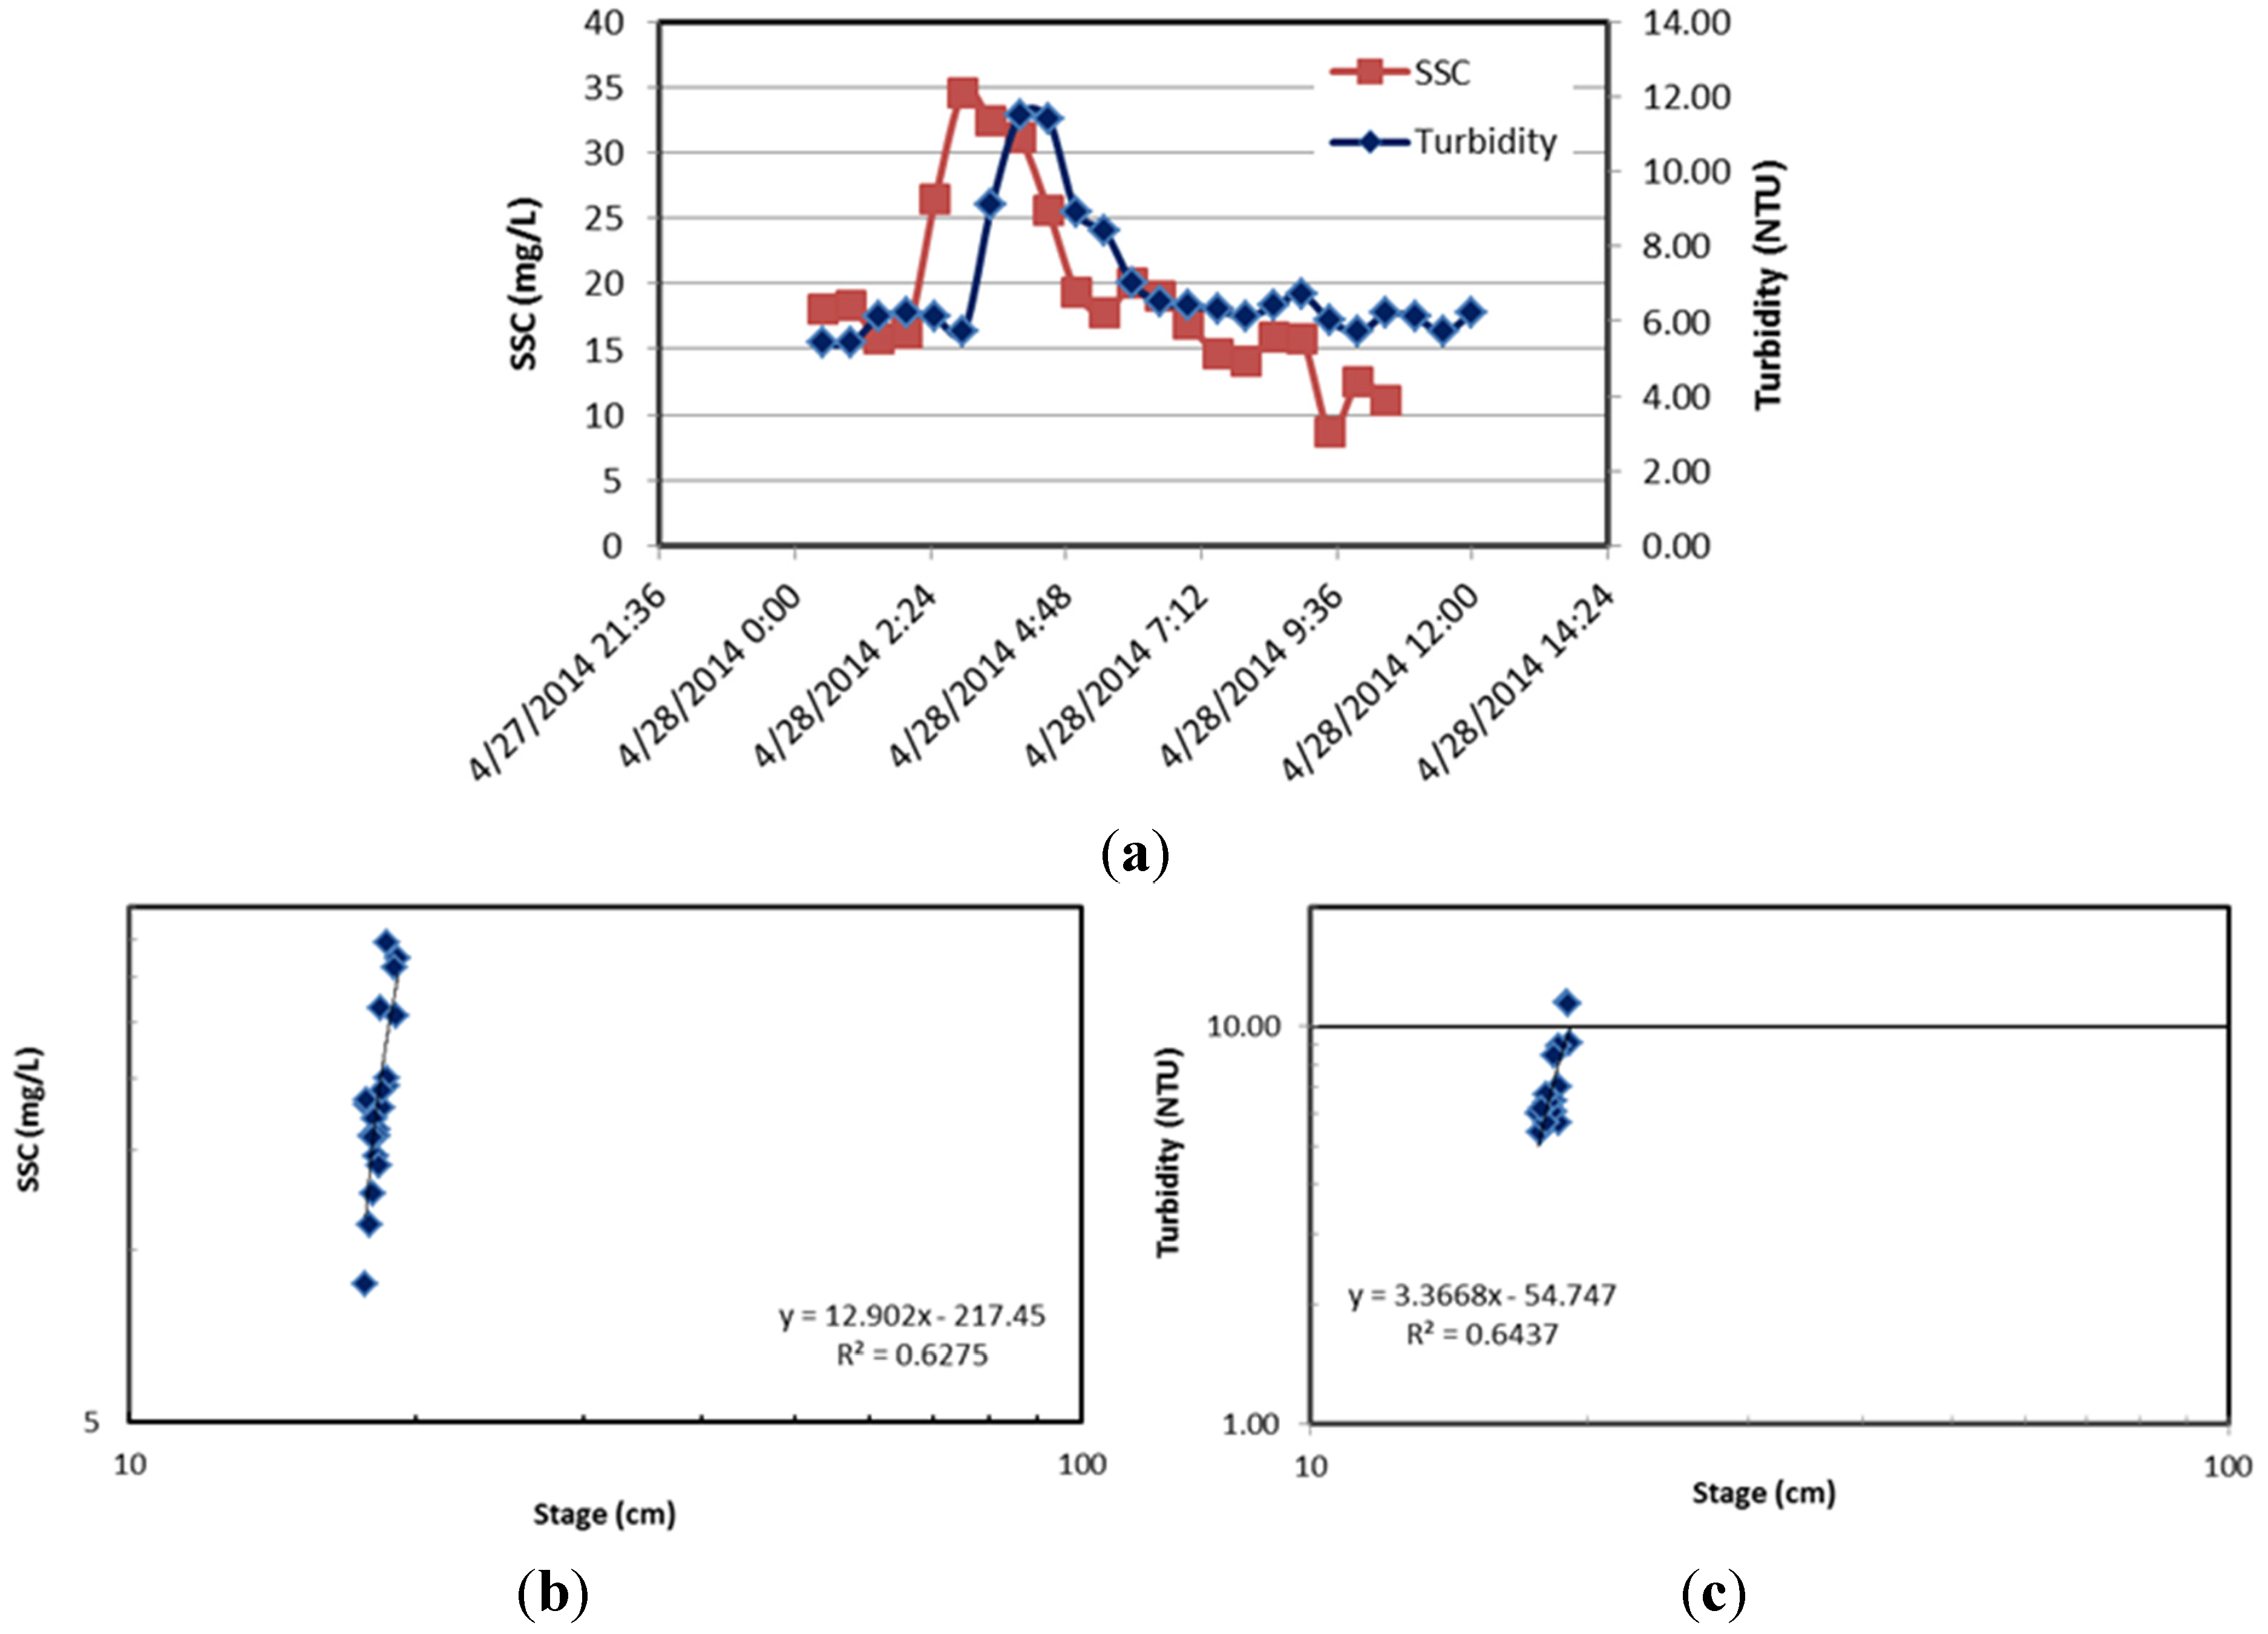
Perhaps more importantly, the source of the suspended sediment and turbidity within the channel at all of the monitoring sites appear to differ. For instance,
Figure 12a shows that peak SSC and peak turbidity values may occur at different times during a precipitation event, a phenomenon that was often observed at the monitoring sites. As a result, runoff events were, in many instances, characterized by contrasting hysteretic loops for turbidity and SSC (
Figure 7). Moreover, the magnitude of the response in SSC and turbidity varied between events (
Figure 12). In some cases, a significant response in SSC was characterized by a limited response in turbidity, while in other instances, a notably increase in turbidity was associated with little if any measureable increase in SSC (
Figure 12b).
Figure 12.
(a) Time series showing the differences in the timing of peak SSC and turbidity values measured for a flood at the Old Bald Creek #3 site, 27–28 April 2014; Semi-systematic variations in SSC (b) and turbidity (c) occurred during the event. Differences in the timing of peak SSC and turbidity suggests changes in water clarity results from a factor(s) other than suspended sediment.
While the suspended sediment within most rivers, including the Allen Creek drainage system, is dominated by inorganic mineral matter derived from the weathering and erosion of rocks and soils [
12], the sources of turbidity may be highly complex. Turbidity causing particulates range from 0.001 to 1.0 μm in diameter and, thus, include colloidal particles. Compositionally, the particles may not only consist of inorganic substances, but (1) biological materials associated with algae, cyanobacteria, zooplankton as well as various types of biofilms [
53,
54]; and (2) natural organic matter (NOM) derived from the breakdown of vegetation [
55]. The latter, NOM (e.g., fulvic and humic acids), are hydrophilic in nature, and some of these organic constituents may be dissolved within the riverine waters [
55].
Field observations made during rainfall events characterized by low SSC, but relatively high turbidity values suggest that the increasing turbidity was associated with a darkening of the water. A number of investigators have suggested that dissolved organic carbon (DOC) may be flushed into the river during flood events as elevated water tables mobilize DOC from organic rich soil horizons within the near channel deposits [
56,
57,
58,
59]. DOC may also be derived from hillslope soil horizons [
60,
61,
62] as water tables rise into the organic-rich surface layers, or from hillslope soils that receive runoff from bedrock outcrops covered in organic matter [
63]. Thus, we hypothesis that the darkening of the river water was associated with the influx of NOM via runoff through the organic litter layer at the forest floor or through the shallow groundwater system. The influx of DOC during an event is consistent with the results of the previously described regression analysis. The analysis suggests that rainfall intensity serves as an important control on SSC, presumably because higher intensities are more likely to generate overland flows capable of transporting sediment from upland areas to the channel. In contrast, turbidity was positively related to discharge magnitude and negatively related to rainfall duration. Rainfall intensity was not identified as an important parameter, suggesting the discharges associated with elevated water tables, but which are not necessarily associated with intense overland flows may generate high turbidity values.
Regardless of the source of the constituents that cause an increase in turbidity, it is clear that turbidity is not a perfect surrogate of SSC within the Allen Creek watershed, especially when SSC is low. Thus, the use of turbidity measurements to assess the movement of sediment from areas subjected to forest treatments must be used with caution.
3.5. Implications to Watershed Recovery
Watershed recovery can be viewed from a biotic, hydrologic, or geomorphic perspective. Even within a given topical area the term recovery has been defined in different ways depending on the nature and objectives of the investigation. For example, the geomorphic recovery of the fluvial system to catastrophic flooding has been defined in terms of the timing and processes involved in floodplain reconstruction [
64,
65], modifications in channel form (width, depth, width/depth ratio, slope,
etc.), and changes in sediment loads following the event [
66,
67,
68,
69,
70]. Here we primarily focus on the recovery of sediment loads to pre-disturbance conditions where the disturbance is taken to be the various episodes of logging activity that occurred within the Allen Creek watershed.
The quantitative analysis of pre- and post-disturbance sediment loads is an impossible task as pre-logging data are absent. From a qualitative perspective, written and oral histories for the region as a whole as well as for the Allen Creek basin suggest that hillslopes were characterized by numerous deep gully systems that delivered considerable sediment to the channel [
71]. Glenn [
72], for example, described the general conditions of the terrain in the Waynesville area as follows:
“Waynesville is situated on a part of the old Asheville plateau that has been dissected by the river and its tributaries in the same manner as the region about Asheville has been dissected. The soils are eroding much as they are elsewhere on this old plateau. From Waynesville eastward to Davis Gap much of the country is cleared. The surface is rolling to hilly and eroded areas occur here and there. In the gap itself, especially on the West side, the lands have been badly gullied.”
Further west near Balsam Gap (located about 10 km from Allen Creek), Glenn [
72] states that,
“40 per cent of the steeply rounded hills at the head of Scott Creek have been cleared. Many of these cleared areas have been cultivated for years and have become deeply gullied. A large number of such gullied fields have been abandoned, and in numerous places nature has not yet succeeded in repairing the damages wrought by man, so that the bare red clay surface on these scarred hillsides is becoming constantly larger, and new fields are being cleared whose ultimate fate will be the same as that of these eroded areas.”
It is hard to imagine a scenario in which extensive cutting within the Allen Creek watershed, followed by the use of splash dams, skid trails, and channel diversions would not significantly increased sediment loads. In fact, during the early 1900s the region’s severe erosional problems combined with a perception of enhanced flooding had gained national attention [
71] and was the impetus for the Weeks and subsequent Clark-McNary Acts that allowed the public purchase of private lands. The existence of elevated sediment loads is supported by the occurrence of legacy sediments that bury pre-disturbance floodplain soils along the major downstream drainages in the area. For example, along Richland Creek (to which Allen Creek is a tributary), approximately 50 cm of sediment was found to bury older floodplain deposits. These younger sediments were found to exhibit a
206Pb/
207Pb isotopic ratio that was similar to that of lead-arsenate used as a pesticide on apple orchards in the basin between approximately 1903 and 1950 [
73]. Thus, these deposits are thought to represent a period of elevated sediment loads and floodplain aggradation during the early 1900s, precisely when major logging occurred within the Richland Creek Watershed, including Allen Creek, one of its major tributaries.
Data collected from other tributary basins to Richland Creek, but which contain extensive areas of agriculture and housing developments provide additional insights into the magnitude to which SSC may have been increased during logging. For example, water quality samples collected during low- to moderate-sized floods between 3 October and 20 December 2011 at a monitoring station located on Raccoon Creek exhibited SSC values exceeding 1000 mg/L during three separate events. Maximum concentrations exceeded 5000 mg/L during one of the events, an order of magnitude higher than the maximum SSC recorded in Allen Creek. Turbidity values within this more developed basin are also higher by about a factor of 10. During the same period, SSC exceeded 1000 mg/L on one occasion and 75 mg/L on two separate occasions within the Jones Cove basin (also a tributary to Richland Creek).
In light of the above, it appears that suspended sediment concentrations have declined significantly since major logging operations occurred in the Allen Creek Basin. In fact, the reduction appears to be such that SSC is on par with, or below, those suggested as “reference” values for stable streams in the Blue Ridge ecoregion as defined by Simon and Klimetz [
44]. The reference concentration was defined as the concentration associated with floods of a specific magnitude and frequency, and was based on regional gaging station data. As mentioned earlier, the lack of long-term runoff data and an inability to develop SSC
vs. discharge relationships inhibited the application of a similar approach to the Allen Creek data. However, it is worth noting that the reference concentration for the 99th percentile storm event (those with flows that are exceeded 1% of the time, or 3.65 days per year) was determined by Simon and Klimetz [
44] to be 57.1 mg/L for the Blue Ridge ecoregion. SSC exceeded this 57.1 mg/L reference value at the Allen Creek #1 monitoring site during 11 of the 69 floods recorded between March 2007 and July 2010, or about 3 times per year on average. During these storms the reference value was exceeded for a total of less than 10 h on average (
Figure 5). In addition, the maximum measured concentration of suspended sediments (about 140 mg/L) was well below a maximum of approximately 400 mg/L reported on the plots presented by Simon and Klimetz [
44]. In summary, then, suspended sediment loads appear to be relatively low within the Allen Creek watershed and are below those that have been considered to be reference values for other stable streams in the area.
The reduction of sediment influx to the Allen Creek drainage system since major logging in the basin is consistent with recent geomorphic and biological assessments of aquatic habitat within the Allen Creek Watershed. While these assessments will be presented in more detail in another paper, it is important to note that they show that channels have recovered from their presumably disrupted state such that they are now geomorphically stable along most parts of the drainage network (
Figure 8b,c), and characterized by a wide range of aquatic habitats (
Table 2) and bed material sizes (
Table 3). Fine-grained (silt-, clay-, and fine sand-sized) sediment comprises less than 5% of the bed material. In addition, a biological assessment conducted by Martin [
74] led to the conclusion that streams within the watershed are “
very well suited for cold water macroinvertebrates and fish”…and “
there was sufficient gravel of appropriate sizes for brook trout spawning”.
Table 2.
Frequency distribution of aquatic habitats shown as a percent of the total surveyed area of channel bed recorded at the three upstream monitoring sites.
Table 2.
Frequency distribution of aquatic habitats shown as a percent of the total surveyed area of channel bed recorded at the three upstream monitoring sites.
| Habitat Type | Allen Creek #1 | Old Bald #1 | Cherry Cove #1 |
|---|
| Pool | 15.2 | 12.1 | 18.2 |
| Glide | 3.0 | 3.0 | 12.1 |
| Riffle | 42.4 | 51.5 | 45.5 |
| Rapid | 27.3 | 30.3 | 21.2 |
| Cascade | 12.1 | 3.0 | 3.0 |
Table 3.
Grain size distribution within the channel bed at the three upstream monitoring sites (sizes given in mm).
Table 3.
Grain size distribution within the channel bed at the three upstream monitoring sites (sizes given in mm).
| Grain Size (mm) | Allen Creek | Old Bald #1 | Cherry Cove #1 |
|---|
| D16 | 35.0 | 23.8 | 12.2 |
| D50 | 71.9 | 105.6 | 110.0 |
| D84 | 129.6 | 170.1 | 175.5 |
The majority of the suspended sediment transported through the channel network appears to be derived from upland areas, rather than the channel banks. With the exception of the lower 2 km of Allen Creek (immediately upstream of the reservoir), there is little physical evidence of bank erosion; rather the banks are typically covered in dense vegetation. Along the lower reach of Allen Creek, the channel is currently incising, but the depth of incision, and the upstream migration of the incised zone is limited by bedrock outcrops that locally create knickpoints. As noted in the introduction, a common geomorphic response to European settlement was channel bed aggradation during periods of intense upland erosion followed by channel incision. Bank erosion that accompanies the formation of the incised channels often serves as a important source of suspended sediment to the channel. In the case of Allen Creek, it is unclear whether channel incision is related to a reduction in sediment loads that accompanied reforestation of the basin, or to one of the many other disturbances that occurred in the watershed. However, bank erosion within these steep headwater areas does not appear to be a significant source of sediment to the channel at the present time.
Is possible that both spatial and temporal variations in sediment loads (SSC and turbidity) are related in part to natural processes, such as mass wasting events (land-slides, debris flows, etc.). Both landslides and debris flows have been identified within the Allen Creek watershed, particularly within small, high elevation basins. However, based on soil development, lichen cover on boulders and berms, tree cover, and stratigraphic relationships with axial channel deposits, these features appear to either predate logging activity or to have occurred during the period of logging. A number of the debris flows appear to be a few thousand years old. Thus, it is unlikely that these natural processes contributed to the observed variations in SSC or turbidity during the monitoring period, or could explain the declines in sediment loads since logging occurred.
The apparent recovery of Allen Creek in terms of suspended sediment loads and bed material composition is undoubtedly related in part to the revegetation of the watershed; about 95% of the watershed is now forested, and densely vegetated riparian buffers exist along most streams. It is also due to man-made changes in channel and valley morphology that significant decreases the physical, hydrological, and sedimentological connectivity of hillslopes and tributaries to the axial channel. Ironically, these long-term effects on connectivity will limit the transport of sediment from upland areas to the channel during subsequent forest treatments, and reduce the risk that such treatments will negatively impact water quality.


