Article

Effects of Land Use and Climate Change on Groundwater and Ecosystems at the Middle Reaches of the Tarim River Using the MIKE SHE Integrated Hydrological Model

1
DHI-WASY GmbH, Branch Office Munich, Breslauer Weg 74, Geretsried 82538, Germany
2
Hydrology and River Basin Management, Technical University of Munich (TUM), Arcisstrasse 21, Munich 80333, Germany
3
Key Laboratory of Oasis Ecology, Xinjiang University, Sheng Li Road 14, Urumqi, Xinjiang 830046, China
4
Faculty of Geography and Mathematics, Catholic University of Eichstätt-Ingolstadt, Ostenstraße 14, Eichstätt 85071, Germany
*
Author to whom correspondence should be addressed.
Water 2015, 7(6), 3040-3056; https://doi.org/10.3390/w7063040
Submission received: 28 April 2015 / Revised: 10 June 2015 / Accepted: 11 June 2015 / Published: 19 June 2015

Abstract

:
The Tarim basin is a unique ecosystem. The water from the Tarim River supports both wildlife and humans. To analyze the effects of both land use and climate changes on groundwater, a research site was established at Yingibazar, which is a river oasis along the middle section of the Tarim River. A hydrological survey was performed to assess the general water cycle in this area with special emphasis on groundwater replenishment as well as the impact of agricultural irrigation on the riparian natural vegetation with respect to salt transport and depth of groundwater. Although high-resolution input data is scarce for this region, simulation of water cycle processes was performed using the hydrological model MIKE SHE (DHI). The results of the calibrated model show that natural flooding is the major contributor to groundwater recharge. There is also a close interaction between irrigated agricultural areas and the adjacent natural vegetation for groundwater levels and salinity up to 300 m away from the fields. Furthermore, the source of water used for irrigation (i.e., river and/or groundwater) has a high impact on groundwater levels and salt transportation efficiency. The ongoing expansion of agricultural areas is rapidly destroying natural vegetation, floodplains, and their natural flow paths. Our results show that more unstable annual Tarim floods will occur in the future under the background of climate change. Therefore, integrated hydrological simulations were also performed for 2050 and 2100 using MIKE SHE. The results confirm that after the glaciers melt in the Tian Shan Mountains, serious aquifer depletion and environmental degradation will occur in the area, causing great difficulties for the local people.

1. Introduction

The Tarim River (Northwest China—Xinjiang Uyghur Autonomous Region), which is one of the longest inland rivers in the world, runs along the northern fringe of the Taklamakan Desert till it reaches its final lake—the Tetema Lake. The Tarim River is mainly fed by mountain precipitation, seasonal snow, and melting glaciers in contrast to the hyper-arid conditions that prevail at the center of the sand desert, which has a mean annual precipitation of approximately 50 mm and potential evapotranspiration of up to 2200 mm per year. To support vegetation and farming in particular, people rely on water either from the Tarim River itself or from the limited local groundwater resources, which are currently used without constraints. The groundwater recharge is highly dependent on the annual massive Tarim floods as water only infiltrates the floodplains and replenishes the subsurface water storage on these occasions [1]. However, over the past five decades, the intense exploitation of water resources, mainly through agriculture and embankments at the upper and middle stretches of the Tarim River, has changed the temporal and spatial distribution of water resources, causing serious environmental problems in the Tarim River basin [2,3]. The ecosystems and ecological processes that are more controlled by the natural vegetation have been more impacted by the changing extensions of the floodplains and water diversions for irrigation purposes.
There are huge floodplains that contain Tugai forests along the river. The Populus euphratica is a dominated species in this area. This kind of poplar tree is very rare and has its largest population in the Tarim basin. The forest has an important protective function: it reduces wind speed, prevents sand transport, and prevents dune movement from the Taklimakan desert [4,5]. It also helps reduce the intensity of sand or dust storms, which often adversely affects humans and wildlife in the oases in addition to damaging agricultural areas, buildings, and infrastructure. The sandstorm on 5 May 1995 that hit northwestern China caused a loss of 56 billion RMB [6]. The Tugai forest is also a source of construction material, firewood, and natural medicine [7].
The protection of the Tugai forest is of utmost importance for the region [8]. The most important factor supporting the Tugai forest is the groundwater resource, which is recharged by the Tarim River. Irrigation and reduction of floodplains by embankments affect the groundwater recharge [2]. In addition, climate change has also been influencing the discharge hydrograph of the Tarim River. With higher temperatures, glacier melting in the mountain areas will increase leading to increased flooding during the summer in the near future. However, when the melting of glaciers reaches a critical point, the floods will reduce [9,10]. The damage and possible complete destruction of the wide Tugai forest areas could be inevitable ecological consequences.
Salinization in agricultural areas is also a problem in this region. Because of the nature of the geological genesis (dry lacustrine basin) here, the groundwater level is high and has a high salinity [11,12,13]. There are almost no drainage systems in the agricultural areas to decouple the infiltrating irrigation water from the groundwater. The consequences are high soil evaporation followed by salt accumulation. The soil degradation has resulted in new fields being created, often in the Tugai forest areas.
Climatic data collected over the past 50 years clearly shows a significant trend for temperature and precipitation. This clearly indicates that climate change is taking place [14]. The land-use changes have also been significantly high. From 1990 to the present, the overall cotton production of Xinjiang increased from 5% to 30% [15]. The reason for that was a political decision to develop Xinjiang to a major cotton production center in China. To analyze the effects of future land-use and climate change on the Tugai forests, it is necessary to determine the water balance at a test site. For this, an area of 85 km2 (Figure 1) was chosen at the middle reaches of the Tarim Basin, close to the village of Yingibazar (41.18° N; 85.22° E). This area is a mixed agricultural and Tugai forest landscape, in which there are no embankments to prevent natural flooding.
Figure 1. Location of the research site at Yingibazar in the middle reaches of the Tarim River.
Water 07 03040 g001
The aim of this study is to answer the following questions:
-
How do flooding at the floodplains, irrigation water from agriculture, and seepage losses from the Tarim River influence the groundwater recharge?
-
How do irrigation areas change the hydrologic balance and are there interactions between the bordering Tugai forests and irrigation areas?
-
What consequences can be expected as a result of changing land-use in the Tugai forests and/or climate change in the near and distant future?

2. Methodology

A deterministic model was used to distinguish the different fluxes that contribute to the groundwater recharge, to analyze the interactions between agricultural areas and Tugai forests, and to calculate land-use and climate change scenarios. This was achieved through detailed integrated modeling of all the important aspects of hydrology and hydraulics. One challenge was the determination of dynamic floodings and their interactions with hydrological processes. For this analysis, high-resolution data (e.g., digital elevation model (DEM), soil data, and groundwater level) are essential. The remainder of this paper presents the data processing, model setup, calibration and validation, and results.

2.1. Data Processing

There are no spatial data available for the Yingibazar research site, and therefore data acquisition has been conducted since 2011. Field measurements of groundwater levels, soil profiles and land-use characteristics were taken and remote sensing data were used to generate high-resolution spatial data. A high-resolution database was generated by combining the field measurements with the high-resolution spatial data.
The DEM was generated using data from the Digital Globe (8 m × 8 m) World View 1 and 2 optical satellites [16]. It was corrected using control points measured with differential GPS in the project area. Since December 2011, 38 automatic groundwater monitoring stations have been installed in the study area. Data loggers (Schlumberger Cera Diver and CTD Diver) were installed which measured hourly levels of groundwater, surface water (during floods) and water temperature; 19 of them also measured electric conductivity. One data logger was installed at the Tarim River for measuring the water level of the river. The time series of the ground and surface water loggers were checked for accuracy and aggregated to daily values.
Using data from the TerraSAR-X radar satellite, the flooding was monitored every 10 days during the 2012 flood season. The actual extension of the flooding can be reproduced at the time label when the image was taken. The TerraSAR-X raw data were measured in spot mode at a resolution of 1 m × 1 m [17]. In order to correct them for shadow effects of vegetation, a correction algorithm was developed [15]. Then, maps showing the actual extent of flooding in the area were created and afterwards validated using data from the 11 surface water monitoring stations. The network of irrigation canals was mapped using an optical satellite image for March 2011 (World View). The dimensions of the cross sections and control structures were documented in the field through photogrammetry. Based on 38 soil drillings, a 3D soil model was interpolated using GIS-algorithms [18]. Continual changes of the riverbed produced a complex sedimentation that was detected in the area. The soil model has 22 layers with sandy to silty soils. The upper soils are siltier and the lower are sandier.
The nearest climate station is located in Kuqa (Station No.: 516440), approx. 125 km from Yingibazar. From June to November 2011, the climate (air temperature, humidity, wind speed, air pressure and solar radiation) was also measured in Yingibazar. By constructing correction factors between both stations, the climate data from Kuqa was extrapolated to the synthetic time series for Yingibazar. A time series for rainfall was generated using data from the TRMM satellite [19] and compared with information from climate stations. From the climate data, the potential evapotranspiration was calculated using the Penman-Monteith equation [20,21]. A land-use map was generated using information from the World View 1 optical satellite and field observations. The characteristic parameters (leaf area index (LAI), root depth, and crop factor) of the natural and agricultural vegetation were obtained from available literature [22,23,24,25,26] and remote sensing data. To generate a time series for LAI, data from the MODIS FPAR/LAI sensors on the Aqua and Terra satellites were used [27]. Irrigation techniques of the local farmers were documented by interviews, where data such as irrigation intervals, used water resources and volumes, and the irrigation technique were obtained. Most of the farmers use drip irrigation under a plastic mulch [28]. Fifteen farms with different water management techniques were detected and for each, an irrigation time series was generated [18].

2.2. Model Setup

The integrated hydrological model, MIKE SHE, was used to determine the behavior of groundwater, surface water, evapotranspiration, and irrigation (Figure 2). The MIKE SHE model was selected as it can determine the overland flow by using the 2D diffusive wave equation in a finite difference method [29]. Hence, it was possible to realistically model flooding with a high-spatial resolution. The model has already been used successfully at the Tarim River [30]. To supply water to agricultural areas, a network of irrigation channels with an overall length of over 100 km has been constructed. They are mostly unsealed and are therefore strongly connected with the groundwater. Many structures (weirs, dams and culverts) are used to control the irrigation network. To integrate the irrigation network, the 1D hydraulic model MIKE11 was coupled with MIKE SHE, which allowed all the interactions between the irrigation system and groundwater to be determined. The Kirstensen and Jensen method was used to calculate the root water uptake and the soil evaporation and transpiration of the natural vegetation and crops [31]. Coupled with this, the soil water content at the unsaturated zone was computed by solving the Richards-Equation [32,33,34]. Soil classification was performed using the soil triangle of Twarakavi [35] and the pedotransfer-function parameters were taken from the Rosetta database [36]. The groundwater was simulated by solving the 3D Darcy equation in a finite difference method [29]. It is also possible to simulate advective-dispersive processes, which makes it possible to analyze the salt fluxes in the area. Because of insufficient data, only the salinity effect of agriculture with and without irrigation was modeled theoretically using calculation differences.
MIKE SHE is a raster based model. A cell size of 30 m × 30 m was chosen to obtain an acceptable computing time and spatial resolution. The test site is not a natural catchment, therefore the boundary conditions needed to be defined carefully. The water head of the Tarim River was the southern boundary and the heads of the Chayan River were taken as the northern and north-eastern boundary. If the Chayan River dried out, the measured groundwater head was taken as the boundary. Along the western, and parts of the south-eastern, boundary, the isopiestic line was nearly orthogonal to the boundary, and therefore, a no flow boundary was chosen. The major data for the MIKE SHE setup are given in the Table 1.
Because of the huge amount of spatial data (3D geological model, DEM, land use…) it is not possible to publish all model settings in this paper. However, one can download the full MIKE SHE setup from the project webpage [37] or contact the corresponding author.
Figure 2. Schematic view of the MIKE SHE modules (DHI©, modified by Keilholz).
Water 07 03040 g002
Table 1. Parameter setup for the MIKE SHE model.
ParameterValueUnit
2D surface water
Resistance value (Manning number)15–35m1/3/s
Detention storage2mm
Initial water depth0m
Surface—subsurface leakage coefficient1 × 10−51/s
1D surface water
Resistance value Tarim foreland & canals (Manning number)35m1/3/s
Resistance value Tarim riverbed (Manning number)45m1/3/s
Evapotranspiration
Canopy interception0.05mm × LAI
Kirstensen & Jensen parameter C10.3-
Kirstensen & Jensen parameter C20.2-
Kirstensen & Jensen parameter C320mm/d
Root distribution (Aroot)0.251/m
Unsaturated & saturated zone
Percolation1 × 10−121/s
Sand (S): kf *; np **; Sy ***; Ss ****713; 0.45; 0.33; 2.66 × 10⁻⁶cm/d; -; -; 1/m
Loamy sand (LS): kf; np; Sy; Ss124; 0.46; 0.32; 2.70 × 10⁻⁶cm/d; -; -; 1/m
Sandy loam (SL): kf; np; Sy; Ss44; 0.47; 0.30; 2.73 × 10⁻⁶cm/d; -; -; 1/m
Loam (L) ): kf; np; Sy; Ss16; 0.51; 0.15; 2.92 × 10⁻⁶cm/d; -; -; 1/m
Silty loam (SiL): kf; np; Sy; Ss52; 0.51; 0.18; 2.88 × 10⁻⁶cm/d; -; -; 1/m
Silt (Si): kf; np; Sy; Ss44; 0.52; 0.14; 2.92 × 10⁻⁶cm/d; -; -; 1/m
Silty clay (SiCl): kf; np; Sy; Ss13; 0.53; 0.11; 2.96 × 10⁻⁶cm/d; -; -; 1/m
Notes: * Kf: hydraulic conductivity (cm/d); ** np: porosity (-); *** Sy: specific yield (-); **** Ss: specific storage (1/m).

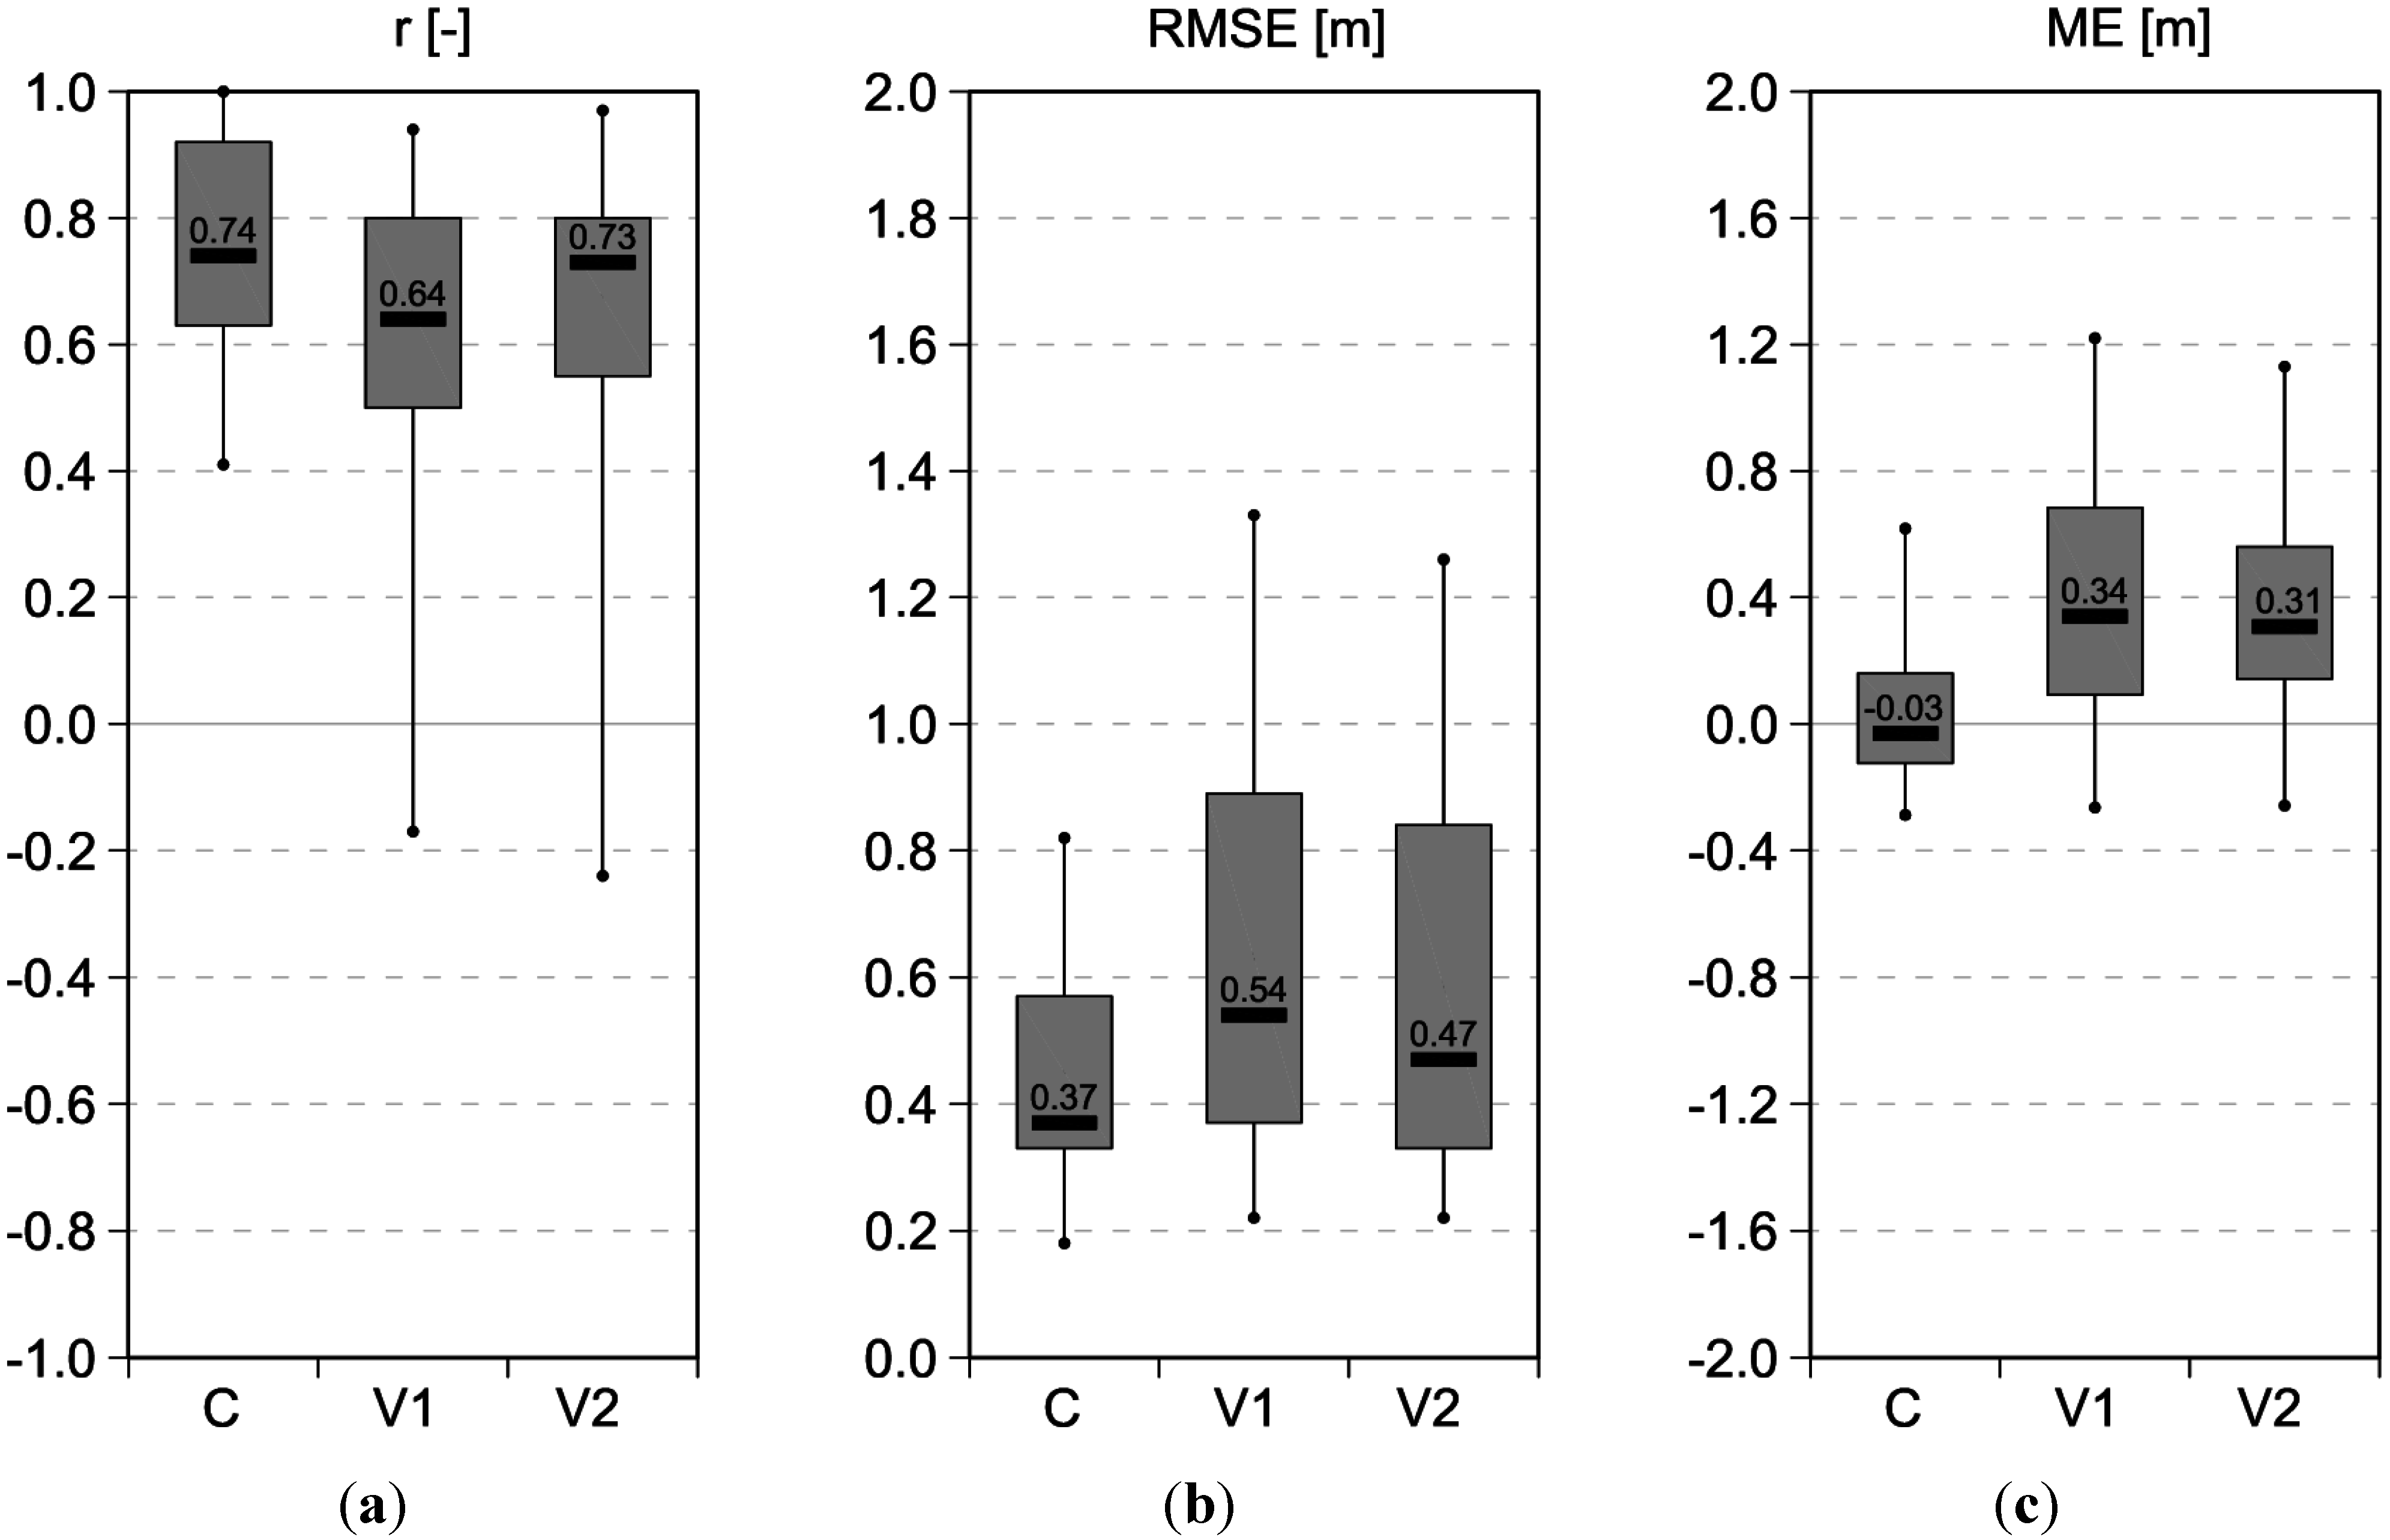
2.3. Calibration and Validation

The measured ground and surface water levels were used for calibrating the model and flood maps from TerraSAR-X were used to check the extent of flooding. The calibration process was performed in two steps. First, the surface water level during the flood events was calibrated by varying the hydraulic resistance and flow paths in the DEM. After obtaining an acceptable result, the groundwater level was also calibrated by changing the permeability of the soils. Data from the year 2012 were used for calibration and from 2013 for validation. The fitting process was evaluated through an optical comparison of the measured and simulated time series for the observation points. In addition, statistical analyses (correlation (r), mean error (ME), and root mean square error (RMSE)) were performed to evaluate the calibration and validation. In Yingibazar, the groundwater levels have quite large fluctuations up to 3 m due to flooding (overland flow). MIKE SHE is used for a 30 m cell size to get an acceptable simulation time. By aggregating the DEM from an originally 8 m cell size, an elevation uncertainty (one standard deviation) of max. 0.47 m results in the merged cells. Because of this blur, the depth to the groundwater table may be within the limit of 0.5 m. Related to this value, a RMSE of 0.25 is an acceptable value for the performance of the model. For calibration and validation, 38 and 22 monitoring wells, respectively, were used (Figure 3). The difference between calibration and validation was dependent on the loss of monitoring wells at the observation points due to new field reclamations.
Figure 3. Comparison between the calibration (C), validation without land-use changes (V1), and validation with land-use changes (V2) for correlation (a); root mean square error (b) and mean error (c).
Water 07 03040 g003
The results of the calibration show a good fit for the 38 observations points (median: r = 0.84; RMSE = 0.39 m; ME = 0.02 m), but the validation shows a difference between model performance and reality. This is because extensive land-use changes occurred in the area in the spring of 2013 (3 km2 of new cotton fields were added). In addition, modifications to the irrigation system (new channel and temporary dams) also affected the validation results. After incorporating these land-use changes into the model, the validation results for the 22 observation points were more acceptable (median: r = 0.73; RMSE = 0.47 m; ME = 0.31 m).

3. Results and Discussion

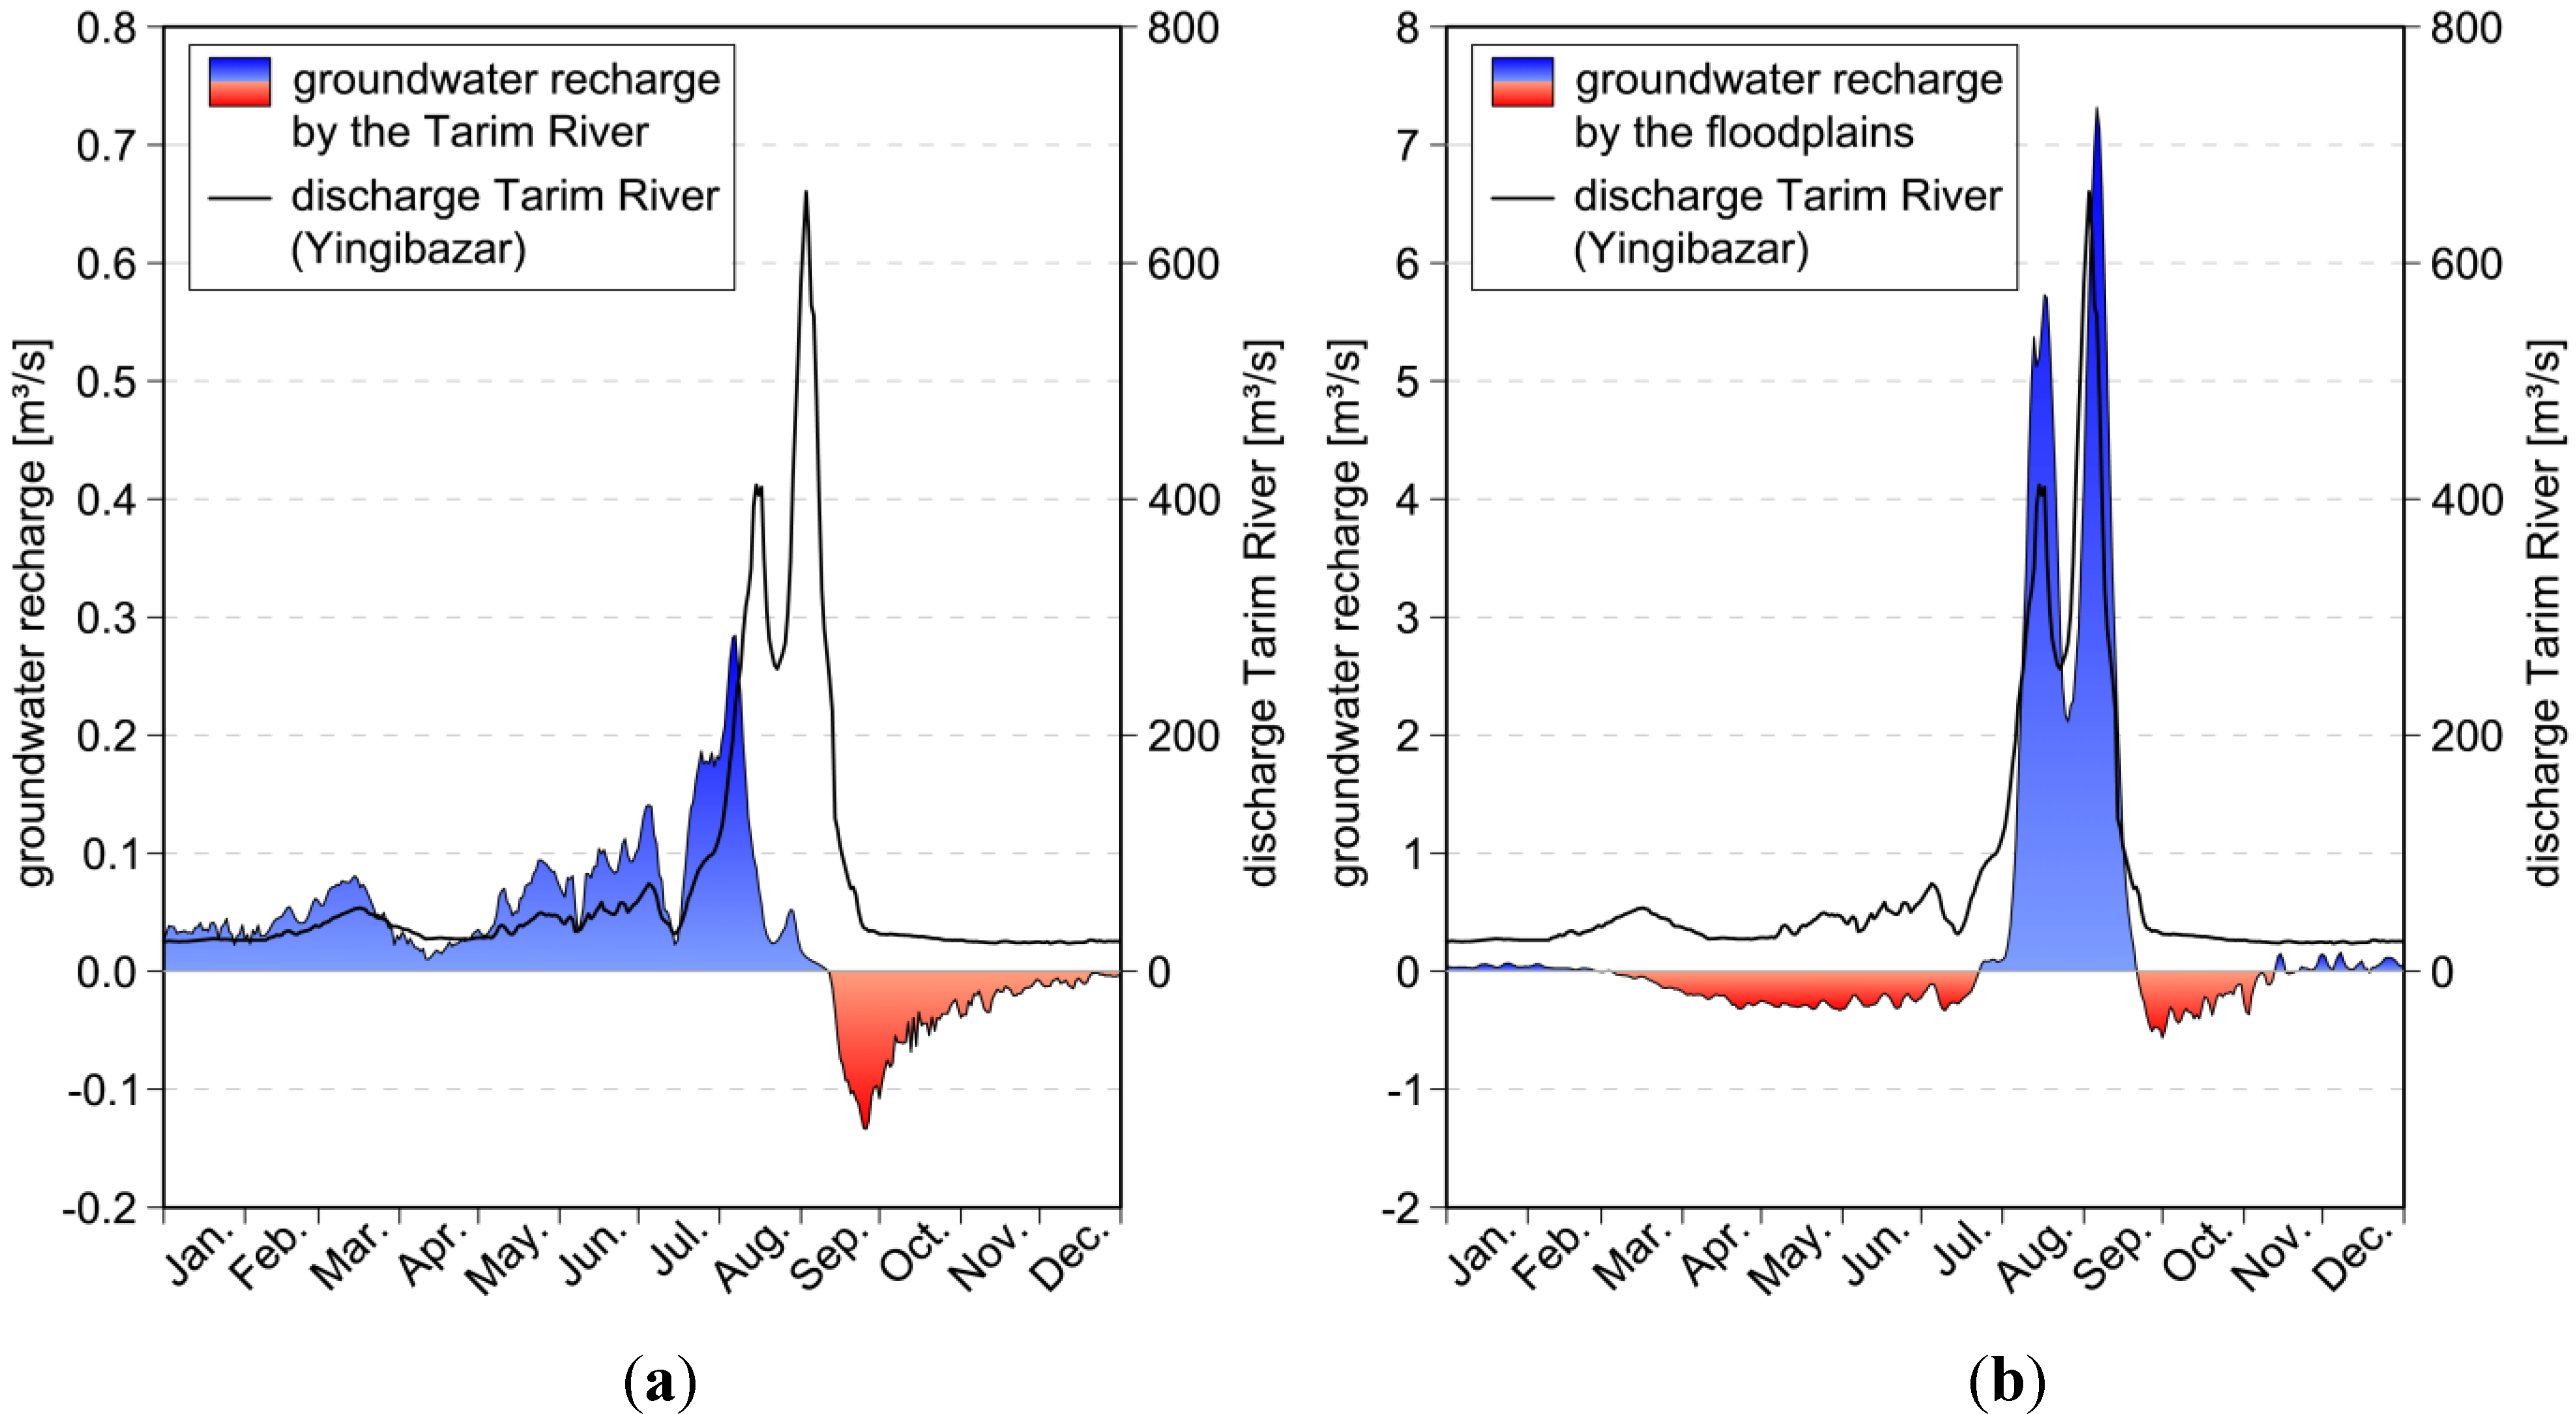
3.1. Groundwater Recharge

At the Yingibazar research site, the amount of groundwater recharge was analyzed using the calibrated model. Over 11.9 million m3 of water was recharged into the 85 km2 area. The recharge was from surface water in the floodplains (11.6 million m3), irrigation water in the agricultural areas (1.2 million m3), and leakage from the Tarim River (1.1 million m3). The natural areas that were not flooded did not contribute to the recharge. However, these areas had a negative recharge (−2.0 million m3) because the vegetation consumed groundwater which originates from the adjacent regions. The recharge rates vary according to time and are strongly dependent on the yearly flooding that happens in late summer. From January to September, there is continuous groundwater recharge from the Tarim River. When flooding begins, the recharge in the test site increases significantly due to recharge from the flood plains. After flooding, a part of the groundwater drains back into the Tarim River (Figure 4).
Figure 4. Groundwater recharge by the Tarim River (a) and floodplains (b) for the year 2012.
Water 07 03040 g004
This result shows that the extent of the flood plains, which is related to the intensity of the yearly Tarim flooding, have the highest impact on the groundwater recharge. The bordering Tugai forests along the Tarim are continuously supplied with water from the Tarim and are not in danger of facing water stress. However, if the intensity of the Tarim floods is not sufficient, the Tugai forests in the hinterland will not get sufficient water.

3.2. Interaction between Agricultural Areas and Tugai Forests

The most agriculturally intense areas in the project area have no drainage. The infiltrating water directly contributes to the groundwater recharge if the irrigation water is not taken from the groundwater. The source of irrigation water has a high influence on the change in groundwater level in the fields. If river water is used for irrigation, the gradient in the groundwater level will generate a flow from the field to the neighboring Tugai forests. If groundwater is used for irrigation, the effect is the opposite. This can affect the groundwater level (±0.5 m at the field boarder) up to a distance of 300 m from the fields. In areas where the groundwater level is not optimal for the Tugai vegetation, the agricultural areas can influence the health of the bordering natural vegetation.
In addition, the agricultural areas also affect salt transport. If groundwater is used for irrigation, salt accumulates in the soil under the fields. Because of the groundwater gradient, there is no salt transport out of the agricultural areas. If fresh river water is used for irrigation, salt is leached from the fields and a part is transported away from the fields. This increases the salinity in the neighboring natural areas when they are not leached by natural flooding (Figure 5).
Figure 5. Changes in salt concentration and groundwater levels at transition zones when the irrigation water is used from local groundwater resources (a) or from the Tarim River (b).
Water 07 03040 g005
The consequences of agricultural areas on the bordering natural areas can be described as follows. Salt concentration and groundwater level have opposing effects. In other words, if a field is irrigated by river water both the neighboring Tugai forest and its salt-resistant natural vegetation (Tamarix spp., Populus euphratica, etc.) will benefit. Additionally, the irrigated areas, which are leached by flooding, will contain lesser salt concentrations. An ecologically-sensitive land-use is possible if the following points are observed:
-
Agricultural areas should not be located in floodplains, because they adversely affect the extent of flooding.
-
Agricultural areas should be integrated with natural vegetation and not the other way around. The Tugai forests can benefit from the presence of small, but not connected, irrigation areas.
-
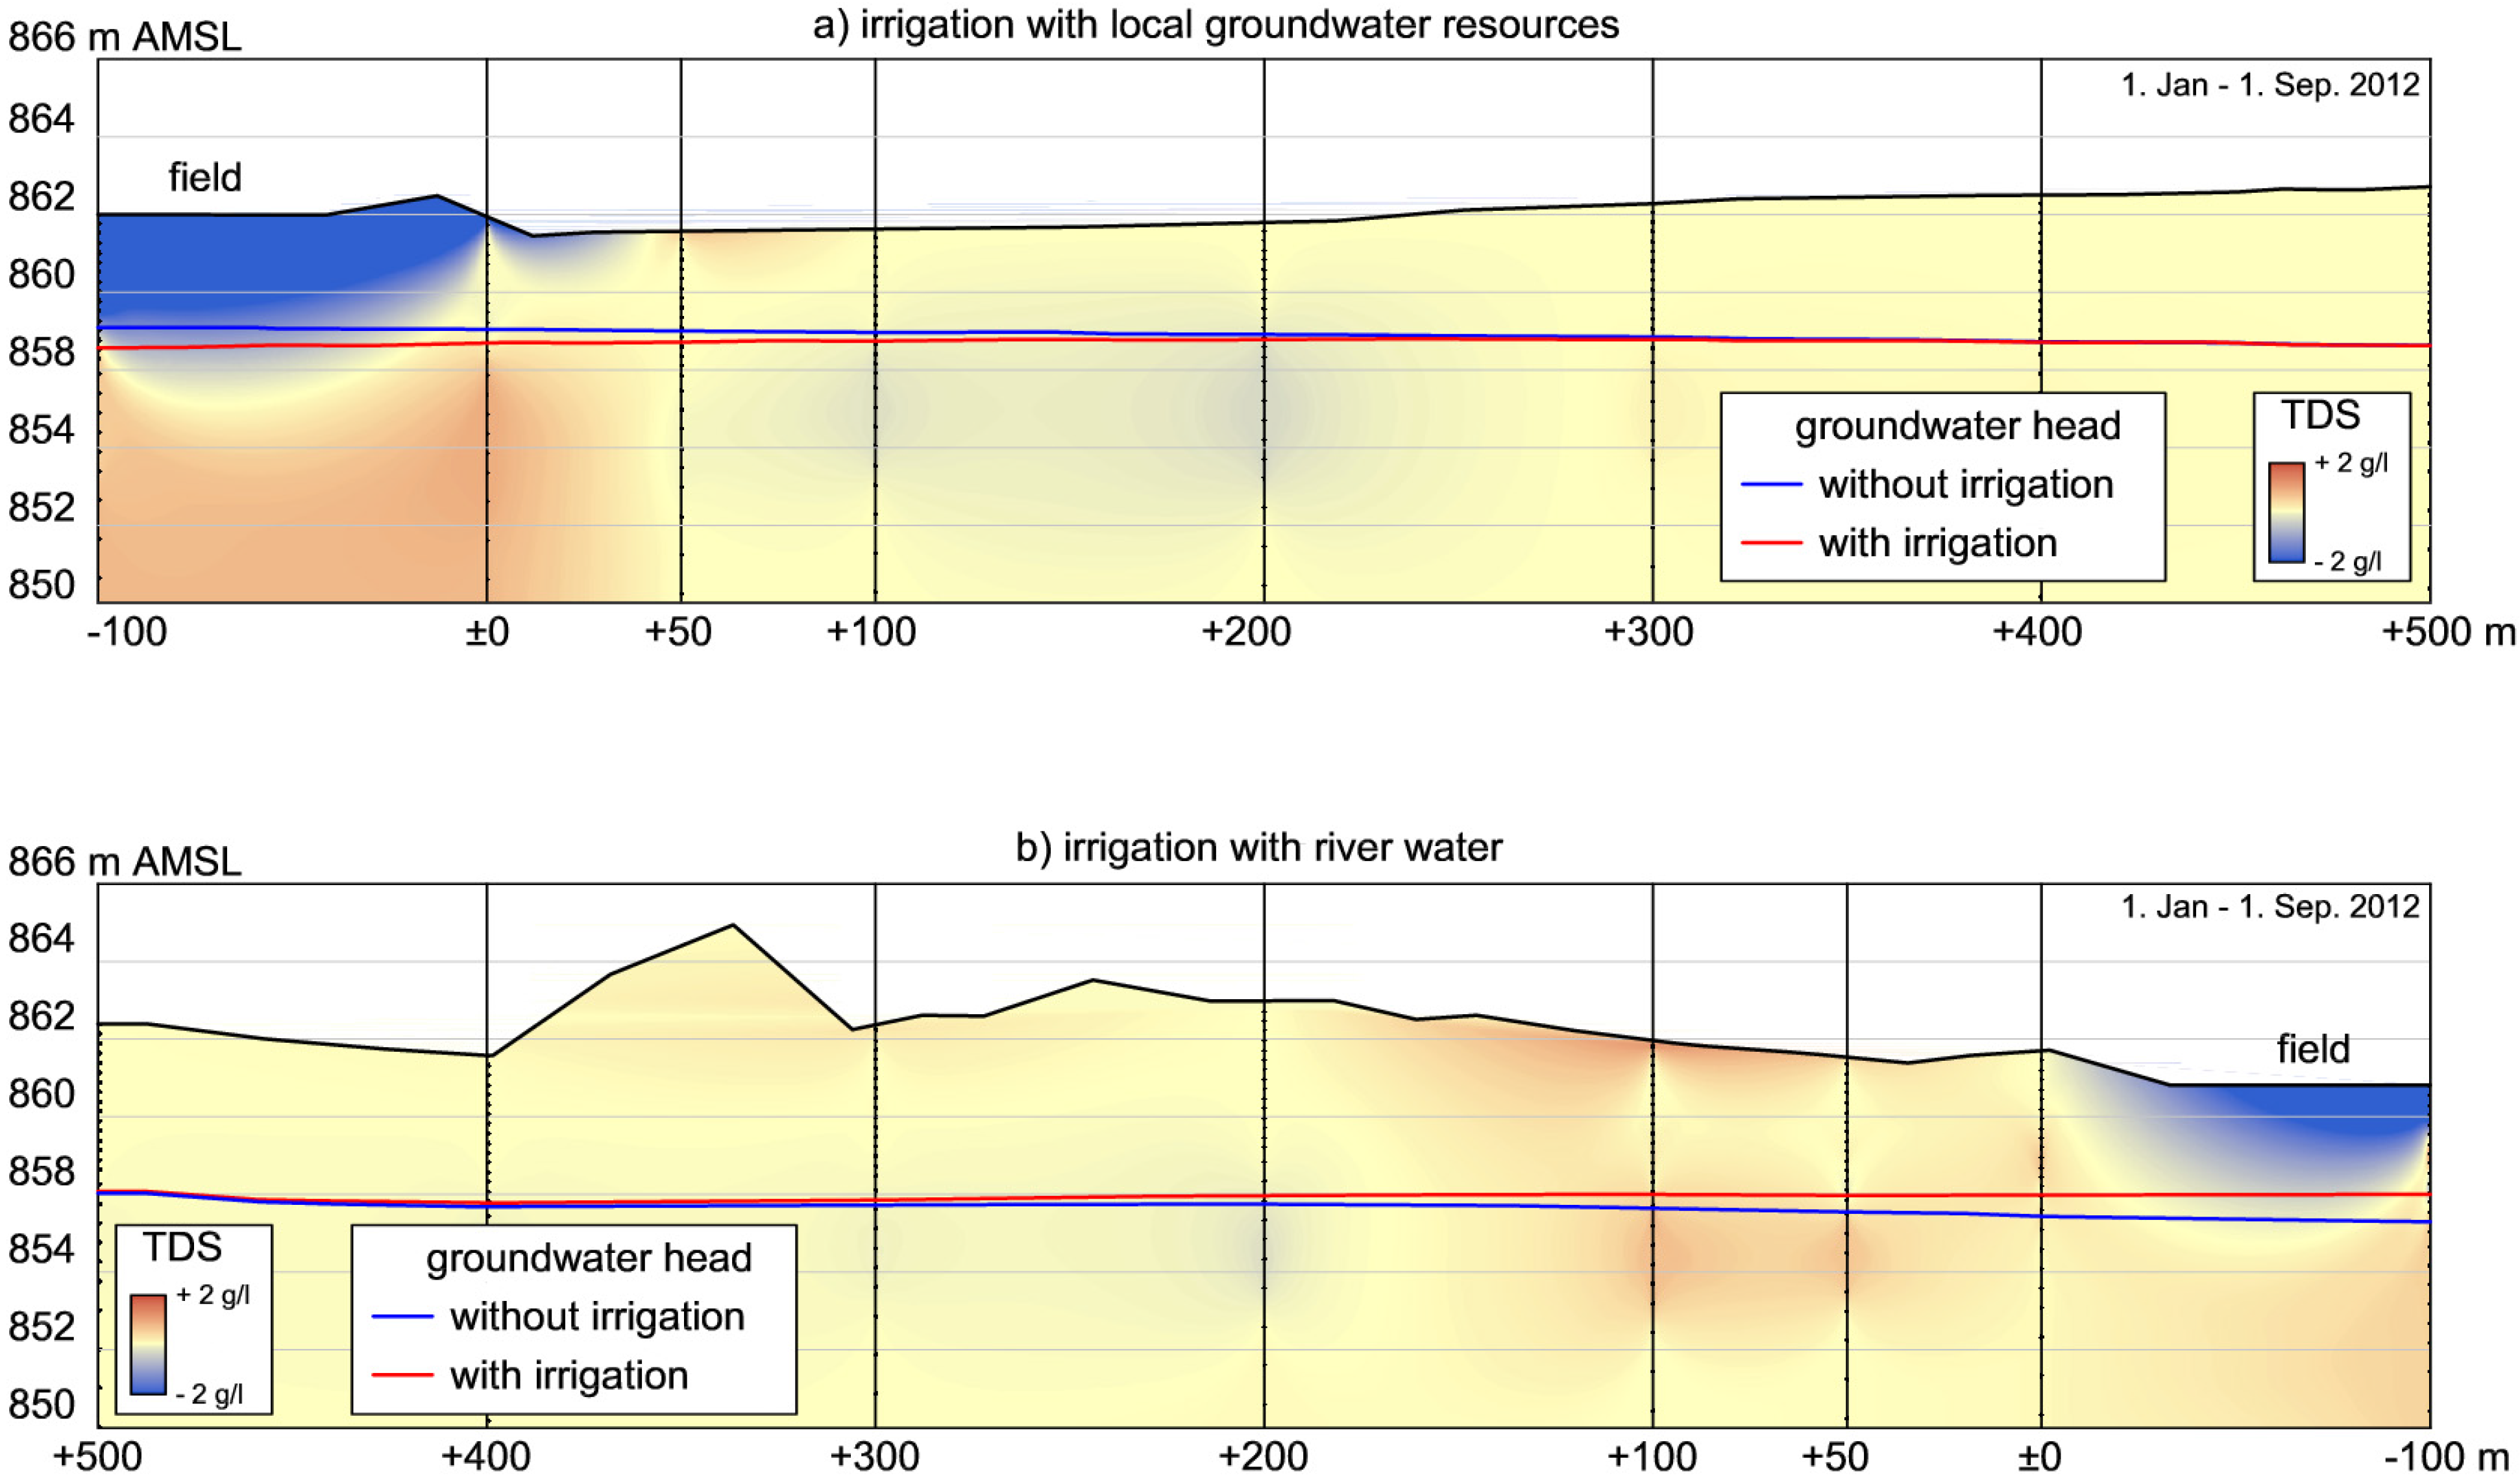
Using a combined water management strategy for managing the ground and surface water, negative impacts to the ecosystem can be reduced. If, for example, groundwater is used for irrigation in summer, the aquifer can be filled-up by leaching the fields with river water.
-
Drainage systems can reduce the salinization at agricultural areas with high natural groundwater tables.
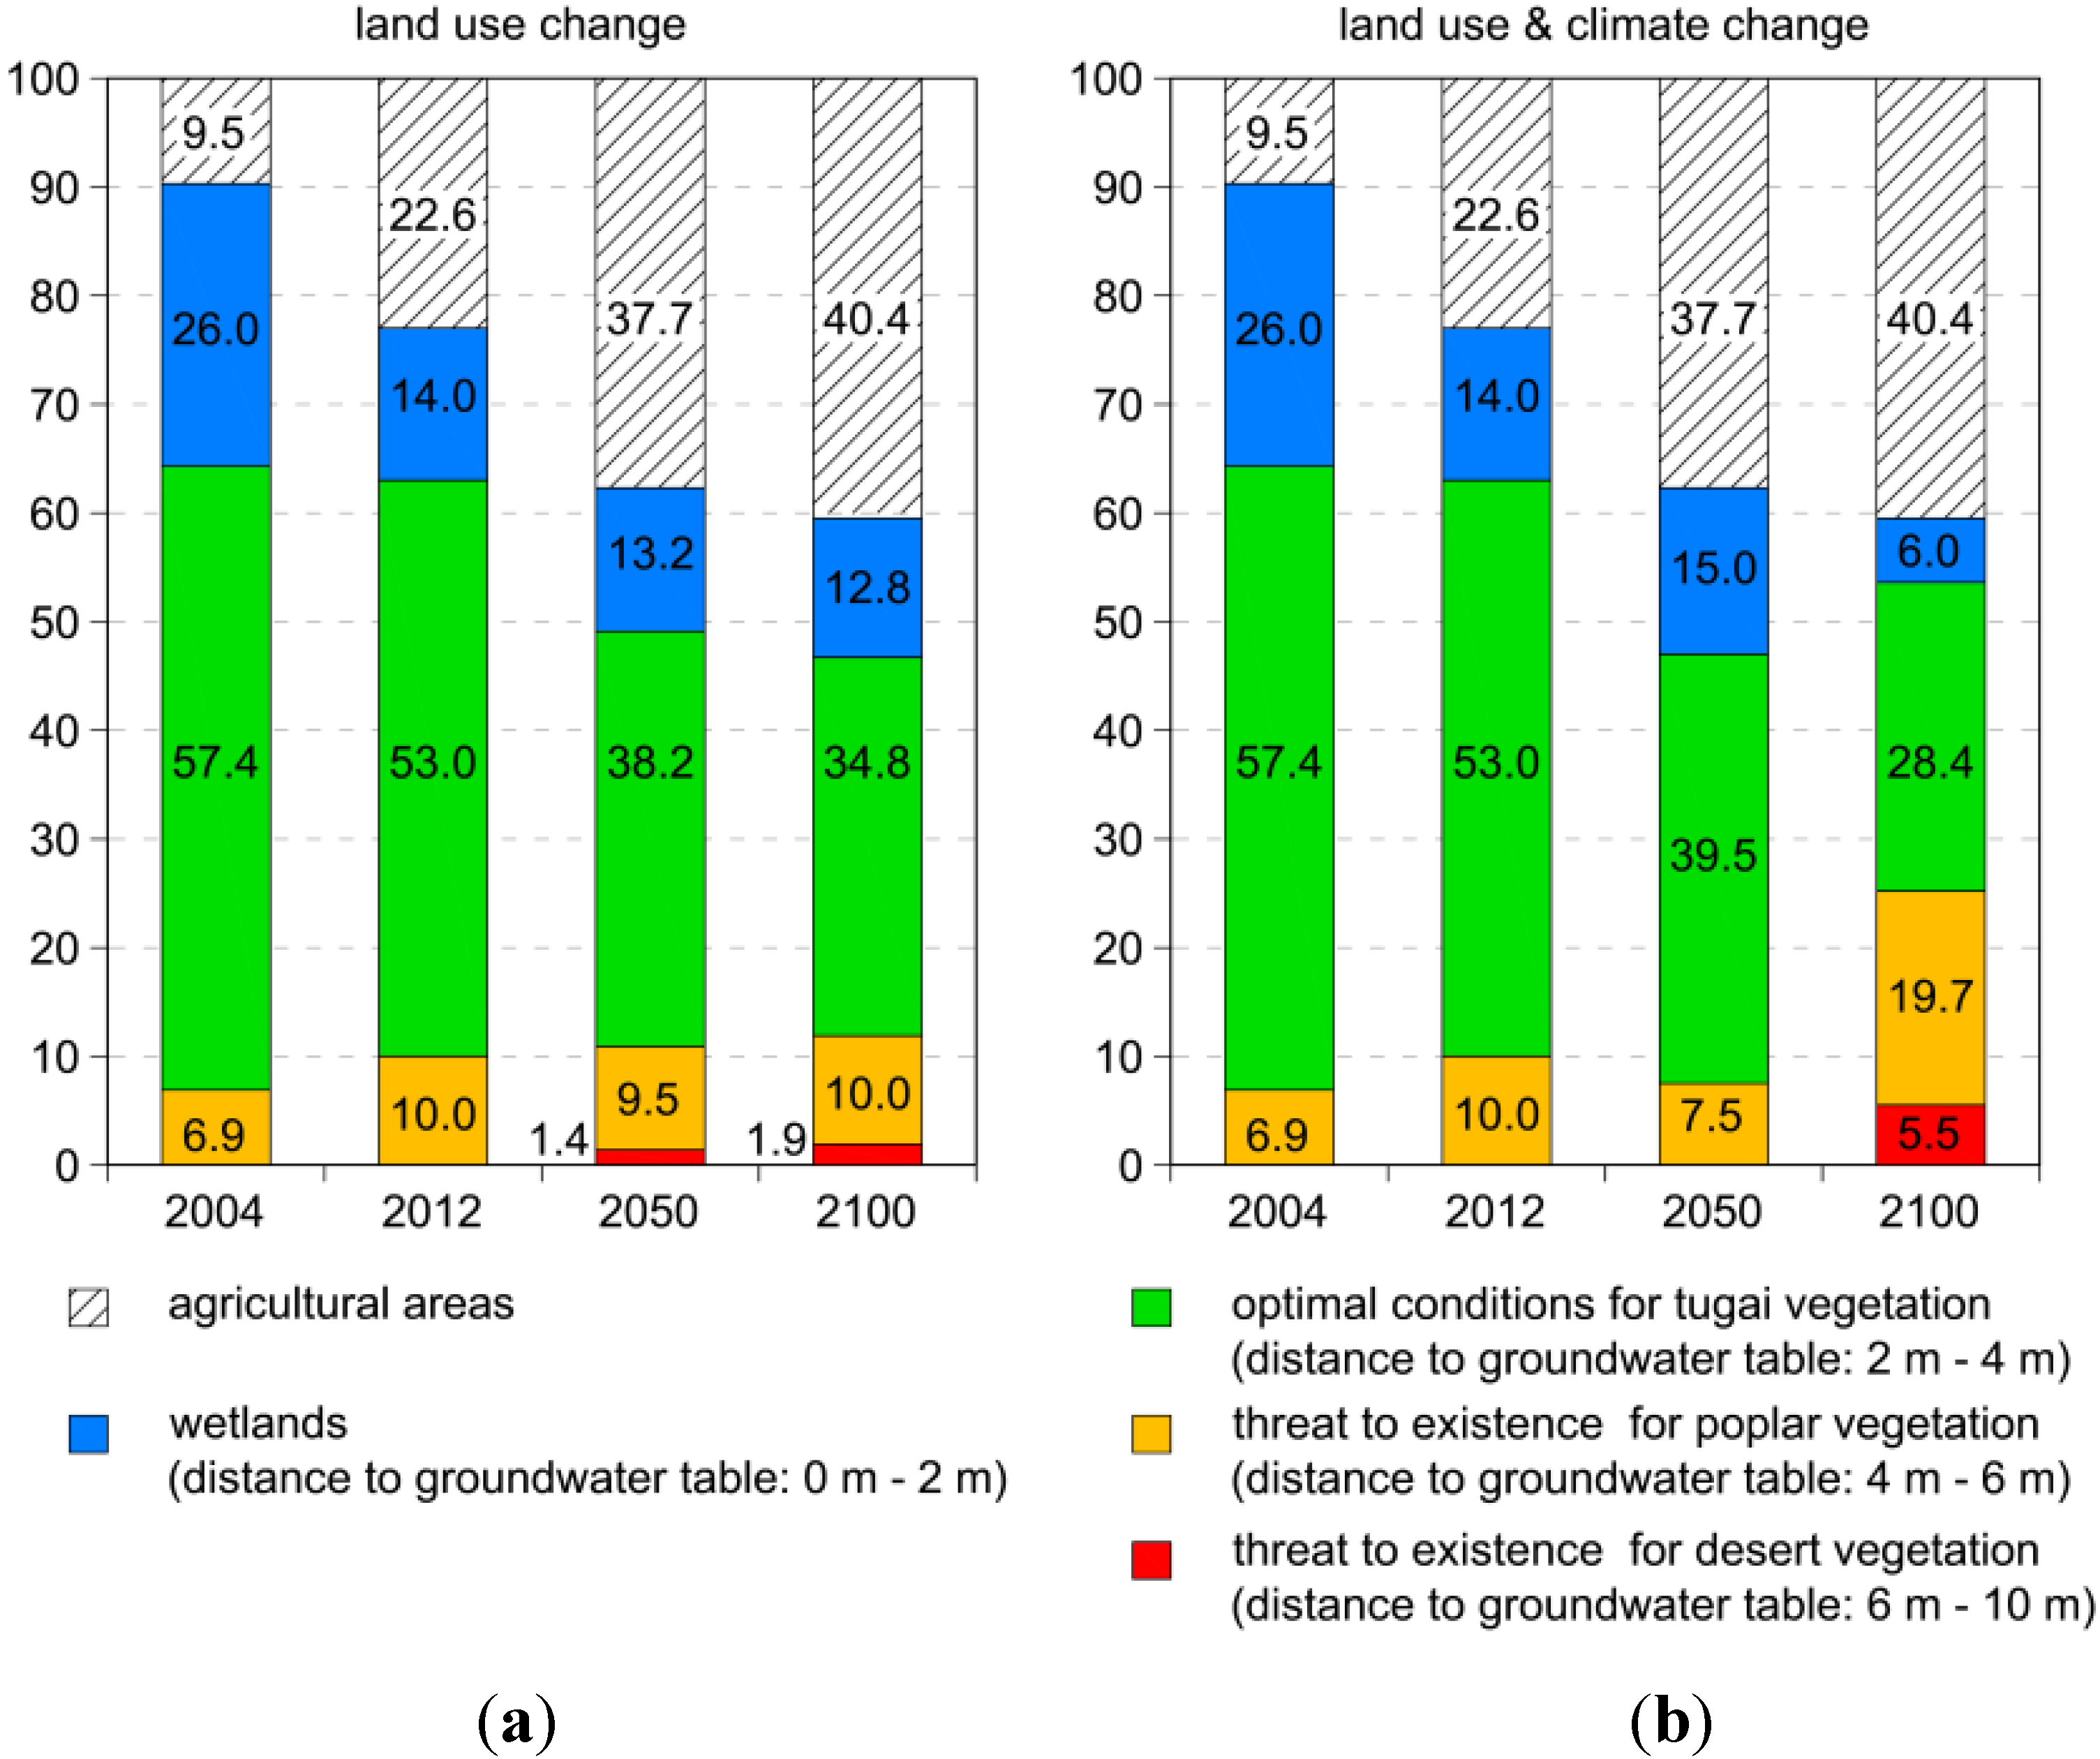
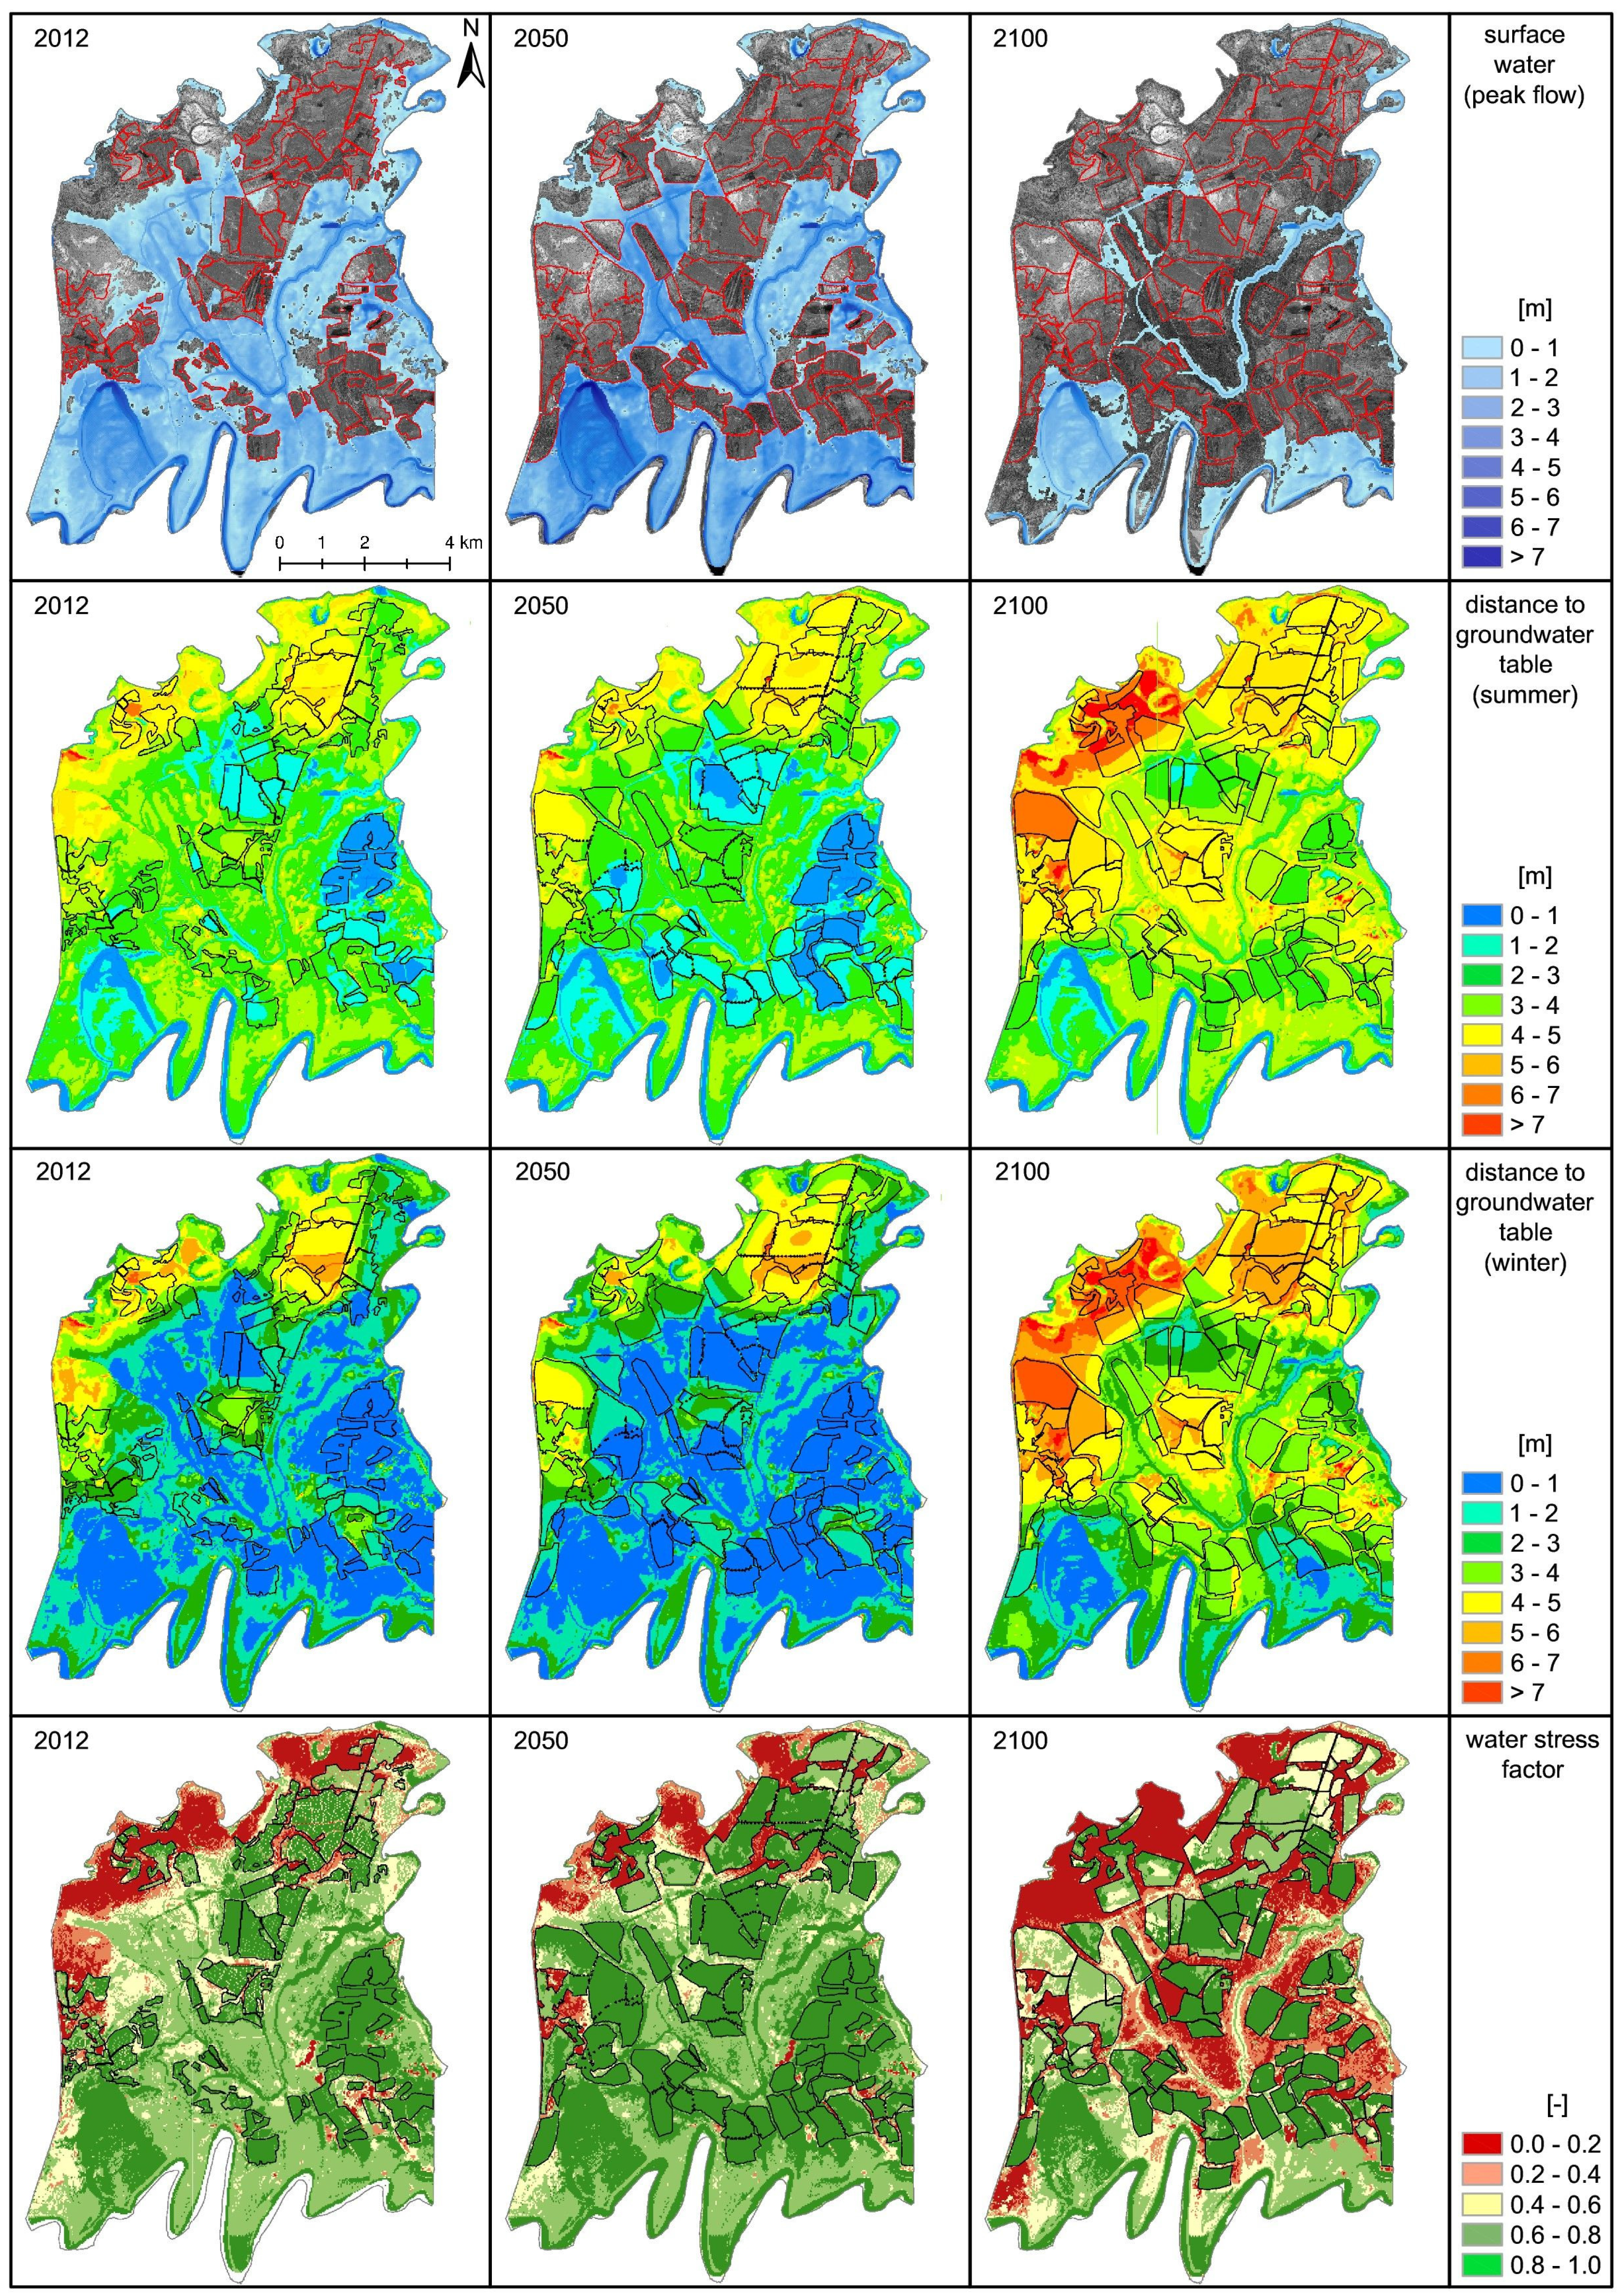
3.3. Scenarios

To analyze the influence of land-use and climate change, it is necessary to define future scenarios (2050 and 2100). The land-use change in the last 10 years shows an extreme increase in the extent of agricultural areas (2004 = 8.1 km2; 2012 = 19.3 km2). This trend can be spatially extrapolated to the years 2050 (32.2 km2) and 2100 (34.5 km2). Climate change will affect the local temperature and rainfall. The representative concentration pathway (RCP) scenario 4.5 from the Intergovernmental Panel on Climate Change (IPCC) is used to analyze the effect of climate change [38]. An increase of 2.2 °C until 2050 and of 3.0 °C until 2100 is assumed. The precipitation will change at different rates dependent on winter season (October–March) and summer season (April–September). An increase of 5%/10% in summer and 10%/20% in winter until the years 2050/2100 are expected, respectively. These changes are added to the actual time series of temperature (mean 2011–2013) and precipitation (2012). In addition, climate change will influence the discharge hydrograph of the Tarim River because of glacier melting. From the present data, the discharge hydrograph of Yingibazar can differ into small (Qpeak = 250 m3/s; volume = 1390 Million m3/a), mean (Qpeak = 520 m3/s; volume = 2580 Million m3/a) and high (Qpeak = 900 m3/s; volume = 3260 Million m3/a) events. In the near future (2050), a higher discharge is expected, but by 2100, the discharge will decrease significantly and small discharge will be expected [11]. This is demonstrated by the extent of flooding, distance to groundwater table in summer and winter, and the water stress coefficient (Figure 6). The water stress coefficient is defined as the quotient of the actual evapotranspiration (ETa) and the vegetation specific potential evapotranspiration (ET0 × kc).
The conversion of natural land to agricultural land has a high impact on the natural flooding. From 2004 to the present, the area of floodplains decreased from 58 to 46 km2 for an average flood event. With further land reclamation, the area of floodplains will further decrease to 36 km2 in 2050 and 33 km2 in 2100. If the effects of climate change are also considered, the extent of flooding will be 40 km2 in 2050 and only 16 km2 in 2100 (higher flooding amount in the near future (2050) and lower flooding amount in the longer term (2100)).
The changing extent of the floodplains will affect the water volume stored in the floodplains and the groundwater recharge. In the natural areas, the groundwater recharge decreased from 10.8 million m3 in 2004 to 9.8 million m3 in 2012 due to land-use changes. In the future (2050 & 2100), the recharge will further decrease to 7.2 million m3. If the effects of climate change are considered, the groundwater recharge will decrease to 7.8 million m3 in 2050 and 3.2 million m3 in 2100. An opposite effect will be seen in the agricultural areas (Table 2).
Figure 6. Effects of land-use and climate change in the future (2050 and 2100) on flooding, distance to groundwater table in summer and winter, and water stress.
Water 07 03040 g006
Table 2. Changes in groundwater recharge in natural areas, agricultural areas, and the Tarim River in the past, present, and future.
YearArea km2Land-UseLand-Use and Climate Change
Recharge million m3Recharge mm/aRecharge Test Site mm/aRecharge Million m3Recharge mm/aRecharge Test Site mm/a
2004natural = 75.310.8143.4124.410.8143.4124.2
agricultural = 8.1−0.4−49.4−0.4−49.4
Tarim = 1.90.2105.30.2105.3
2012natural = 64.19.8152.1116.29.8152.1116.2
agricultural = 19.30.00.90.00.9
Tarim = 1.90.176.30.176.3
2050natural = 51.27.2140.2103.37.8152.3116.8
agricultural = 32.21.547.82.370.2
Tarim = 1.90.149.0−0.1−52.6
2100natural = 48.97.2148.195.83.265.868.6
agricultural = 34.50.925.71.544.2
Tarim = 1.90.126.41.1584.5
Note: Recharge test site = (Area/Area × recharge).
A clear trend is visible in the groundwater recharge. With new field reclamations, the overall groundwater recharge in the study area has reduced. The water demand for agriculture is rising with the creation of new fields. In 2004, only 4.0 million m3 of water was used for irrigation. In the future (2100), it is expected that nearly 18 million m3 of water will be needed for irrigation. Changes in the water demand will also affect groundwater and surface water resources (Table 3).
Table 3. Distribution of the water resources for irrigation in the past, present, and future.
Year (Irrigation Area)Land-Use ChangeLand-Use and Climate Change
SW
Million m3
GW
Million m3

Million m3
GW/SW %SW
Million m3
GW
Million m3

Million m3
GW/SW %
2004 (8.1 km2)2.641.394.0352.62.641.394.0352.6
2012 (19.3 km2)6.873.5010.3750.96.873.5010.3750.9
2050 (32.2 km2)10.836.0616.8956.011.056.3417.3957.4
2100 (34.5 km2)11.656.1317.7853.012.894.1016.9931.8
Notes: SW = used surface resources for irrigation; GW = used groundwater resources for irrigation.
Increasing use of groundwater resources and reducing groundwater recharge will cause sinking groundwater levels and higher salinization in the agricultural areas.
The vitality of the vegetation depends strongly on the groundwater level. In an integrated concept, the growth status and growth trends (including crown, leaves, stems and branches) as well as the extension of the canopy are determined [3,4,38]. The concept is associated with physiology, ecology and morphology of the forest. These indicators assess the overall situation of Tugai forests. In arid regions, physiological water stress of trees is clearly reflected by eco-morphological feedback. Particularly, under the extremely harsh environment like in the middle and lower reaches of the Tarim River, eco-morphological degradation of Populus euphratica is conspicuous if groundwater level is not favourable. Therefore, the vitalities of Populus euphratica floodplain forests in the study area are evaluated based on visual assessment criteria (e.g., from ‘healthy’ to ‘dead’) [39]. During the field investigation, a relatively large amount of slightly and highly degraded trees with low vitality were found in the investigated area where distance to groundwater table was about 6 to 10 m. The majority of them showed clear physical signs of deteriorations. If roots cannot reach the groundwater table, the water stress of the vegetation will increase, as frequently occurs in the northern parts of the test site. However, there are also positive effects in these areas where river water is used for irrigation. The nearby Tugai forests benefit from the artificial groundwater recharge. However, large natural vegetation areas were destroyed due to conversion into new agricultural fields. Figure 7 shows the changes clustered in vitality zones due to land-use changes, also in combination with climate change. It can be clearly concluded that the areas with optimal conditions will decrease in the future.
Figure 7. Changes in the vitality zones in future scenarios caused by (a) land-use changes and (b) land-use changes combined with climate change.
Water 07 03040 g007

4. Conclusions

By this analysis, the complete water cycle of a region along the Tarim River was calculated in detail for the years 2012 and 2013. Groundwater recharge is one of the most important factors for the ecosystem. The sources of groundwater recharge could be differentiated by computing the influence of flooding at the floodplains, irrigation water from agriculture, and seepage losses from the Tarim River. Eighty-four percent of the recharged water was contributed by the floodplain areas and only 8% of groundwater recharge happened as a result of leakage losses from the Tarim River bed. This allows for the conclusion, that embankments along the river will change natural flooding, and as a consequence, the groundwater recharge will decrease dramatically. Depending on the source of the irrigation water, the irrigation areas can have a positive (river water) or negative (groundwater) effect on groundwater recharge. If the agricultural areas are located on the floodplains, they can constrain both the flooding and the groundwater recharge.
There is an interaction between agriculture and neighboring natural vegetation concerning groundwater levels and salt transport. In areas where the natural vegetation is not leached by flooding, salt accumulation in a 300 m strip around the agricultural areas is possible. By using a combination of ground and river water for irrigation, this effect will decrease. Also, the use of drainage systems can reduce the salinization in agricultural areas. This applies especially for agricultural areas which are located close to the river in old floodplain areas, where the natural groundwater tables are high.
The results show that the dramatic changes in land use in the past had a great influence on the ecosystem and the impact of future land use and climate change will further increase. In the near future (2050), the water demand can be satisfied by the higher river discharge as a consequence of climate change induced glacier melting. However, when in the more distant future (2100) the glacier mass will be reduced, the river discharge will decrease and the water availability will decline strongly. This lack of water will produce water stress and increase the desertification of the area.
A final conclusion of the analysis is that urgent action is necessary to protect the ecosystem and their ecosystem services. A possible solution could be an integrated water resources management for the Tarim River. By allocating the limited water resources to agriculture, urban areas and ecosystems in a sustainable way, an improvement in the quality of life and in economic systems as well as maintaining the biodiversity of the ecosystems could be achieved. Such kind of management system needs the support of political and economic stakeholders.
By modelling the 85 km2 research area, high resolution data were generated in the region. To analyze the hydrological and hydraulic system in other areas along the Tarim River, more similar data should be generated. There is a scientific need to understand salt transport patterns. The results of this work shows that there is a salt exchange between agriculture and neighboring ecosystems. The area of Yingibazar is the only area along the upper and middle reaches of the Tarim River which can be flooded naturally. To protect the unique ecosystem, the area should not be embanked.

Acknowledgments

We thank the German Federal Ministry of Education and Research for funding of the SuMaRiO consortium as part of the Land Management Program, Sustainable Management (FKZ 01LL0918L) and the National Natural Science Foundation of China (Grant No: 31360200). Furthermore, we thank the Project Management Agency of the German Aerospace Center (DLR-PT) for their constant administrative support and colleagues from the Global Assessment of Land Use dynamics on Greenhouse Gas Emissions and Ecosystem Services project (GLUES) for their cooperation. For the processing of TerraSAR-X data, we thank the DLR for their support and contribution. We also thank our local partners, Liu Zhihui from the Xinjiang University (Urumqi), for their support. We thank our students, Maierdang Keyimu, Marion Houdayer, Jürgen Hoppe, and Jian Bo for assistance in the field.

Author Contributions

The manuscript was mainly written by Patrick Keilholz with support of Ümüt Halik (vegetation analysis). Markus Disse conceived of and designed the overall concept for the research, he is also responsible for manuscript modification. The MIKE SHE model was developed and analysed by Patrick Keilholz. Data were collected and sorted by Patrick Keilholz, Maierdang Keyimu, Marion Houdayer, Jürgen Hoppe, and Jiang Bo. Additional information and outcomes German side were supported by the SuMaRiO-Team.

Conflicts of Interest

The authors declare no conflict of interest.

References

  1. Tang, Q.; Hu, H.; Oki, T. Groundwater recharge and discharge in a hyperarid alluvial plain (Akesu, Taklimakan Desert, China). Hydrol. Process. 2007, 21, 1345–1353. [Google Scholar] [CrossRef]
  2. Halik, Ü.; Kurban, A.; Mijit, M.; Schulz, J.; Paproth, F.; Coenradie, B. The potential influence of embankment engineering and ecological water transfers on the riparian vegetation along the middle and lower reaches of the Tarim River. In Watershed and Floodplain Management along the Tarim River in China’s Arid Northwest; Shaker Verlag: Aachen, Germany, 2006; pp. 221–236. [Google Scholar]
  3. Aishan, T.; Halik, Ü.; Cyffka, B.; Kubab, M.; Abliza, A.; Baidourela, A. Monitoring the hydrological and ecological response to water diversion in the lower reaches of the Tarim River, Northwest China. Quat. Int. 2013, 311, 155–162. [Google Scholar] [CrossRef]
  4. Halik, Ü.; Chai, Z.; Kurban, A.; Cyffka, B.; Wei, R. The positive response of some ecological indices of Populus euphratica to the emergency water transfer in the lower reaches of the Tarim River. J. Rescour. Sci. 2009, 31, 1309–1314. (In Chinese) [Google Scholar]
  5. Aishan, T.; Halik, Ü.; Kurban, A.; Cyffka, B.; Kuba, M.; Betz, F.; Keyimu, M. Eco-Morphological response of floodplain forests (Populus euphratica Oliv.) to water diversion in the lower Tarim River, northwest China. Environ. Earth Sci. 2015, 73, 533–545. [Google Scholar] [CrossRef]
  6. Yang, B.; Brauning, A.; Zhang, Z.; Dong, Z.; Esper, J. Dust storm frequency and its relation to climate changes in Northern China during the past 1000 years. Atmos. Environ. 2007, 41, 9288–9299. [Google Scholar] [CrossRef]
  7. Rumbaur, C.; Thevs, N.; Disse, M.; Ahlheim, M.; Brieden, A.; Cyffka, B.; Duethmann, D.; Feike, T.; Frör, O.; Gärtner, P.; et al. Sustainable management of river oases along the Tarim River (SuMaRiO) in Northwest China under conditions of climate change. Earth Syst. Dyn. 2015, 6, 83–107. [Google Scholar] [CrossRef]
  8. Liu, Y.; Chen, Y. Impact of population growth and land-use change on water resources and ecosystems of the arid Tarim River Basin in Western China. Int. J. Sustain. Dev. World Ecol. 2006, 13, 1–11. [Google Scholar] [CrossRef]
  9. Glazirin, G.E. A century of investigations on outbursts of the ice-dammed lake Merzbacher (Central Tian Shan). Aust. J. Earth Sci. 2010, 103, 171–179. [Google Scholar]
  10. Sorg, A.; Bolch, T.; Stoffel, M.; Solomina, O.; Beniston, M. Climate change impacts on glaciers and runoff in Tien Shan (Central Asia). Nat. Clim. Chang. 2012, 2, 725–731. [Google Scholar] [CrossRef]
  11. Pang, Z.; Huang, T.; Chen, Y. Diminished groundwater recharge and circulation relative to degrading riparian vegetation in the middle Tarim River, Xinjiang Uygur, Western China. Hydrol. Process. 2010, 24, 147–159. [Google Scholar] [CrossRef]
  12. Tang, J.N.; Su, Z.Z.; Ding, F.; Zhu, S.J.; E, Y.H.; Zhai, X.W.; Yi, Z.Y.; Liu, H.J.; Zhang, J.C.; Li, F.M. The formation age and evolution of Kumtagh Desert. J. Arid Land 2011, 3, 114–122. [Google Scholar] [CrossRef]
  13. Luo, C.; Peng, Z.C.; Yang, D.; Liu, W.G.; Zhang, Z.F.; He, J.F.; Chou, C.L. A lacustrine record from Lop Nur, Xinjiang, China: Implications for paleoclimate change during Late Pleistocene. J. Asian Earth Sci. 2009, 34, 38–45. [Google Scholar]
  14. Chen, Y.; Xu, C.; Hao, X.; Li, W.; Chen, Y.; Zhu, C.; Ye, Z. Fifty-Year climate change and its effect on annual runoff in the Tarim River Basin, China. Quat. Int. 2009, 208, 53–61. [Google Scholar]
  15. Statistisches Jahrbuch Xinjiang 1978–2010. China Statistical Press, 2013. Available online: http://www.xjtj.gov.cn/sjcx/tjnj_3415/ (accessed on 16 June 2015). (In Chinese)
  16. Digital Globe. 2013. Available online: www.digitalglobe.com (accessed on 08 October 2013).
  17. Gstaiger, V.; Huth, J.; Gebhardtb, S.; Wehrmanna, T.; Kuenzera, C. Multi-Sensoral and automated derivation of inundated areas using TerraSAR-X and ENVISAT ASAR data. Int. J. Remote Sens. 2012, 33, 7291–7304. [Google Scholar] [CrossRef]
  18. Keilholz, P. Auswirkungen von veränderter Landnutzung auf den Wasserhaushalt und die Auwaldvitalität in einer Flussoase am Tarim (China). Ph.D. Thesis, Technische Universität München, Munich, Germany, 2014. [Google Scholar]
  19. National Aeronautics and Space Administration (NASA). Available online: http://trmm.gsfc.nasa.gov/data_dir/data.html (accessed on 28 January 2014).
  20. Penman, H. Estimating evaporation. Trans. Am. Geophys. Union 1956, 37, 43–46. [Google Scholar] [CrossRef]
  21. Monteith, J.L. Evaporation and surface temperature. Q. J. R. Meteorol. Soc. 1981, 107, 1–27. [Google Scholar] [CrossRef]
  22. Thevs, N. Ecology, Spatial Distribution, and Utilization of the tugai Vegetation at the Middle Reaches of the Tarim River, Xinjiang, China. Ph.D. Thesis, Ernst-Moritz-Arndt-Universität Greifswald, Greifswald, Germany, 2006. [Google Scholar]
  23. Thevs, N.; Ahemaitijiang, R.; Nuerbayi, A. Evapotranspiration of riparian ecosystems and irrigated land anlong the middle reaches of the Tarim River, Xinjiang, China. Agric. For. Meteorol. 2013. submitted. [Google Scholar]
  24. Canadell, J.; Jackson, R.B.; Ehleringer, J.B.; Mooney, H.A.; Sala, O.E.; Schulze, E.-D. Maximum rooting depth of vegetation types at the globale scale. Oecologia 1996, 108, 583–595. [Google Scholar] [CrossRef]
  25. Thomasa, F.M.; Foetzkia, A.; Arndtb, S.K.; Bruelheidea, H.; Griesa, D.; Lic, X.; Zengc, F.; Zhangc, X.; Rungea, M. Water use by perennial plants in the transition zone between river oasis and desert in NW China. Basic Appl. Ecol. 2006, 7, 253–267. [Google Scholar] [CrossRef]
  26. Khamzina, A.; Sommer, R.; Lamers, J.; Viek, P. Transpiration and early growth of tree plantations established on degraded cropland over shallow saline groundwater table in northwest Uzbekistan. Agric. For. Meteorol. 2009, 149, 1865–1874. [Google Scholar] [CrossRef]
  27. Parkinson, C.L.; Greenstone, R. EOS Data Products Handbook; National Aeronautics and Space Administration (NASA): Greenbelt, MD, USA, 2000; Volume 2. [Google Scholar]
  28. Zhao, C.; Yan, Y.; Yimamu, Y.; Li, J.Y.; Zhao, Z.M.; Wu, L.S. Effects of soil moisture on cotton root length density and yield under drip irrigation with plastic mulch in Aksu Oasis farmland. J. Arid Land 2010, 2, 243–249. [Google Scholar]
  29. DHI Water & Environment. MIKE SHE User Manual, Volume 1: User Guide; DHI Water & Environment: Hørsholm, Denmark, 2007. [Google Scholar]
  30. Liu, H.-L.; Chen, X.; Wang, L. Investigation of groundwater response to overland flow and topography using a coupled MIKE SHE/ MIKE 11 modeling system for an arid watershed. J. Hydrol. 2007, 347, 448–459. [Google Scholar] [CrossRef]
  31. Kirstensen, K.; Jensen, S. A model for estimating actual evapotranspiration from potential evapotranspiration. Nord. Hydrol. 1975, 6, 170–188. [Google Scholar]
  32. Richards, L. Capillary conduction of liquids through porous mediums. J. Appl. Phys. 1931, 1, 318–333. [Google Scholar] [CrossRef]
  33. Van Genuchten, M.T. A Closed-Form equation for predicting the hydraulic conductivity of unsaturated soils. Soil Sci. Soc. Am. J. 1980, 44, 892–898. [Google Scholar] [CrossRef]
  34. Mualem, Y. A new model for predicting the hydraulic conductivity of unsaturated porous media. Water Resour. Res. 1976, 12, 513–522. [Google Scholar] [CrossRef]
  35. Twarakavi, N.K.C.; Simunek, J.; Schaap, M.G. Can texture-based classification optimally classify soils with respect to soil hydraulics? Water Resour. Res. 2010, 46, 1–11. [Google Scholar] [CrossRef]
  36. Schaap, M.; Leij, F.; van Genuchten, M.T. ROSETTA: A computer program for estimating soil hydraulic parameters with hierarchical pedotransfer functions. J. Hydrol. 2001, 251, 163–176. [Google Scholar] [CrossRef]
  37. MIKE SHE setup. Available online: http://www.sumario.de/docs (accessed on 12 June 2015).
  38. Intergovernmental Panel on Climate Change (IPCC). Climate Change 2013: The Physical Science Basis. Contribution of Working Group I to the Fifth Assessment Report of the Intergovernmental Panel on Climate Change; Cambridge University Press: New York, NY, USA, 2013. [Google Scholar]
  39. Aishan, T.; Halik, Ü.; Betz, F.; Tiyip, T.; Ding, J.; Nuermaimaiti, Y. Stand structure and height-diameter relationship of a degraded Populus euphratica forest in the lower reaches of the Tarim River, Northwest China. J. Arid Land 2015, 7, 544–554. [Google Scholar] [CrossRef]

