1. Instruction
The rainfall-runoff process (RRP), as an important part of the hydrologic cycle, features temporal and spatial variation [
1,
2]. In a general way, saturation overland flow prevails in China’s southern humid areas, while infiltration excess runoff prevails in northern semiarid areas [
3]. As China’s major grain-producing semiarid area, the northern part of China is now faced with two important issues. First, the water shortage severely restricts the local sustainable development of agriculture, economy, and society. Second, the rainstorms that sometimes occur in the semiarid area bring about flood. From this point of view, it is necessary to have a correct understanding of RRP’s characteristics in semiarid regions so as to accurately select or build an effective hydrological model, and to provide strong support for China’s food security [
4].
RRP is closely related to many factors, such as rainfall intensity, terrain slope, land use, vegetation and soil properties,
etc. Many researchers have carried out extensive research in these respects [
4,
5,
6,
7,
11,
12,
13,
14,
17,
18,
19]. Analysis from the angle of rainfall intensity, the influence of rainfall intensity on runoff is not straightforward. On the one hand, increased rainfall intensity may lead to increased runoff, due to the fact that increased rainfall intensity may bring about the formation of the soil crust, and the development of such soil crusts would reduce the infiltration [
8]. On the other hand, owing to the spatial heterogeneity in the infiltration characteristics of the soil surface, infiltration would increase with increased rainfall intensity and runoff might decrease [
9,
10]. There have been many studies performed on this aspect. Truman
et al. have compared the effects of constant and variable rainfall intensity pattern on runoff in conventional and reduced tillage systems and showed that variable rainfall intensity events generally produced more runoff at the early stage of a rainfall-runoff event, whereas constant rainfall intensity produces more runoff in the later stages of the event [
11]. Assouline and Ben-Hur described the effects of rainfall intensity and slope gradient on the dynamics of interrill erosion during soil surface sealing and proved that cumulative runoff at the end of a rainfall event was lower as slopes were steeper [
12]. Huang
et al. conducted rainfall tests to study the effects of rainfall intensity, underlying surface, and slope gradient on soil infiltration and pointed out that increases in rainfall intensity are not conducive to soil infiltration and may reduce the amount of infiltration [
13]. Assouline and Ben-Hur also found that as the rainfall intensity increased, the infiltration curve decreased more quickly, and the steady infiltration rate was higher after a long exposure to rainfall [
12]. Nassif
et al. reported that there was a strong correlation between the steady-state infiltration and rain intensity for standard agricultural soil [
14].
The influence of slope on RRP also has two sides. For one thing, with the increase in slope, the soil infiltration rate will decrease, which can increase the runoff amount [
15,
16,
17]. For the other, the effective rainfall obtained by the soil bin will decrease as the slope increases. Many researchers have analyzed the effect of slope on RRP. Agassi
et al. measured the effect of slope, aspect (windward
vs. leeward), and phosphogypsum application on rain amount, runoff, and erosion in small field plots and found that the amount of runoff was not affected by slope on the windward aspect but decreased sharply on the leeward aspect as slope increased [
18]. Nassif
et al. studied the influence of slope on runoff and infiltration. The results showed that there appears to be some critical slope beyond which the peak runoff is relatively unaffected, while for permeable soils the greater the slope the lower the infiltration capacity and for impermeable soils little or no effect [
14]. Cerdà and García-Fayos conducted a study about the influence of slope angle on sediment, water, and seed losses on badland landscapes and found that slope angle did not have any influence on the volume of runoff under the test conditions, while it had a clear influence on runoff initiation, with cracks and crusts as the main factors controlling the time to ponding and time to runoff [
19]. Fox
et al. carried out an experiment to study the influence of slope angle on final infiltration rate for interrill conditions and pointed out that changes in overland flow depth and surface storage are the main reason for the dominant influence of slope angle on infiltration rate [
17].
The studies noted above were generally carried out on bare land, and rarely on covered land, e.g., spring maize. In addition, most RRP tests with artificial rainfall in China, especially the test-based analysis of RRP with different rainfall intensities and slopes, were performed on the Loess Plateau of China [
4,
20,
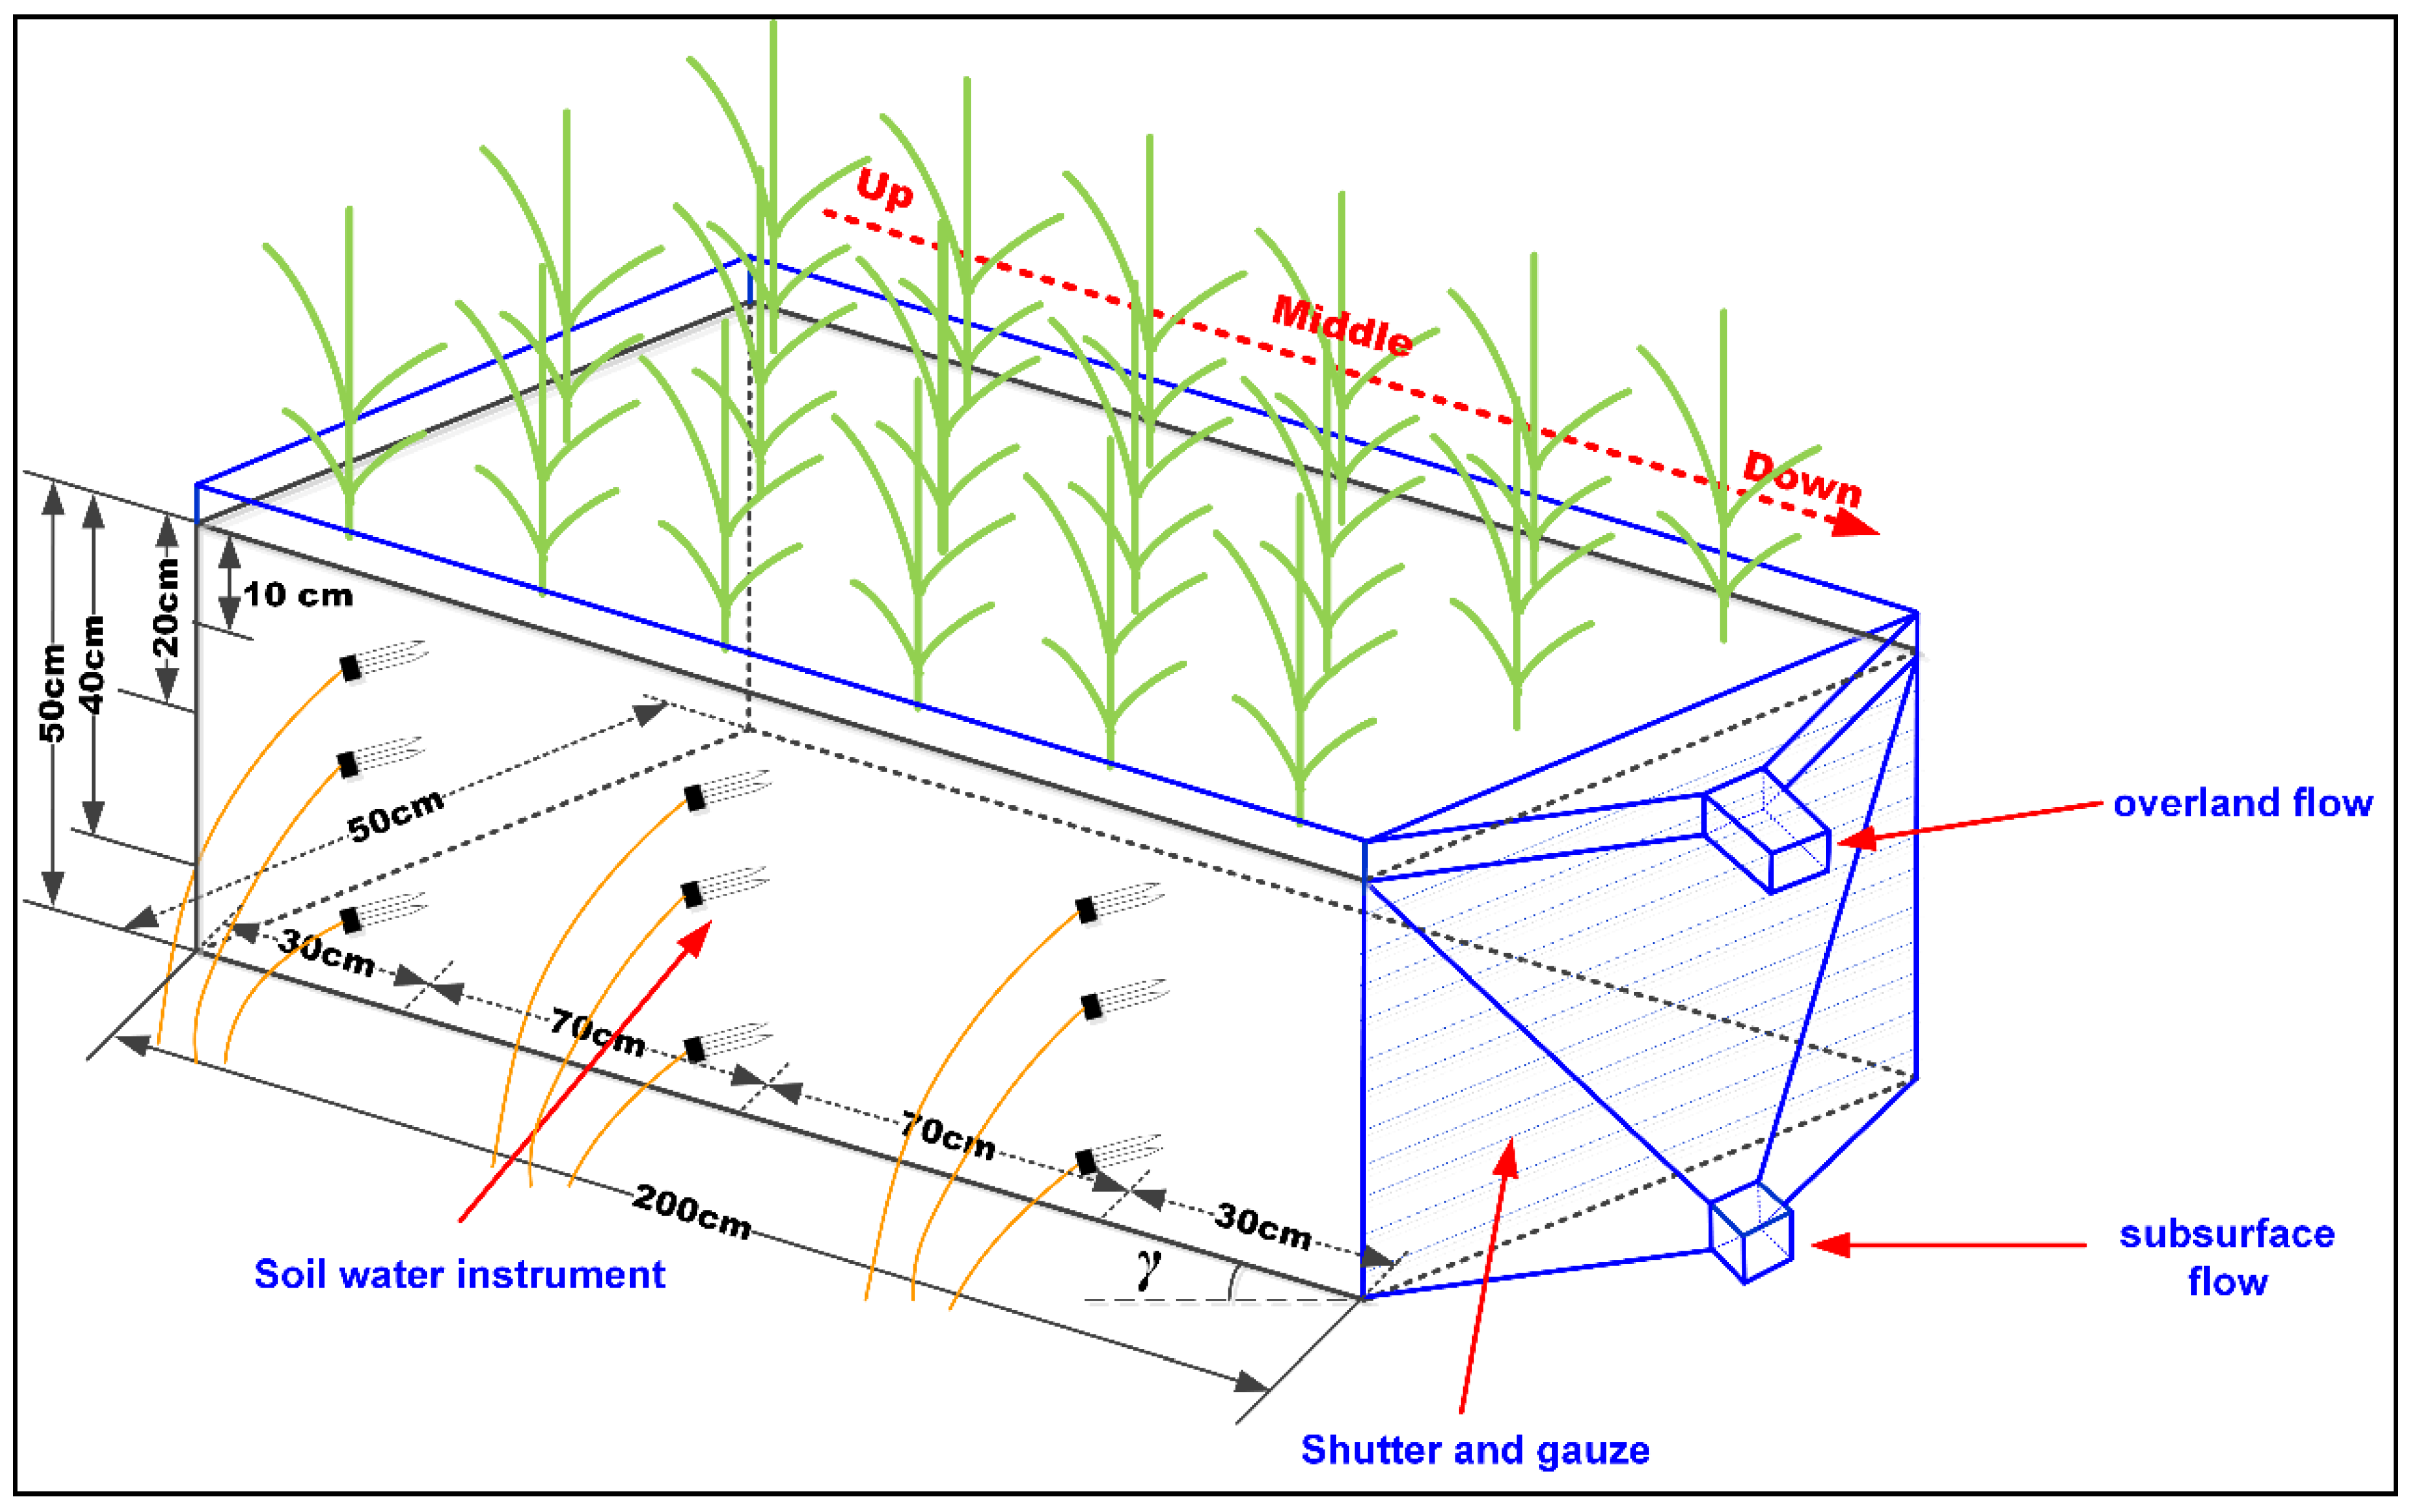
21], while few were on the semiarid regions. Therefore, this rainfall-runoff test was carried out under the condition of spring maize cover in the semiarid region. The soil type of this test was sandy loam, which was taken from the Test Base of IWHR (China Institute of Water Resources and Hydropower Research) in Daxing District, Beijing. Meanwhile, the soil has deposited more than two years in the soil bin and the soil properties were extremely similar to field soil. This paper aims to find out the effect of variation of rainfall intensity and slope on RRP throughout the growing stage of spring maize by the rainfall-runoff test.
The main objectives are as follows: (1) estimate effect of rainfall intensity and slope on RRP; (2) discuss the runoff coefficient with different rainfall intensities and slopes; (3) analyze the runoff lag time with different rainfall intensities and slopes; (4) discuss the effect of rainfall intensity and slope on soil infiltration rate. The findings of this study would supply a certain theoretical basis for the watershed hydrological processes of semiarid regions.
3. Results and Discussion
3.1. Analysis of RRP in Each Growing Stage of Spring Maize with Different Rainfall Intensities and Slopes
In each growing stage of spring maize, the runoff process and cumulative runoff process with different rainfall intensities and slopes are shown in
Figure 2 and
Figure 3, respectively. According to the results:
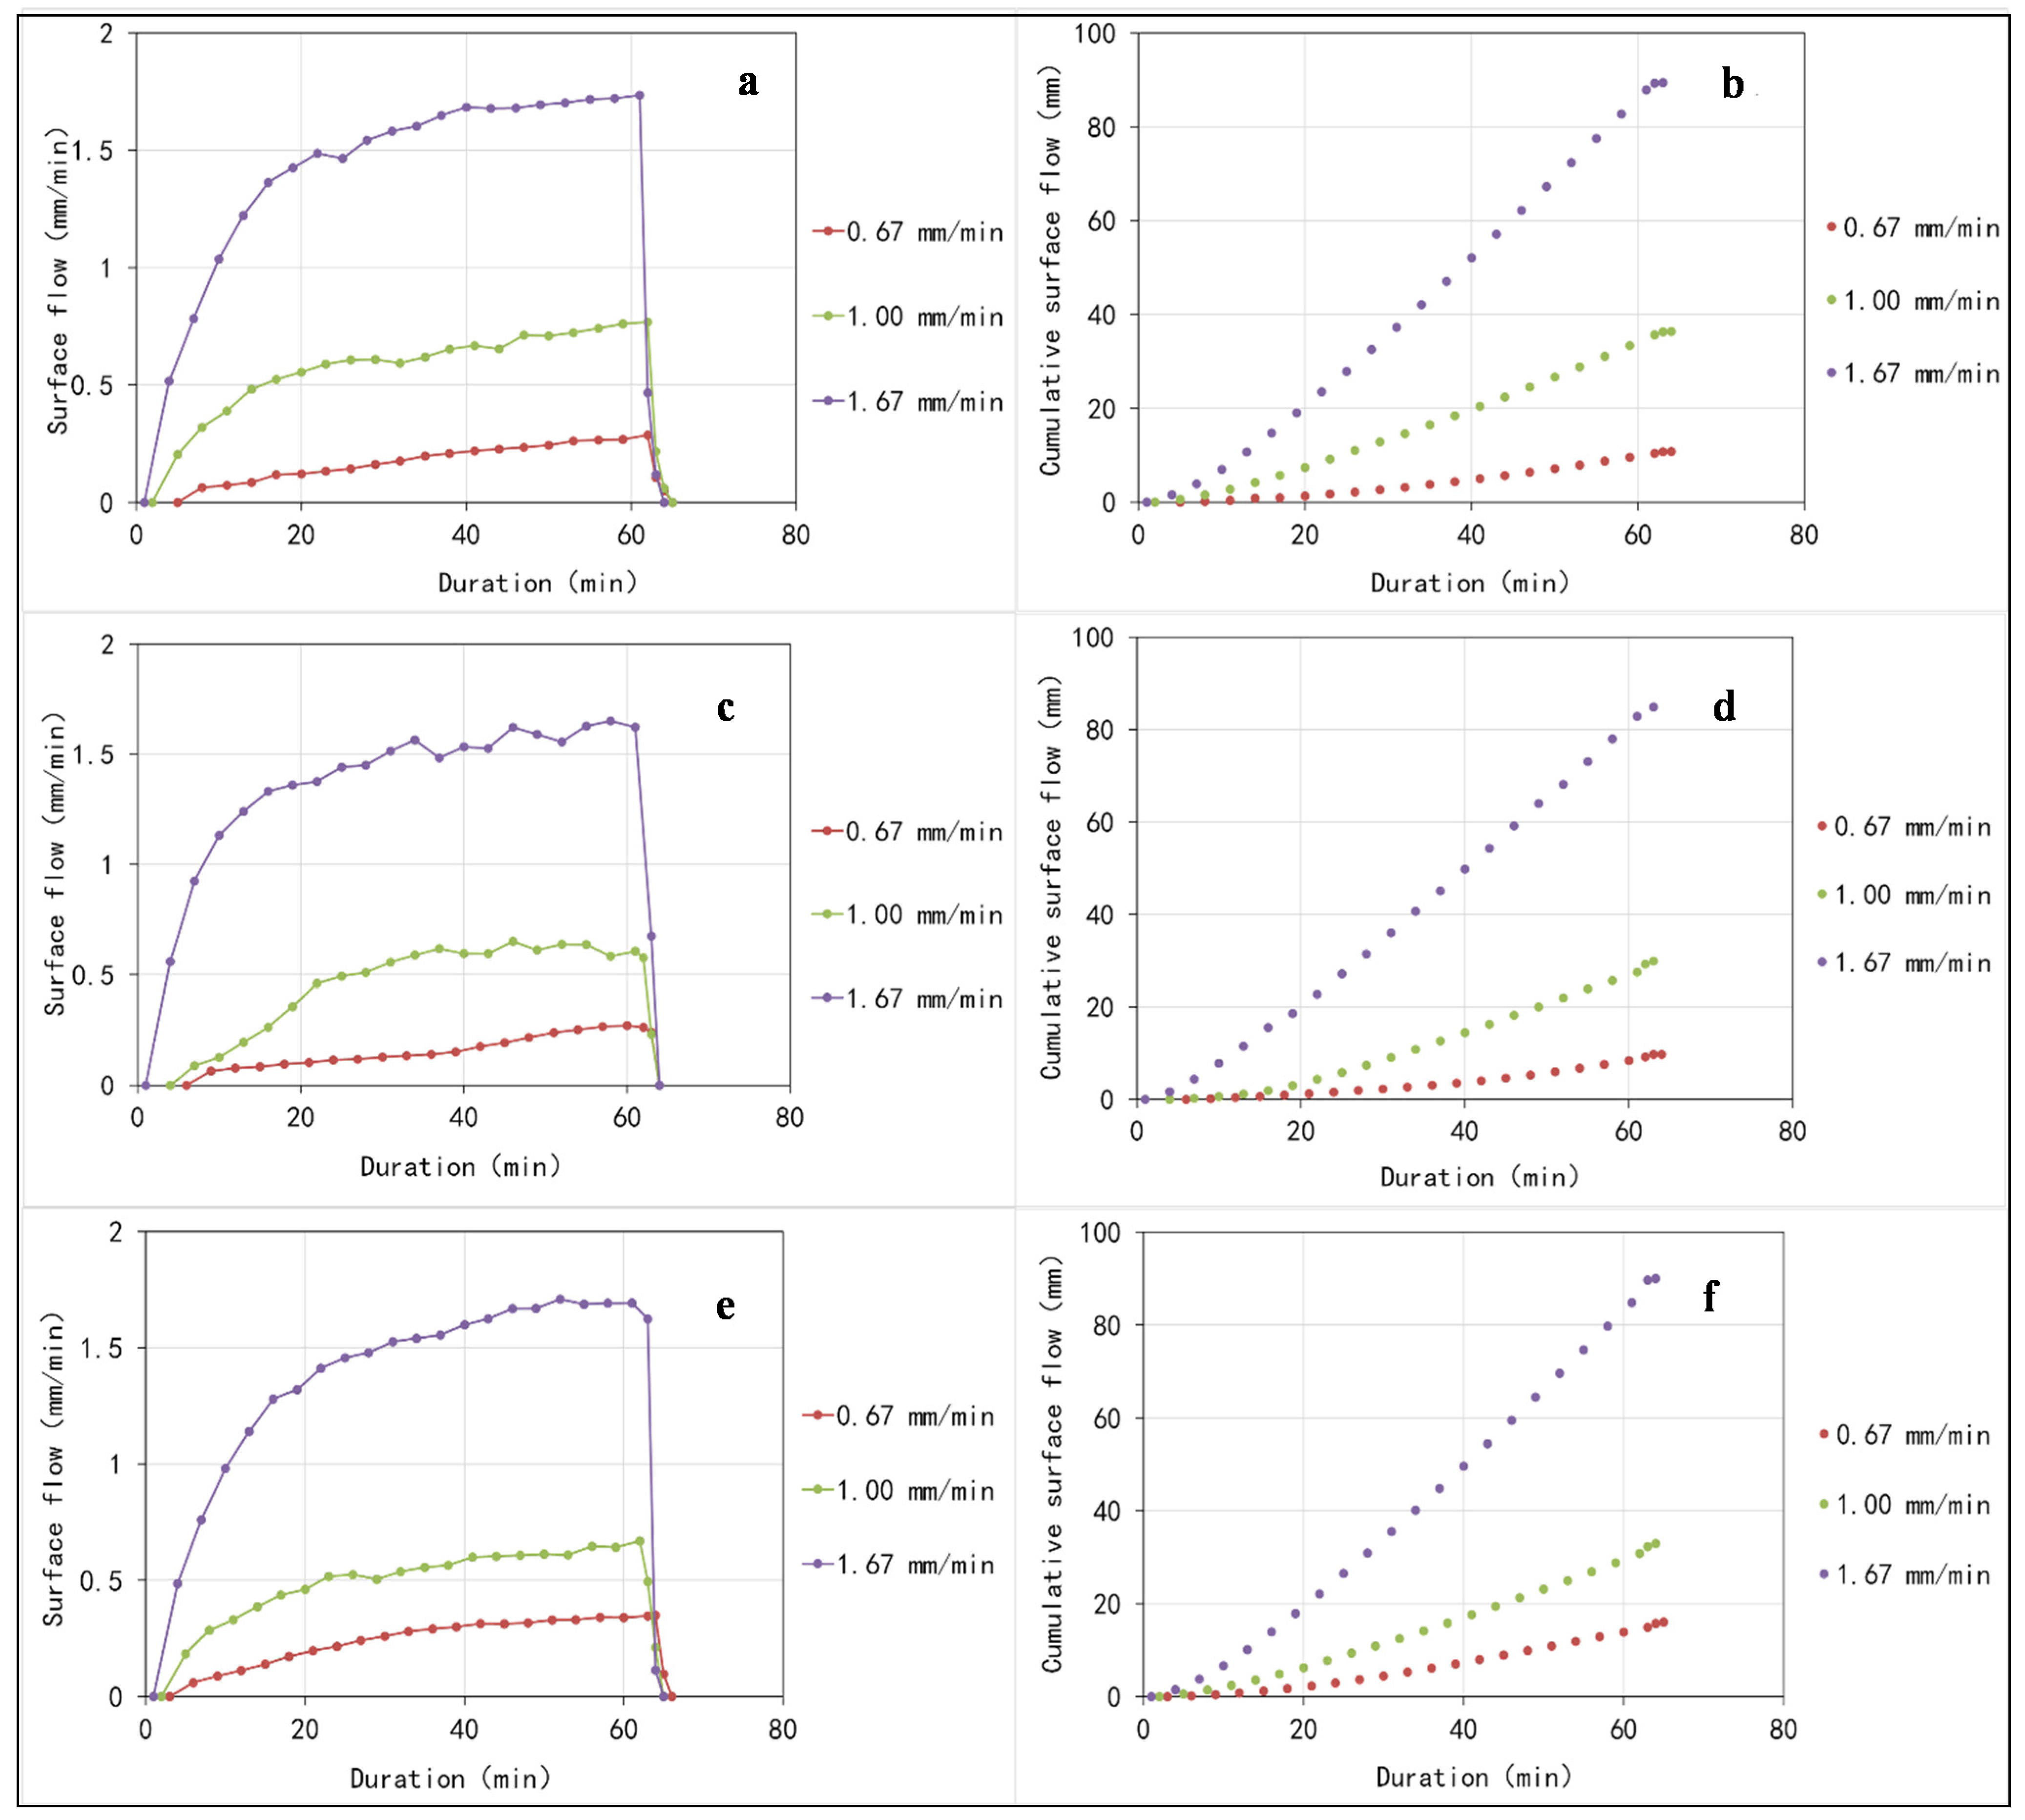
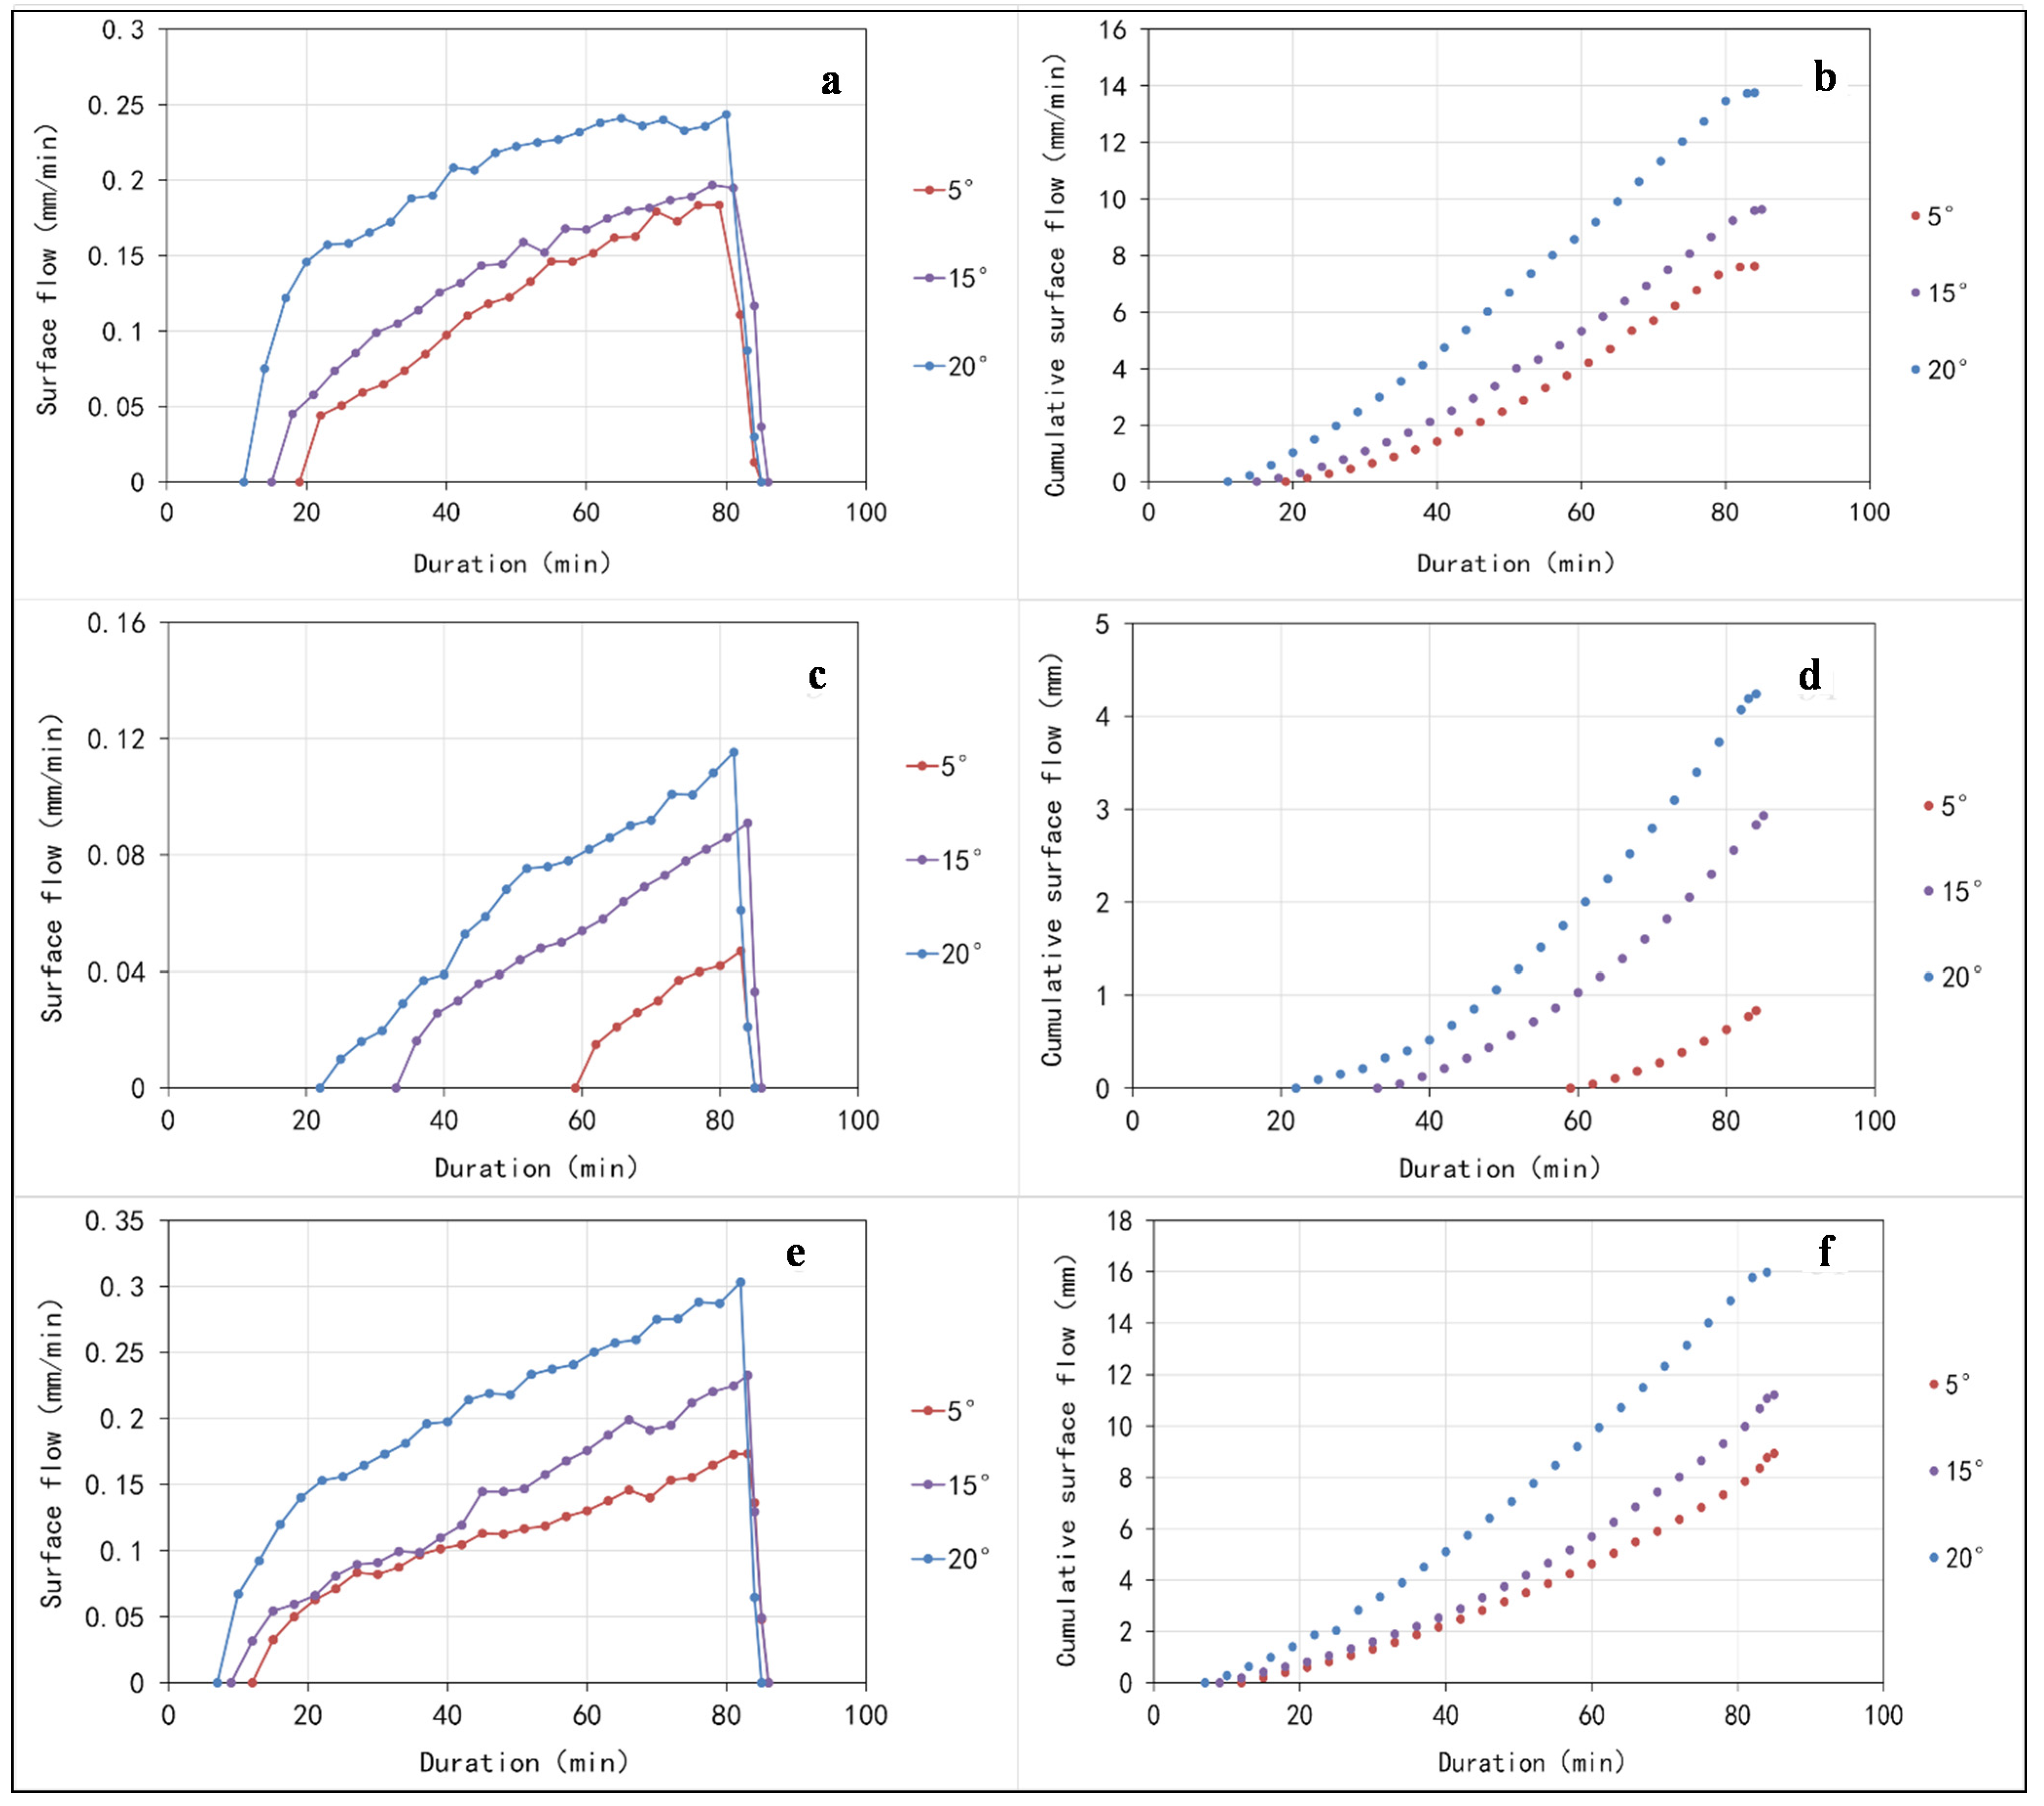
(1) The overland flow and cumulative runoff increased with the increase in rainfall intensity and slope, respectively.
(2) The relationship between overland flow and rainfall duration complied with a logarithmic function (
y = mln
x + n) in each growing stage from the starting time of runoff to the time of stable runoff (
Table 3 and
Table 4). The range of goodness-of-fit is 0.85–0.98, and reached the significant level (η = 0.01) by F test.
(3) Additionally, the relationship between cumulative runoff and rainfall duration complied with a quadratic function (
y = ax2 + bx + c) before reaching stable runoff (
Table 3). The goodness-of-fit is 0.98, and also reached the significant level (η = 0.01) by F test. The parameter
a was mainly affected by rainfall intensity and slope and the greater the rainfall intensity and slope was, the higher value
a would be. It was indicated that the growth rate of overland flow mainly depends on rainfall intensity and slope.
Figure 2.
RRP and cumulative runoff in growing stage with different rainfall intensities (a), (c) and (e) show the RRP of jointing stage, tasseling stage, and mature stage, respectively, with different rainfall intensities; (b), (d) and (f) show the cumulative runoff process of these three stages, respectively, with different rainfall intensities.
3.2. Analysis of Runoff Coefficient in Each Growing Stage of Spring Maize with Different Rainfall Intensities and Slopes
3.2.1. Analysis of Runoff Coefficient with Different Rainfall Intensities
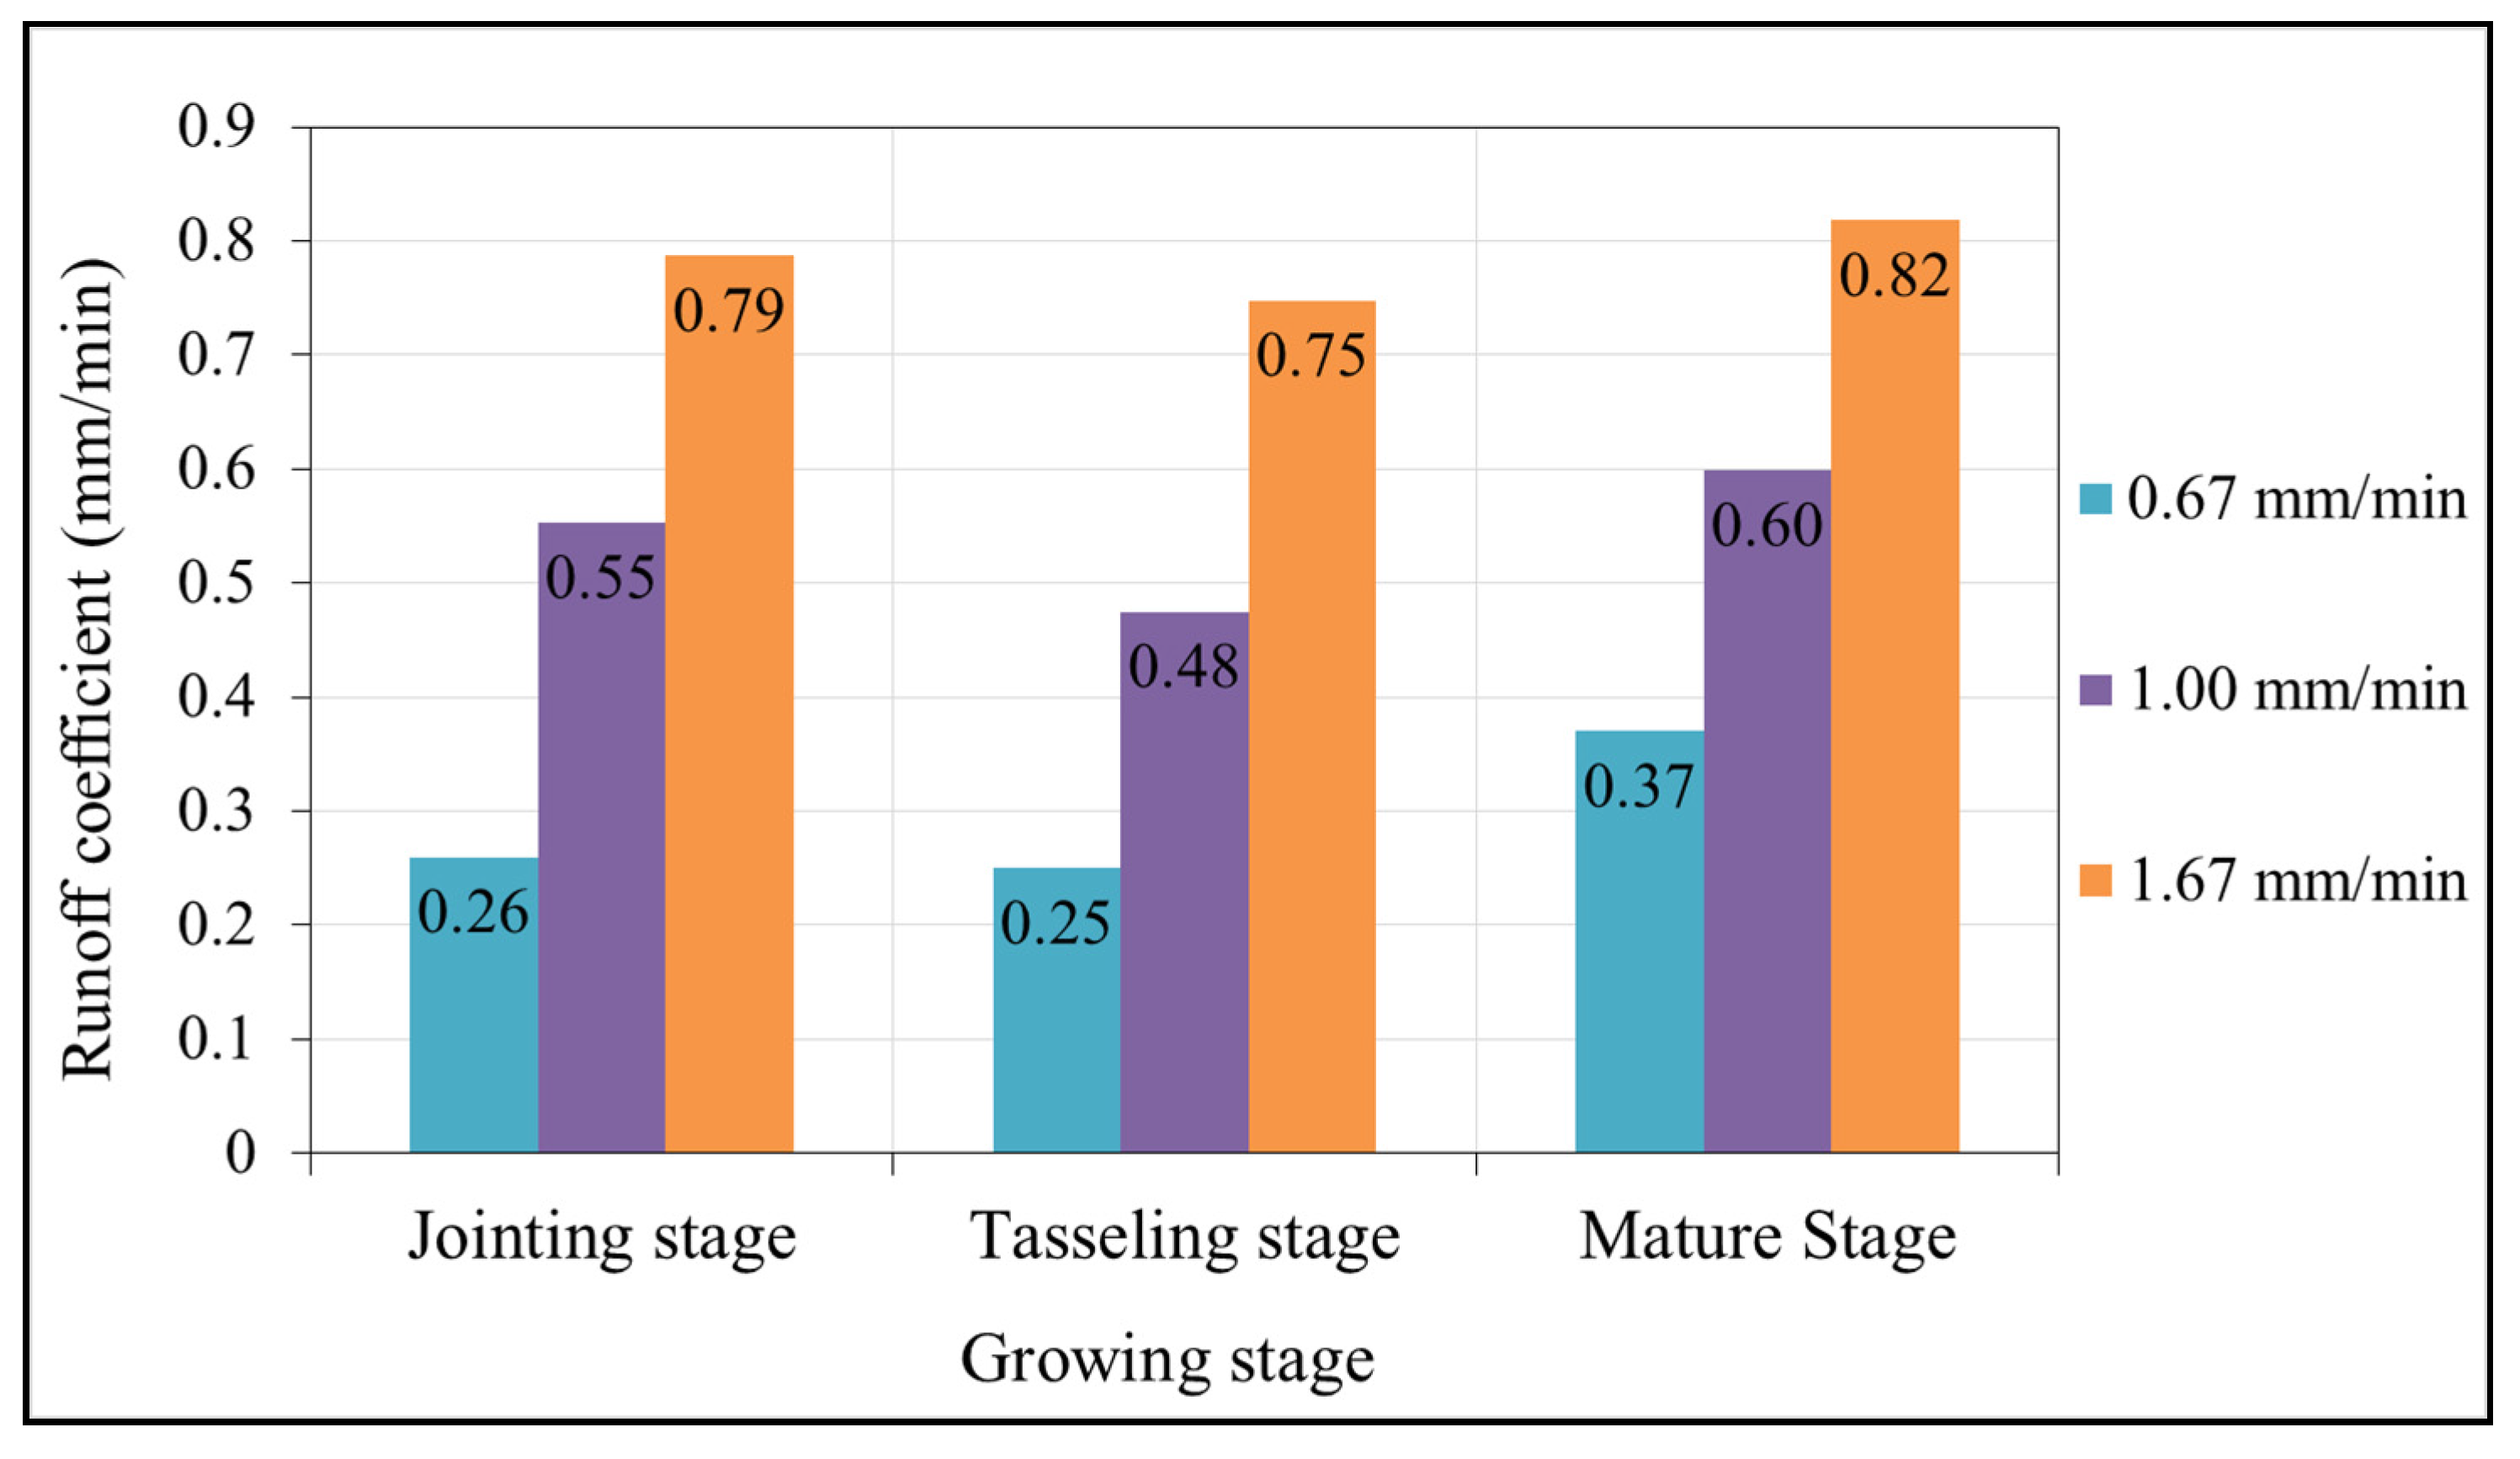
(1) Runoff coefficient
α is a crucial parameter that describes the rainfall-runoff relationship. Within a single growing stage, the runoff coefficient increased with the increased rainfall intensity (
Figure 4). The same conclusion has been come to by Wang
et al., who studied the runoff characteristics of slope cropland in the hilly area of purple soil [
26]. When
i = 0.67 mm/min, the tasseling stage gave the smallest runoff coefficient while the mature stage offered the largest one in that the antecedent soil moisture content was the lowest in the tasseling stage and highest in the mature stage. When the rainfall intensity increased (
i.e.,
i = 1.00 mm/min, or
i = 1.67 mm/min), the runoff coefficient was nearly the same for each growing stage. In other words, the effect of such factors as coverage and antecedent soil moisture content on runoff coefficient decreased gradually with a high rainfall intensity, in which case the runoff coefficient was principally affected by rainfall intensity.
Figure 3.
RRP and runoff accumulation process in growing stage with different slopes (a), (c) and (e) show the RRP of the jointing stage, tasseling stage, and mature stage, respectively, with different slopes; (b), (d) and (f) show the cumulative runoff process of these three stages, respectively, with different slopes).
(2) Among the nine rainfall events in each growing stage of spring maize with different rainfall intensities, the largest and smallest runoff coefficients were 0.85 and 0.28, respectively. The major affecting factors for runoff coefficient
α were rainfall intensity
i, rainfall duration
t, antecedent soil moisture content θ
0, and vegetation coverage
v. A study [
27] reported that runoff coefficient exhibited a tendency of logarithmic increase with the increase in antecedent soil moisture content, and a tendency of power function-based decrease with the increase in coverage [
28]. In consideration of the fact that the runoff coefficient increased with the increase in rainfall intensity and rainfall duration and gradually approached a certain value, this paper performed multivariate nonlinear regression analysis with particle swarm optimization by assuming that the relationship of runoff coefficient with rainfall intensity and rainfall duration was logarithmic. The expression is as follows:
where α is the runoff coefficient (mm/mm);
i represents rainfall intensity (mm/min);
t stands for rainfall duration (min); θ
0 means antecedent soil moisture content (g/cm
3);
v refers to vegetation coverage (m
2/m
2); and the goodness of fit
R = 0.97.
Table 3.
Regression analysis and goodness of fit of overland flow, cumulative runoff, and rainfall duration with different rainfall intensities.
Table 3.
Regression analysis and goodness of fit of overland flow, cumulative runoff, and rainfall duration with different rainfall intensities.
| Growing Stage | Rainfall Intensity (mm/min) | y = mlnx + n | y = ax2 + bx + c | Variation Range of
x (min) |
|---|
| m | n | R | a | b | c | R |
|---|
| Jointing stage | 0.67 | 0.1173 | −0.2129 | 0.96 | 0.0022 | 0.0386 | −0.2791 | 0.98 | x > 5 |
| 1.00 | 0.2162 | −0.1251 | 0.98 | 0.0030 | 0.4208 | −2.0373 | 0.98 | x > 2 |
| 1.67 | 0.3711 | 0.2954 | 0.94 | 0.0059 | 1.1988 | −2.4536 | 0.98 | x > 1 |
| Tasseling stage | 0.67 | 0.1197 | −0.2435 | 0.85 | 0.0017 | 0.0407 | −0.3830 | 0.98 | x > 6 |
| 1.00 | 0.2600 | −0.3973 | 0.85 | 0.0037 | 0.2630 | −2.4034 | 0.98 | x > 4 |
| 1.67 | 0.3872 | 0.1321 | 0.92 | 0.0051 | 1.0998 | −3.0373 | 0.98 | x > 1 |
| Mature Stage | 0.67 | 0.1199 | −0.1574 | 0.96 | 0.0015 | 0.1610 | −1.4434 | 0.98 | x > 3 |
| 1.00 | 0.1836 | −0.1011 | 0.98 | 0.0022 | 0.3949 | −2.1726 | 0.98 | x > 2 |
| 1.67 | 0.4459 | −0.0337 | 0.98 | 0.0047 | 1.1614 | −4.5114 | 0.98 | x > 1 |
Table 4.
Regression analysis and goodness of fit of overland flow, cumulative runoff, and rainfall duration with different slopes.
Table 4.
Regression analysis and goodness of fit of overland flow, cumulative runoff, and rainfall duration with different slopes.
| Growing Stage | Slope (°) | y = mlnx + n | y = ax2 + bx + c | Variation Range of
x (min) |
|---|
| m | n | R | a | b | c | R |
|---|
| Jointing stage | 5 | 0.1068 | −0.2766 | 0.96 | 0.0010 | 0.0299 | −0.7738 | 0.98 | x > 19 |
| 15 | 0.0920 | −0.1994 | 0.98 | 0.0009 | 0.0610 | 0.9236 | 0.98 | x > 15 |
| 20 | 0.0834 | −0.1024 | 0.88 | 0.0006 | 0.1474 | −1.2652 | 0.98 | x > 11 |
| Tasseling stage | 5 | 0.1108 | −0.442 | 0.96 | 0.0005 | −0.0324 | 0.0729 | 0.98 | x > 59 |
| 15 | 0.0953 | −0.3309 | 0.98 | 0.0006 | −0.0158 | −0.2272 | 0.98 | x > 33 |
| 20 | 0.0915 | −0.2909 | 0.98 | 0.0007 | −0.0096 | −0.2118 | 0.98 | x > 22 |
| Mature Stage | 5 | 0.0500 | −0.1183 | 0.96 | 0.0004 | 0.0294 | −0.4474 | 0.98 | x > 12 |
| 15 | 0.0754 | −0.1800 | 0.90 | 0.0008 | 0.0247 | −0.3179 | 0.98 | x > 9 |
| 20 | 0.0792 | −0.1428 | 0.96 | 0.0009 | 0.0715 | −0.6603 | 0.98 | x > 7 |
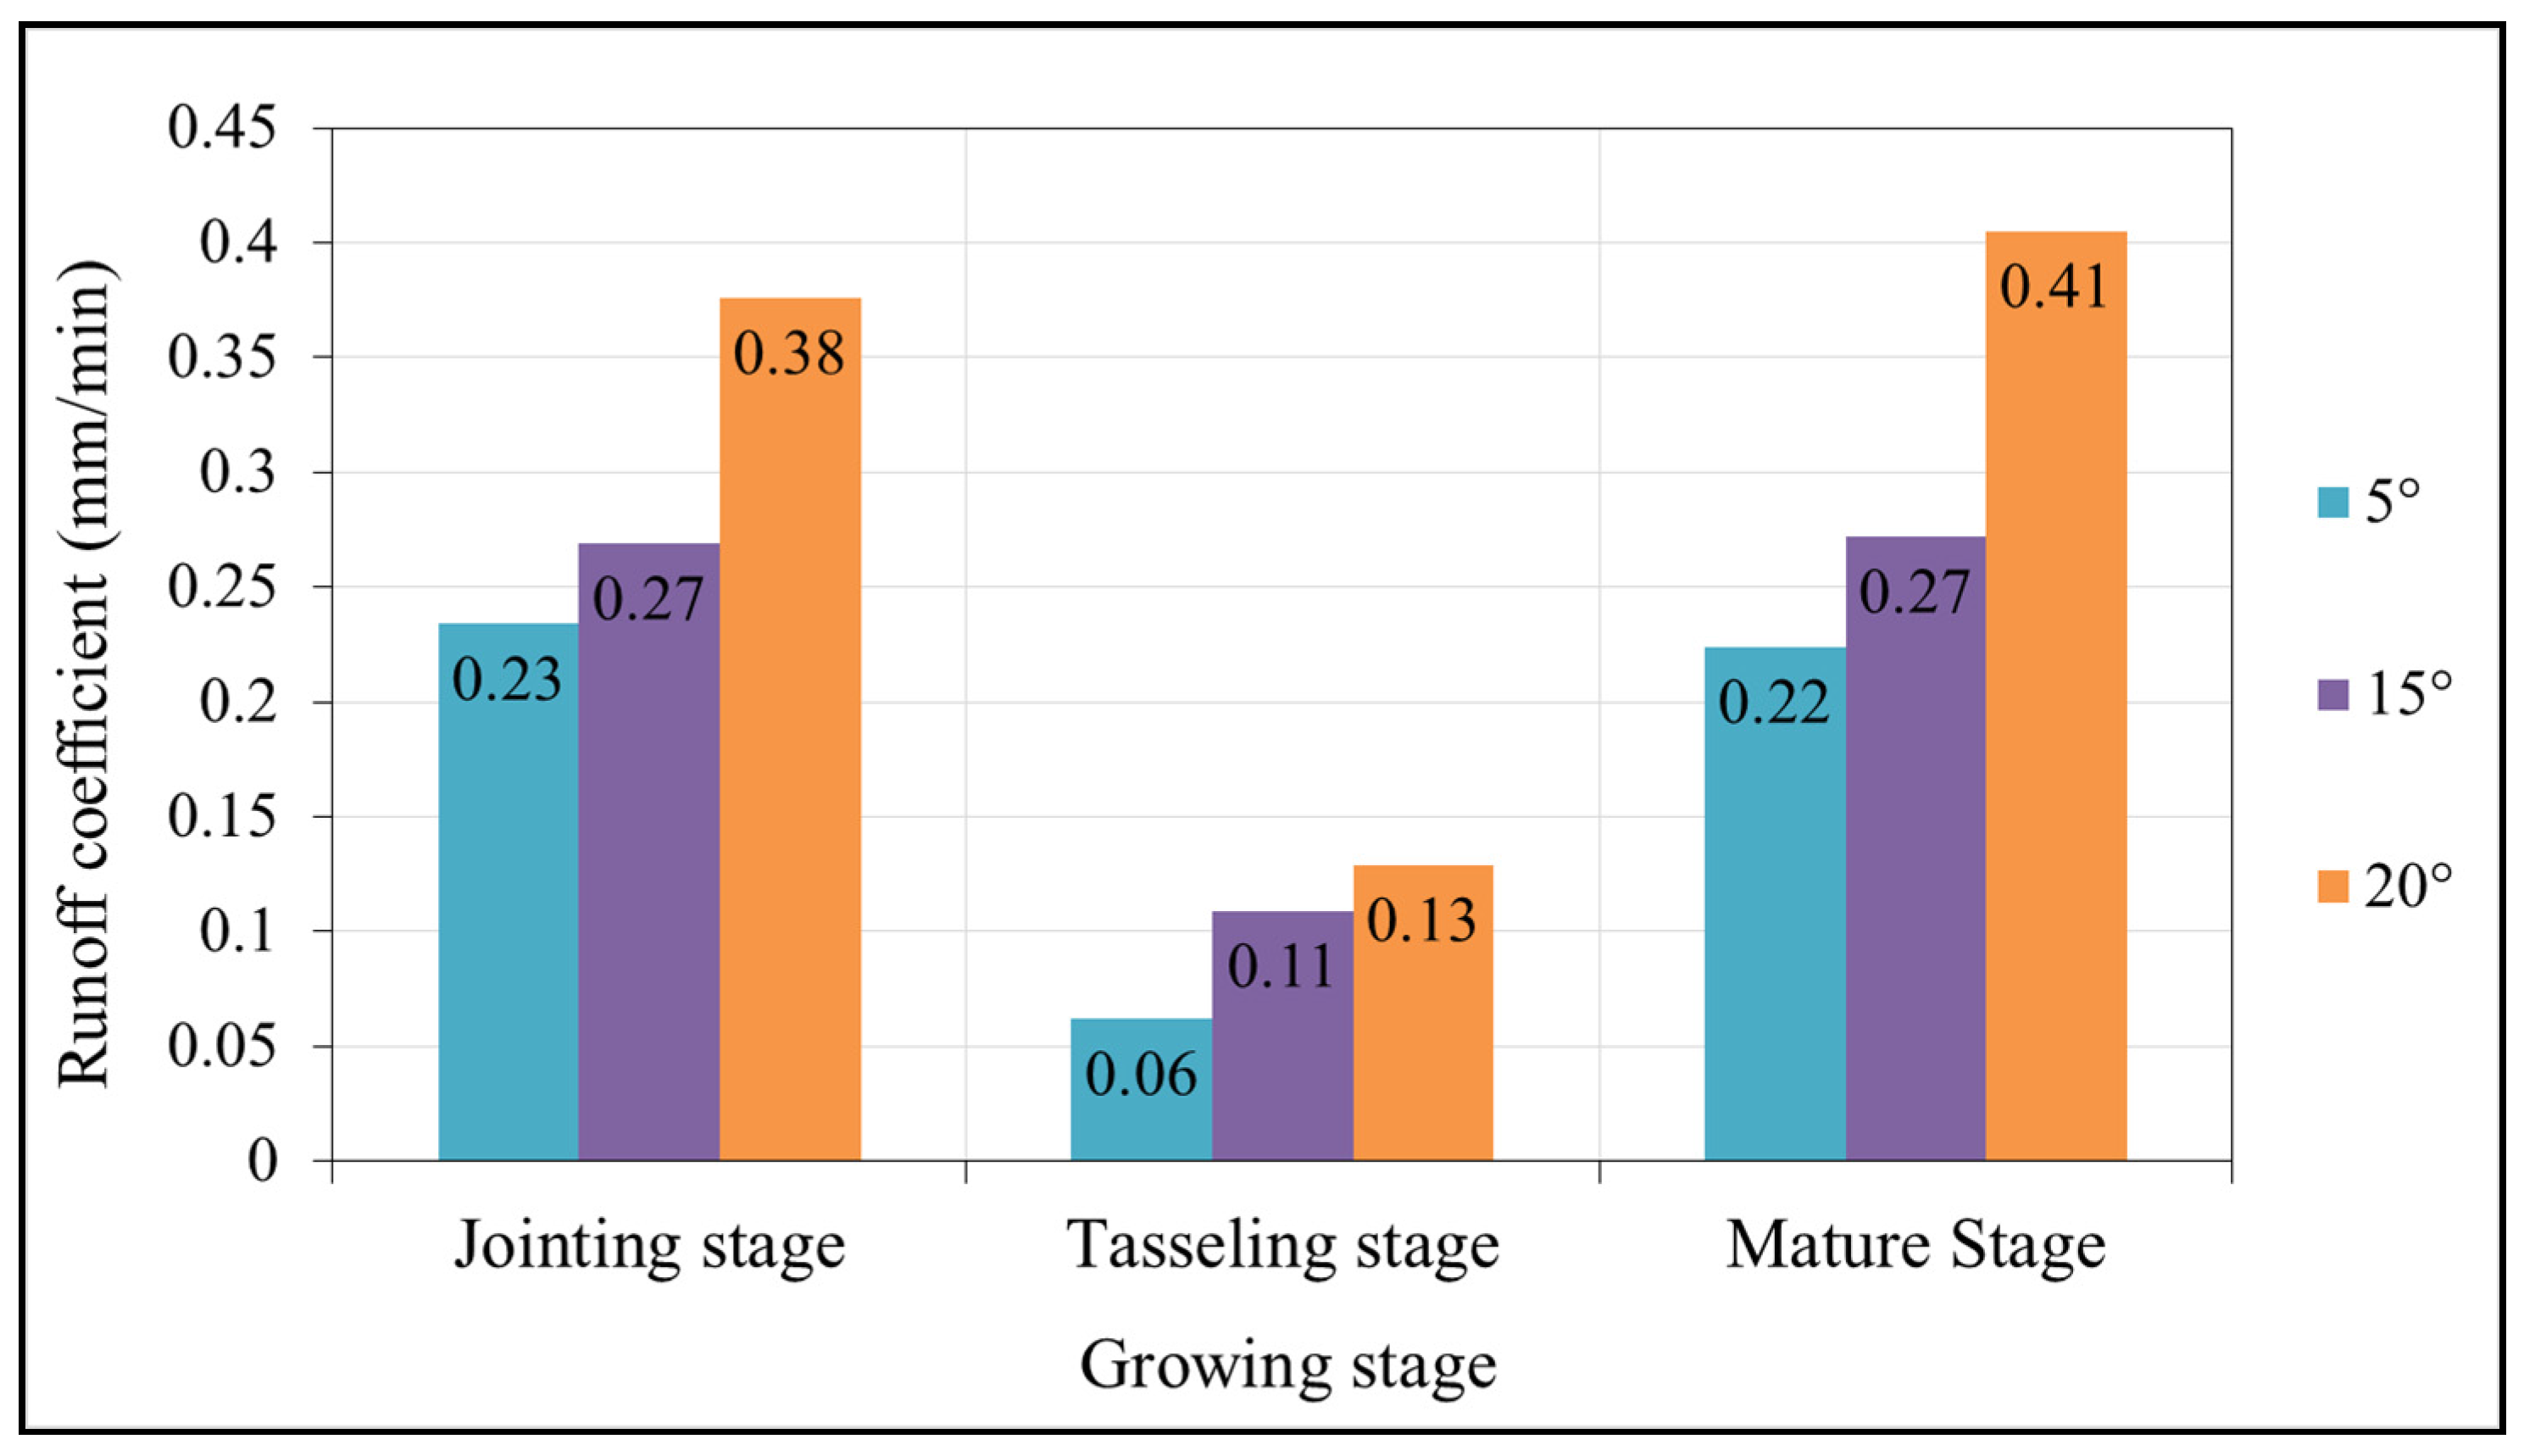
3.2.2. Analysis of Runoff Coefficient with Different Slopes
(1) Within a single growing stage of spring maize, the runoff coefficient increased with the increase in slope (
Figure 5). The same conclusion has been made in the literature [
26]. The increased slope resulted in a decrease in the soil infiltration rate that led to the increase in runoff. Among the growing stages, the effect of rainfall intensity (
i = 0.5 mm/min) on runoff coefficient was relatively small. Due to the high soil moisture content and low vegetation coverage in the mature stage, the runoff coefficient with various slopes was greater than in the other stages; the smallest runoff coefficients were observed with various slopes in the tasseling stage because of the low soil moisture content and high vegetation coverage.
Figure 4.
Variation of runoff coefficient in each growing stage with different rainfall intensities at a slope of 10 degrees.
Figure 4.
Variation of runoff coefficient in each growing stage with different rainfall intensities at a slope of 10 degrees.
Figure 5.
Variation of runoff coefficient in each growing stage with different slopes when the rainfall intensity is 0.5 mm/min.
Figure 5.
Variation of runoff coefficient in each growing stage with different slopes when the rainfall intensity is 0.5 mm/min.
(2) Among the nine rainfall events in each growing stage of spring maize with different slopes, the largest and smallest runoff coefficients were 0.34 and 0.07, respectively. The major factors affecting the runoff coefficient α were slope γ, rainfall duration
t, antecedent soil moisture content θ
0, and vegetation coverage
v. Relevant studies [
27,
28] reported that the relationship of runoff coefficient with antecedent soil moisture content and vegetation coverage was logarithmic and power function-based, respectively. Seeing as the runoff coefficient increased with the increase in slope and rainfall duration and gradually approached a certain value, this paper performed multivariate nonlinear regression analysis with particle swarm optimization by assuming that the relationship of the runoff coefficient with the sine of slope and rainfall duration is logarithmic. The expression is as follows:
where γ means slope (°), and the other parameters are as shown in Equation (2); the goodness of fit
R = 0.70.
3.2.3. Relationship between Runoff Coefficient and Various Affecting Factors
According to the above-noted analysis, the relationship of runoff coefficient
α with slope γ, rainfall intensity
i, rainfall duration
t, antecedent soil moisture content θ
0, and vegetation coverage
v is expressed as:
where the parameters are the same as above; the goodness of fit
R = 0.96, and the sample number
n = 18.
3.3. Analysis of Runoff Lag Time Variation in Each Growing Stage of Spring Maize with Different Rainfall Intensities and Slopes
3.3.1. Analysis of Runoff Lag Time with Different Rainfall Intensities
Theoretically the runoff lag time is defined as the time from the center of mass of rainfall excess to the center of mass of direct runoff [
30]. Since the rainfall is principally absorbed by vegetation interception, soil surface infiltration and the filling of soil macropores at the beginning of rainfall, there was an obvious time lag (
i.e., the initial loss duration of rainfall) between the start of rainfall and the formation of overland flow. Runoff lag time reflects the slope runoff generation rate upon the occurrence of rainfall, and thus serves as an important indicator for describing the runoff generation rule [
29].
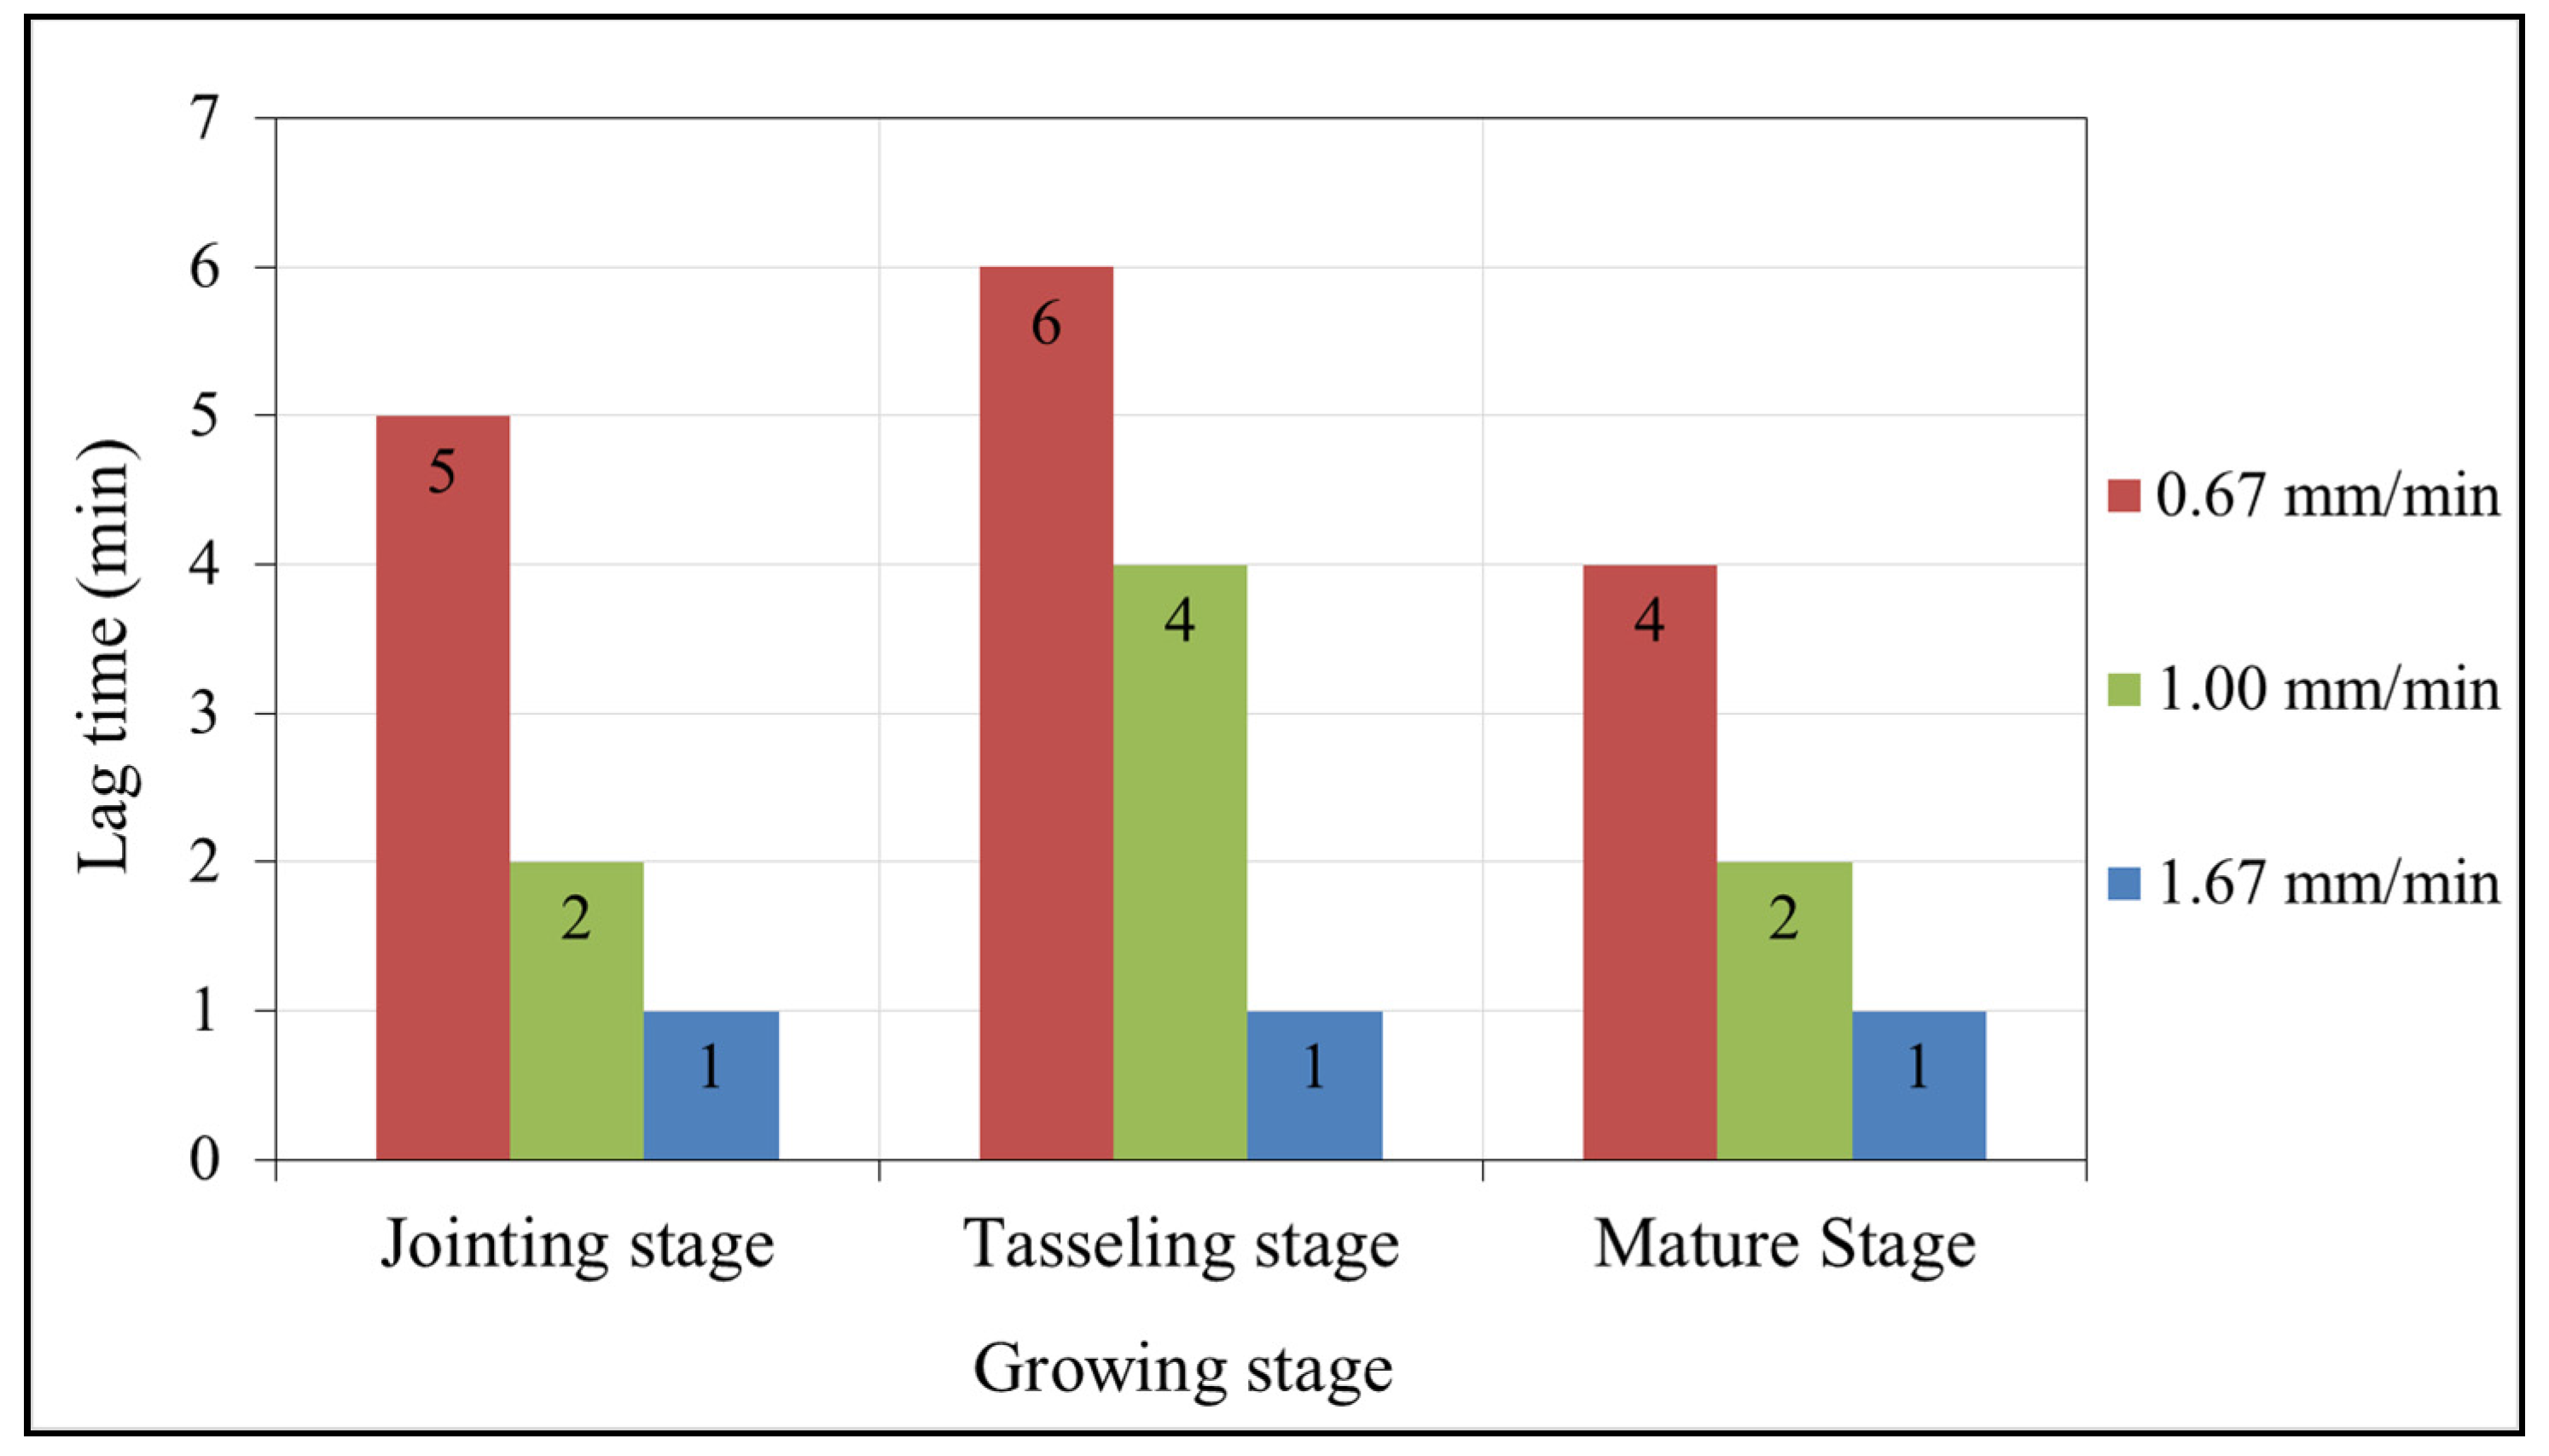
Figure 6 showed the comparison among different growing stages of spring maize in respect of runoff lag time. According to the test results:
(1) Within a single growing stage, the runoff lag time decreased with the increase in rainfall intensity. Yuan
et al. came to the same conclusion through a field rainfall runoff test [
29], in that the effect of vegetation coverage and antecedent soil moisture content,
etc. on runoff generation was lower under the condition of the greater rainfall intensity.
(2) Among the different growing stages, the rainfall intensity was so high (i = 1.67 mm/min) that the effect of vegetation coverage and antecedent soil moisture content on runoff lag time was negligible; therefore, the runoff lag time was almost the same. Under the condition of i = 1.0 mm/min, the longest runoff lag time was observed in the tasseling stage. The high vegetation coverage and low antecedent soil moisture content led to a considerable initial loss of runoff, thus resulting in the increase in runoff lag time. When i = 0.67 mm/min, the longest runoff lag time was still seen in the tasseling stage for the same reason with i = 1.0 mm/min. Furthermore, since the antecedent soil moisture content was higher in the mature stage than in the jointing stage and the coverage in the mature stage was lower than in the jointing stage, the runoff lag time of the mature stage was less than that of the jointing stage.
Figure 6.
Variation of runoff lag time in each growing stage of spring maize with different rainfall intensities at a slope of 10°.
Figure 6.
Variation of runoff lag time in each growing stage of spring maize with different rainfall intensities at a slope of 10°.
(3) Under the condition of different rainfall intensities, the lag time
t0 of surface runoff is immediately associated with rainfall intensity
i, antecedent soil moisture content θ
0, and vegetation coverage
v with different rainfall intensities. Considering that runoff lag time had a power function-based relation with rainfall intensity [
28], a linear negative relation with antecedent soil moisture content [
27], and a logarithmic relation with vegetation coverage [
31], multivariate nonlinear regression analysis was performed with particle swarm optimization to determine the relationship between runoff lag time
t0 and various affecting factors based on RRP test data. The relational expression is as follows:
where
t0 means runoff lag time (min), and the other parameters are as shown in Equation (2); the goodness of fit
R = 0.92.
3.3.2. Analysis of Runoff Lag Time with Different Slopes
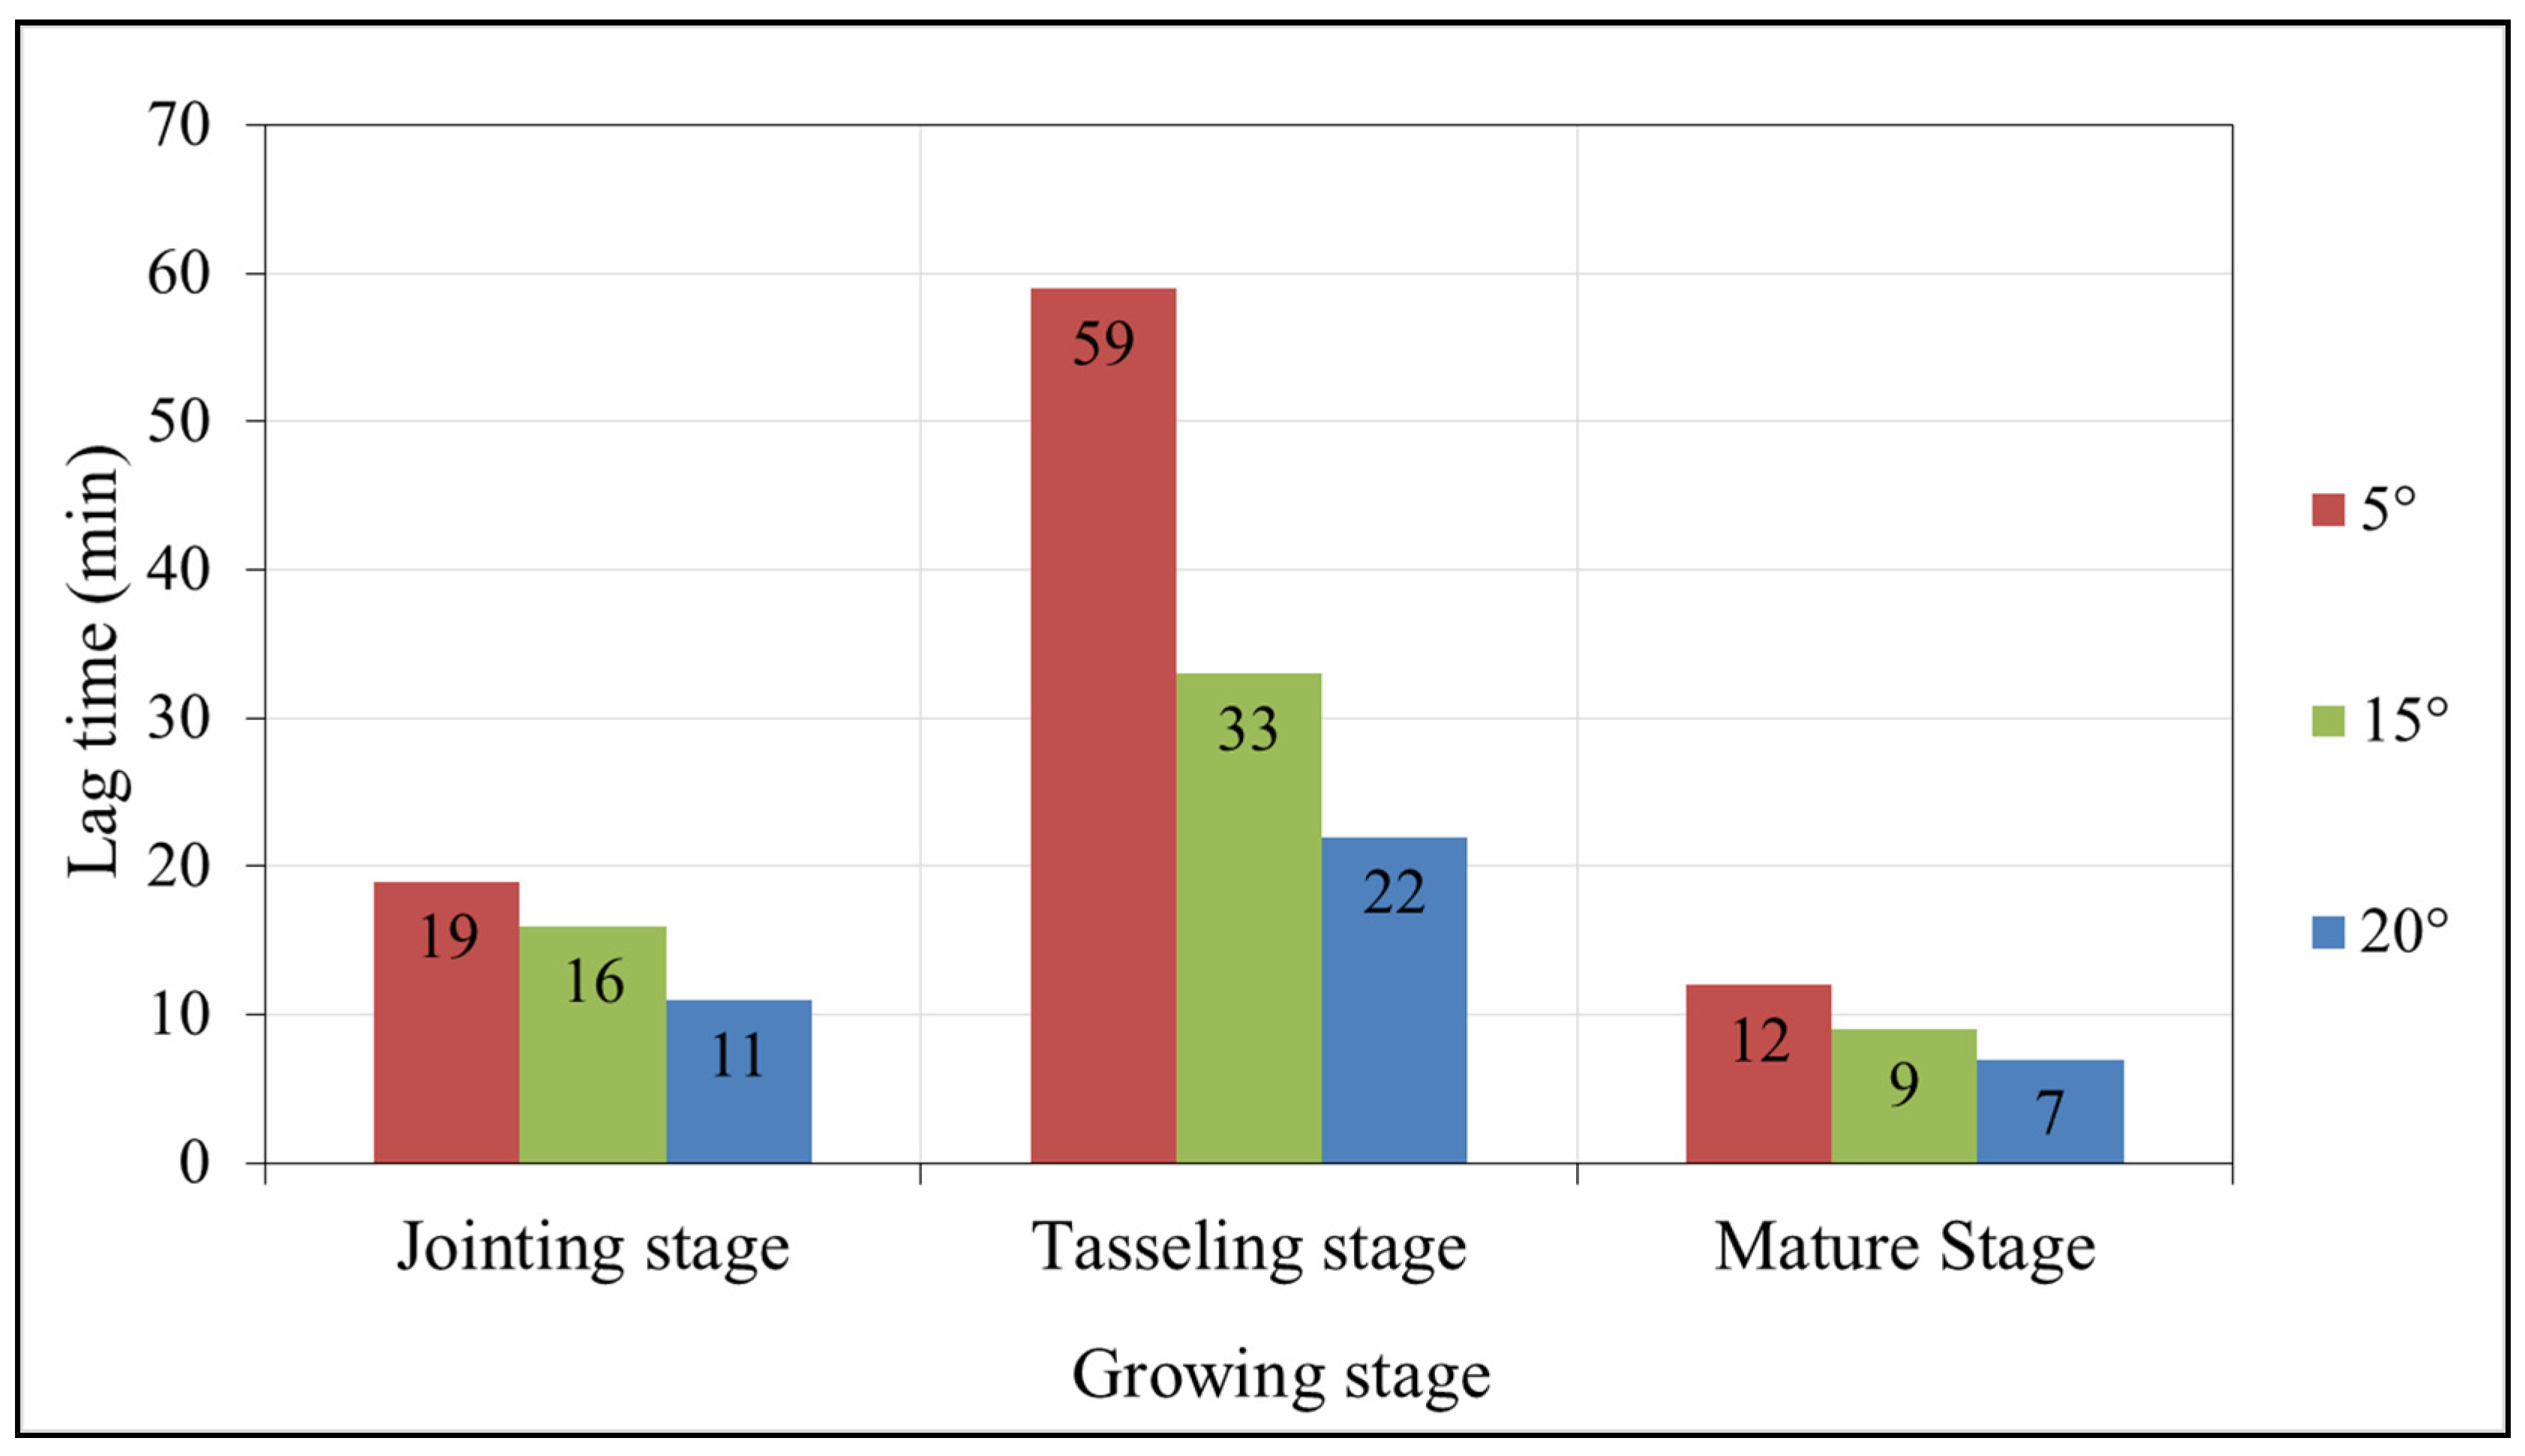
(1) Runoff lag time decreased with the increase in slope under the same external conditions within a single growing stage (
Figure 7). The same conclusion has been derived from the literature [
29]. This was mainly because the decrease in soil infiltration rate resulting from the increase in slope became a key factor in the point scale.
(2) The longest, the second longest, and the shortest runoff lag time were observed in the tasseling stage, jointing stage, and mature stage, respectively, at the same slope (
Figure 7). One reason was that the high vegetation coverage and low soil moisture content in the tasseling stage resulted in a long runoff lag time. Another was that due to the lower vegetation coverage and higher antecedent soil moisture content in the mature stage than in the jointing stage, the shortest runoff lag time was observed in the mature stage. Hence, the vegetation coverage and antecedent soil moisture content were principal factors affecting rainfall runoff where rainfall intensity was relatively low.
Figure 7.
Variation of runoff lag time in each growing stage of spring maize with different slopes when the rainfall intensity is 0.5 mm/min.
Figure 7.
Variation of runoff lag time in each growing stage of spring maize with different slopes when the rainfall intensity is 0.5 mm/min.
(3) Under the condition of different slopes, the lag time
t0 of overland flow was principally affected by the slope γ, antecedent soil moisture content θ
0, and vegetation coverage
v. Jiang and Huang researched into the rainfall runoff characteristics of old manured loessal soil with different slopes through the laboratory simulation of rainfall infiltration, and reported that the relationship between runoff lag time and the sine of slope was exponential [
32]. In the meantime, runoff lag time exhibited a linear negative correlation with antecedent soil moisture content [
27], and a logarithmic relationship with vegetation coverage [
31]. Accordingly, multivariate nonlinear regression analysis was performed with particle swarm optimization based on RRP test data to determine the relationship between runoff lag time and various affecting factors. The relational expression is as follows:
where the parameters are the same as in Equation (5); the goodness of fit
R = 0.83.
3.3.3. Relationship between Runoff Lag Time and Various Affecting Factors
According to the above-noted analysis, the relationship of runoff lag time
t0 with slope γ, rainfall intensity
i, rainfall duration
t, antecedent soil moisture content θ
0, and vegetation coverage
v is expressed as:
where the parameters are the same as above; the goodness of fit
R = 0.78, and the sample number
n = 18.
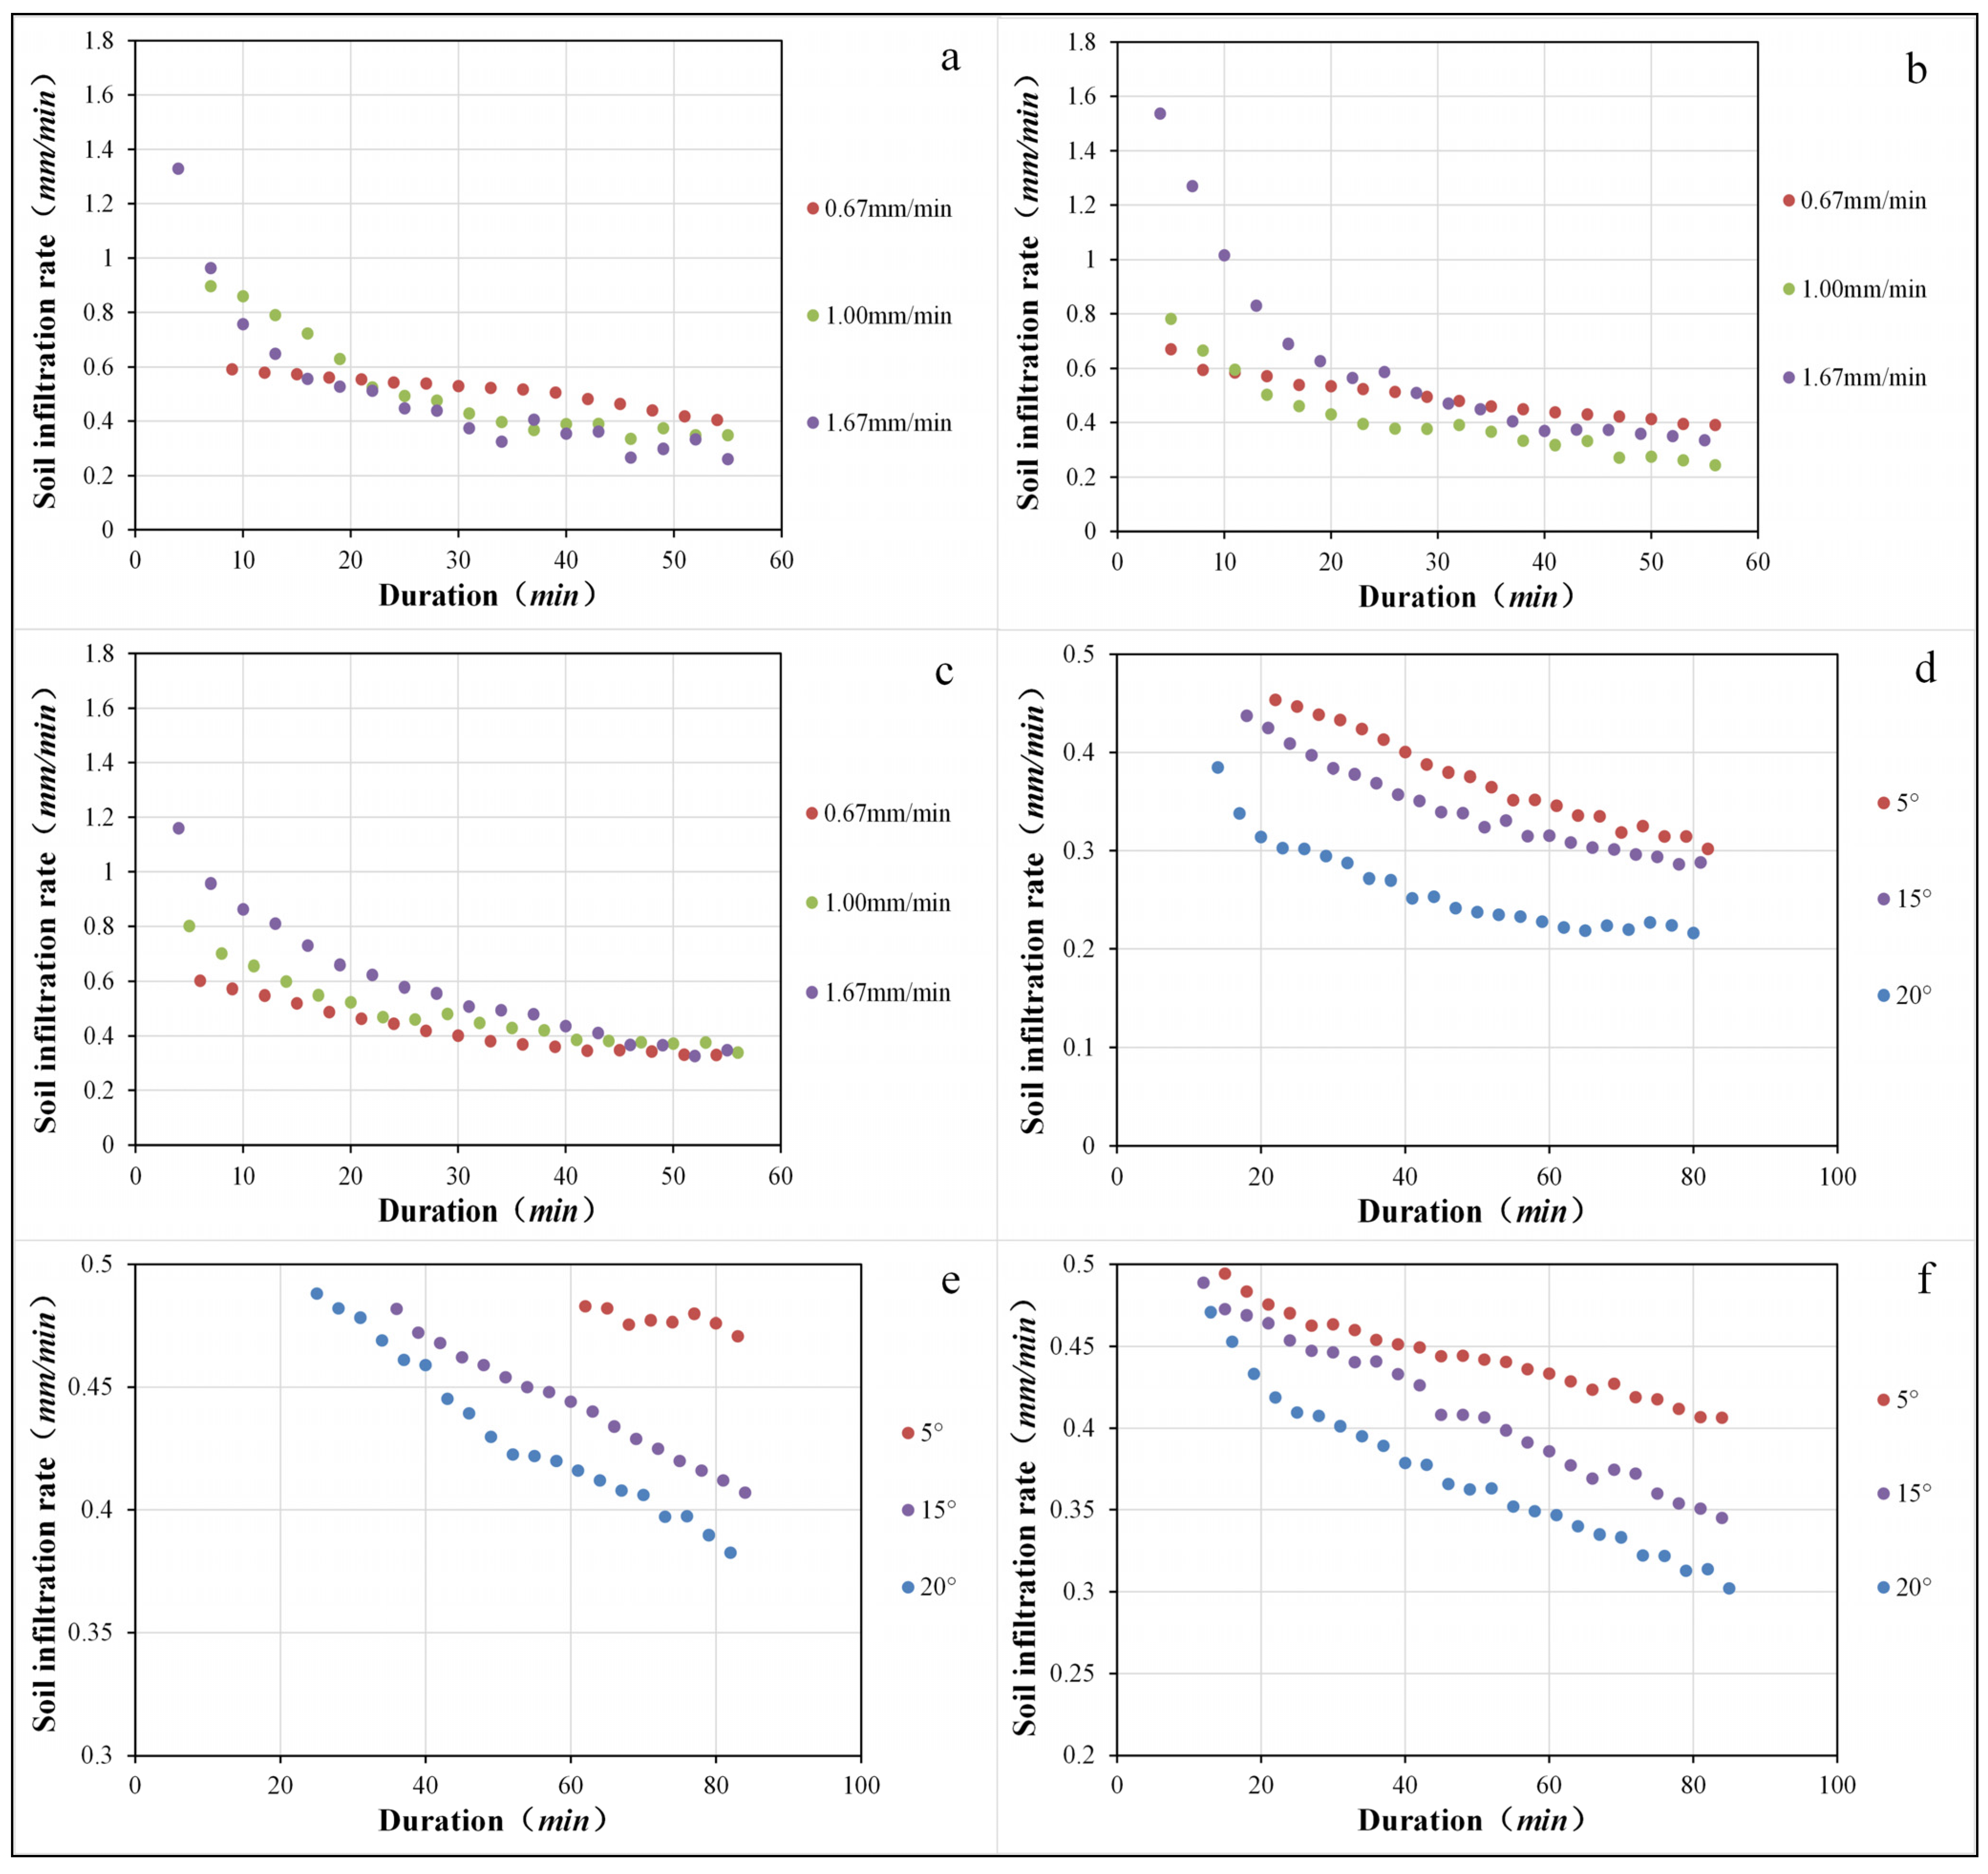
3.4. Analysis of Dynamic Variation of Soil Infiltration Rate in Each Growing Stage of Spring Maize with Different Rainfall Intensities and Slopes
The soil infiltration rate was calculated by Equation (1) based on the measured rainfall intensity and slope,
etc. (
Figure 8). As shown in
Figure 8, the infiltration rate decreased gradually and eventually got relatively stable (
i.e., stable infiltration rate) with the increase in rainfall duration.
Figure 8a–c showed that the soil infiltration rate curve became steep with the increase in rainfall intensity. Furthermore, the antecedent soil moisture content had a much lower effect on the soil infiltration rate as compared with the rainfall intensity in each growing stage, which indicated that the effect of antecedent soil moisture content on the soil infiltration rate decreased gradually with the increase in rainfall intensity [
33].
Figure 8d–f showed that the soil infiltration rate might vary significantly depending on slope. The soil infiltration rate exhibited an obvious gentle downward trend when the slope was 5°, and showed the highest rate of descent at a slope of 20°. It was obvious that the increase in runoff resulting from the gradual decrease in soil infiltration rate was greater than the decrease in runoff arising from the decrease in receiving area as the slope increased. Furthermore, the soil infiltration rate in the tasseling stage was higher as compared with the other stages due to the relatively low antecedent soil moisture in the tasseling stage. This indicated that antecedent soil moisture could closely affect the soil infiltration rate under the premise of relatively low rainfall intensity; that is to say, the lower the antecedent soil moisture content was, the faster the descent rate of infiltration rate.
Traditional models of rainfall infiltration (
i.e., the Kostiakov, Horton, and Philip models) were used to perform regression analysis on the rainfall–infiltration relationship with different rainfall intensities and slopes in each growing stage of spring maize (
Table 5 and
Table 6). According to the results of
Table 5 and
Table 6:
(1) In view of the fact that the variation range of goodness-of-fit of the Kostiakov model was 0.85–0.99 and 0.89–0.99, respectively, and that the mean goodness-of-fit was 0.93 and 0.96, respectively, this model exhibited a perfect fitting effect on the measured data. Parameter b in the Kostiakov model reflected the decrease of infiltration rate with time, and its variation range is 0.40–1.54 and 0.40–2.04, respectively.
(2) In view of the fact that the variation range of goodness-of-fit of the Horton model was 0.96–0.99 and 0.91–0.99, respectively, and that the mean goodness-of-fit was 0.98 and 0.97, respectively, this model exhibited the best fitting effect on the measured data. The k value in this model reflected the slope variation of infiltration curve, and the variation range was 8.82–85.81 and 11.24–359.51, respectively. The smaller the k value was, the faster the infiltration rate decreased.
(3) The variation range of goodness-of-fit of the Philip model is 0.80–0.98 and 0.84–0.99, respectively, and the mean goodness-of-fit is 0.89 and 0.84, respectively. The Philip model brought about poor results when compared with the Kostiakov and Horton models. This is largely attributable to the fact that the Philip equation is achieved under the assumption of semi-infinite homogeneous soil, homogeneously distributed initial soil moisture content, and water logging. Therefore, this equation is applicable only to one-dimensional vertical infiltration in homogeneous soil, and further research and perfection are still needed for heterogeneous soil. What is more, the natural infiltration happens under the condition of rainfall in most cases and greatly differs from ponding infiltration. Hence, the simulating effect of the Philip model was the lowest.
The above analysis showed that the Horton infiltration model could satisfactorily estimate the soil infiltration rate and capacity, while the Kostiakov model exhibited favorable applicability. Zhao
et al. and Liu
et al. came to the same conclusion [
4,
33].
Figure 8.
Curve of soil infiltration in growth period of spring maize: (a), (b) and (c) show the soil infiltration curves with different rainfall intensities in the jointing stage, tasseling stage, and mature stage, respectively; (d), (e) and (f) show the soil infiltration curves with different slopes in the three stages, respectively.
Table 5.
Regression analysis with rainfall infiltration models at different rainfall intensities.
Table 5.
Regression analysis with rainfall infiltration models at different rainfall intensities.
| Growth Period | Rainfall Intensity (mm/min) | Kostiakov Model | Horton Model | Philip Model |
|---|
| f(t) = a·t−b | f(t) = a + b·exp(−t/k) | f(t) = a·t−0.5 + b |
|---|
| a | b | R | a | b | k | R | a | b | R |
|---|
| Jointing stage | 0.67 | 1.030 | 0.236 | 0.95 | 0.285 | 0.398 | 43.364 | 0.99 | 1.064 | 0.257 | 0.89 |
| 1.00 | 1.403 | 0.318 | 0.93 | 0.296 | 0.724 | 23.075 | 0.97 | 1.381 | 0.208 | 0.87 |
| 1.67 | 1.938 | 0.378 | 0.85 | 0.320 | 1.540 | 12.698 | 0.99 | 1.851 | 0.181 | 0.80 |
| Tasseling stage | 0.67 | 1.058 | 0.229 | 0.88 | 0.147 | 0.522 | 85.811 | 0.96 | 1.104 | 0.020 | 0.82 |
| 1.00 | 2.022 | 0.429 | 0.91 | 0.275 | 0.936 | 18.677 | 0.98 | 2.140 | 0.074 | 0.90 |
| 1.67 | 1.818 | 0.416 | 0.92 | 0.324 | 1.506 | 8.816 | 0.99 | 1.773 | 0.108 | 0.90 |
| Mature Stage | 0.67 | 0.964 | 0.260 | 0.96 | 0.294 | 0.427 | 21.889 | 0.99 | 0.935 | 0.218 | 0.90 |
| 1.00 | 1.475 | 0.355 | 0.99 | 0.324 | 0.712 | 15.771 | 0.97 | 1.522 | 0.154 | 0.98 |
| 1.67 | 1.788 | 0.370 | 0.95 | 0.335 | 1.258 | 13.551 | 0.96 | 1.688 | 0.182 | 0.91 |
Table 6.
Regression analysis with rainfall infiltration models at different slopes.
Table 6.
Regression analysis with rainfall infiltration models at different slopes.
| Growth Period | Slope (°) | Kostiakov Model | Horton Model | Philip Model |
|---|
| f(t) = a·t−b | f(t) = a + b·exp(−t/k) | f(t) = a·t−0.5 + b |
|---|
| a | b | R | a | b | k | R | a | b | R |
|---|
| Jointing stage | 5 | 1.241 | 0.312 | 0.98 | 0.244 | 0.356 | 48.001 | 0.98 | 1.538 | 0.148 | 0.97 |
| 15 | 1.099 | 0.307 | 0.99 | 0.275 | 0.355 | 26.142 | 0.98 | 1.332 | 0.141 | 0.99 |
| 20 | 1.121 | 0.392 | 0.89 | 0.228 | 0.651 | 11.245 | 0.92 | 1.245 | 0.066 | 0.90 |
| Tasseling stage | 5 | 0.748 | 0.104 | 0.91 | 0.278 | 0.247 | 359.510 | 0.91 | 0.919 | 0.371 | 0.91 |
| 15 | 1.087 | 0.222 | 0.99 | 0.275 | 0.292 | 106.080 | 0.99 | 1.530 | 0.237 | 0.97 |
| 20 | 0.989 | 0.214 | 0.98 | 0.290 | 0.278 | 75.792 | 0.99 | 1.278 | 0.245 | 0.97 |
| Mature Stage | 5 | 0.658 | 0.105 | 0.97 | 0.341 | 0.175 | 88.036 | 0.98 | 0.540 | 0.658 | 0.93 |
| 15 | 0.762 | 0.168 | 0.91 | –0.046 | 0.559 | 89.008 | 0.99 | 0.760 | 0.286 | 0.84 |
| 20 | 0.822 | 0.218 | 0.98 | 0.267 | 0.264 | 47.323 | 0.98 | 0.940 | 0.220 | 0.96 |
4. Conclusion
This paper probes into the dynamic variation of rainfall runoff and soil moisture content with different rainfall intensities and slopes in the jointing stage, tasseling stage, and mature stage of spring maize. Based on the test conditions and methods of this study, conclusions were drawn as follows:
(1) The overland flow and cumulative runoff increased with the increased rainfall intensity and slope in various growing stages of spring maize, respectively. The increasing relationship with rainfall duration, overland flow, and cumulative runoff, respectively, complied with logarithmic and quadratic functions before reaching stable runoff.
(2) The runoff coefficient α increased with the increase in rainfall intensity and slope. When the rainfall intensity was relatively low, the runoff coefficient was found to be the lowest in the tasseling stage and the highest in the mature stage, and was mainly affected by rainfall intensity along with the increase in rainfall intensity. At different slopes, the highest and lowest runoff coefficients were also observed in the mature stage and tasseling stage, respectively. Additionally, the relationship of α with slope γ, rainfall intensity i, rainfall duration t, antecedent soil moisture θ0, and vegetation coverage v could be expressed by the equation α = 0.066ln(sinγ) + 0.600lni + 0.150lnt + 0.152lnθ0 + 0.250v−0.180.
(3) Within the same growing stage, runoff lag time t0 decreased with the increase in rainfall intensity and slope. Due to the influence of vegetation coverage and antecedent soil moisture, the tasseling stage offered the longest runoff lag time among the whole growing stages of spring maize with different rainfall intensities and slopes. In addition, t0 was principally affected by γ, i, θ0, and v, and the relationship could be expressed by the equation t0 = 41.7exp(−2.51sinγ) + 0.150i−7.44 − 118θ0 + 1.80lnv.
(4) The descent rate of the soil infiltration rate curve was directly proportional to the increased rainfall intensity in various growing stages of spring maize and the effect of antecedent soil moisture content on the soil infiltration rate decreased gradually. When the rainfall intensity was relatively low, the antecedent soil moisture could significantly affect soil infiltration rate at different slopes. With the increase in slope, the increasing value in runoff resulting from the gradual decrease in soil infiltration rate was greater than the decreasing value in runoff arising from the decrease in receiving area. Furthermore, with respect to the sandy loam in this test, the Horton infiltration model could satisfactorily estimate the soil infiltration rate and capacity, while the Kostiakov model exhibited favorable applicability.
In view of the constraints of the test conditions, this paper mainly studied the influences of different rainfall intensity and slope on the RRP and soil moisture content throughout the growing stage of spring maize. It is hoped that this study may gain more insight into the interactions among slope gradient, rainfall intensity, runoff, and soil infiltration and be of great significance in understanding the water cycle mechanism in semiarid regions. Furthermore, this paper only analyzes the relationship among rainfall intensity, slope, runoff, and soil infiltration rate. Meanwhile, the scale of the soil bin is too small based on the constrained test conditions. Therefore, it is necessary to expand the study scale and apply the test study to the influence of other factors on the RRP, e.g., vegetation, soil properties, soil crust, etc.


