Abstract
Groundwater is an important source of water. Since the control and removal of pollution are expensive, it is essential to identify the possible sources of contamination and to correctly classify groundwater on the basis of its intrinsic and integrated vulnerability. In the last years, many fuzzy models have been developed. There is a lack, however, of studies concerning the application of fuzzy logic for the assessment of the susceptibility of groundwater quality to anthropogenic activities and comparing these methods with traditional methods. The fuzzy model described in this paper assesses the aquifer integrated environmental vulnerability connected to the presence of illegal dumpsites and allows us to hierarchically classify them within a hazard scale. The results allowed us to carry out a comparison of the proposed fuzzy method with a traditional method. The fuzzy method proved to be a useful and objective tool for environmental planning.
1. Introduction
In arid and semi-arid regions, groundwater is an important source of water. Since the control and removal of pollution are expensive, it is essential to identify the possible sources of contamination and to correctly classify groundwater on the basis of its intrinsic and integrated vulnerability. Sources of groundwater pollution are basically of two types: diffuse and point sources. Examples of this type of pollution are found everywhere. Groundwater pollution, in almost all cases, is due to human activities. The sources of groundwater pollution are in fact associated with a wide range of industrial, agricultural, commercial and domestic activities (such as industrial installations, landfills of waste, mining and quarrying activities, urban centres, lines of communication and infrastructure links, agricultural activities, livestock activities, and other activities that involve water systems). In the literature, two types of vulnerability are described: intrinsic and integrated (or specific) vulnerability. The latter differs from the first one, because it takes into account the sources of pollutants []. The assessment of aquifer pollution hazard should combine the vulnerability of the element at risk, i.e., the aquifer, with the hypothetical contaminating element, i.e., illegal dumpsites as in this study.
Methods of hierarchical classification of aquifer vulnerability can be used for a rapid assessment and mitigation of aquifer pollution hazard. These methods allow us to identify which sites immediately require remediation activities. In fact, integrated vulnerability ranking aims at developing policies and guidelines for the sustainable management of water and groundwater resources [].
The intrinsic or natural vulnerability of aquifers is the specific susceptibility to pollution of the aquifer systems, in their different components and in different geometric and hydrodynamic situations. Vulnerability is the capacity to interact, disseminate and also to mitigate the effects of a pollutant that creates an impact on the quality of groundwater, in space and time.
In the last decades, groundwater vulnerability assessment has been the subject of many studies. Developed methods can be divided into three categories: statistical methods, process-oriented simulation models and index methods [,]. Process-oriented numerical models are used for site-specific studies and not for mapping vulnerability on a large scale. The main disadvantage of numerical models is not related to the mathematical complexity, but to the fact that most of them were made for soils of medium to high porosity. Numerical models, suitable for small portions of land, are numerous, such as MACRO 4.3 (dual-permeability model; [,]), RZWQM98 (dual-permeability model, []), Hydrus-1D (dual-porosity and dual permeability model [,]), and LEACHM []. Statistical methods used for aquifer vulnerability assessment comprise: descriptive statistics, multivariate regression analysis, and complex statistical analysis [].
A number of index methods have been developed for the evaluation and mapping of the intrinsic aquifer vulnerability on a large scale. The most widely applied method to assess environmental vulnerability of groundwater is the DRASTIC method, adopted by the United States Environmental Protection Agency. The DRASTIC method is a parametric method, based on the allocation of scores and weights to different factors that influence the vulnerability of an aquifer [,].
In addition to the previously described methods, one of the methods of vulnerability assessment mostly used throughout the world is the geological approach. This method assesses the vulnerability by using a set of protocols for situations of varying complexity. This assessment is not influenced by the number and quality of data available but by the experience of the users. In the case of very large areas to be analysed, Civita M. [,] proposes the GNDCI-CNR method (National Group for the Defence from Hydrogeological Disasters-National Research Council) to assess the aquifer vulnerability. This method is suitable for large areas with different geological, hydrogeological and morphological conditions, in which data and information do not have a homogeneous distribution in the area.
In the last decade, a number of researchers started to develop and apply fuzzy and neuro-fuzzy models aiming at assessing groundwater intrinsic and integrated vulnerability [,,,,,,]. In particular, a number of recent studies applied fuzzy methods for environmental risk analysis and management, whenever the availability and reliability of data are not enough for quantitative methods []. However, there is a lack, in literature, of studies proving the real advantage of fuzzy methods if compared with traditional methods. Moreover, there is a lack of studies concerning the application of fuzzy logic for the assessment of the specific vulnerability of groundwater connected to the presence of different pollution sources, and for hierarchically classifying these pollution sources within a hazard scale and thus understanding which one requires attention more urgently.
The objective of this study is to evaluate the pollution risk of the illegal dumpsites that are located in the Basilicata region (Southern Italy). In this study, the hydrogeological intrinsic vulnerability was evaluated with a method of zoning for homogeneous areas (GNDC-CNR method). While, fuzzy logic analysis was used to overcome the major drawbacks of conventional overlay analyses (i.e., the subjective weightings and discrete ratings) in developing the integrated vulnerability index []. Fuzzy logic, associated with a sensitivity analysis, was applied to: identify the difference between fuzzy and conventional methods for the assessment of integrated groundwater vulnerability, determine a ranking of the pollution risk of each illegal dumpsite, and carry out a validation of the developed fuzzy method.
2. Materials and Methods
2.1. Intrinsic and Integrated Groundwater Vulnerability
In general terms, risk can be defined as a combination of hazard and vulnerability:
where “vulnerability” indicates the degree of intrinsic weakness of the investigated natural system (intrinsic vulnerability) and “hazard” represents the probability that a detrimental event will occur in a given area in a period of time [].
Risk = Vulnerability × Hazard
In this study, the considered sources of pollution are illegal dumpsites (Figure 1).
Since the study in question concerns the entire territory of the Basilicata region (Southern Italy), which has an area of about 10,000 km2, the hydrogeological intrinsic vulnerability was evaluated with a method of zoning for homogeneous areas, the GNDC-CNR method (see Section 2.2.1).
A statistical approach can be used to evaluate the degree of hazard, in order to analyse the probability that a dangerous event may occur. In our case, the conditional probability is the probability that the concentration of a given pollutant is greater than a given threshold []. The major limits of this approach are the difficulty in finding detailed data, collected by monitoring a process, to evaluate the probability that the phenomenon considered might happen. Among the different models applied to the evaluation of groundwater pollution risk in a quantitative way, complex mathematical models can be considered the most reliable. However, a lot of detailed information and/or data often not available, inaccurate or doubtful are required, to run these models. To overcome the shortage of reliable information, an algorithmic approach has been integrated with a qualitative one. The hazard assessment was carried out using two methods (a traditional score and weight method and a fuzzy logic model). The same methods were used to integrate the intrinsic vulnerability of aquifers and the hazard of landfills, in order to calculate the risk of pollution of the illegal dumpsites. The parameters describing the possible sources of pollution are the same for both methods: water table depth, site acclivity, leachate production, waste volume and type, soil coverage, presence of monitoring system and river proximity index.
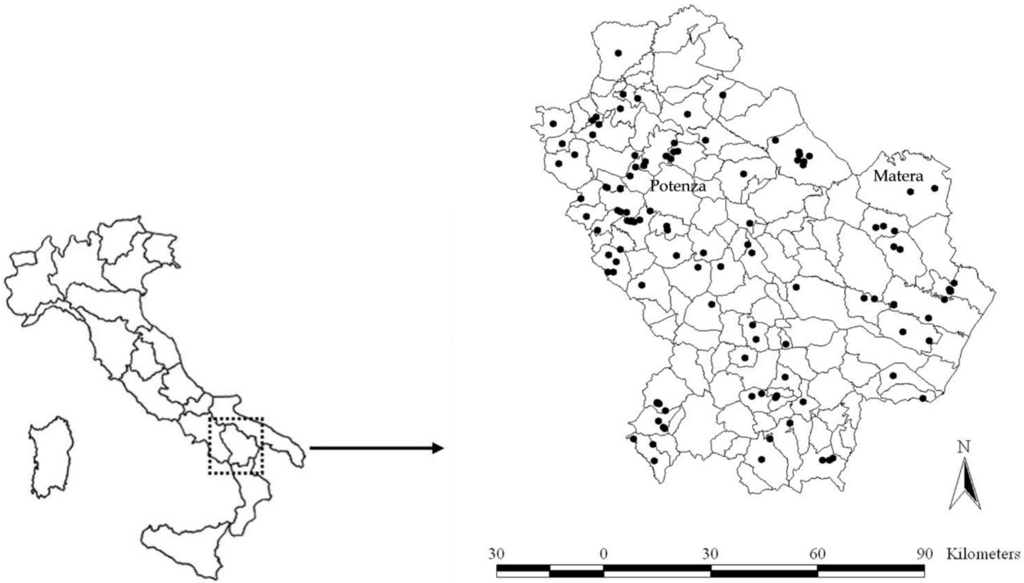
Figure 1.
Location of the illegal dumpsites in the region of Basilicata (Italy).
Aquifer Intrinsic Vulnerability: The GNDCI-CNR Method
The GNDCI-CNR method [,] allows us a qualitative evaluation of the aquifer pollution vulnerability. It is a method of zoning for homogeneous areas and it requires no numerical parameters. The method uses a protocol in which each Italian hydrogeological situation has a degree of vulnerability.
The hydrogeological situations have been divided according to geometry, lithology and effective porosity of the aquifers.
Hence, the intrinsic vulnerability of aquifers can be defined by identifying the hydrogeological situation of interest among those listed. The method is very flexible and can be adapted to specific situations which are not listed in the protocol of methodology. This protocol must be used for assessing the vulnerability, which is characterized by all the typical situations. These situations are identified by the main factors that influence the aquifer vulnerability, such as depth, porosity, fractures, karst phenomena and piezometric level. The hydrological situations are placed in a legend composed of six columns, each of which is related to the degree of intrinsic vulnerability (Figure 2). This immediately makes the legend interpretative and usable for creation, interpretation and reading of the vulnerability map.
The vulnerability assessment is qualitative and based on the comparison between the situation of hydrogeological interest and the reference situation of hydrological conditions. The vulnerability map was obtained by taking into account different hydrological scenarios and by assigning the following degrees of intrinsic vulnerability: very high, high, medium, low, very low.
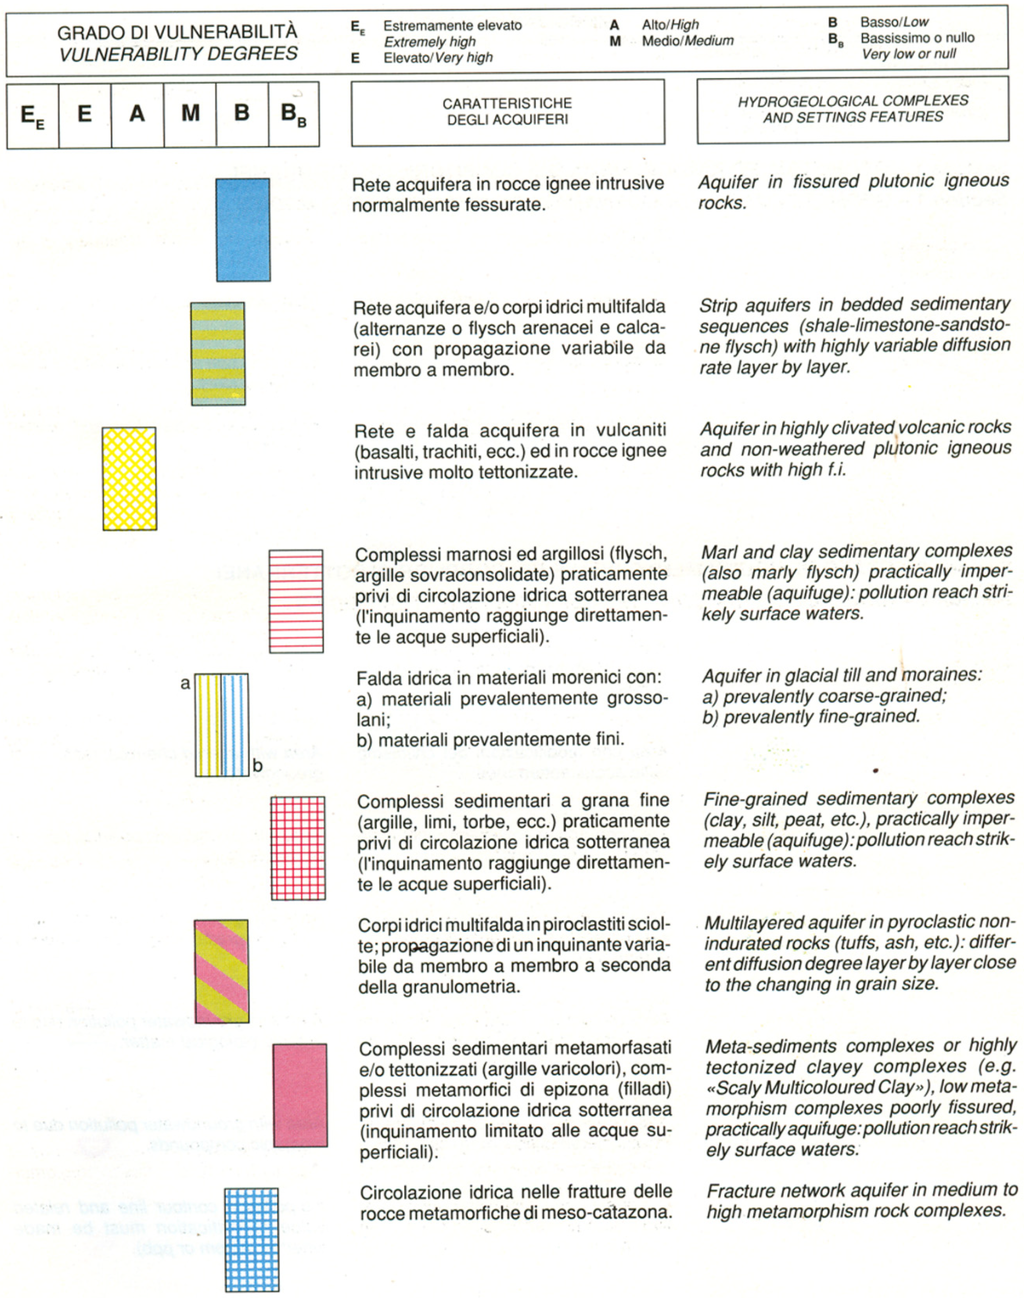
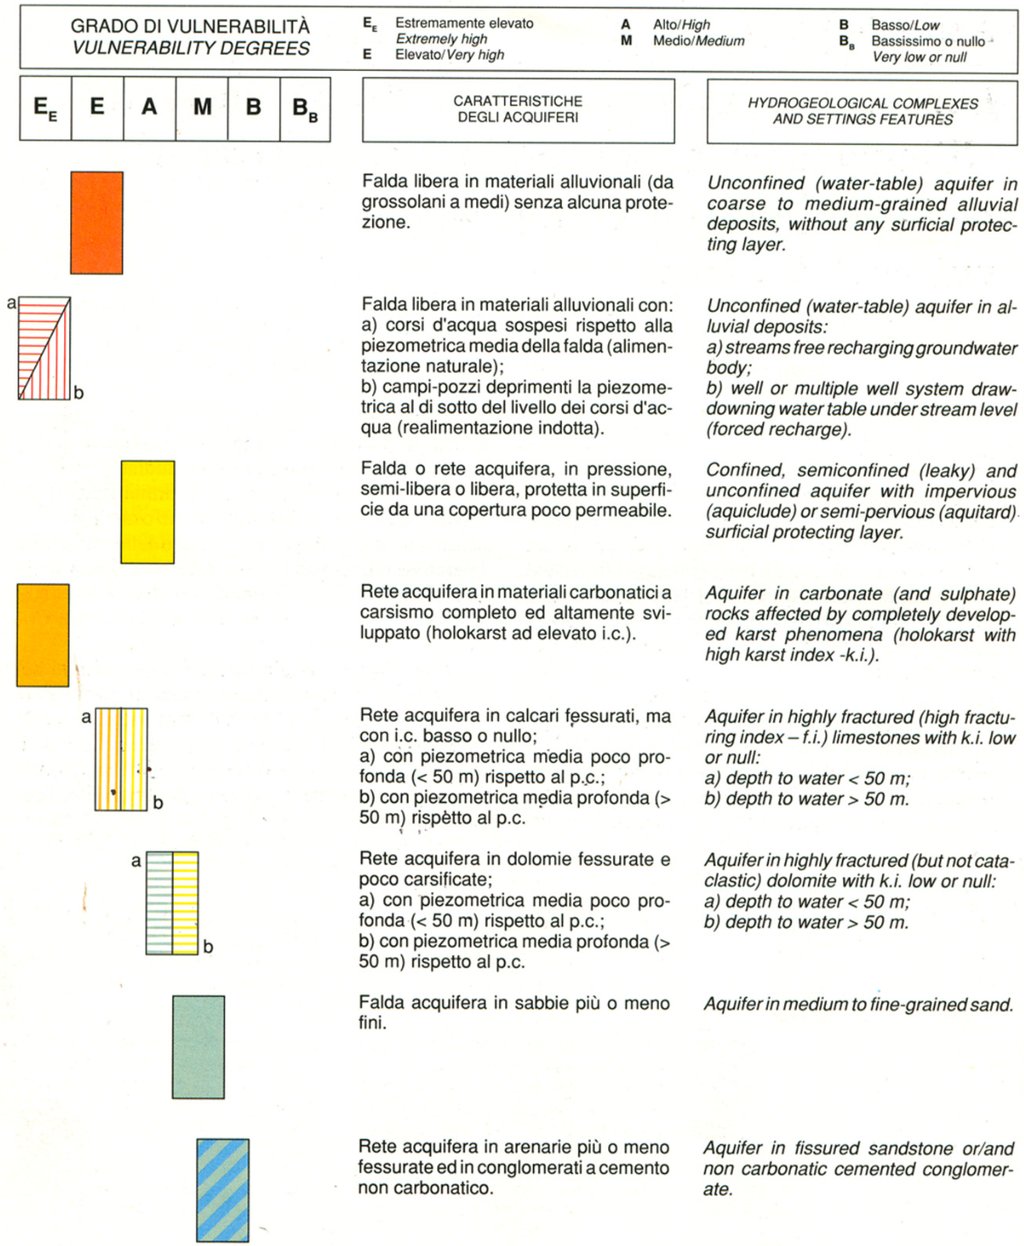
Figure 2.
Protocol for assessing the intrinsic vulnerability of aquifers with the GNDCI-CNR method [].
The application of the GNDCI-CNR method is based on map overlay of different levels of information and it provides some operational phases:
- identification and definition of hydrological and hydrodynamic characteristics of the area of interest;
- creation of the hydrogeological map and identification of scenario or hydrological and impact scenarios in the area of interest;
- identification, on the basis of the GNDCI-CNR protocol, of the reference scenario or scenarios adaptable to the hydrogeological situation of interest by the consequent assignment of the relative degrees of vulnerability.
- drafting of the aquifer intrinsic vulnerability map accompanied by an appropriate legend.
2.2. Case Study
The illegal dumpsites considered in this study are those found in the Basilicata region (Southern Italy) with the last census (“Corpo Forestale dello Stato” (Forest Rangers) and “Piano Regionale di Bonifica” (Regional Reclamation Plan, 2002), which identified 469 areas needing reclamation actions, environmental recovery and/or safety measures (315 in the province of Potenza and 204 in the province of Matera). Among these areas, 290 are illegal dumpsites: 122 in the province of Potenza and 168 in the province of Matera. In this study, we analysed 118 illegal dumpsites among all those identified (Figure 1), for which data related on the dumped waste were available to us. The assessment of risk factors of illegal dumpsites is a very complex issue. In fact, the information regarding the construction techniques of the plant, the managerial formalities and the types of waste are lacking. The characterization phase of the risk elements is therefore fundamental, since elements that affect the decision-making phase, and that can be easily reproducible and standardisable, must be identified. The elaboration of the method is set, in fact, as an objective to supply a decision making support for the prioritization during the phase of illegal dumpsite remediation.
2.2.1. Risk Factors
We measured the following parameters, for the definition of the input variables: waste volume and type, physical state of dumpsite and presence of monitoring system. Other important parameters, such as leachate production, site acclivity, proximity to river index and water table depth were calculated on the basis of other known information, by using GIS tools and historical hydrological data.
For the definition of the relative maps, the cell size was chosen to be 240 × 240 m, on the basis of the size of the study area.
2.2.2. Water Table Depth
The water table depth can be defined as the distance between the land surface and the groundwater table. This is a very important parameter, as it affects the travel time of the pollutant and the self-purification effectiveness of the unsaturated zone. The relative map was prepared interpolating punctual water table depth data, which was obtained from 506 wells located in the study area (about 10,000 km2). The method of interpolation used is the Kriging method, with a spherical model of the experimental semivariogram.
2.2.3. Slope Gradient
Slope gradient plays an important role in the infiltration process and, consequently, in leachate production. Slope gradient Figure 3a was calculated by using the digital elevation model in a GIS environment.
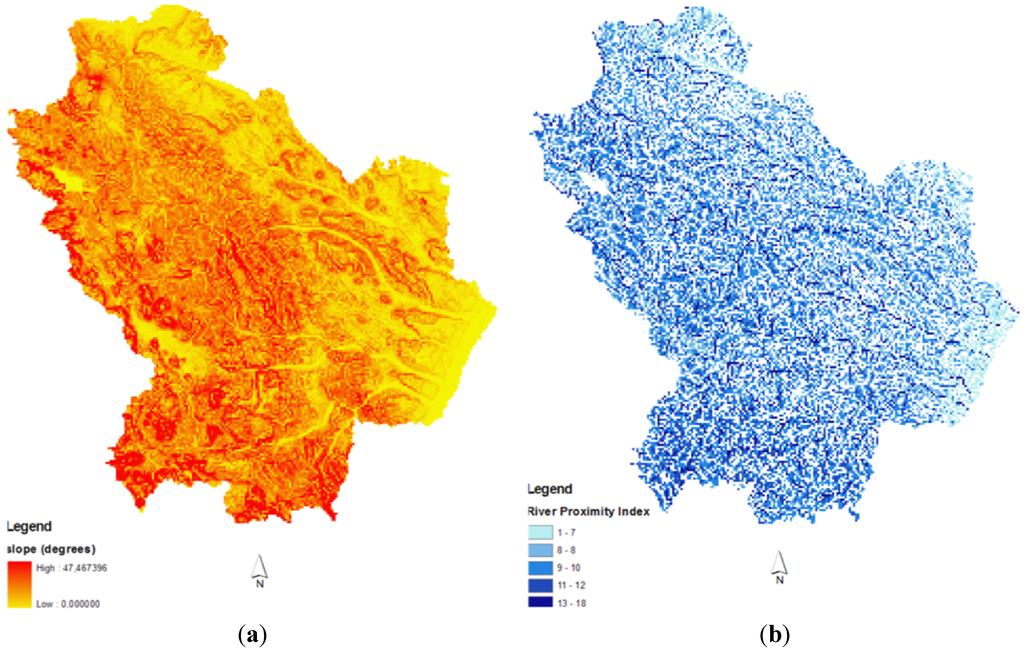
Figure 3.
Maps of slope gradient (a) and river proximity index (b).
2.2.4. River Proximity
The river proximity index (IC) was calculated by modifying the topographic index:
where FA is the flow accumulation (calculated as the number of all cells flowing into each downslope cell) and β is the site acclivity.
IC = FA × tan(β)
The river proximity index is shown in Figure 3 (on the right).
2.2.5. Leachate Production
Leachate production roughly calculated by considering the average values of rainfall in the involved area, since it directly depends on effective infiltration, estimated as proposed by Civita and De Maio []. Evapotranspiration was calculated with the Turc formula
The resulting map (Figure 4) was obtained by interpolating, with the Kriging method, the punctual average data collected between 1920 and 2009 in the 138 thermopluviometric stations of the Basilicata region.
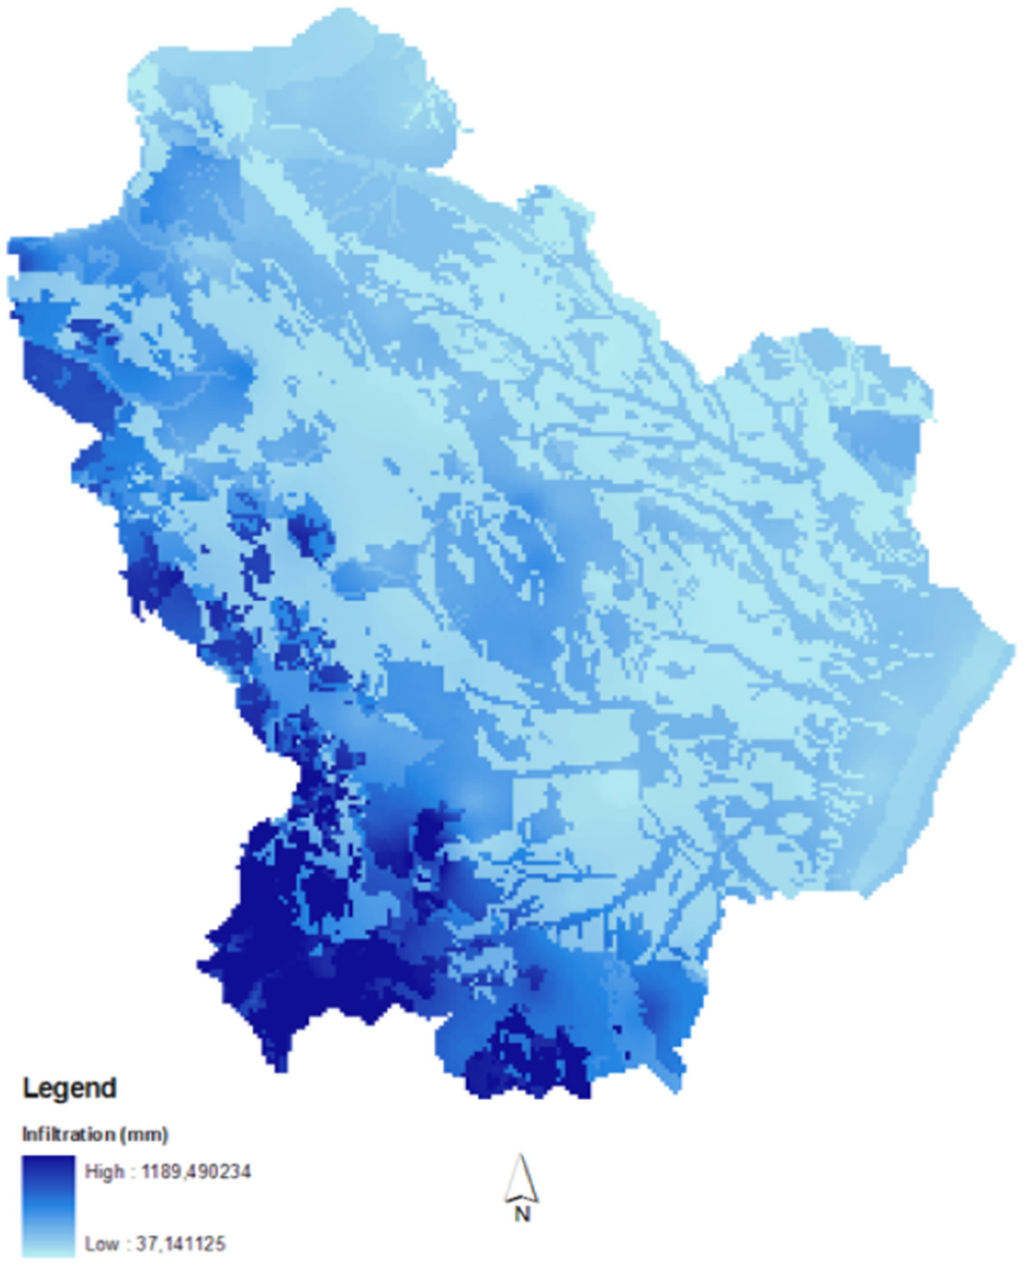
Figure 4.
Map of leachate production.
2.3. Assessment of the Pollution Risk of the Illegal Dumpsites of the Basilicata Region: The “Scores and Weights” Method
In the first phase, the pollution risk of illegal dumpsites was assessed with a score and weight method []. This method can be used as a decision support tool for the identification and ranking of the sites that need to be reclaimed.
Every single factor was multiplied by a weight W that takes values on a scale of 1–5, depending on the potential risk. In addition, risk factor reduction in weight “R” was applied to each element. In this case, the factor is included in a scale of 0.1–1. The sum of products between the relative weights and reduction factors allows us to calculate the hazard index “IH” through Equation (1):
The hazard of each landfill has been evaluated on the basis of this hazard index, which is independent on the location of the site. The risk factors with the respective weights and reduction factors are shown in Table 1.

Table 1.
Scores and coefficients of reduction (weights) of the considered risk factors.
| Hazardous Factors of Landfills | Weights and Coefficient of Reduction of Risk Factors (R) | |
|---|---|---|
| Waste input rate (waste volume, m3) | <1,000 | 0.1 |
| 1,000–5,000 | 0.3 | |
| 5,000–10,000 | 0.5 | |
| 10,000–20,000 | 0.7 | |
| >20,000 | 1 | |
| Estimate of leachate production (infiltration value, mm) | 0–100 | 0.1 |
| 100–200 | 0.3 | |
| 200–300 | 0.5 | |
| 300–500 | 0.7 | |
| >500 | 1 | |
| Waste types | MSW, MSW + IW | 0.1 |
| non-MSW, non-MSW + MSW | 0.5 | |
| HW, MSW + HW, non-MSW + HW | 1 | |
| Proximity to superficial water (Proximity river index value, adim) | 0–5 | 0.1 |
| 5–10 | 0.5 | |
| >10 | 1 | |
| Water table depth (m) | >5 | 0.1 |
| 2–5 | 0.5 | |
| 0–2 | 1 | |
| Site acclivity (degrees) | >20 | 0.1 |
| 10–20 | 0.3 | |
| 5–10 | 0.7 | |
| 0–5 | 1 | |
| Monitoring system | Present | 0.1 |
| Not present | 1 | |
| Physical state of dumpsite | Without soil cover | 0.3 |
| With soil cover | 1 | |
The hazard index IH calculated with the score and weight method was normalized and then subdivided into five hazard classes (very high, high, medium, low, very low).
The obtained hazard of illegal open dumpsite was integrated with the intrinsic vulnerability of the aquifers, which was determined by using the GNDCI-CNR method described in Section 2.1.1, in order to give the pollution risk of illegal dumpsites.
2.4. Development of the Fuzzy Logic Model for Assessing Aquifer Integrated Vulnerability
The binary (or classical) logic is only concerned with what is completely true or what is completely false. Fuzzy logic, however, also extends its interest to that which is not completely true, which is probable or uncertain. Fuzzy logic is based on a linguistic approach, in which words or phrases of natural language are used instead of numbers.
Fuzzy logic operates on mathematical entities that are fuzzy sets, which obey rules, structures and axioms similar to those of classical logic. The only difference is that an object can simultaneously belong to several subsets in contrast to the classical theory. Belonging to a subset, in fuzzy logic, is associated with a degree of membership []. The set of deduction rules to be applied to a given system to achieve results through the use of fuzzy logic is the fuzzy inference process. Fuzzy inference is divided into three main phases: fuzzification, inference and defuzzification.
The fuzzification is the process by which the input variables are converted to fuzzy measures of their belonging to certain classes (such as, for example, Very Low, Low, Medium, High, Very High). This conversion from deterministic greatness to fuzzy greatness is done through membership functions (Figure 5). A membership function is a function that associates a value, usually numeric, to the degree of membership. By convention, the degree of membership assumes values ranging from zero, when the element does not belong to the subset, to one, when it belongs entirely to the subset. If you consider a membership function μA and a value x°, the conversion of x° in a fuzzy set is a complement of set A corresponding to ordinate μA(x°) (Equation (2)):
If the value x° intercepts more than one membership function, you will have a degree of membership for each function equal to the intercept with the y-axis.
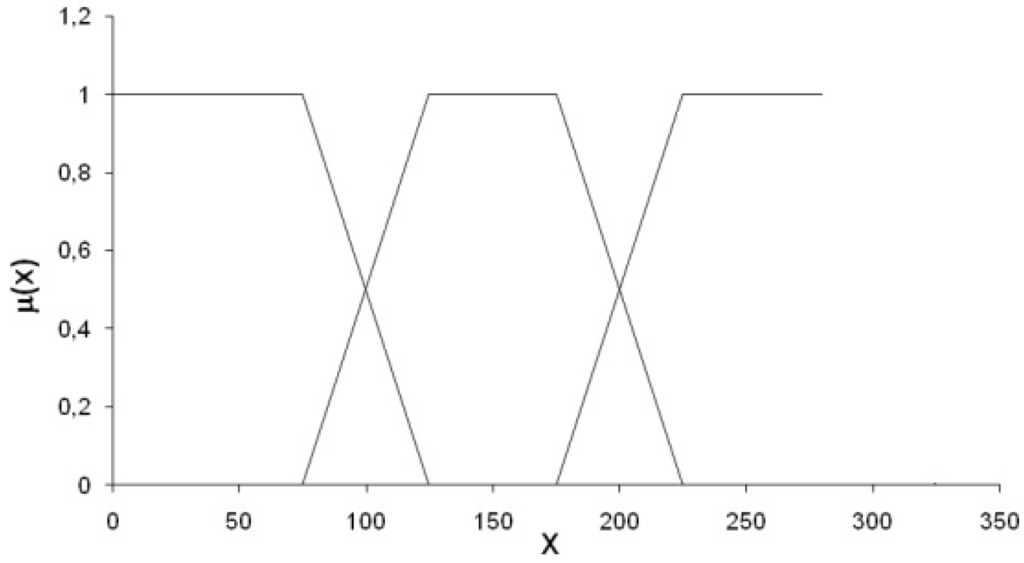
Figure 5.
An example of membership function.
A membership function is a function which associates a value (usually numerical) with the level of membership to the set. By convention, the real number which represents the level of membership (μ(x)) takes a 0 value when the element does not belong to the set, and 1 when it belongs to it completely. Membership functions can have different shapes: the simplest are made up of straight lines, while the most used are the triangular (Figure 6a) and trapezoidal (Figure 6b) functions; the former are characterized by a triangular trend while the latter by a trapezoidal one. The advantage of these functions is in their simplicity. The triangular membership function depends on three scalar parameters a, b and c and is given by the following expression:
while the trapezoidal one depends on four scalar parameters (a, b, c and d), as shown in the following formula:
There are other more complex functions, i.e., the Gauss function made up of a simple Gaussian curve (Figure 7a) which depends on the parameters σ and c (Equation (5)) and the Gauss2 function (Figure 7b) given by the fusion of two different Gaussian functions and depending on four parameters: r1 and c1, which define the shape of the function in the left part, and r2 e c2, which define the shape of the function in the right part. Moreover, between these types of functions, there is the bell membership function (Gbell) (Figure 7c) which is a hybrid of the Gaussian function; it is mainly used to manage non-fuzzy sets and depends on three parameters: a, b and c (Equation (6))
Despite their simplicity, such functions cannot be used to represent asymmetry, which is important in some applications.
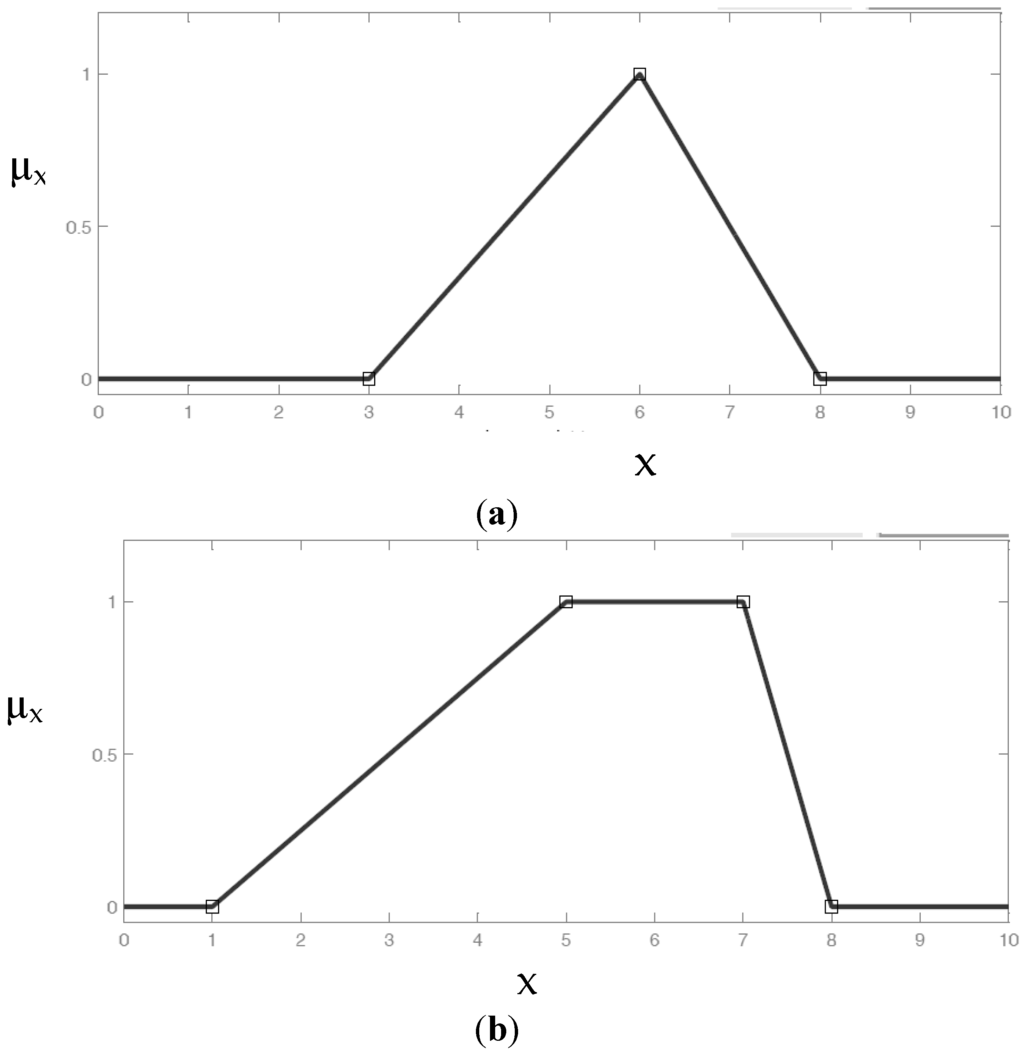
Figure 6.
(a) Triangular membership function; (b) Trapezoidal membership function.
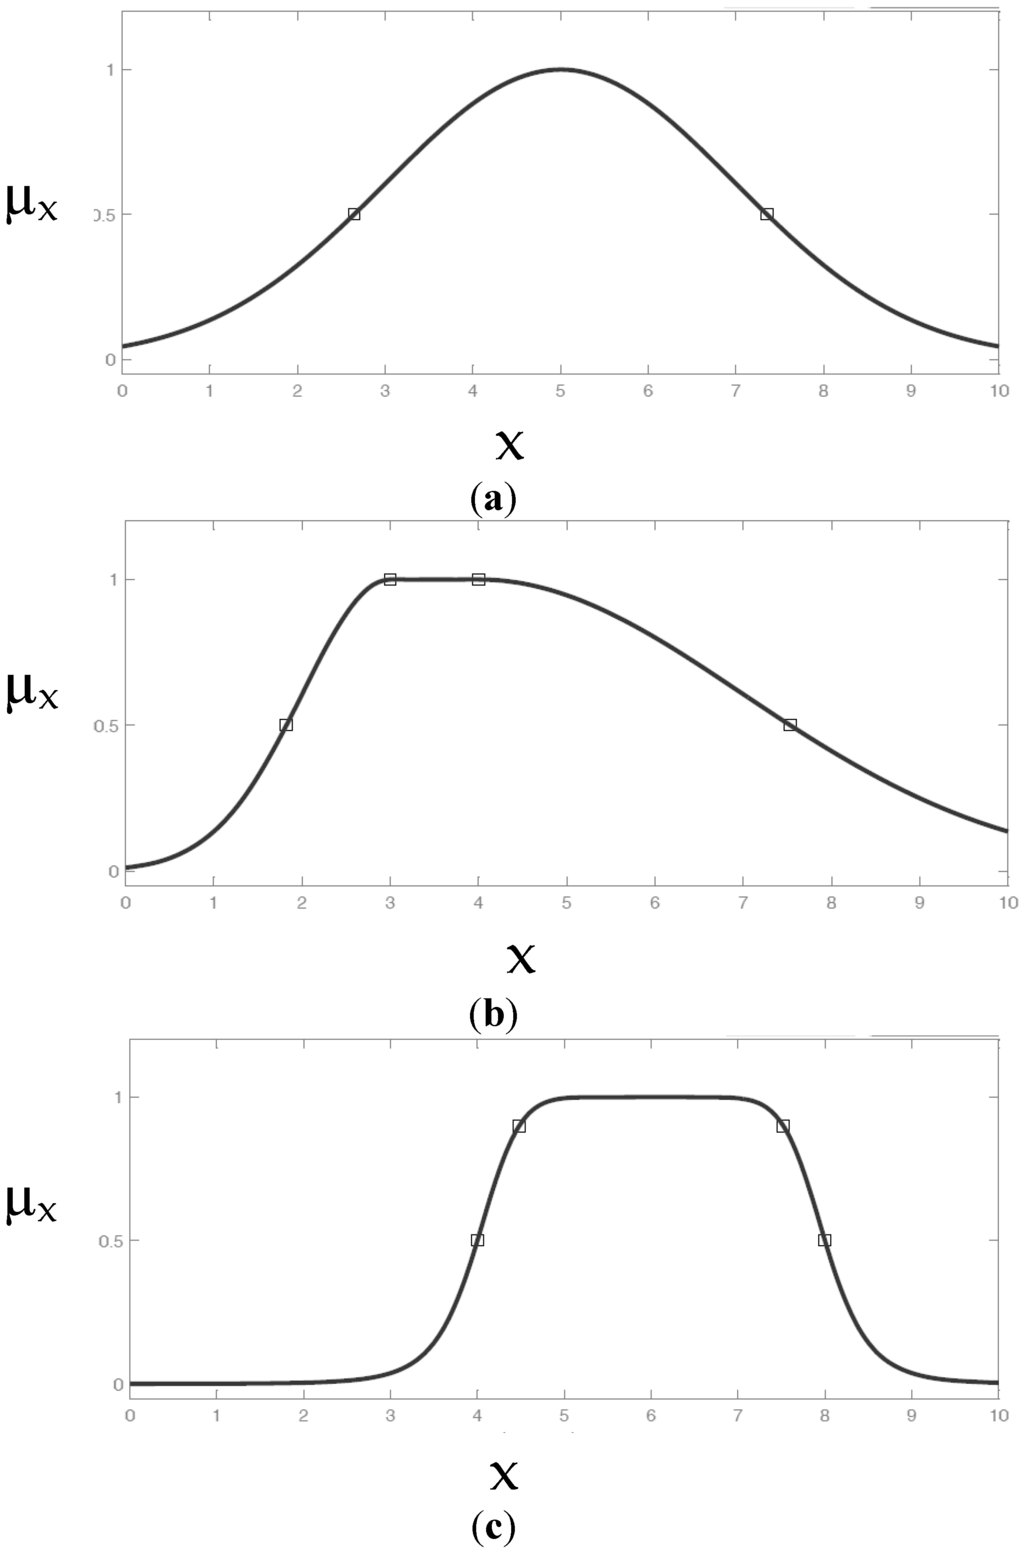
Figure 7.
(a) Gauss membership function; (b) Gauss2 membership function; (c) Generalized bell (Gbell) membership function.
The sigmoid function (Figure 8a) may have left or right asymmetry and a horizontal asymptote. This function is ruled by parameters a and c (Equation (7)):
Further asymmetric functions, Dsigm and Psigm membership functions, are represented in Figure 8b,c and described by Equation (8), depending on four parameters a1, c1, a2 and c2.
The factors that discriminate the choice of the appropriate membership functions are of two types: the number of parameters of each curve and the shape of the function which represents the trend of the phenomenon.
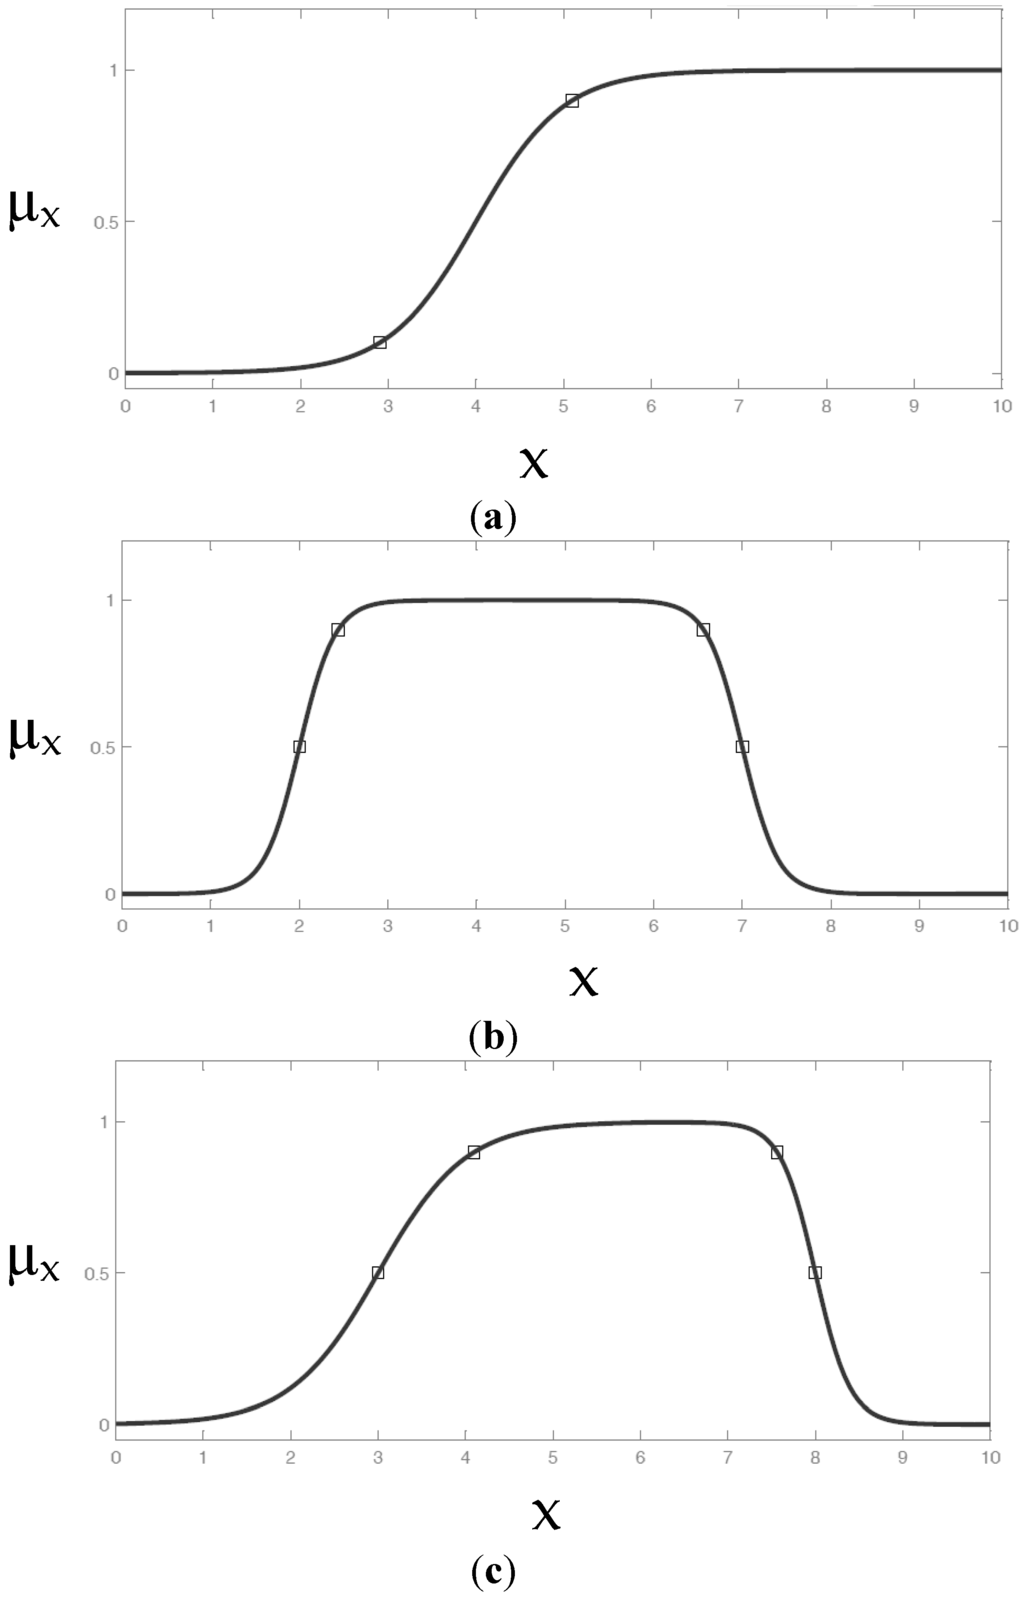
Figure 8.
(a) Sigmoid (Sig) membership function; (b) Dsig membership function; (c) Psig membership function.
Fuzzy inference is the mapping process, starting from an input space and going to an output space. In order to obtain an output, you need to assign the fuzzy rules that integrate fuzzy sets through a series of antecedents and consequents. These rules are not represented by complex mathematical models but are constituted by simple linguistic expressions, which are converted in mathematical formalism in the language of fuzzy rules. The fuzzy rules, “if-then-else”, are usually composed of two parts: the antecedent, which defines the condition, and the consequence, which defines the action. It is also possible to define a rule “Else”, which enters in to question when none of the rules has been satisfied or when the “Then” is weakly satisfied. The output of the fuzzy inference is often unusable and, therefore, it needs to be converted into a deterministic value through the defuzzification operation.
The usually used defuzzification methods are the following:
- Centroid method: the chosen numerical value for the output is calculated as the centre of the mass of the fuzzy set;
- Bisector method: the output is the abscissa of the bisector of the area subtended to the fuzzy data set;
- Middle of maximum method: the output value is determined as the average of maximum values (Mom, middle of maximum) (Figure 4);
- Largest of maximum method: the output numerical value is calculated as the maximum of the maximum (Lom: Largest of maximum);
- Smallest of maximum method: the output value is represented by the output minimum value (Som: Smallest of maximum).
Among the methods found in literature, the most common are the centroid and Mom methods. In the Mom method, output is obtained as the arithmetic mean of the values of “y” where fuzzy set height is maximum (Equation (9)).
B’ is the fuzzy set inferred by rules and
is the values set of “y” for which height “µB’(y)” is maximum.
Therefore, we have (Equation (10)):
whose geometric significance is shown in Figure 9:
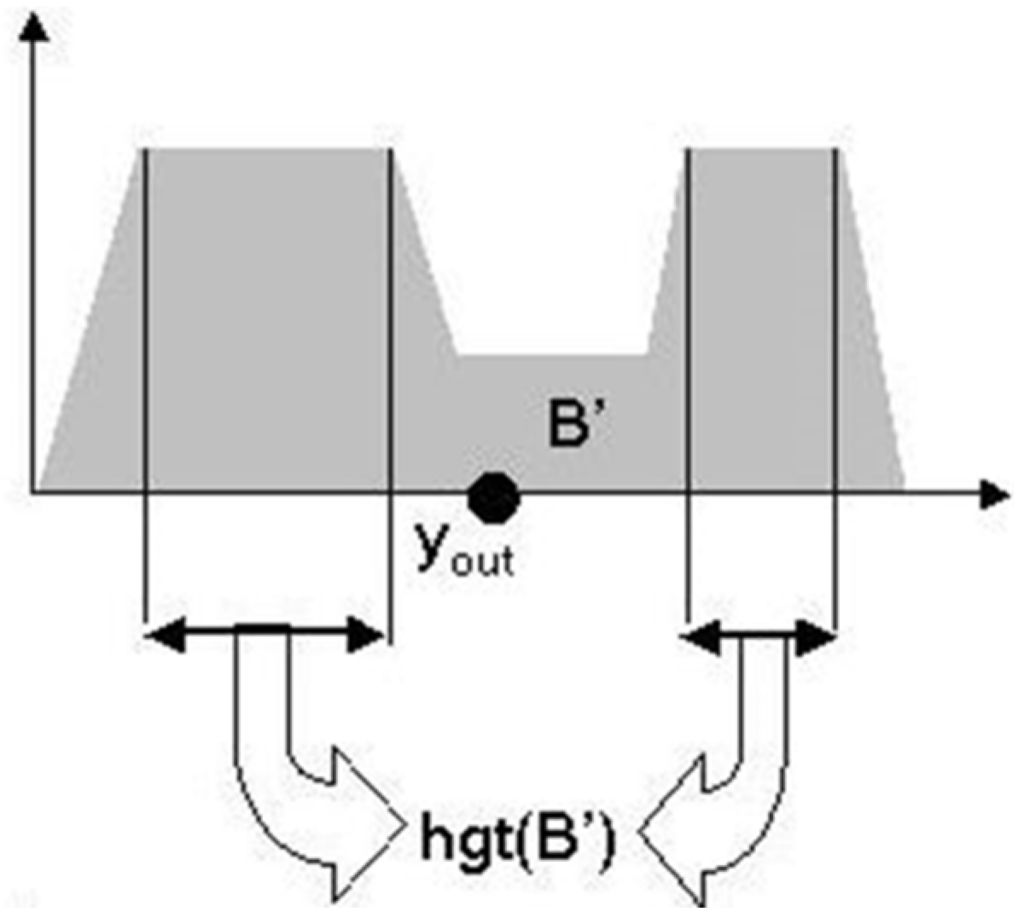
Figure 9.
Geometric significance of the middle of maximum defuzzification method.
The output of the Centroid method is obtained as the abscissa of the centre of gravity inferred from the rules in the space of fuzzy sets of output of the algorithm. The formula in the case of continuous function is given by the following Equation (11):
Whereas, the formula for discrete function is given by Equation (12):
In Largest of maximum, the precise value of the output variable is one of which the fuzzy subset has the maximum value of truth. The main disadvantage of this method is that it does not consider the distribution of membership function.
The conceptual structure of the developed fuzzy model is represented in Figure 10. The intrinsic vulnerability of the aquifers and the hazard of the illegal dumpsites were integrated, in order to obtain the specific, or integrated, vulnerability, or pollution risk. The hazard of illegal dumpsites, however, was determined through the use of fuzzy logic, by considering the parameters describing the characteristics of the dumpsites.
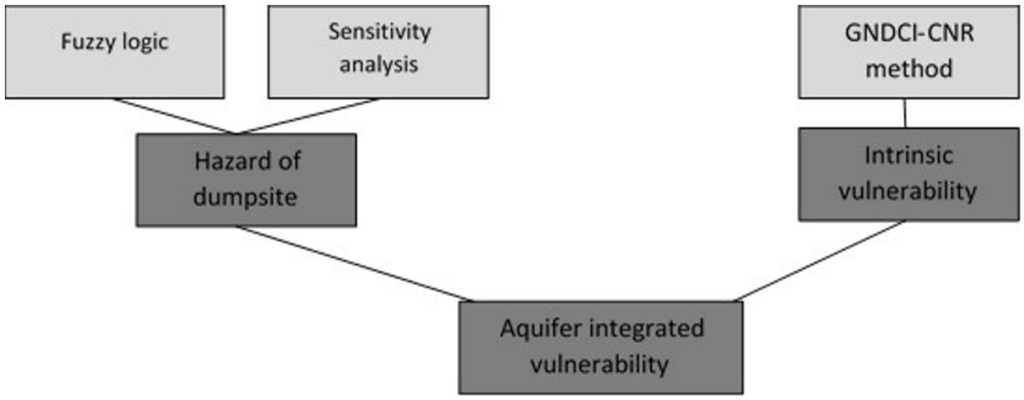
Figure 10.
Conceptual model for the fuzzy aquifer specific vulnerability to pollution.
In order to reduce the number of fuzzy rules, the parameters listed in Section 2.2.1 were used to define three different fuzzy inferences, as shown in the conceptual diagram in Figure 11. The results obtained through the first two fuzzy inferences, defined as site vulnerability and dumpsite potentiality, respectively, were then aggregated to the crisp parameter called dumpsite conditions, by obtaining the hazard index of each dumpsite.
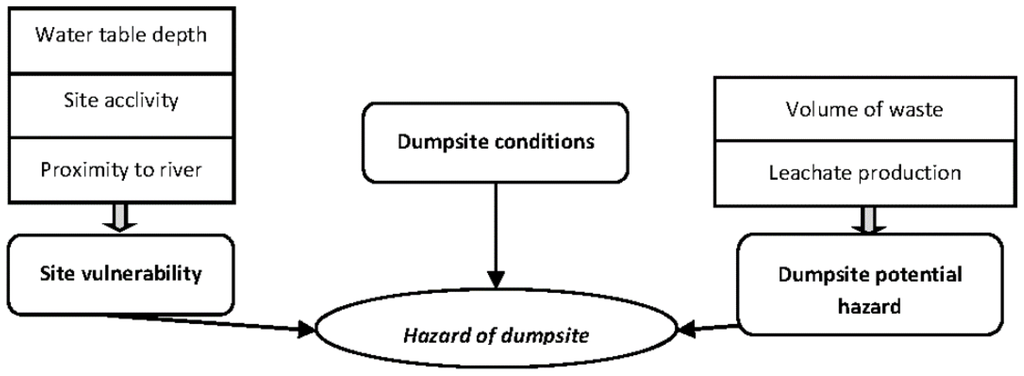
Figure 11.
Conceptual diagram of the implemented fuzzy model for dumpsite risk assessment.
In the assignment of the rules, we assumed that the increase in vulnerability is favoured by low slopes, proximity to surface watercourses and low depth of the water table. On the contrary, potentiality of landfill evaluates the probability of a landfill to release contaminants depending on the waste volume and the leachate production. Therefore, with the increase of these two factors, this potentiality will increase as described by the fuzzy rules. The procedure to determine the integrated vulnerability index combines the results obtained by the two previous fuzzy diagrams with the addition of the landfill conditions. The landfill conditions parameter groups the non-fuzzy parameters, namely the type of waste, the presence of a coverage and the activity for each landfill. For the type of waste, a weight equal to 0.1 for municipal solid waste (MSW), 0.5 for special waste and 1 for hazardous ones were defined. A unitary weight was given to the absence of coverage, and a weight equal to 0.3 to the presence of coverage. A weight of 0.1 was given to the landfill inactivity, and a unitary one to its activity. Therefore, an increase of the landfill conditions parameter indicates an increase of the landfill vulnerability. For example, “if site vulnerability” is low, “if landfill potentiality” is high, and “if conditions of the landfill” is low then the hazard index of landfill is medium. In general, the basis of the fuzzy inference has been drawn up considering that with increasing values of the three parameters of the subset, increases the hazard of landfills.
The selection of the membership function and the defuzzification method was done with the application of the sensitivity analysis method described in []. The sensitivity analysis was performed by repeating the whole fuzzy inference procedure, modifying only one membership function or defuzzification method at a time, keeping all the other variables unvaried, thus performing 55 different simulations. We carried out an F test to compare more precisely the variances related to the distributions corresponding to each fuzzy model and to the starting data. What we observed from the analysis of deviation was confirmed by the F test which highlighted, as the best model, the Centroid defuzzification method associated with the trapezoidal or GBell membership functions gave comparable results (Table 2).
Table 2.
F test results.
| Defuzzification Method | Gauss2 | Triangular | Trapezoidal | Gbell | Gauss | Disig | Psig | Pi |
|---|---|---|---|---|---|---|---|---|
| Centroid | 0.692 | 0.594 | 0.969 | 0.966 | 0.280 | 0.001 | 0.001 | 0.479 |
| Bisector | 0.687 | 0.945 | 0.945 | 0.030 | 0.940 | 0.118 | 0.114 | 0.815 |
| Mom | 0.009 | 0.009 | 0.009 | 0.009 | 0.012 | 0.008 | 0.011 | 0.013 |
| Lom | 0.009 | 0.009 | 0.009 | 0.018 | 0.012 | 0.010 | 0.014 | 0.023 |
| Som | 0.026 | 0.025 | 0.025 | 0.012 | 0.021 | 0.087 | 0.094 | 0.093 |
The obtained fuzzy hazard index was successively revised for a classification in linguistic terms (Very low, Low, Medium, High, Elevated), by using a cumulative frequency distribution curve, and choosing, as the ends of the classes, the points of the curve where a clear slope variation is observed.
The intrinsic vulnerability and the landfill hazard, placed in a fuzzy model, provided the integrated vulnerability index. The fuzzy inference has been created using as input data the landfill hazard index and the classes of intrinsic vulnerability, which were converted into numerical values. Therefore, during the fuzzification, the trapezoidal-type membership function was defined for the intrinsic vulnerability of aquifers and the hazard of landfills.
In order, to determine the environmental risk index, the if-then fuzzy rules (Table 3) and the Centroid defuzzification method were defined. These rules have been established by considering that the aquifer pollution risk grows with an increase in both the intrinsic vulnerability of aquifers and the hazard of dumpsites.
Table 3.
Fuzzy rules for the evaluation of aquifer integrated vulnerability.
| Landfills Hazard | Aquifer Intrinsic Vulnerability | ||||
|---|---|---|---|---|---|
| Very Low | Low | Medium | High | Very High | |
| Very Low | Very Low | Low | Low | Medium | Medium |
| Low | Low | Low | Medium | Medium | High |
| Medium | Low | Medium | Medium | High | High |
| High | Medium | Medium | High | High | Very high |
| Very high | Medium | High | High | Very high | Very high |
3. Results and Discussion
3.1. Aquifer Intrinsic Vulnerability
The map of the aquifer intrinsic vulnerability, determined with the GNDCI-CNR method, is shown in Figure 12. The map indicates that approximately all of the centre part of the Basilicata Region falls under the very low, low and medium vulnerability classes, except for the areas located at the edges of the region. The aquifer vulnerability was reclassified into six classes: extremely elevated, elevated, medium, high, medium, low, very low.
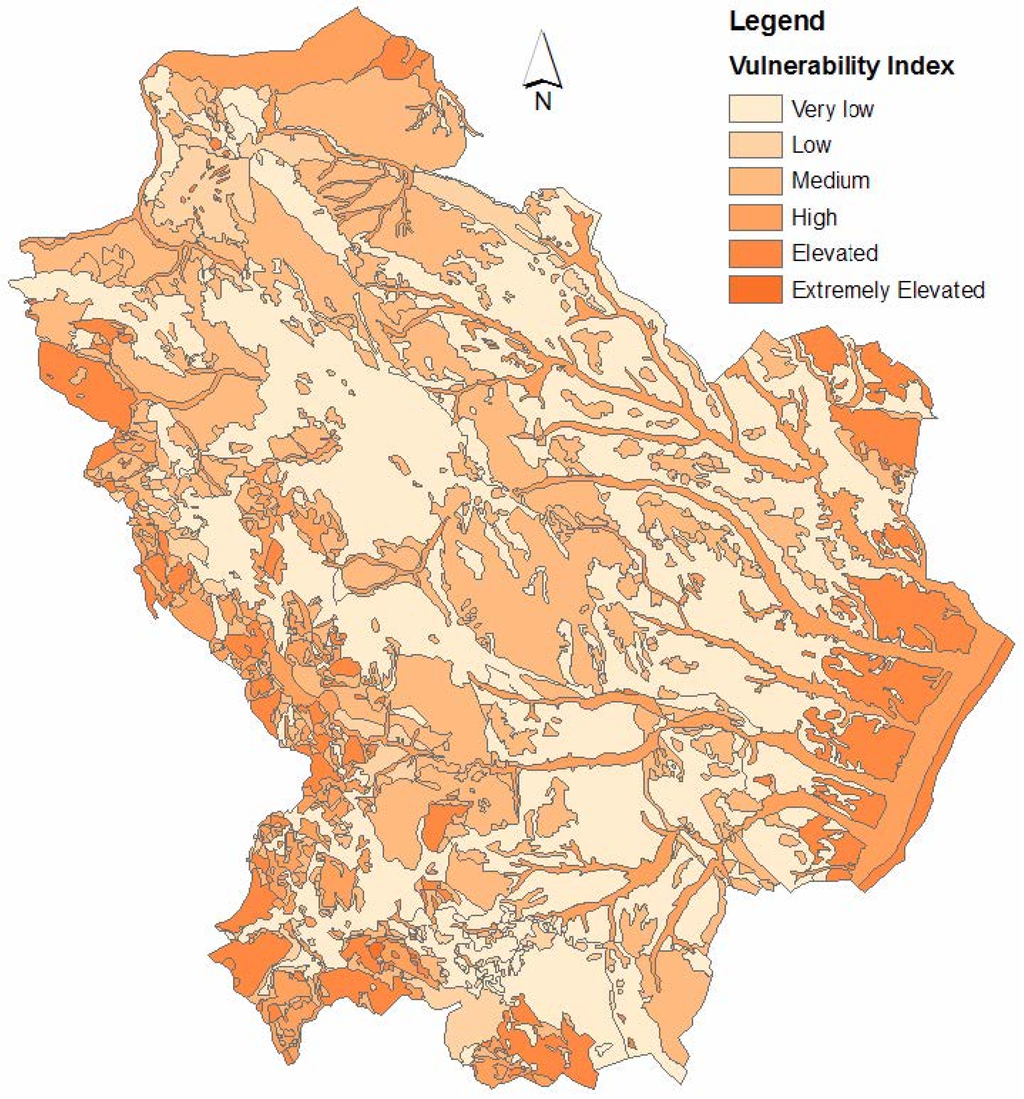
Figure 12.
Aquifer intrinsic vulnerability map.
3.2. Results of the Pollution Risk of Dumpsites Obtained with the “Scores and Weights” and the Fuzzy Logic Method
The map related to the pollution risk of dumpsites, obtained with the “scores and weights” method is shown in Figure 13. The percentage distribution of the classes of risk is shown in Figure 14. Looking at the percentage results, we observed that most of the dumpsites show a medium-high vulnerability (about 70%).
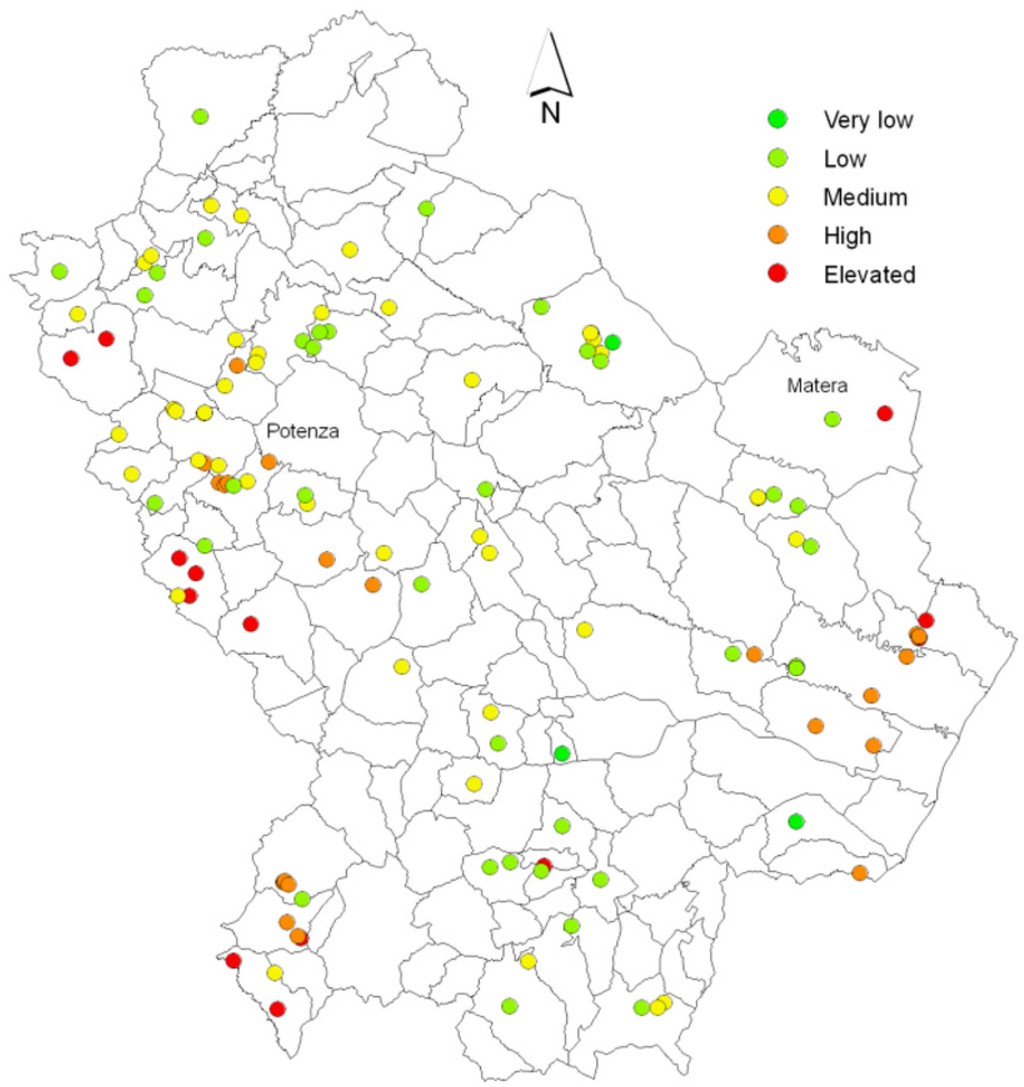
Figure 13.
Map of the integrated vulnerability of illegal dumpsites (“scores and weights” method).
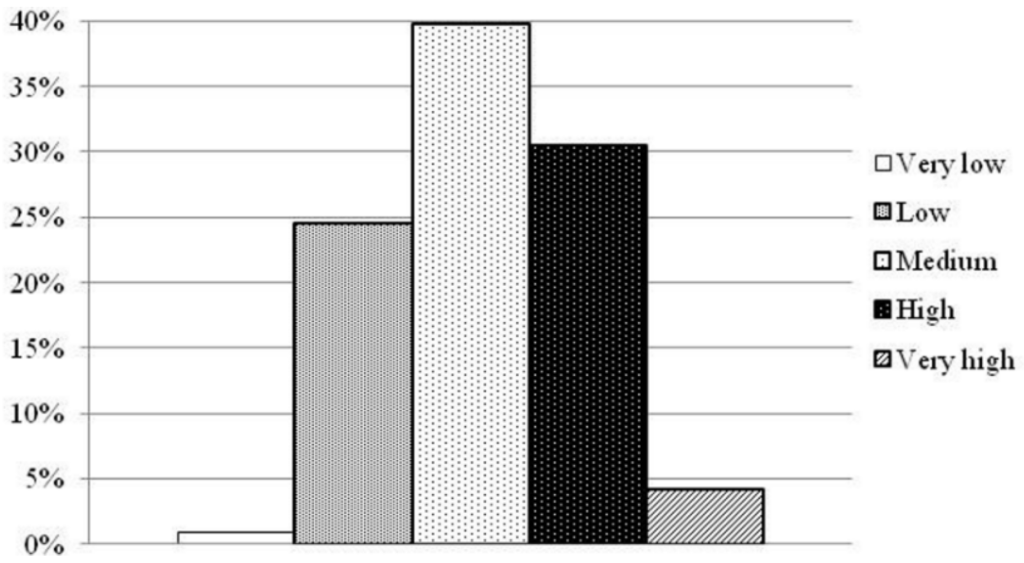
Figure 14.
Distribution of the classes of integrated vulnerability of illegal dumpsite (“scores and weights” method).
The pollution risk obtained with the fuzzy logic method was reclassified in linguistic terms (Very low, Low, Medium, High, Very high), by using the cumulative frequency distribution curve (Figure 15) and by choosing, as the extremes of classes, the points of the curve where there is a distinct change of slope (Table 4).
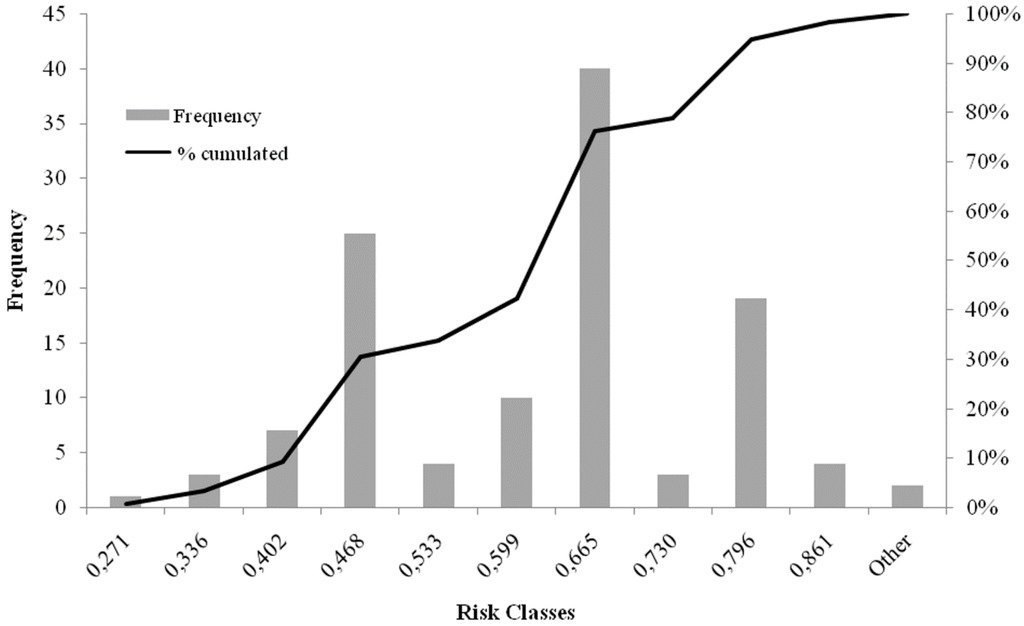
Figure 15.
Cumulative frequency curve of risk classes (fuzzy logic method).
Table 4.
Range classes of dumpsite pollution risk (fuzzy logic method).
| Dumpsite Pollution Vulnerability Classes | Classes Range |
|---|---|
| Very low | 0.402 |
| Low | 0.468 |
| Medium | 0.599 |
| High | 0.665 |
| Very high | 0.796 |
The classification identifies a large part of the dumpsites (about 60%) in the range of high and very high pollution risk, as shown in the graph of Figure 16. Figure 17 shows the spatial distribution of the risk.
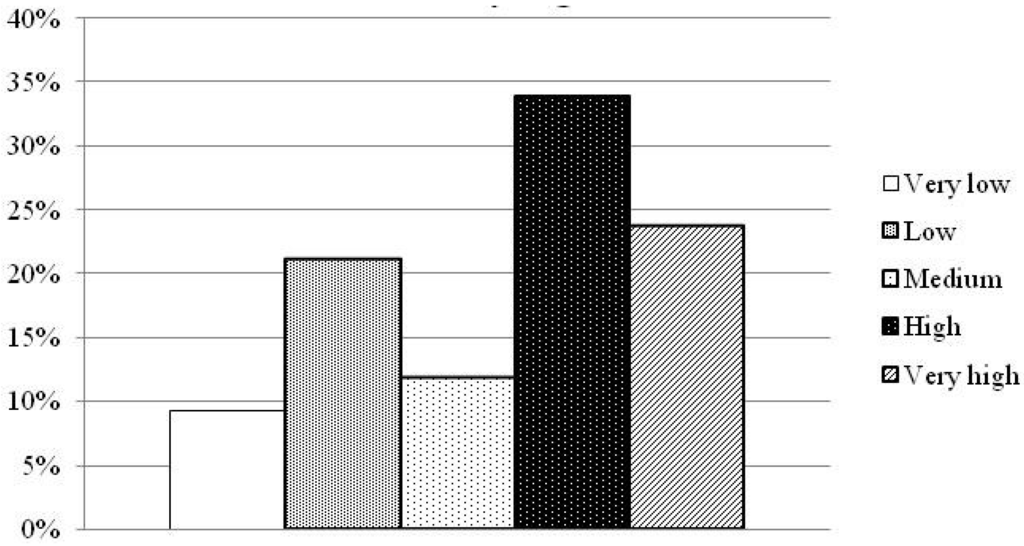
Figure 16.
Distribution of the classes of integrated vulnerability of illegal dumpsite (fuzzy logic method).
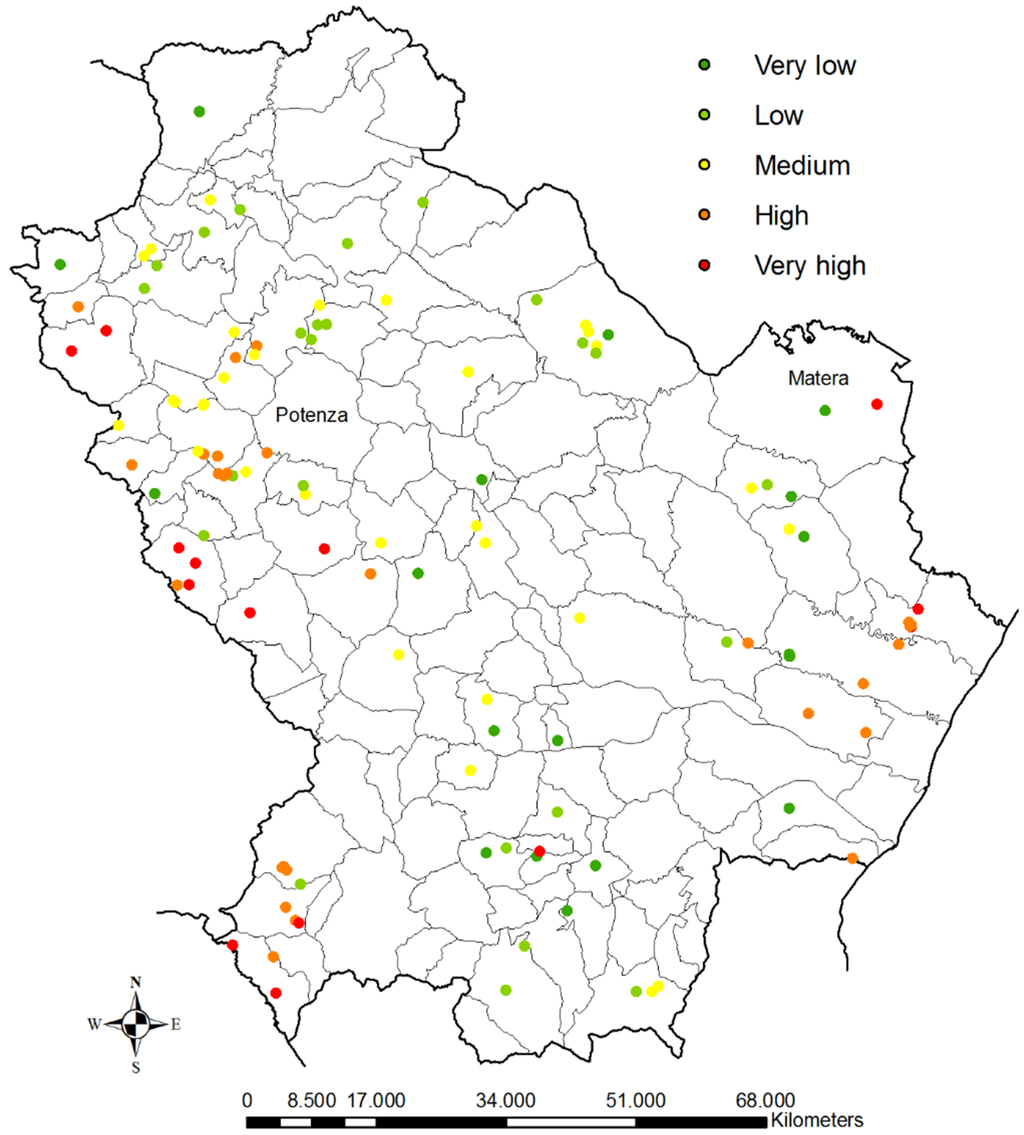
Figure 17.
Map of dumpsite integrated vulnerability in the Basilicata region (fuzzy logic).
The analysis of the histograms (Figure 14 and Figure 15) representing the percentage of dumpsites falling in different classes of risk by applying both “scores and weights” and fuzzy logic methods, shows that the both distributions are platykurtic because they present negative kurtosis (−1.16 for fuzzy logic results and −2.40 for “scores and weights” results). The skewness, which is a measure of the asymmetry of a distribution, is −0.45 for fuzzy logic results and 0.15 for “scores and weights” results. The comparison of the results obtained with both tested models indicates that 50% of the vulnerability of dumpsites is over-estimated by applying the fuzzy model while over 30% has a comparable vulnerability (Figure 18), because the fuzzy logic distribution moves to higher risk classes. This result should not be of concern because this means that the fuzzy logic method gives safer results and that the underestimated aquifers fall into the classes of very low and low risk.
For a more appropriate comparison, we calculated the statistical dispersion indices of the distributions of the risk indices obtained with the two methods. The comparison of the risk indices, without the division into classes, shows that the behaviour of the two distributions is very similar. The congruence of the two distributions is confirmed by the values of variance and standard deviation (Table 5).
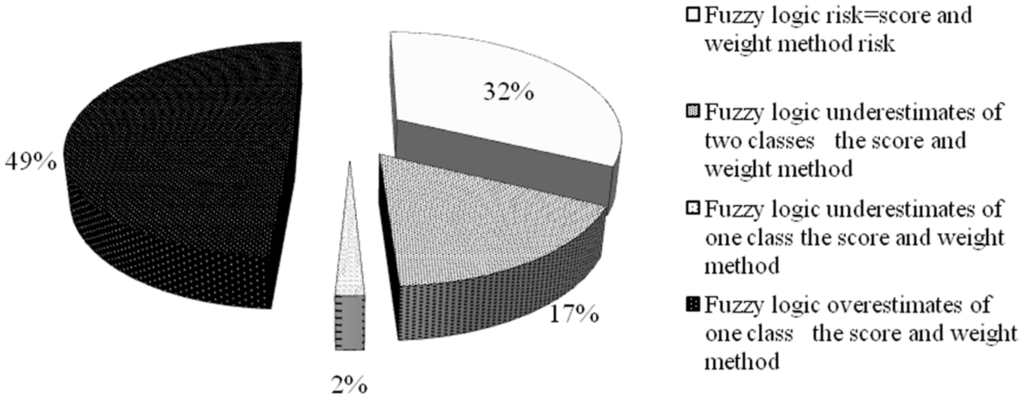
Figure 18.
Comparison of the results obtained with both the tested models.
Table 5.
Statistical dispersion indices for the comparison between the fuzzy logic method and the scores and weight method.
| Statistical Dispersion Indices | Scores and Weight Method | Fuzzy Logic |
|---|---|---|
| Standard deviation | 0.237 | 0.211 |
| Variance | 0.056 | 0.044 |
| Mean | 0.466 | 0.470 |
4. Conclusions
In this study, an index of environmental risk was introduced to evaluate both the intrinsic and integrated vulnerability of the aquifers of the Basilicata region (Southern Italy). The fuzzy method was developed and the results were used to make a comparison with a conventional “score and weight method”. The aim of fuzzy logic was to reduce the subjectivity found in the score and weight method. The fuzzy methodology and the score and weight method allow us to identify contaminated sites that need prompt interventions. The evaluation is carried out on the basis of the integration of the characteristics of the dumpsite (hazard of dumpsite) and the intrinsic vulnerability of the studied aquifers.
It is possible to reduce the risk that a pollutant may leach along the soil profile and reach groundwater in areas with an intrinsic vulnerability by ranking different illegal dumpsites to their degree of hazard. For dumpsites characterized by a high degree of hazard, it would be necessary to propose actions aimed at mitigating their environmental impact. When investigating the risk of groundwater pollution due to the presence of illegal dumpsites, the system should be able to indicate the dumpsites in which we should concentrate efforts to mitigate or reduce the environmental impact. The evaluation of the pollution risk index, in fact, allowed us a classification of risk for a subsequent detailed planning of investigations for each site. The comparison of the two methods showed that the two obtained distributions of the results are congruent. This is confirmed by the similar values obtained for variances and standard deviations. The spatial distributions show that the two methods give very similar results. Besides, an analysis of the histograms representing the percentage of aquifers falling in different classes of risk, obtained by applying fuzzy logic and score and weight methods, show that the fuzzy logic has a distribution that moves at higher risk classes compared to the score and weight method.
The fuzzy method, unlike the traditional score and weight method, does not require a deep knowledge of the phenomenon and can be used by a non-expert in a screening context to better understand aquifer vulnerability for decision-making purposes. Moreover, this fuzzy method is transferable to other regions and other geology. This is very useful when it is necessary to make a broad classification of very numerous contaminated sites in order to decide which of them require immediate characterization and/or remediation procedures and which of them do not have characteristics of serious contamination hazard. The most important limitation of the model is that it is not possible to calculate an absolute value of pollution risk, but it is only possible to classify dumpsites in a hazard scale.
Acknowledgments
This work forms part of a research project supported by grant of the Basilicata Region through the Research project entitled “Innovative techniques for monitoring and management of municipal solid waste landfills and remediation of contaminated sites-POLLUTECH” (Contract Cod. No. 2/AP/05/2013REG-CUP G43G13000410009).
Author Contributions
Donatella Caniani and Ignazio Marcello Mancini developed the research idea, Salvatore Masi and Donatella Caniani planned the research activities, Donata Serafina Lioi and Donatella Caniani carried out the research activity, Donatella Caniani analysed the data; Donata Serafina Lioi and Donatella Caniani prepared the manuscript, Donatella Caniani, Salvatore Masi and Ignazio Marcello Mancini reviewed the final draft and supervised the research activity.
Conflicts of Interest
The authors declare no conflict of interest.
References
- Rezaei, F.; Safavi, H.R.; Ahmadi, A. Groundwater vulnerability assessment using fuzzy logic: A case study in the zayandehrood aquifers, Iran. Environ. Manag. 2013, 51, 267–277. [Google Scholar] [CrossRef]
- Shahmaleki, N.; Behbahani, S.M.R.; Massah Bavani, A.R.; Khodaei, K. Comparison between logistic regression, modified DRASTIC and AHP-DRASTIC methods in groundwater vulnerability assessment. J. Environ. Stud. 2013, 38, 79–92. [Google Scholar]
- Jarvis, N. The MACRO Model Technical Description; Swedish University of Agricultural Sciences (SLU); Department of Soil Sciences: Uppsala, Switzerland, 2002. [Google Scholar]
- Merdun, H.; Quisenberry, V.L. Simulation of water and solute transport with MACRO model in Cecil loamysand soil. Aust. J. Soil Res. 2004, 42, 939–951. [Google Scholar] [CrossRef]
- Ma, L.; Ahuja, L.R.; Ascough, J.C.; Shaffer, M.J.; Rojas, K.W.; Malone, R.W.; Cameira, M.R. Integrating System Modeling with Field Research in Agriculture: Application of the Root Zone Water Quality Model; United States Department of Agriculture, Agricultural Research Service (USDA-ARS): Washington, DC, USA, 2000.
- Castiglione, P.; Mohanty, B.P.; Shouse, P.J.; Simunek, J.; van Genuchten, M.T.; Santini, A. Lateral water diffusion in an artificial macroporous system. Vadose Zone J. 2003, 2, 212–221. [Google Scholar] [CrossRef]
- Simunek, J.; Sejna, M.; van Genuchten, M.T. The HYDRUS-1D Software Package for Simulating the One-Dimensional Movement of Water, Heat, and Multiple Solutes in Variably-Saturated Media, Version 3.0.; Department of Environmental Sciences, University of California Riverside: Riverside, CA, USA, 2005. [Google Scholar]
- Hutson, J.L. Leachm Model Description and User’s Guide; School of Chemistry, Physics and Earth Sciences, Flinders University of South Australia: Adelaide, Australia, 2003. [Google Scholar]
- Rahman, A. A GIS based DRASTIC model for assessing groundwater vulnerability in shallow aquifer in Aligarh, India. Appl. Geogr. 2008, 28, 32–53. [Google Scholar] [CrossRef]
- Shouyu, C.; Guangtao, F. A DRASTIC-based fuzzy pattern recognition methodology for groundwater vulnerability evaluation. Hydrol. Sci. J. 2003, 48, 211–220. [Google Scholar] [CrossRef]
- Civita, M. Legenda Unificata per le Carte Della Vulnerabilità dei Corpi Idrici Sotterranei/Unified Legend for the Aquifer Pollution Vulnerability Maps; Studi sulla Vulnerabilità degli Acquiferi 1 Pitagora: Bologna, Italy, 1990. [Google Scholar]
- Civita, M. Una metodologia per la definizione e il dimensionamento delle are di salvaguardia delle opere delle opere di presa delle sorgenti normali. Boll. Ass. Min. SUBALPINA 1988, 25, 423–440. [Google Scholar]
- Afshar, A.; Mariño, M.A.; Ebtehaj, M.; Moosavi, J. Rule-based fuzzy system for assessing groundwater vulnerability. J. Environ. Eng. 2007, 133, 532–540. [Google Scholar] [CrossRef]
- Caniani, D.; Lioi, D.S.; Mancini, M.I.; Masi, S. Application of fuzzy logic and sensitivity analysis for soil contamination hazard classification. Waste Manag. 2011, 31, 583–594. [Google Scholar] [CrossRef] [PubMed]
- Dixon, B. Groundwater vulnerability mapping: A GIS and fuzzy rule based integrated tool. Appl. Geogr. 2005, 25, 327–347. [Google Scholar] [CrossRef]
- Gemitzi, A.; Petalas, C.; Tsihrintzis, V.A.; Pisinaras, V.; et al. Assessment of groundwater vulnerability to pollution: A combination of GIS, fuzzy logic and decision making techniques. Environ. Geol. 2006, 49, 653–673. [Google Scholar] [CrossRef]
- Mohammadi, K.; Niknam, R.; Majd, V.J. Aquifer vulnerability assessment using GIS and fuzzy system: A case study in Tehran-Karaj aquifer, Iran. Environ. Geol. 2009, 58, 437–446. [Google Scholar] [CrossRef]
- Uricchio, V.F.; Giordano, R.; Lopez, N. A fuzzy knowledge-based decision support system for groundwater pollution risk evaluation. J. Environ. Manag. 2004, 73, 189–197. [Google Scholar] [CrossRef]
- Sdao, F.; Lioi, D.S.; Pascale, S.; Caniani, D.; Mancini, I.M. Landslide susceptibility assessment by using a neuro-fuzzy model: A case study in the Rupestrian heritage rich area of Matera. Nat. Hazards Earth Syst. Sci. 2013, 13, 395–407. [Google Scholar] [CrossRef]
- Civita, M.; de Maio, M. SINTACS. Un Sistema Parametrico per la Valutazione e la Cartografia Della Vulnerabilità Degli Acquiferi All’inquinamento: Metodologia e Automazione; Pitagora Editrice: Bologna, Italy, 1997. (In Italian) [Google Scholar]
- Rapti-Caputo, D.; Sdao, F.; Masi, S. Pollution risk assessment based on hydrogeological data and management of solid waste landfills. Eng. Geol. 2006, 85, 122–131. [Google Scholar] [CrossRef]
- Zadeh, L.A. Fuzzy sets. Inf. Control 1965, 8, 338–353. [Google Scholar] [CrossRef]
© 2015 by the authors; licensee MDPI, Basel, Switzerland. This article is an open access article distributed under the terms and conditions of the Creative Commons Attribution license (http://creativecommons.org/licenses/by/4.0/).