
An Advanced Method to Apply Multiple Rainfall Thresholds for Urban Flood Warnings

National Science and Technology Center for Disaster Reduction, New Taipei City 23143, Taiwan
Water 2015, 7(11), 6056-6078; https://doi.org/10.3390/w7116056
Submission received: 12 August 2015
/
Revised: 11 October 2015
/
Accepted: 28 October 2015
/
Published: 3 November 2015
Abstract
:Issuing warning information to the public when rainfall exceeds given thresholds is a simple and widely-used method to minimize flood risk; however, this method lacks sophistication when compared with hydrodynamic simulation. In this study, an advanced methodology is proposed to improve the warning effectiveness of the rainfall threshold method for urban areas through deterministic-stochastic modeling, without sacrificing simplicity and efficiency. With regards to flooding mechanisms, rainfall thresholds of different durations are divided into two groups accounting for flooding caused by drainage overload and disastrous runoff, which help in grading the warning level in terms of emergency and severity when the two are observed together. A flood warning is then classified into four levels distinguished by green, yellow, orange, and red lights in ascending order of priority that indicate the required measures, from standby, flood defense, evacuation to rescue, respectively. The proposed methodology is tested according to 22 historical events in the last 10 years for 252 urbanized townships in Taiwan. The results show satisfactory accuracy in predicting the occurrence and timing of flooding, with a logical warning time series for taking progressive measures. For systems with multiple rainfall thresholds already in place, the methodology can be used to ensure better application of rainfall thresholds in urban flood warnings.
1. Introduction
Scientific projections have shown that precipitation and flood extremes are going to increase considerably in the future [1,2,3,4]. Accordingly, more stress will be put on flood protection systems [5,6,7], thereby increasing the need for non-structural methods to reduce the impacts associated with natural and social changes [8]. Among the non-structural methods, the establishment of early warning systems is proven to be a task with a high benefit-cost ratio (e.g., [9,10]).
Defined by the United Nations, early warning is “the provision of timely and effective information, through identified institutions, that allows individuals exposed to a hazard to take action to avoid or reduce their risk and prepare for effective response” [11]. To meet the need for timeliness and effectiveness in delivering warning information, the rainfall threshold method is the most commonly used approach for flood forecasting [12]. Generally, rainfall threshold is defined as the cumulative rainfall depth for a given time period and a soil condition that generates critical runoffs high enough to cause disasters [13,14]. Compared with rainfall observation or prediction, rainfall thresholds can be used as a preliminary reference to initiate flood warnings prior to sophisticated hydrological simulations [15].
In the United States, the National Weather Service (NWS) refers to rainfall threshold as flash flood guidance (FFG), representing the rainfall depths that are required to produce a pre-determined runoff discharge at the outlet of a river basin [13,16]. The FFG can be determined analytically or statistically by employing rainfall-runoff models during various time periods under different antecedent soil moisture conditions (AMC; [17,18,19]). In Europe, the EMMA (European Multi-services Meteorological Awareness) provides early warnings on meteorological hazards for about 30 countries through the comparison between precipitation and local thresholds. In England and Wales, the ERA (Extreme Rainfall Alert) utilizes ensemble rainfall forecast to assess the threshold exceeding probability that might cause severe flooding in urban areas [14]. In France, the Marseilles Water and Sanitation Department compares rainfall intensity and accumulation with thresholds under different return periods to assess flood risk [20].
Despite the commonality of basic concepts, the methodology of how rainfall threshold methods are applied can be different for urban and countryside areas with different considerations for precision and parameters. For example, while FFG is dynamically adjusted by a rainfall-runoff model according to AMC, ERA adopts static thresholds without considering AMC because soil moisture becomes less important as urbanization increases [14]. Although dynamic flood warning for urban areas can be achieved by real-time hydrodynamic simulation that links rainfall to drainage system conditions, it is a more computationally expensive way to improve the efficiency of early warning systems compared with the rainfall threshold method. This is due to the fact that hydrodynamic models for urban areas are more demanding in terms of spatial and temporal resolutions in order to more accurately simulate runoff pathways [21,22,23].
For practical usage, flood warnings are required to be prioritized by the level of “emergency” and “severity” that describes how urgent and how serious a disaster could be. In the United States, a flood warning is divided into four levels in an ascending order of emergency, i.e., Flood Watch, Flash Flood Watch, Flood Warning, and Flash Flood Warning [24]. In England and Wales, the Environment Agency classifies flood warning into three levels, i.e., Flood Alert, Flood Warning, and Severe Flood Warning increased by severity [25]. Theoretically, this gradation of warning levels can be accomplished by flood simulations in space and time through the incorporation of meteorological and hydrological models, which, again, is very time-consuming that requires simplification or modification to meet the need for real-time operation [26,27,28,29]. To increase the lead time, attempts have been made by many researchers to incorporate precipitation forecast products into hydrological warning systems, in which ensemble techniques are necessary to address the uncertainties in hydro-meteorological forecasting [30,31]. Usually, the ensemble processes demand much more computer resources to shorten computational time. Moreover, flood modeling for cities encounters uncertainties associated with the accuracy of DEM (digital elevation information), the choice of parameters, the simplification of mathematics, and the variety of numerical schemes [32,33]. When it comes to decision support, deterministic model results require further translation to address the uncertainties in developing flood warnings [34,35].
In this study, attempts are made to advance the rainfall threshold method without sacrificing its simplicity and efficiency through the help of hydrodynamic modeling. The advanced method sophisticates warning classification by translating computational results into a rapid criteria-based decision procedure through stochastic processes. Utilizing the historical data in the last decade in Taiwan for calibration and validation, the study carefully discusses the determination of rainfall threshold, the diversity of rainfall durations, the influence of drainage systems, the gradation of warning levels, etc. This serves to improve the sophistication in the prediction of flood occurrence and timing. Hopefully, the methodology proposed can be applied to advance traditional rainfall threshold methods for urban flood warnings.
2. Methodology
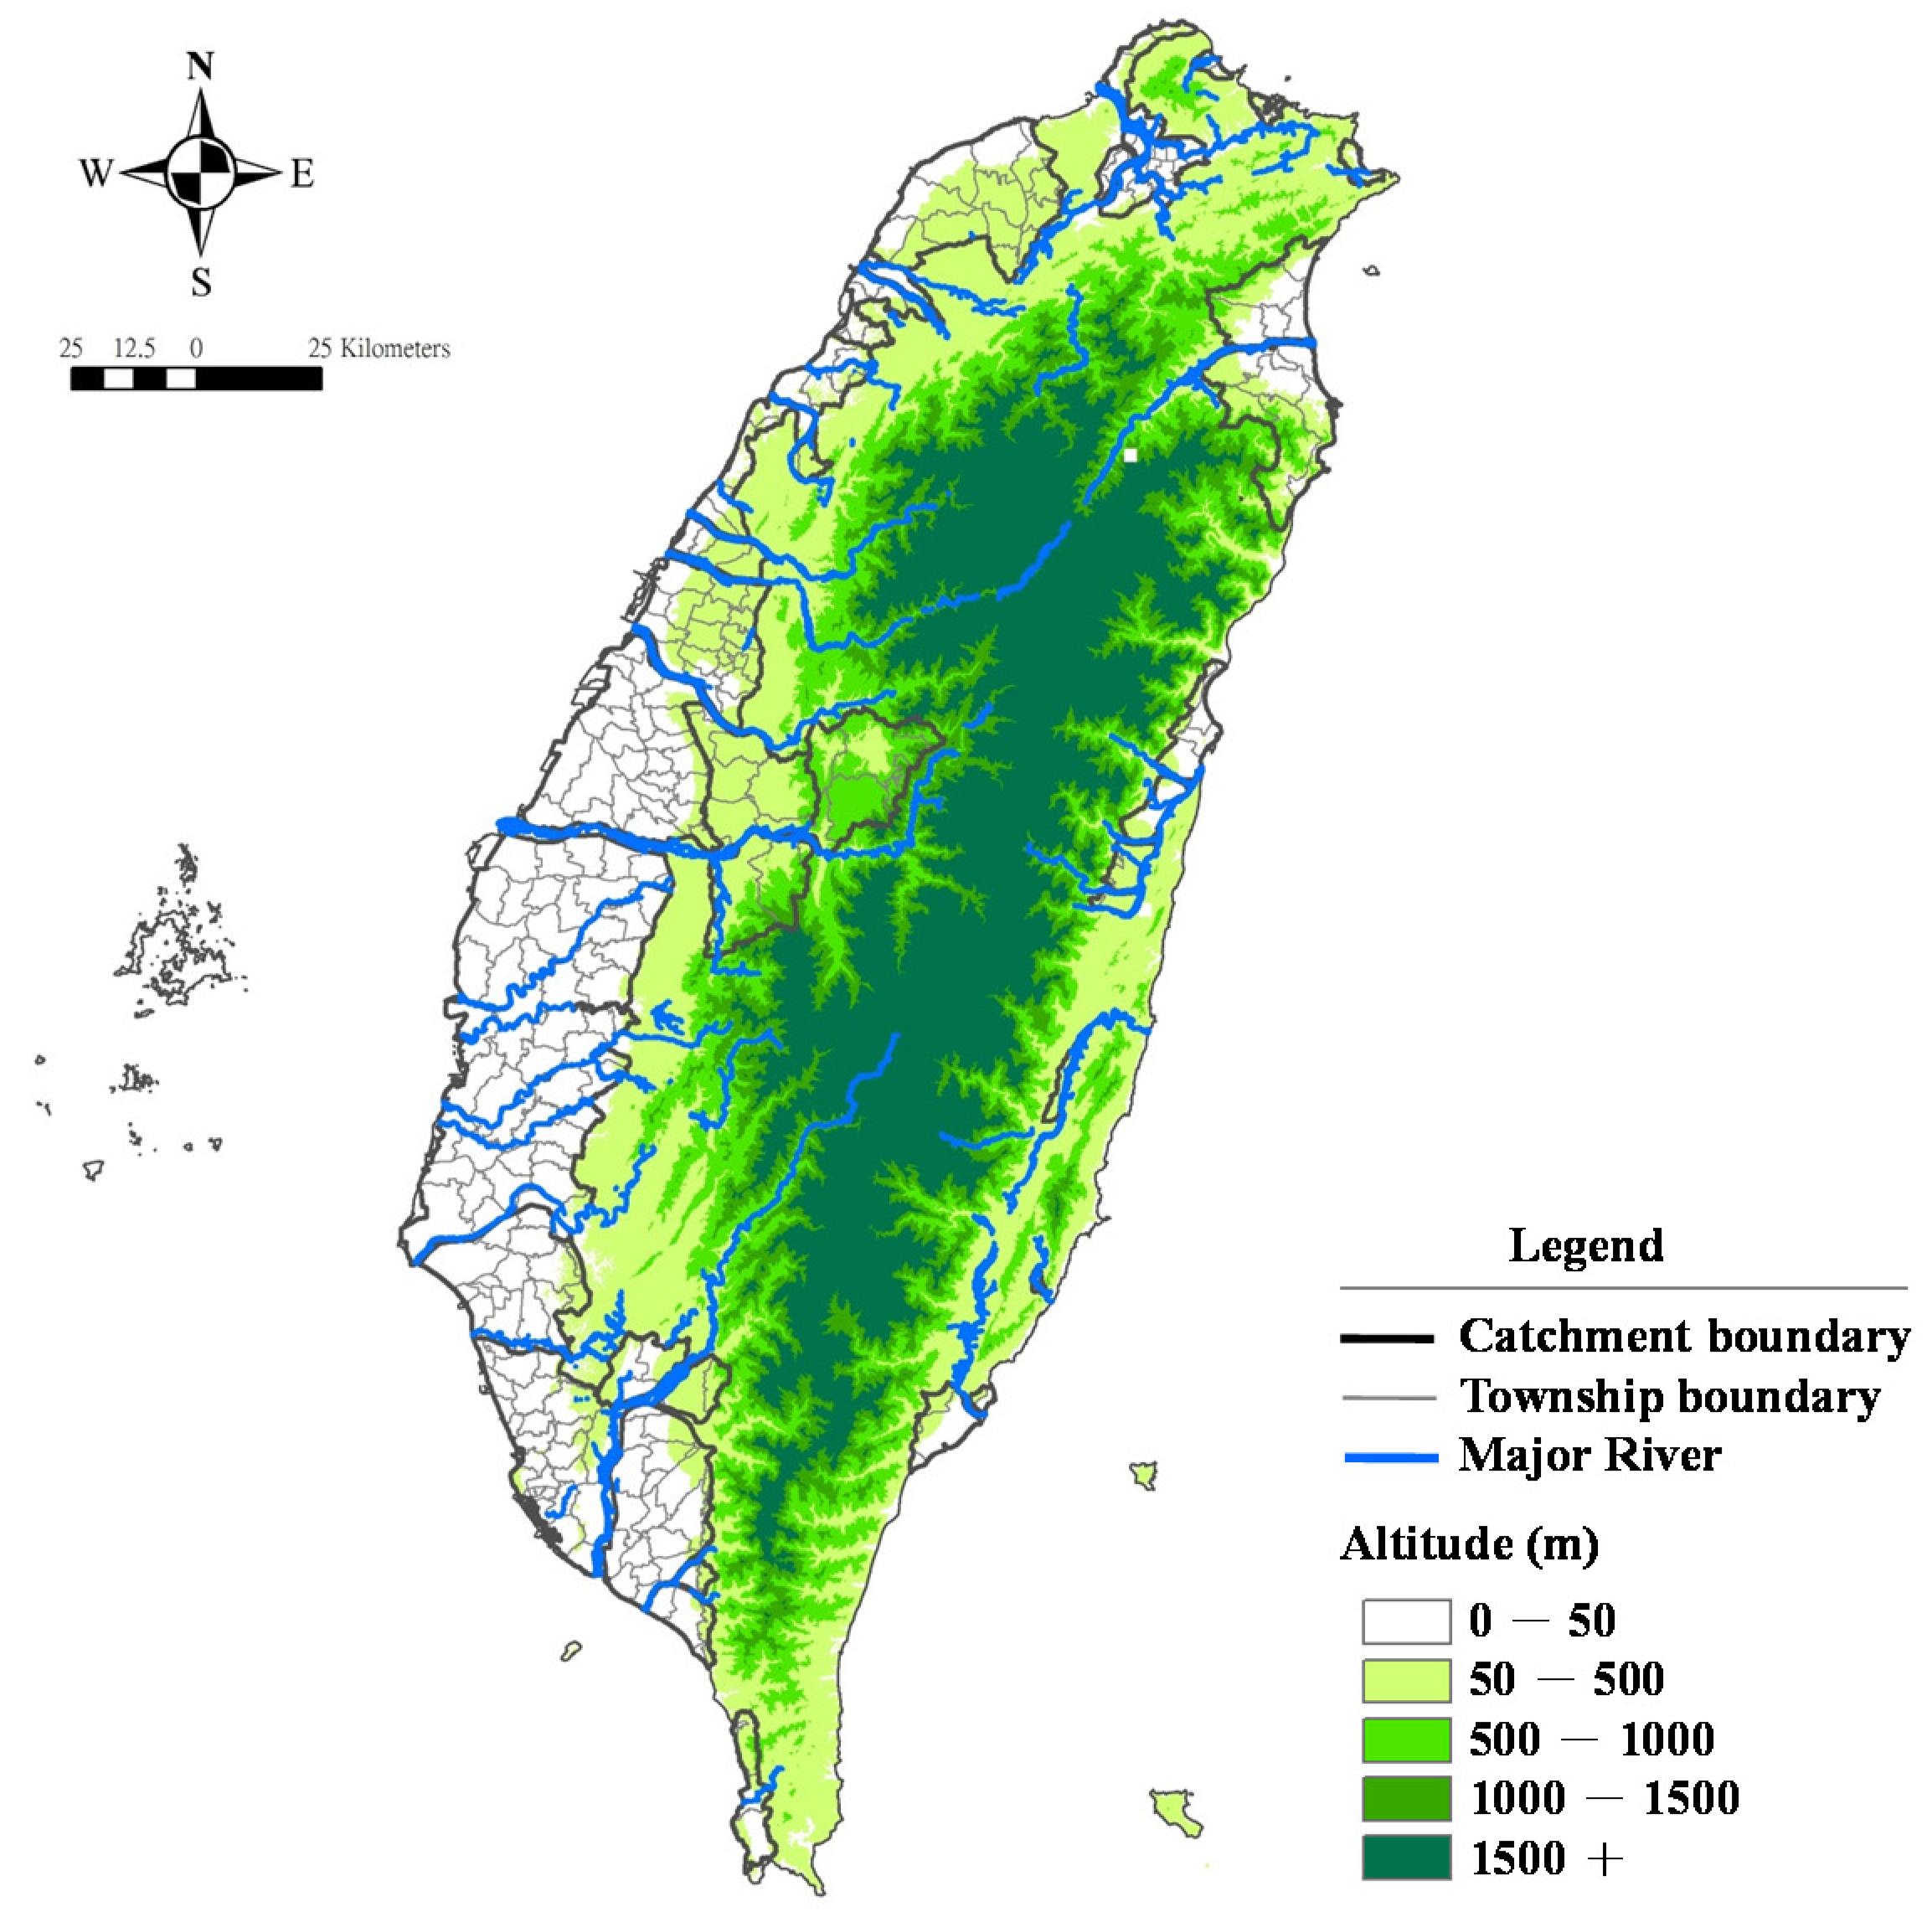
In this research, 252 townships with higher levels of urbanization and population in Taiwan are selected as the study subjects. Figure 1 shows that these urbanized townships are mainly located in low-lying areas (altitude <50 m) covering 30% of the total area of Taiwan and 90% of the population. Processing the DEM on a geographic information system (GIS) platform, the 252 urbanized townships (mean area 36 km2) in Figure 1 are distributed among 51 catchments (mean area 216 km2). Note that the townships are not sub-basins but administrative units for declaring warning messages; thus, water can flow across townships in the same catchment. The catchments in Figure 1 are generally bounded by high dikes designed to prevent river overflow within a 100-year return period, and the discharges from high mountains are driven into major rivers before reaching cities. In this case, flooding is mainly caused by surface runoff inside a catchment and rainfall thresholds can be localized at the township level related to local rainfall and drainage capability. As this method evaluates the thresholds of urban rainfall for inland inundation, it is complementary to the FFG that addresses the thresholds of mountain rainfall for river discharge. In the flood travel time from catchment upstream to the township, multiple rainfall thresholds can be simultaneously adopted as warning guidance for examining rainfall depth within different durations. The level of warning severity and emergency can be determined by how many and what combination of rainfall thresholds are being exceeded, respectively. Relevant methodologies are discussed in detail as follows.
Figure 1.
Study areas for urbanized townships in Taiwan.

2.1. Critical Flood Conditions
Many researchers define the rainfall threshold as the rainfall amount that, once exceeded, can trigger a critical discharge in a specific river cross-section or basin outlet that causes damage downstream [13,17,36]. This is especially feasible for rural areas while a variety of rainfall-runoff models are helpful to determine the relationship between rainfall and discharge on a catchment scale. However, for the 51 urban catchments with well-built dike systems and gentle terrains (mean slope <1%), water depth rather than river discharge is adopted as the flood indicator since flooding is more related to surface runoff instead of river overflow. According to Taiwan’s official investigation into flood depth-loss function [37], 50 cm is a critical water depth to cause a rapid increase in flood damage. Thus, the rainfall threshold is defined as the rainfall amount needed to generate 50 cm of critical water depth at specific points in an urbanized township. These points may not necessarily be located in river cross sections because flooding in cities can be very scattered caused by rapid inundation of low-lying terrains or slow floodwater accumulation at flow joints. Basically, the location of the flooding points can be identified by a grid-based inundation model described in Section 2.2 and the flood information can be summed up at the township level for administrative operation.
In determining the relationship between rainfall and water depth, geomorphological factors contributing to flooding should be differently considered for rural and urban areas. For rural areas, rainfall thresholds are highly influenced by AMC that can be estimated by SCS procedures [38,39] and models accounting for the soil moisture deficit [40]. However, the AMC is less crucial for urbanized areas with a high coverage of impervious surfaces, where rainfall thresholds are more related to the capacity of drainage systems [14]. As urbanized townships are of concern in this study, the influence of AMC is not included.
2.2. Multiple Rainfall Thresholds
Rainfall thresholds usually come in multiple durations, e.g., 1-, 3-, 6-h used by ERA [14] and 1-, 3-, 6-, 12-, 24-h used for FFG [41], because a given flood scale could be induced by water accumulated within different periods of time. As ERA is applied for urban areas where drainage systems are designed for quick removal of flood water, shorter rainfall thresholds are adopted to decide if drainage is overloaded. As for FFG, longer rainfall durations are included to estimate runoff discharge for rural areas with different upstream catchment sizes and concentration times. The rainfall thresholds of ERA and FFG are determined by the Flood Estimation Handbook [42] and rainfall-runoff models, respectively, according to their purposes. Considering that large-scale urban flooding results from drainage overload by long-term floodwater accumulations, this study adopts rainfall thresholds with a wider range of durations, in which the shorter ones (1-, 3-, and 6-h) measure the criteria for drainage overload and the longer ones (12-, 24-h, and above) evaluate the critical rainfall needed to generate disastrous surface runoff.
As concentration time limits the duration of rainfall thresholds, a well-tested inundation model [43,44] is used to simulate the time to flood peak within a five-year return period of rainfall evenly distributed in space. This rainfall scale is the design criterion for storm sewer systems in Taiwan to cause full section flow. The inundation model combines the HEC-1 [45] rainfall-runoff model, a 1D channel dynamic model [46], a 2D non-inertial overland flow model [47], and the SWMM [48,49] urban sewer model in a GIS platform. Basically, the inundation model involves three steps: first, the upstream rainfall excess is incorporated into the HEC-1 model to obtain the upland runoff; second, the upland runoff is input to the 1D channel model and the SWMM to calculate the river and surface discharge hydrographs, respectively; third, these discharge hydrographs are introduced into the 2D overland flow model to simulate the surface inundation considering the operation of pumping stations. The inundation model has been validated by showing a good agreement between the simulation and investigation of flood extent and depth for historical events [43,44].
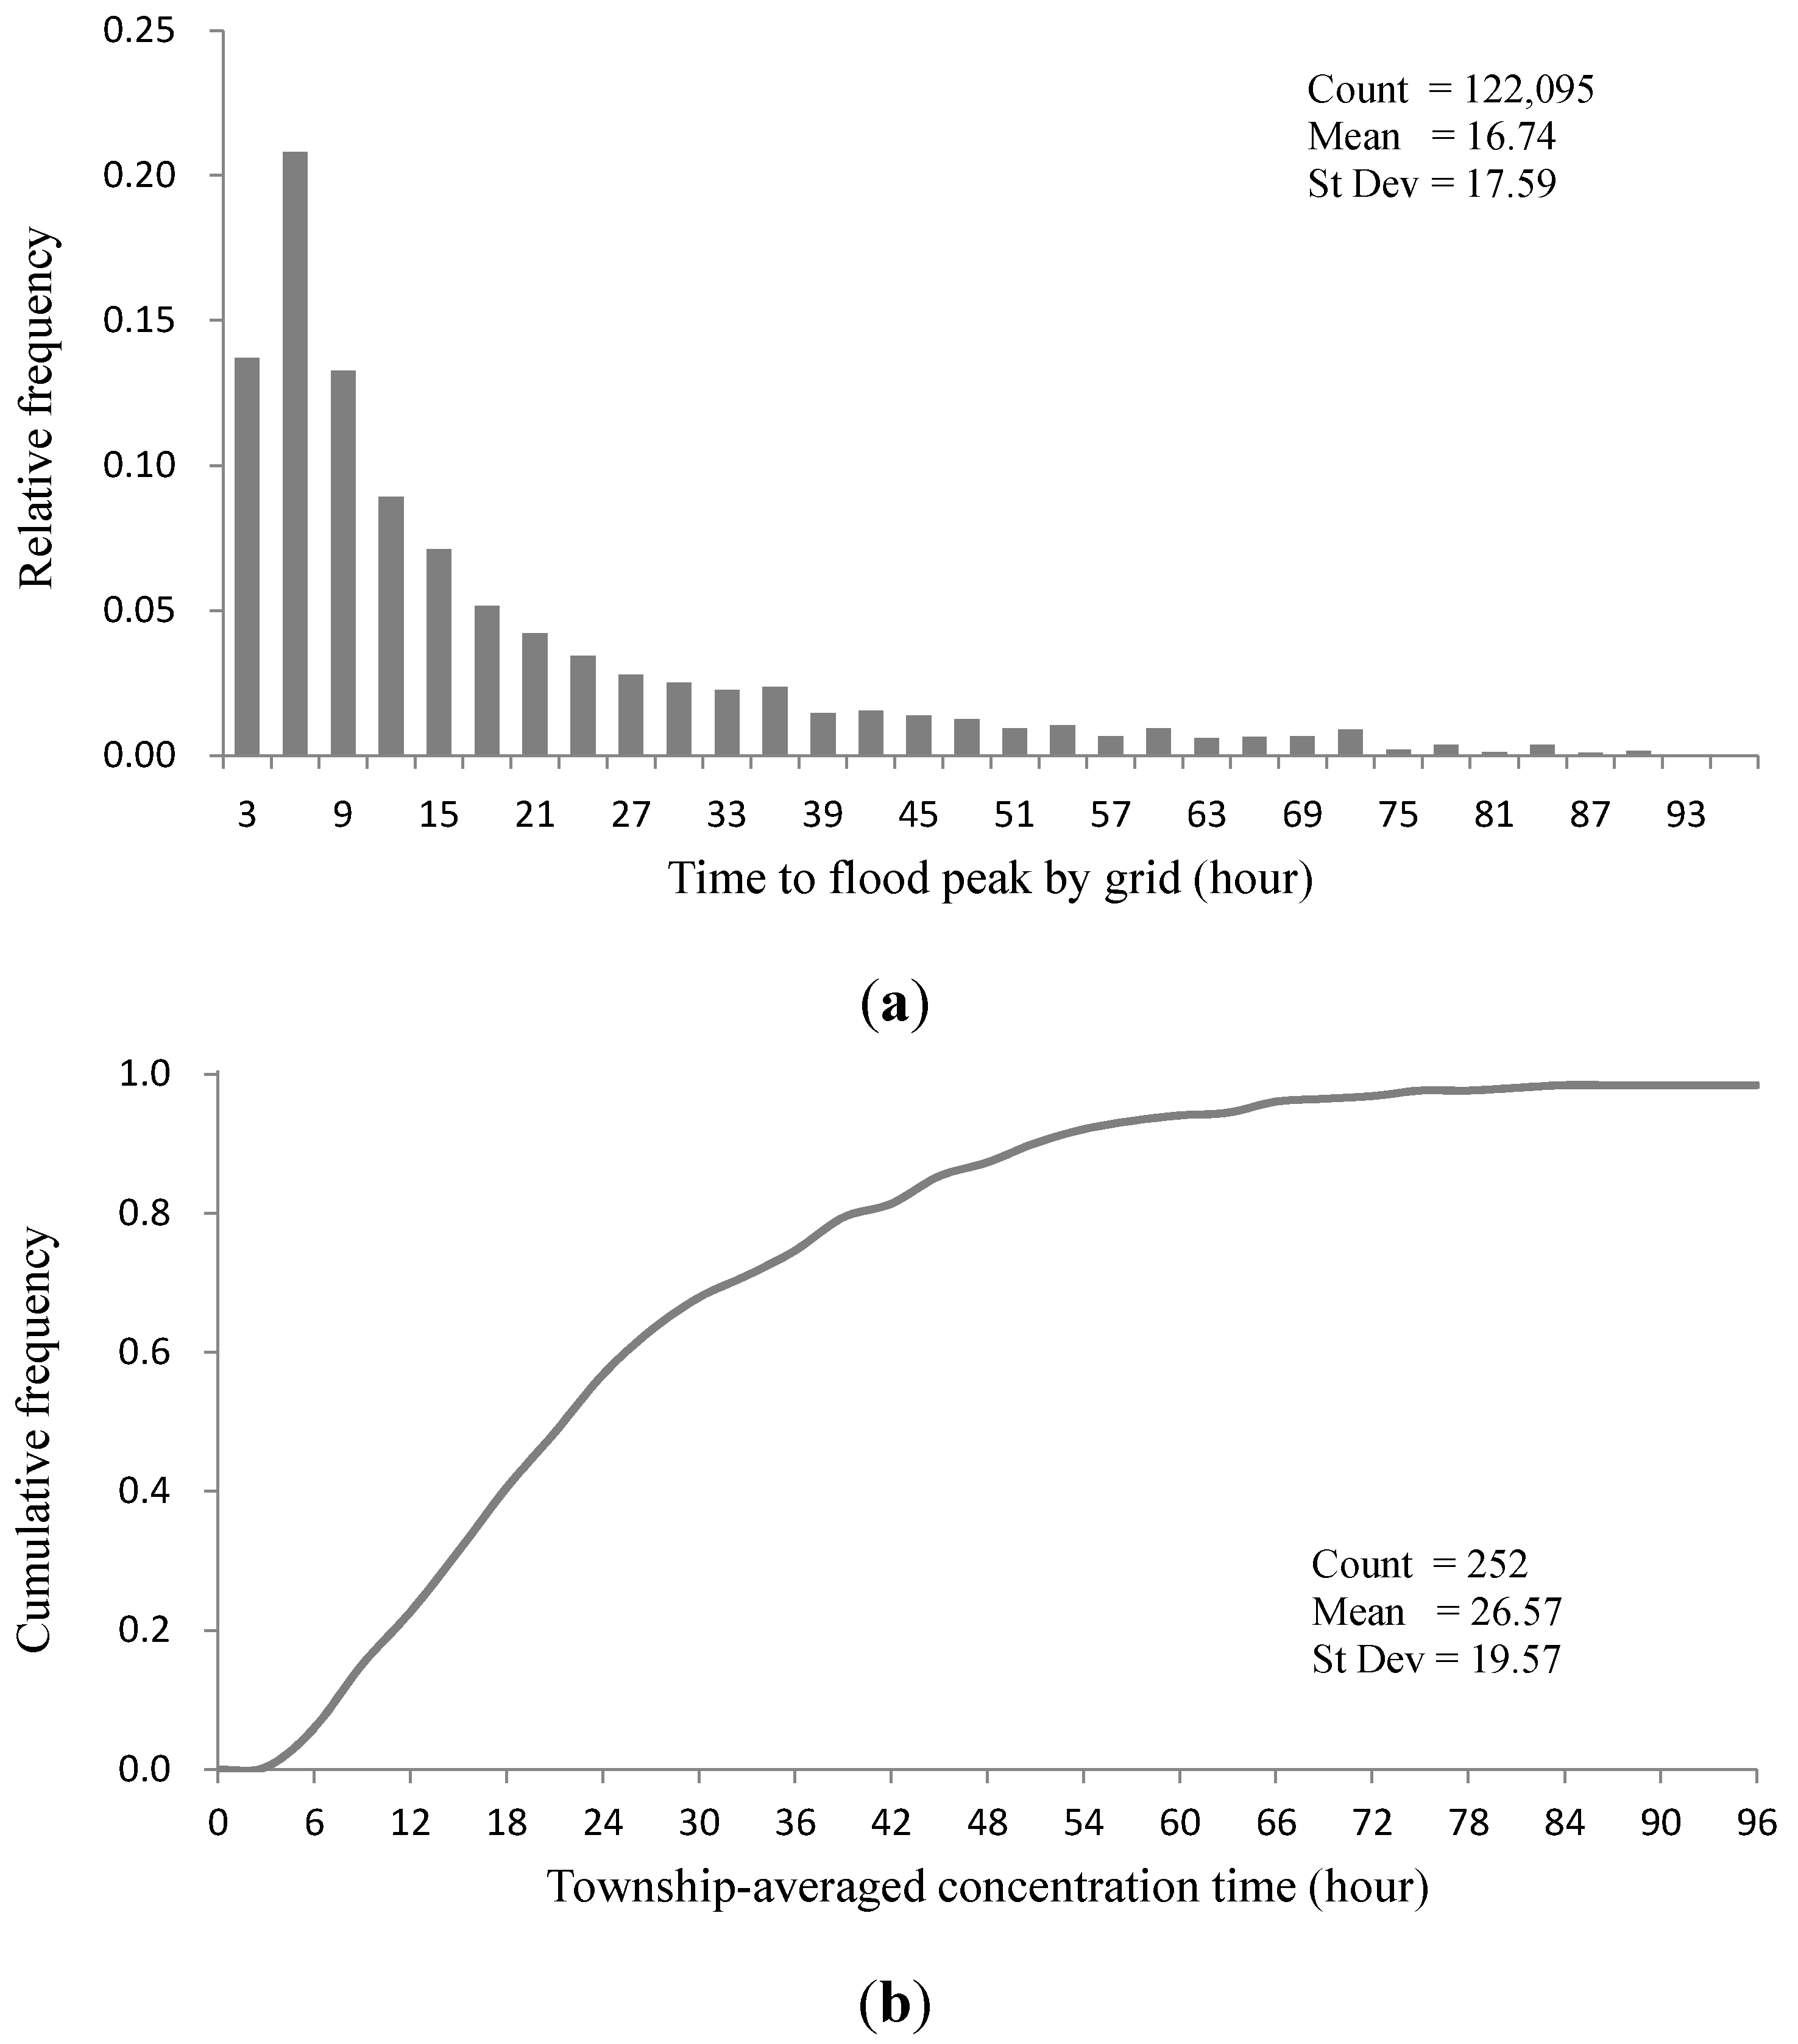
A nationwide DEM (5 × 5 m2 grid resolution) data is incorporated to obtain detailed variation of topography for model operation on a 40 × 40 m2 grid resolution. Figure 2a shows the relative frequency for the time to flood peak, Ta, for cells with water depth deeper than 50 cm. It indicates that the relative frequency reaches its maximum (about 21%) at 6 hours before flood peak, and after that, decreases as time progresses. As for average natural watershed where runoff is assumed to be uniformly distributed, the Ta equals 0.6 times the concentration time according to NRCS [50], and the township-averaged concentration time, Tc, can be calculated and displayed in Figure 2b. Since 91% of the townships have Tc ranging between 6 and 72 h, rainfall thresholds with 1-, 3-, 6-, 12-, 24-, 48-, and 72-h durations are adopted to fully incorporate the spectrum of time. According to Intensity-Duration-Frequency curves [51], the intensity of short-duration rainfall is usually greater than that of long-duration rainfall, implying that rainfall thresholds gradually level off as duration increases.
Figure 2.
(a) Relative frequency for time to flood peak by grid; and (b) cumulative frequency for township-averaged centration time.
Figure 2.
(a) Relative frequency for time to flood peak by grid; and (b) cumulative frequency for township-averaged centration time.
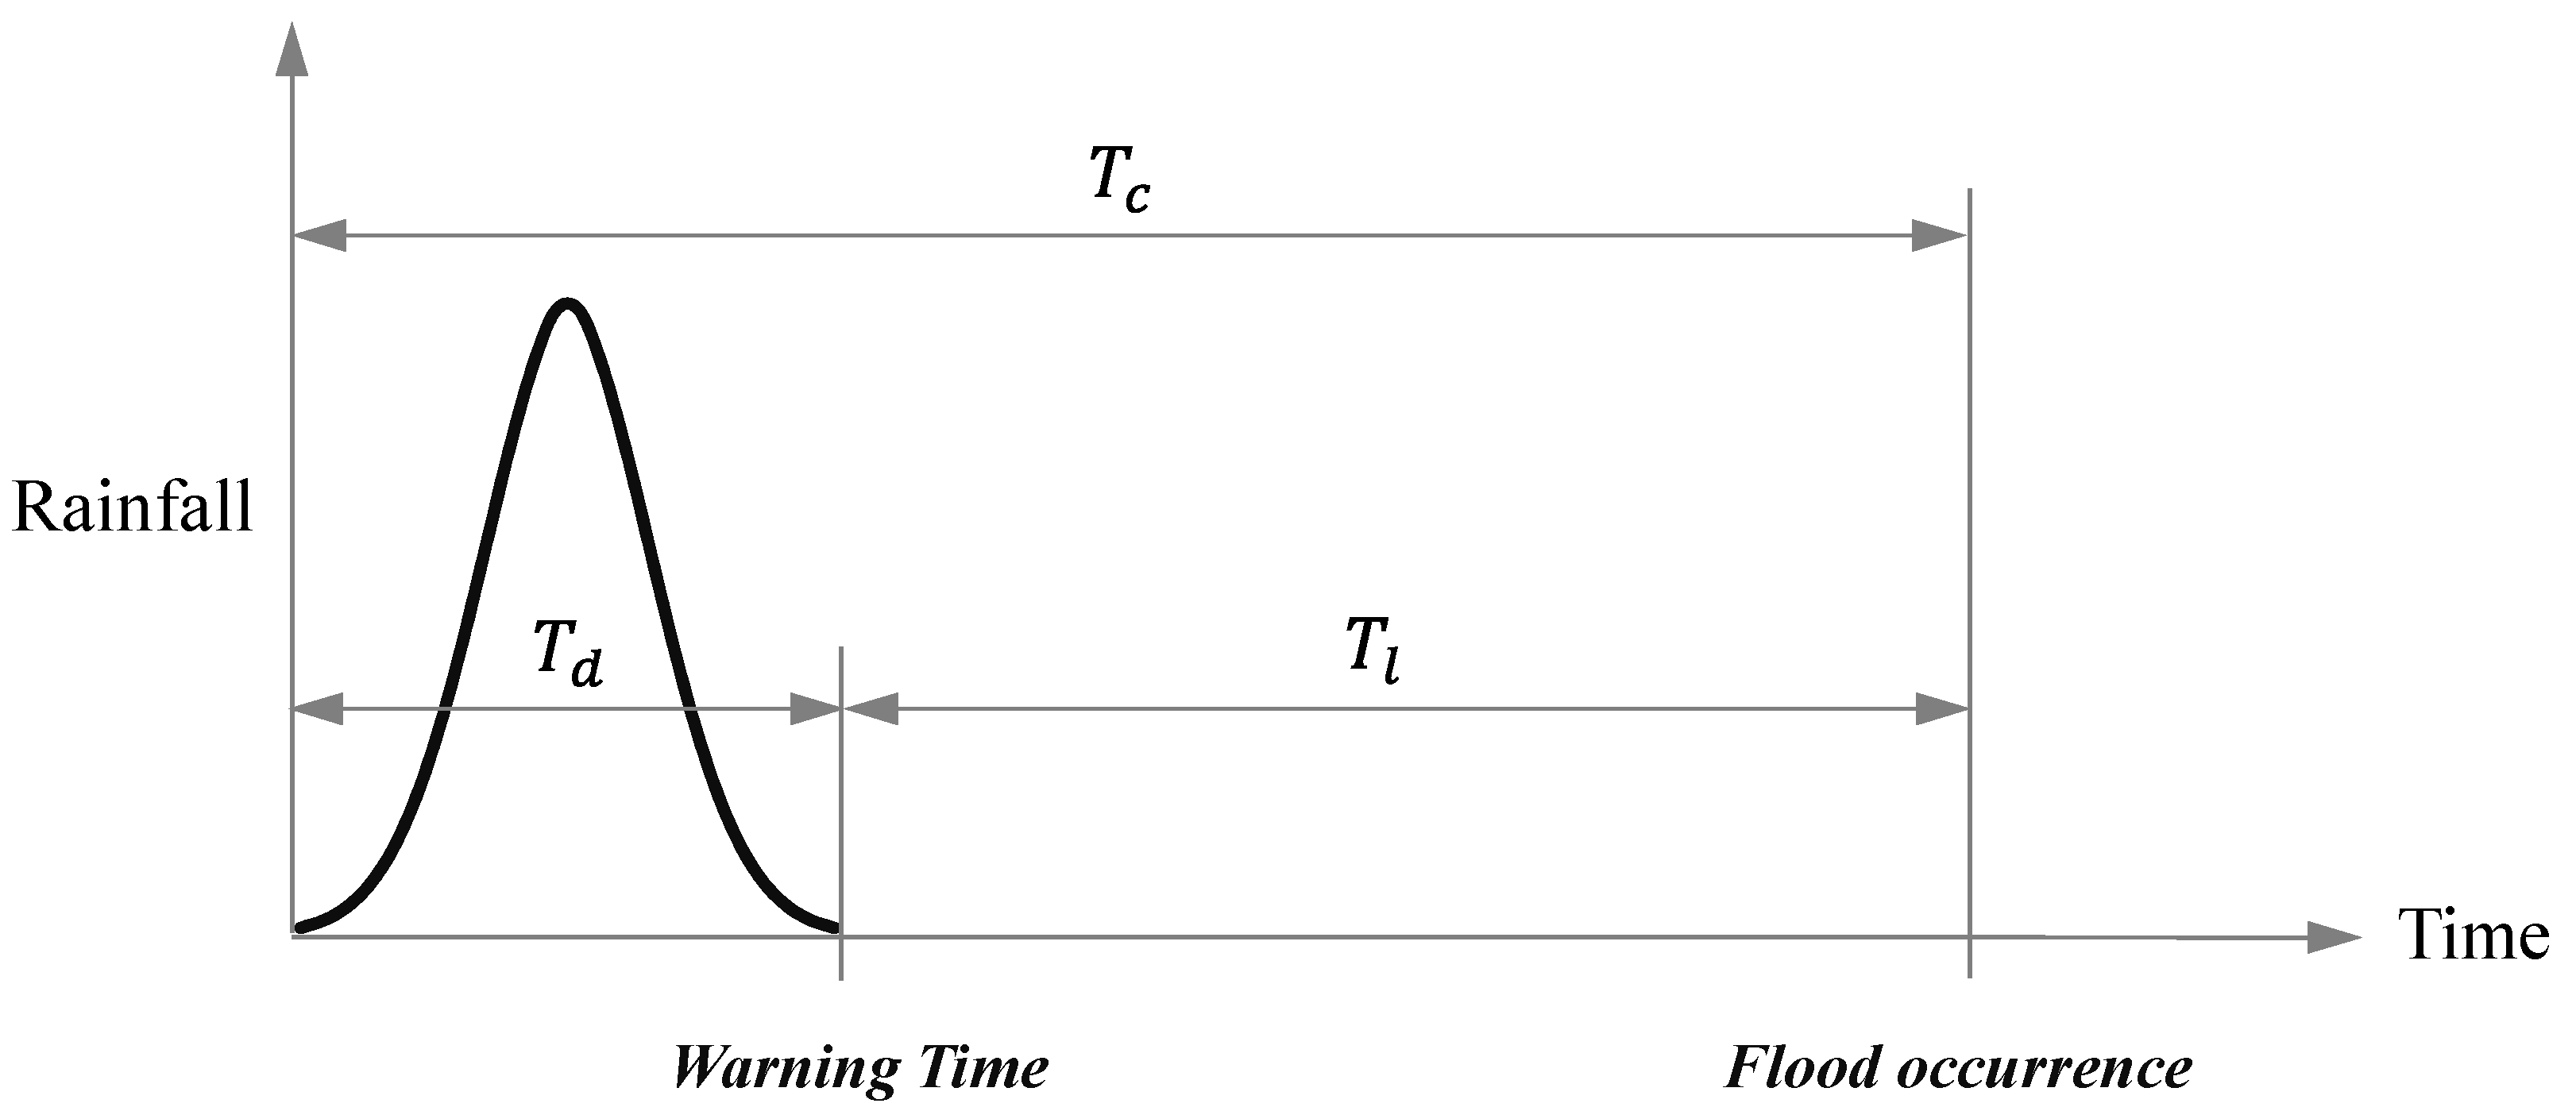
The relationship between Tc, rainfall duration Td, and the lead time from the warning time to flood occurrence Tl, can be schematically demonstrated in Figure 3. It indicates that, at the time when the accumulated rainfall exceeds the thresholds, warning will be given in preparation for the flood occurring afterward. One can see that Td should not exceed Tc; otherwise, and flood warning will fall behind flood occurrence. Under the restriction of , the size of rainfall threshold package will be township-dependent since Tc varies with townships related to catchment characteristics. For townships located at the downstream in a larger catchment, Tc will be larger and more lead time will be provided. On the contrary, the duration of rainfall threshold Td affects Tl reversely because the more time one spends on observation, the less time one has for reaction. In application, because for short-duration rainfall thresholds, the drainage thresholds can be triggered much earlier than the runoff thresholds before flood occurrence. However, false alarms may appear frequently if only drainage thresholds are consulted due to short-term rainfall vibration; in this case, long-duration thresholds provide initial hydrological backgrounds to filter noise. Due to the fact that any rainfall hyetograph can be discretized into a series of short- and long-duration rainfalls, multiple rainfall thresholds can be cross-examined at any specific time.
Figure 3.
The relationship between concentration time Tc, rainfall duration Td, and lead time Tl in flood warning.
Figure 3.
The relationship between concentration time Tc, rainfall duration Td, and lead time Tl in flood warning.

2.3. Determination of Rainfall Thresholds
In this study, a hybrid deterministic-stochastic approach is adopted for rainfall threshold estimation. The initial rainfall thresholds are deterministically decided by the above-mentioned inundation model in two steps. First, for each township, some specific points with lower topography and higher flood potential are located on a GIS platform according to local DEM. Second, under 1, 3, 6, 12, 24, 48, 72-h durations, numerical experiments are conducted by iteratively introducing different rainfall hyetographs into the inundation model, in order to find the critical rainfalls required for generating water depth equal or greater than 50 cm at the specific points in a township. For each experiment, the rainfall is assumed to be uniformly distributed in space and time with the drainage functioning well. However, these simplifications may lead to inaccuracy because rainfall distribution can be very non-uniform as the basin area increases [52] and the capacity of drainage systems actually varies with time due to damage, aging, or reinforcement. Therefore, the initial rainfall thresholds should be adjusted stochastically according to the feedback of field flood conditions in historical events.
A total of 22 rainfall events from 2004–2012 are adopted for case studies, including eight rainstorms and 14 typhoons. The event name, time, and mean/standard-deviation of accumulated rainfall for the 22 cases are listed in Table 1. Shown in the table is also the number of flooded townships as reported by local observers in street blocks with low-lying terrains or at regional flow joints. Basically, flooding in Taiwan is induced by rainstorms related to weather fronts and monsoons, or by typhoons formed in the Northwestern Pacific Ocean during July–October. Sometimes, the flooding scale caused by rainstorms is no less than that caused by typhoons, e.g., Rainstorms 0702, 0612, 0609, 0809, and 0610 in Table 1. The scale of typhoon-induced flooding is mainly affected by how fast the typhoon passes through the island. For typhoons travelling at slow speed like Morakot, severe flooding took place since more rainfall accumulated on the windward side of the central mountains.

| Event | Time | No. of Flooded Townships | Accumulated Rainfall (Mm) | |
|---|---|---|---|---|
| Mean | St. Dev. | |||
| Typhoon Mindulle | 28 June–3 July 2004 | 73 | 390 | 226 |
| Rainstorm 0702 | 1–5 July 2004 | 42 | 502 | 351 |
| Typhoon Aere | 23–26 August 2004 | 6 | 269 | 236 |
| Rainstorm 0907 | 7–11 September 2004 | 12 | 187 | 139 |
| Rainstorm 0512 | 12–16 May 2005 | 18 | 170 | 135 |
| Rainstorm 0612 | 12–16 June 2005 | 75 | 340 | 319 |
| Typhoon Haitang | 16–20 July 2005 | 45 | 479 | 335 |
| Typhoon Talim | 30 August–1 September 2005 | 43 | 233 | 155 |
| Rainstorm 0609 | 9–11 June 2006 | 59 | 346 | 243 |
| Typhoon Bilis | 12–15 July 2006 | 18 | 240 | 180 |
| Rainstorm 0809 | 9–14 August 2007 | 46 | 259 | 218 |
| Typhoon Sepat | 16–19 August 2007 | 69 | 269 | 180 |
| Typhoon Kalmaegi | 16–18 July 2008 | 109 | 262 | 226 |
| Typhoon Fungwong | 26–29 July 2008 | 52 | 245 | 158 |
| Typhoon Morakot | 5–10 August 2009 | 117 | 688 | 610 |
| Typhoon Parma | 3–6 October 2009 | 10 | 175 | 244 |
| Typhoon Fanapi | 17–20 September 2010 | 58 | 193 | 155 |
| Typhoon Megi | 21–23 October 2010 | 8 | 136 | 182 |
| Rainstorm 0520 | 20–22 May 2012 | 4 | 53 | 50 |
| Rainstorm 0610 | 10–14 June 2012 | 56 | 394 | 299 |
| Typhoon Talim | 19–21 June 2012 | 7 | 138 | 117 |
| Typhoon Tembin | 21–28 August 2012 | 2 | 170 | 180 |
Starting from the initial value given by the inundation model, the rainfall thresholds for each township are dynamically adjusted along with the timeline of the 22 case studies by following the rules below:
where is the rainfall threshold with i hours of duration; and denote the observed rainfall with i h of duration for non-flooded and flooded cases, respectively. By Equation (1), the rainfall threshold will be raised while experiencing a non-flooding event with rainfall larger than the previous event, and vice versa. Theoretically, the rainfall thresholds will be updated at least three times a year since Taiwan has three to four big rainfall events annually. If the local conditions of a catchment change quickly between one event and the next due to non-meteorological causes like earthquakes or construction, the thresholds may not be adjusted timely by Equation (1) unless extra considerations are incorporated to lower or raise the thresholds. Fortunately, these unexpected emergencies occur much more infrequently than the rainfall events.
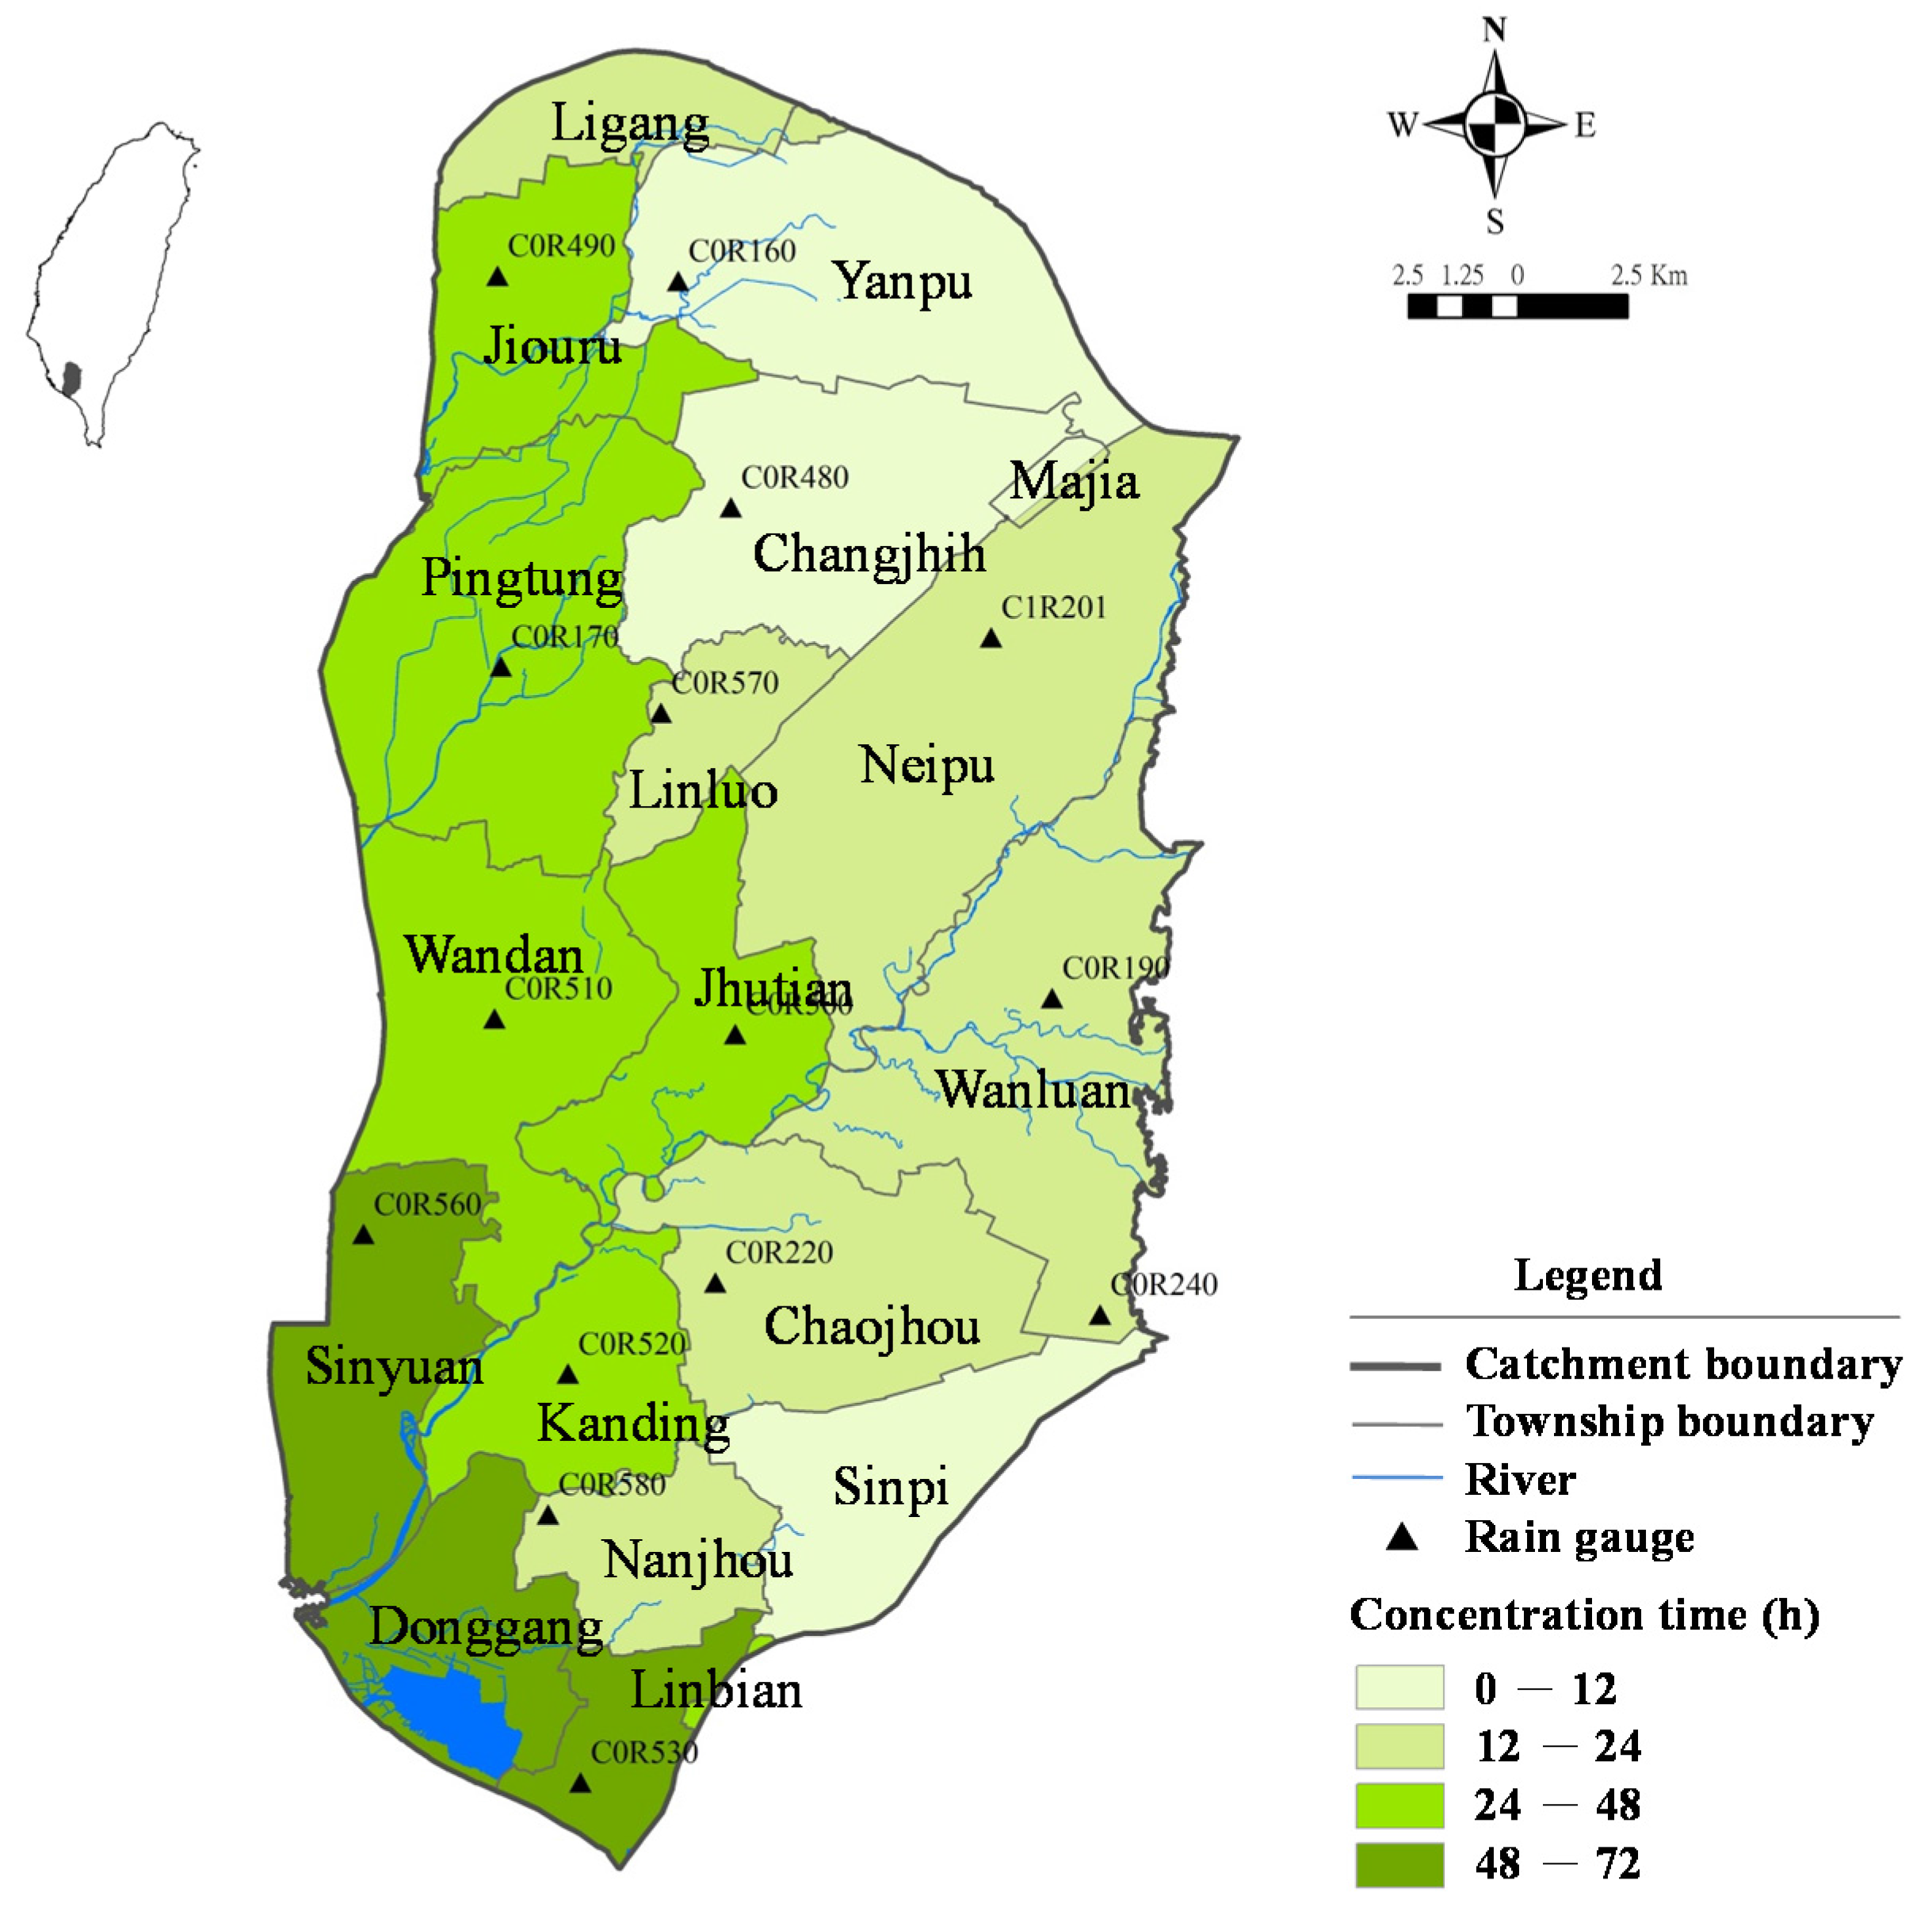
To register rainfall and issue flood warnings at the township level, each township is paired with a rain gauge with the highest geographical correlation weighted by Thiessen polygon method [53]. As there are 226 rain gauges distributed among the 252 study townships, the density of rain gauges is high enough to capture the rainfall characteristics at a township level. Figure 4 illustrates the distributions of rain gauges, townships, and township-averaged concentration time, Tc, for Pintung Catchment located in southwestern Taiwan. It is reasonable to see that the downstream townships have a longer concentration time than the upstream ones.
Figure 4.
Distribution of rain gauges, townships, and township-averaged concentration time for Pingtung Catchment.
Figure 4.
Distribution of rain gauges, townships, and township-averaged concentration time for Pingtung Catchment.

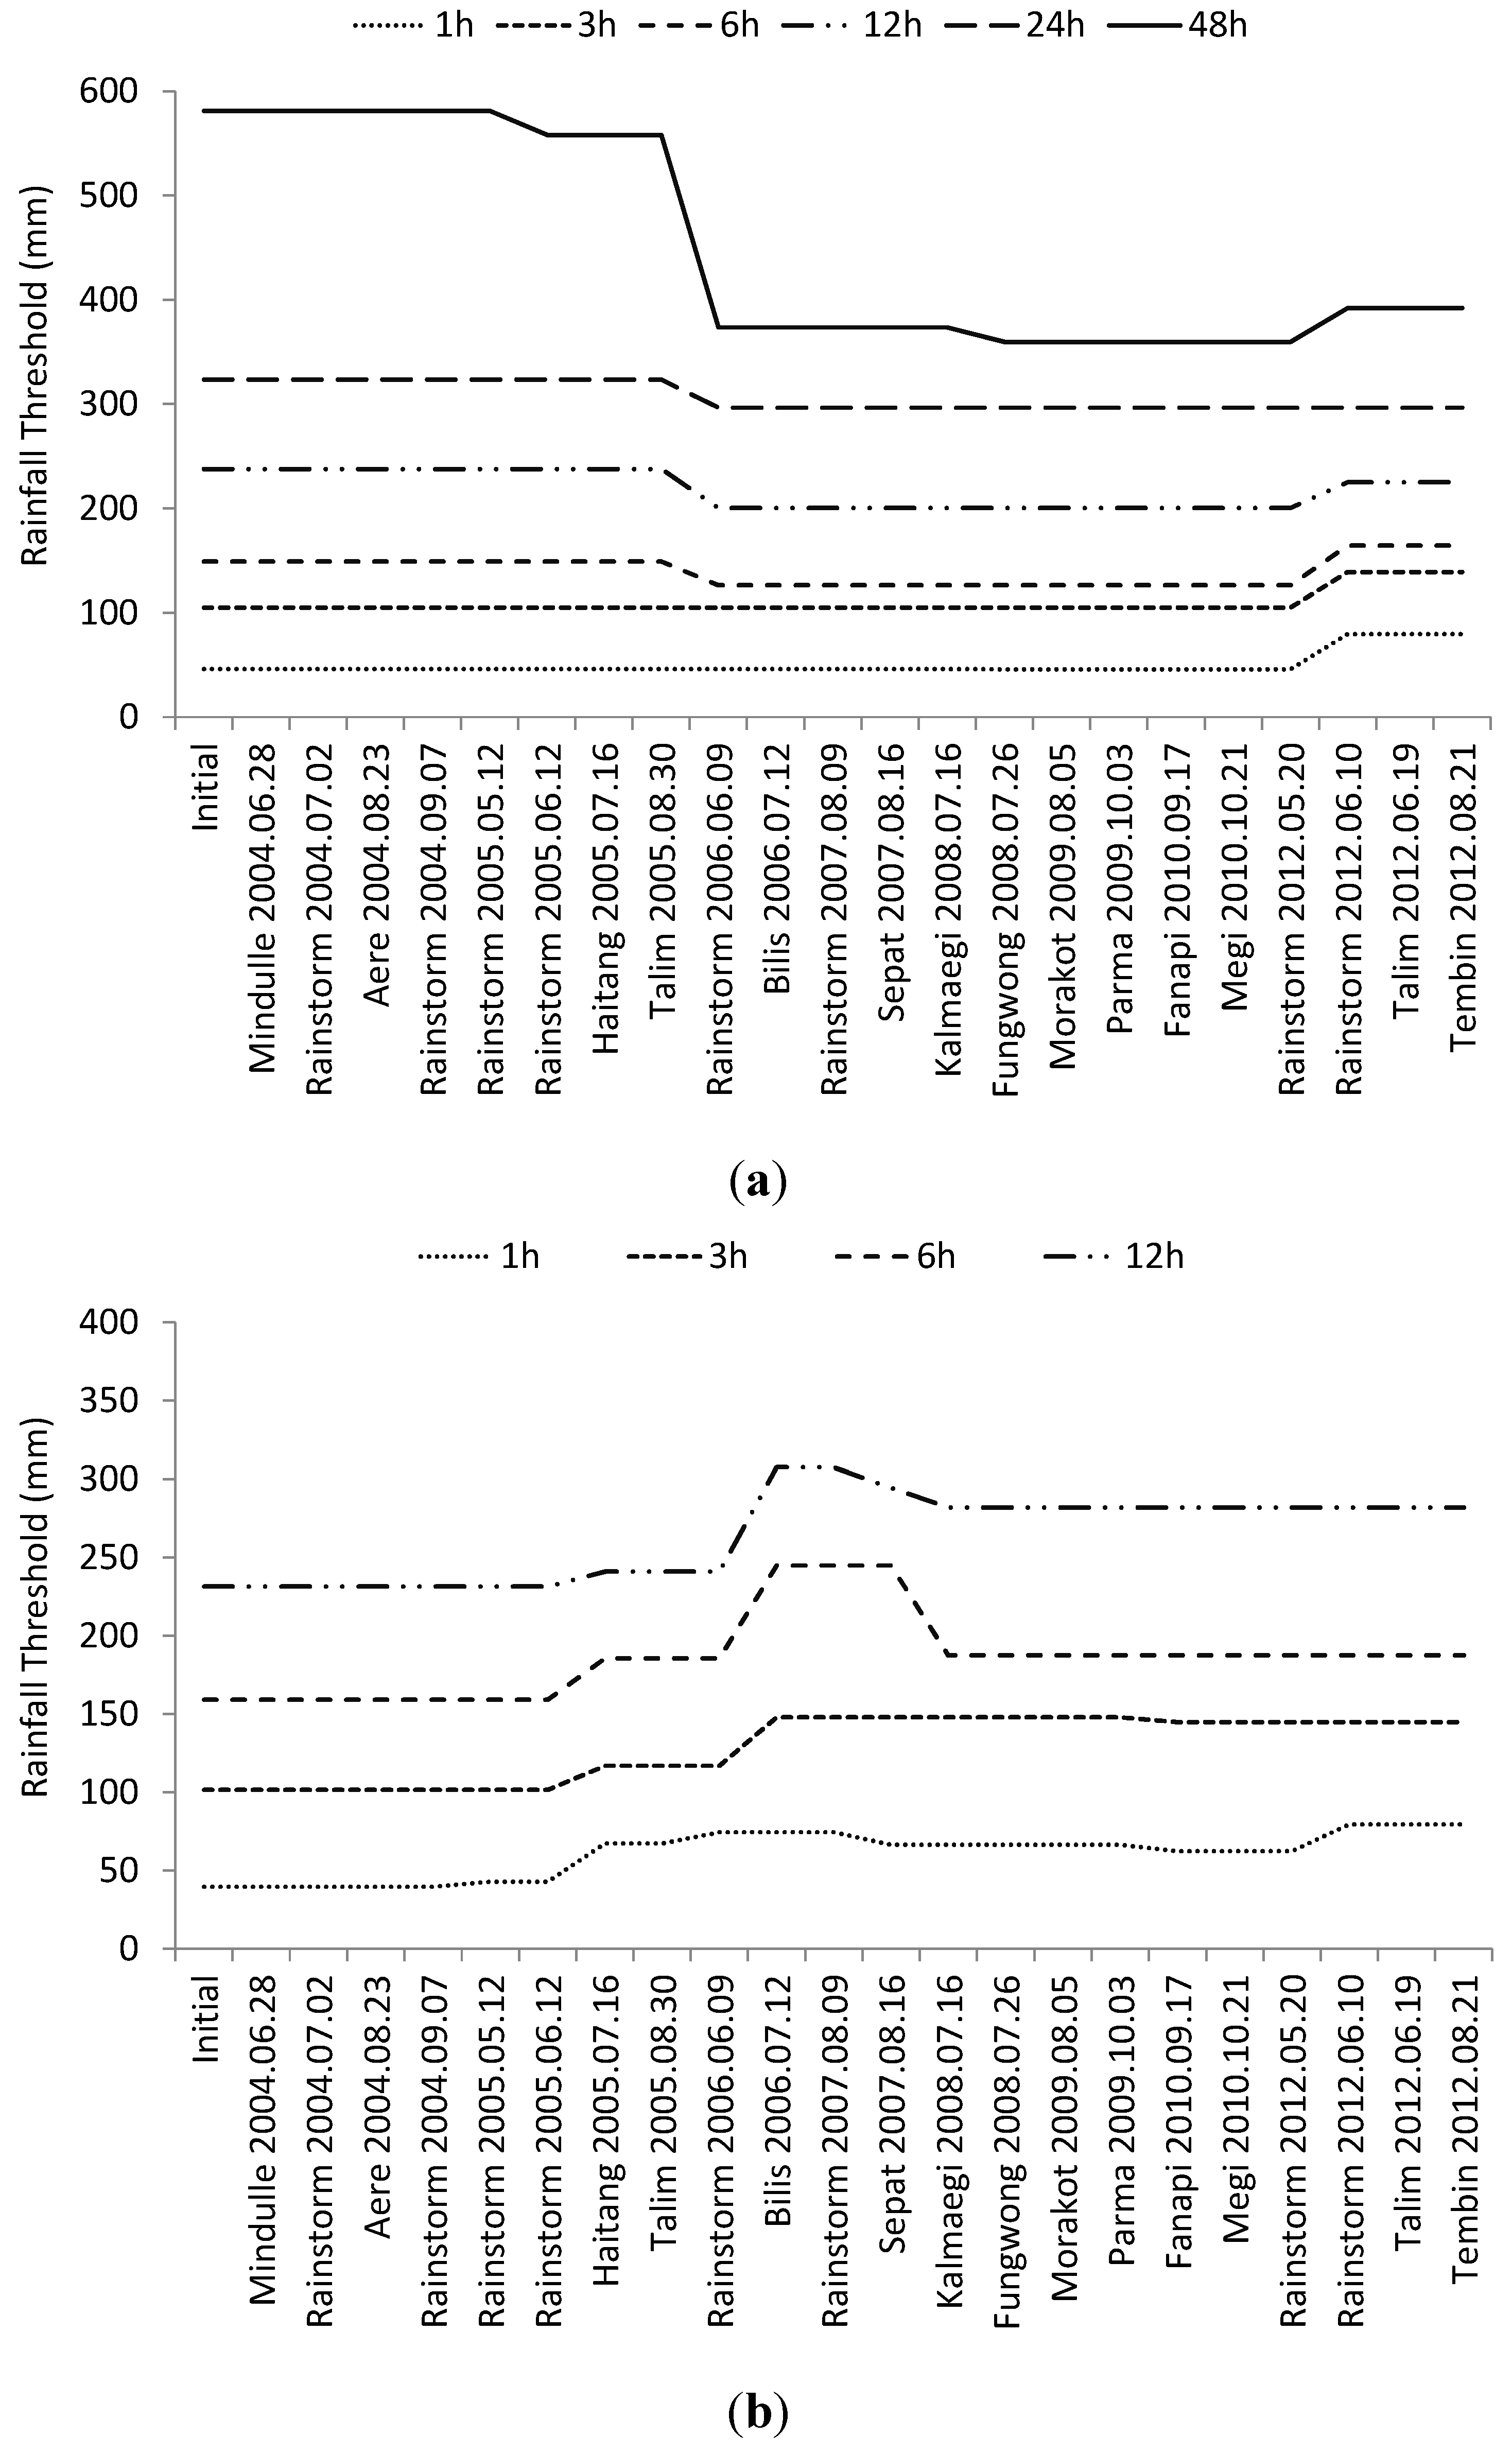
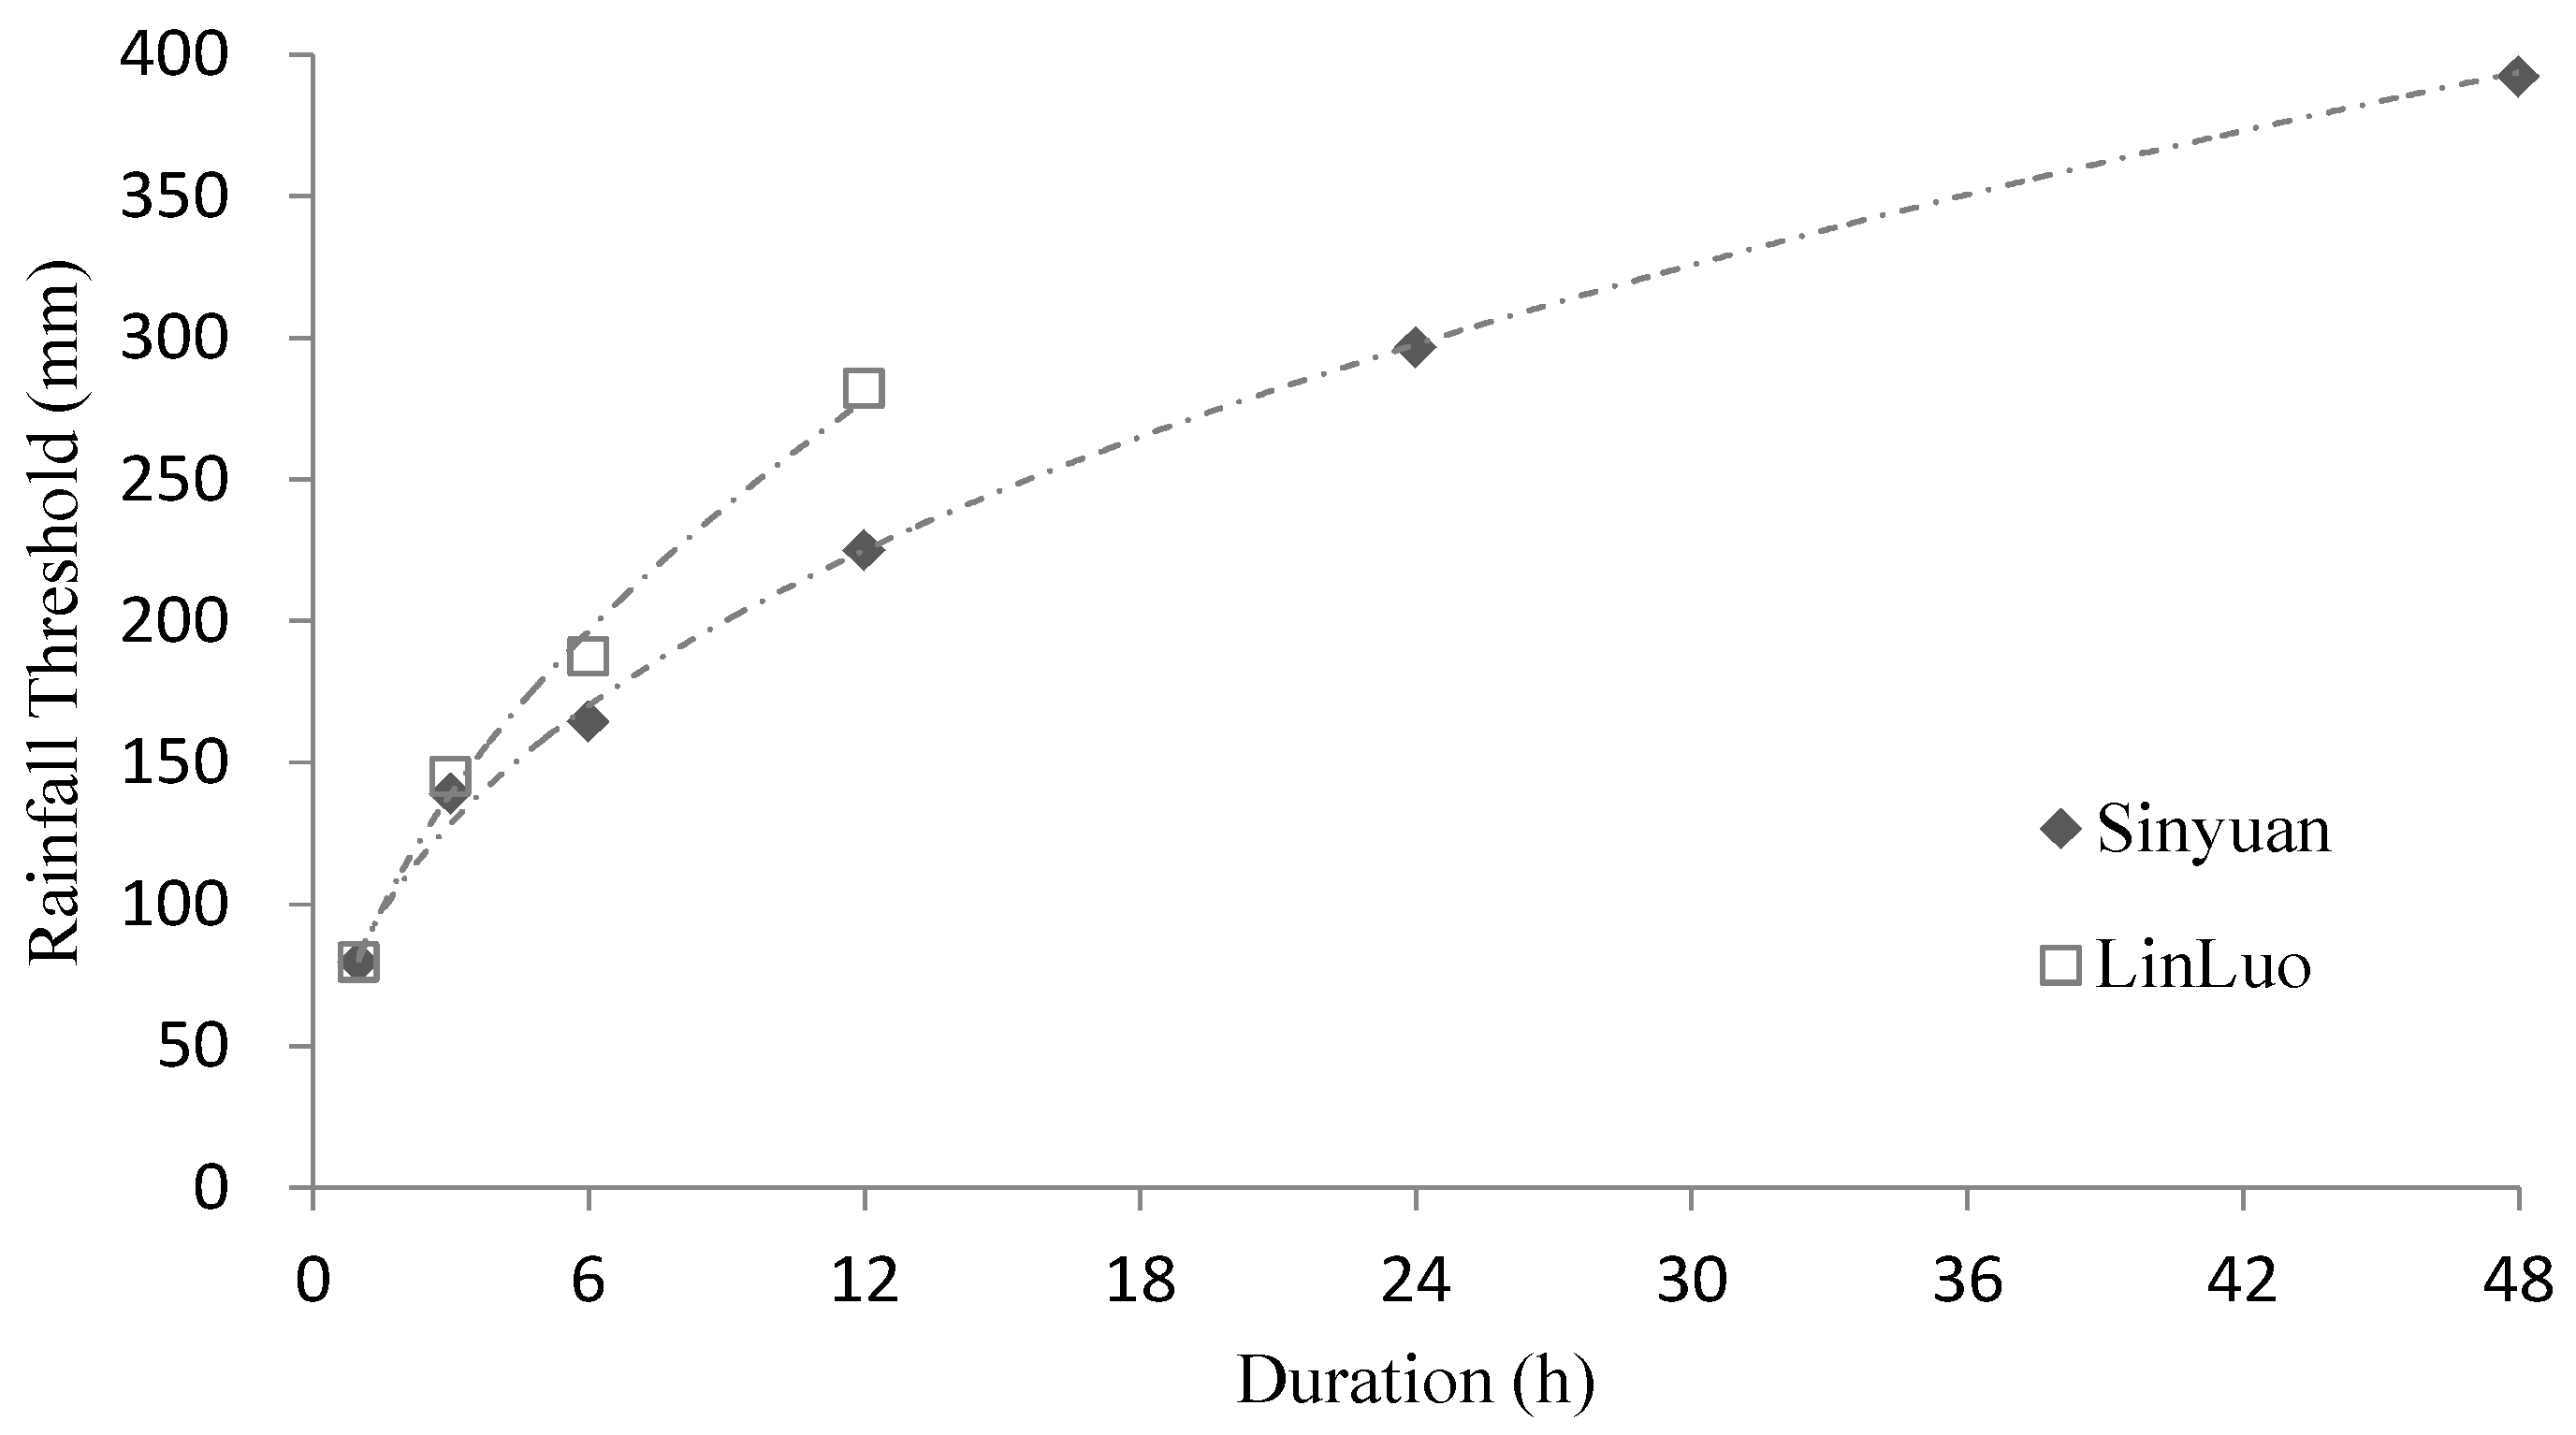
Figure 5a,b shows the updating process of by cross-comparing the flood status with the rainfall records at the pair-up rain gauges for Sinyuan and Linluo Towships, located downstream and upstream, respectively. For Sinyuan Township, the rainfall thresholds are under 1-, 3-, 6-, 12-, 24-, and 48-h durations as . Figure 5a indicates an obvious lowering of rainfall thresholds during Rainstorm 0609 in 2006, probably due to the underestimation of inundation depth under uniform rainfall input. According to field investigations, the lift of rainfall thresholds after Rainstorm 0610 in 2012 is actually attributed to the expansion of pump systems that greatly reduce the number of flood situations. For Linluo Township, the rainfall thresholds are under 1-, 3-, 6-, 12-h durations as . Figure 5b shows that the rainfall thresholds increase between 2005 and 2006 when encountering large rainfalls without flood occurrence. This indicates that the upstream township is more flood resistive than the model estimation, probably attributed to the lower population or economy density that is not incorporated in the current mechanism. After 2007, the rainfall thresholds (especially for shorter durations) roughly remain steady despite the drops of 6- and 12-h thresholds during Kalmaegi in 2008. The upstream and downstream cases both indicate the necessity of revising rainfall thresholds according to variable local conditions, and Equation (1) is effective in recording the long-term aspects of previous events (while the thresholds are invariant) and adjusting the thresholds for the next event (while incorrect warnings are issued). Figure 6 shows the comparison of the relationship between rainfall durations and thresholds for Sinyuan and Linluo Townships updated at the last event. One can see that Sinyuan Township possesses smaller rainfall thresholds due to the lower coastal landform, and the threshold values in both cases gradually level off as duration increases.
Figure 5.
Updating process of rainfall thresholds for (a) Sinyuan and (b) Linluo Townships.

Figure 6.
Relationship between rainfall durations and thresholds for Sinyuan and Donggang Townships.
Figure 6.
Relationship between rainfall durations and thresholds for Sinyuan and Donggang Townships.
2.4. Warning Level
During a rainfall event, flood warning is a dynamic process updated frequently with rainfall information. In fact, flooding caused by the exceeding of short- and long-duration rainfall thresholds behaves differently in terms of emergency and severity. As the rainfall thresholds in this study are defined as the rainfall amounts required for generating 50 cm of water depth, the warning levels are classified based on the rise velocity of water depth, which is proportional to the water transport velocity as well. When the drainage thresholds are exceeded, the rainfall is actually too intense to be drained into sewer systems in a timely fashion, which causes a rapid rise in water depth. However, this kind of flooding can also retreat very quickly once the rainfall intensity drops and drainage regains its efficiency. On the other hand, if the runoff rainfall thresholds are exceeded without the exceeding of drainage thresholds, flooding is mainly caused by a long period of low-intensity rainfall that generates runoff gradually filling up ditches, pipes, culverts, and sewers. At this stage, the rise and retreat of flood water is a relatively mild and prolonged process for better monitoring and preparation. From the view point of emergency response, flash floods are more dangerous because people have less time for preparation and evacuation. Considering the extreme conditions, there is a chance for drainage and runoff thresholds to be simultaneously exceeded close to the peaks of precipitation; in this case, flooding will not only occur quickly but also last for a long time.
In accordance with the combinations of exceeded rainfall thresholds as summarized in Table 2, flood warnings can be classified in four levels distinguished by green, yellow, orange, and red lights in an ascending order of priority. Green lights stand for safety with no thresholds being exceeded; yellow lights stand for mild flood warning with only runoff thresholds being exceeded; orange lights stand for flash flood warning with only drainage thresholds being exceeded; red lights stand for severe flood warning with both drainage and runoff thresholds being exceeded. As the warning levels are classified only from distinguishing long- and short-duration thresholds, they can be conveniently incorporated into existing systems in which multiple rainfall thresholds are already in place.
| Drainage Threshold | Runoff Threshold | |
|---|---|---|
| None | 12-h/24-h/48-h/72-h | |
| None | Green | Yellow |
| 1-h/3-h/6-h | Orange | Red |
3. Warning Performance
To verify the proposed methodology, the warning performance in predicting flood occurrence and timing at the township level is examined, respectively. First, indicators are defined to quantify the percentage of the 252 townships that are correctly alarmed for the 22 events in Table 1. Second, five events after 2009 out of the 22 cases are especially selected to display the warning time series at given townships in order to discover the timing of flood occurrences and retreat.
3.1. Flood Occurrence Prediction
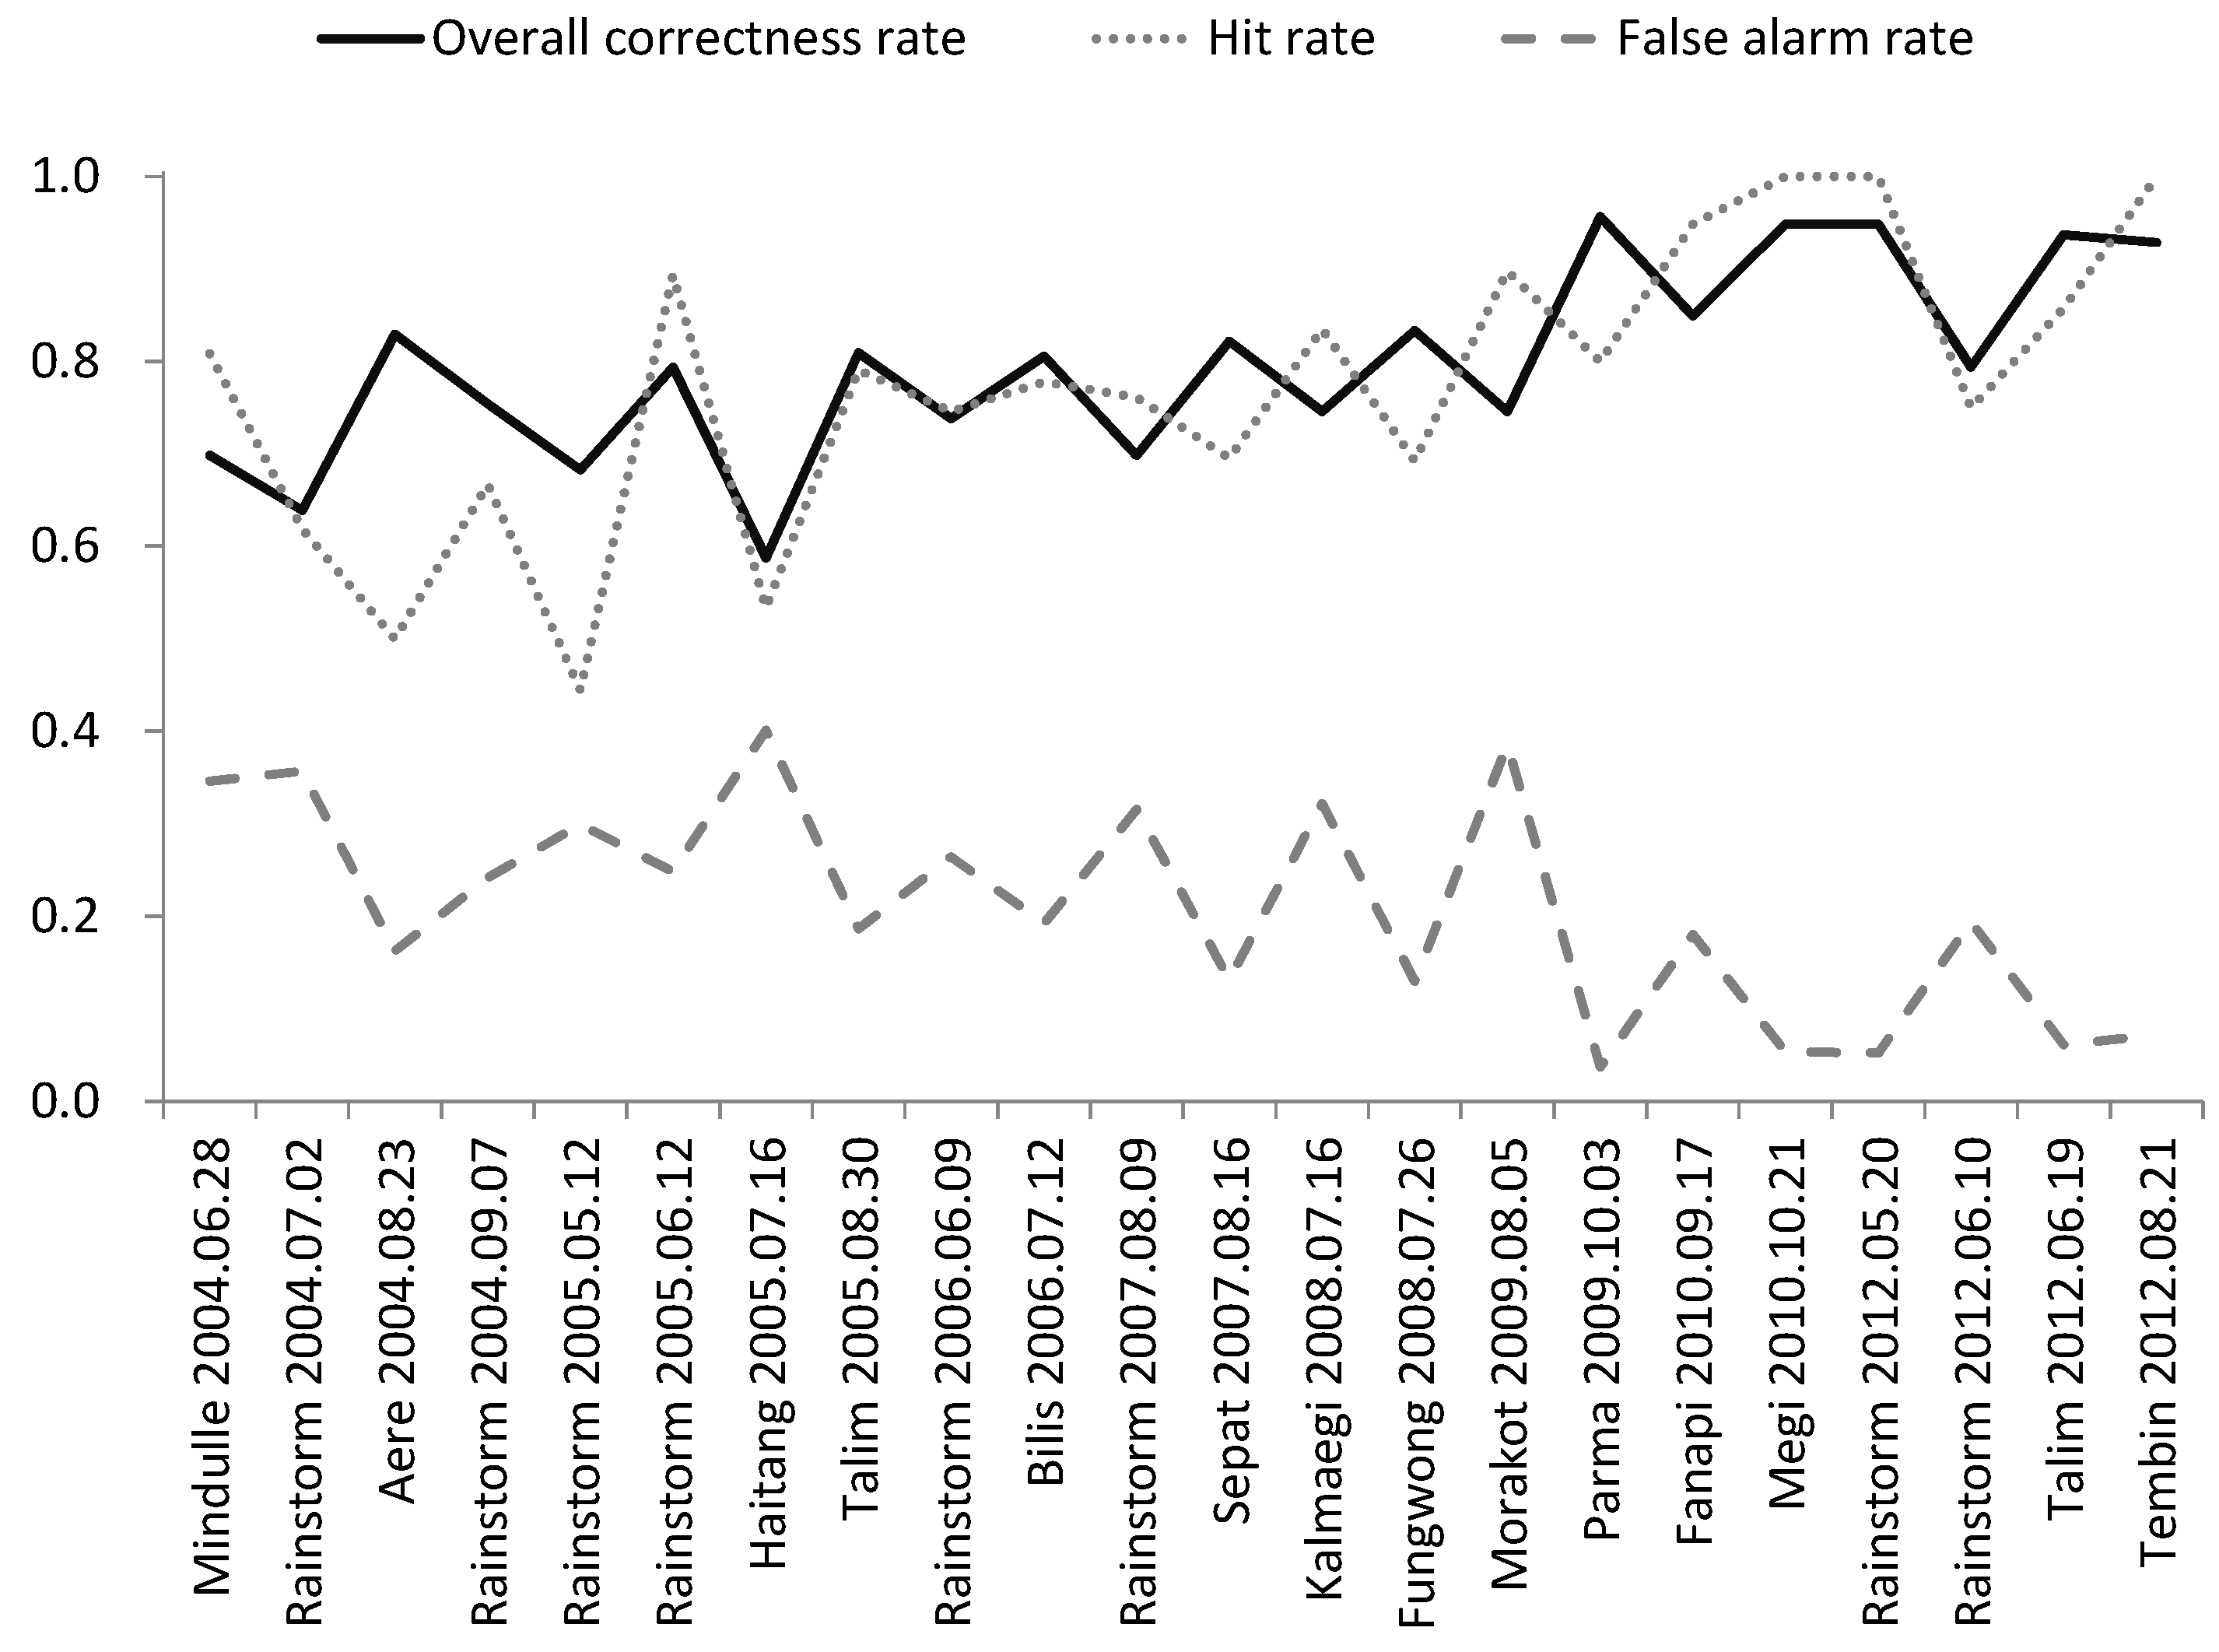
According to the contingency table proposed by Mason [54], the performance for flood warning can be estimated by the following indicators:
where h denotes “hits”, representing the number of townships that are flooded and warned; m denotes “missed alarms”, representing the number of townships that are flooded but unwarned; f denotes “false alarms”, representing the number of townships that are not flooded but warned; c denotes “correct rejections”, representing the number of townships that are not flooded and are unwarned.
Listed in Table 3 and displayed in Figure 7 are the variations of the performance indicators for the 22 cases by comparing the thresholds corrected on the basis of event to the occurrence of flooding for event n. Generally, the warning performance improves in time, while the overall correctness rate rises from 0.6–0.9 and the hit rate more and more surpasses the false alarm rate in the process. The hit rate fluctuates greatly at the beginning, indicating the period that the rainfall thresholds given by the inundation model have been adjusted according to actual field conditions. However, the process was not long underway before the hit rate showed a steady climb after 2006, demonstrating that the stochastic analysis becomes more efficient on a deterministic ground.
| Event | Warning | No Warning | Hit Rate | False Alarm Rate | Overall Correctness Rate | ||
|---|---|---|---|---|---|---|---|
| Flood (h) | No Flood (f) | Flood (m) | No Flood (c) | ||||
| Typhoon Mindulle | 59 | 14 | 62 | 117 | 0.81 | 0.35 | 0.70 |
| Rainstorm 0702 | 26 | 16 | 75 | 135 | 0.62 | 0.36 | 0.64 |
| Typhoon Aere | 3 | 3 | 40 | 206 | 0.50 | 0.16 | 0.83 |
| Rainstorm 0907 | 8 | 4 | 58 | 182 | 0.67 | 0.24 | 0.75 |
| Rainstorm 0512 | 8 | 10 | 70 | 164 | 0.44 | 0.30 | 0.68 |
| Rainstorm 0612 | 67 | 8 | 44 | 133 | 0.89 | 0.25 | 0.79 |
| Typhoon Haitang | 24 | 21 | 83 | 124 | 0.53 | 0.40 | 0.59 |
| Typhoon Talim | 34 | 9 | 39 | 170 | 0.79 | 0.19 | 0.81 |
| Rainstorm 0609 | 44 | 15 | 51 | 142 | 0.75 | 0.26 | 0.74 |
| Typhoon Bilis | 14 | 4 | 45 | 189 | 0.78 | 0.19 | 0.81 |
| Rainstorm 0809 | 35 | 11 | 65 | 141 | 0.76 | 0.32 | 0.70 |
| Typhoon Sepat | 48 | 21 | 24 | 159 | 0.70 | 0.13 | 0.82 |
| Typhoon Kalmaegi | 91 | 18 | 46 | 97 | 0.83 | 0.32 | 0.75 |
| Typhoon Fungwong | 36 | 16 | 26 | 174 | 0.69 | 0.13 | 0.83 |
| Typhoon Morakot | 105 | 12 | 52 | 83 | 0.90 | 0.39 | 0.75 |
| Typhoon Parma | 8 | 2 | 9 | 233 | 0.80 | 0.04 | 0.96 |
| Typhoon Fanapi | 55 | 3 | 35 | 159 | 0.95 | 0.18 | 0.85 |
| Typhoon Megi | 8 | 0 | 13 | 231 | 1.00 | 0.05 | 0.95 |
| Rainstorm 0520 | 4 | 0 | 13 | 235 | 1.00 | 0.05 | 0.95 |
| Rainstorm 0610 | 42 | 14 | 38 | 158 | 0.75 | 0.19 | 0.79 |
| Typhoon Talim | 6 | 1 | 15 | 230 | 0.86 | 0.06 | 0.94 |
| Typhoon Tembin | 2 | 0 | 18 | 232 | 1.00 | 0.07 | 0.93 |
Figure 7.
Variation of warning performance with rainfall events.

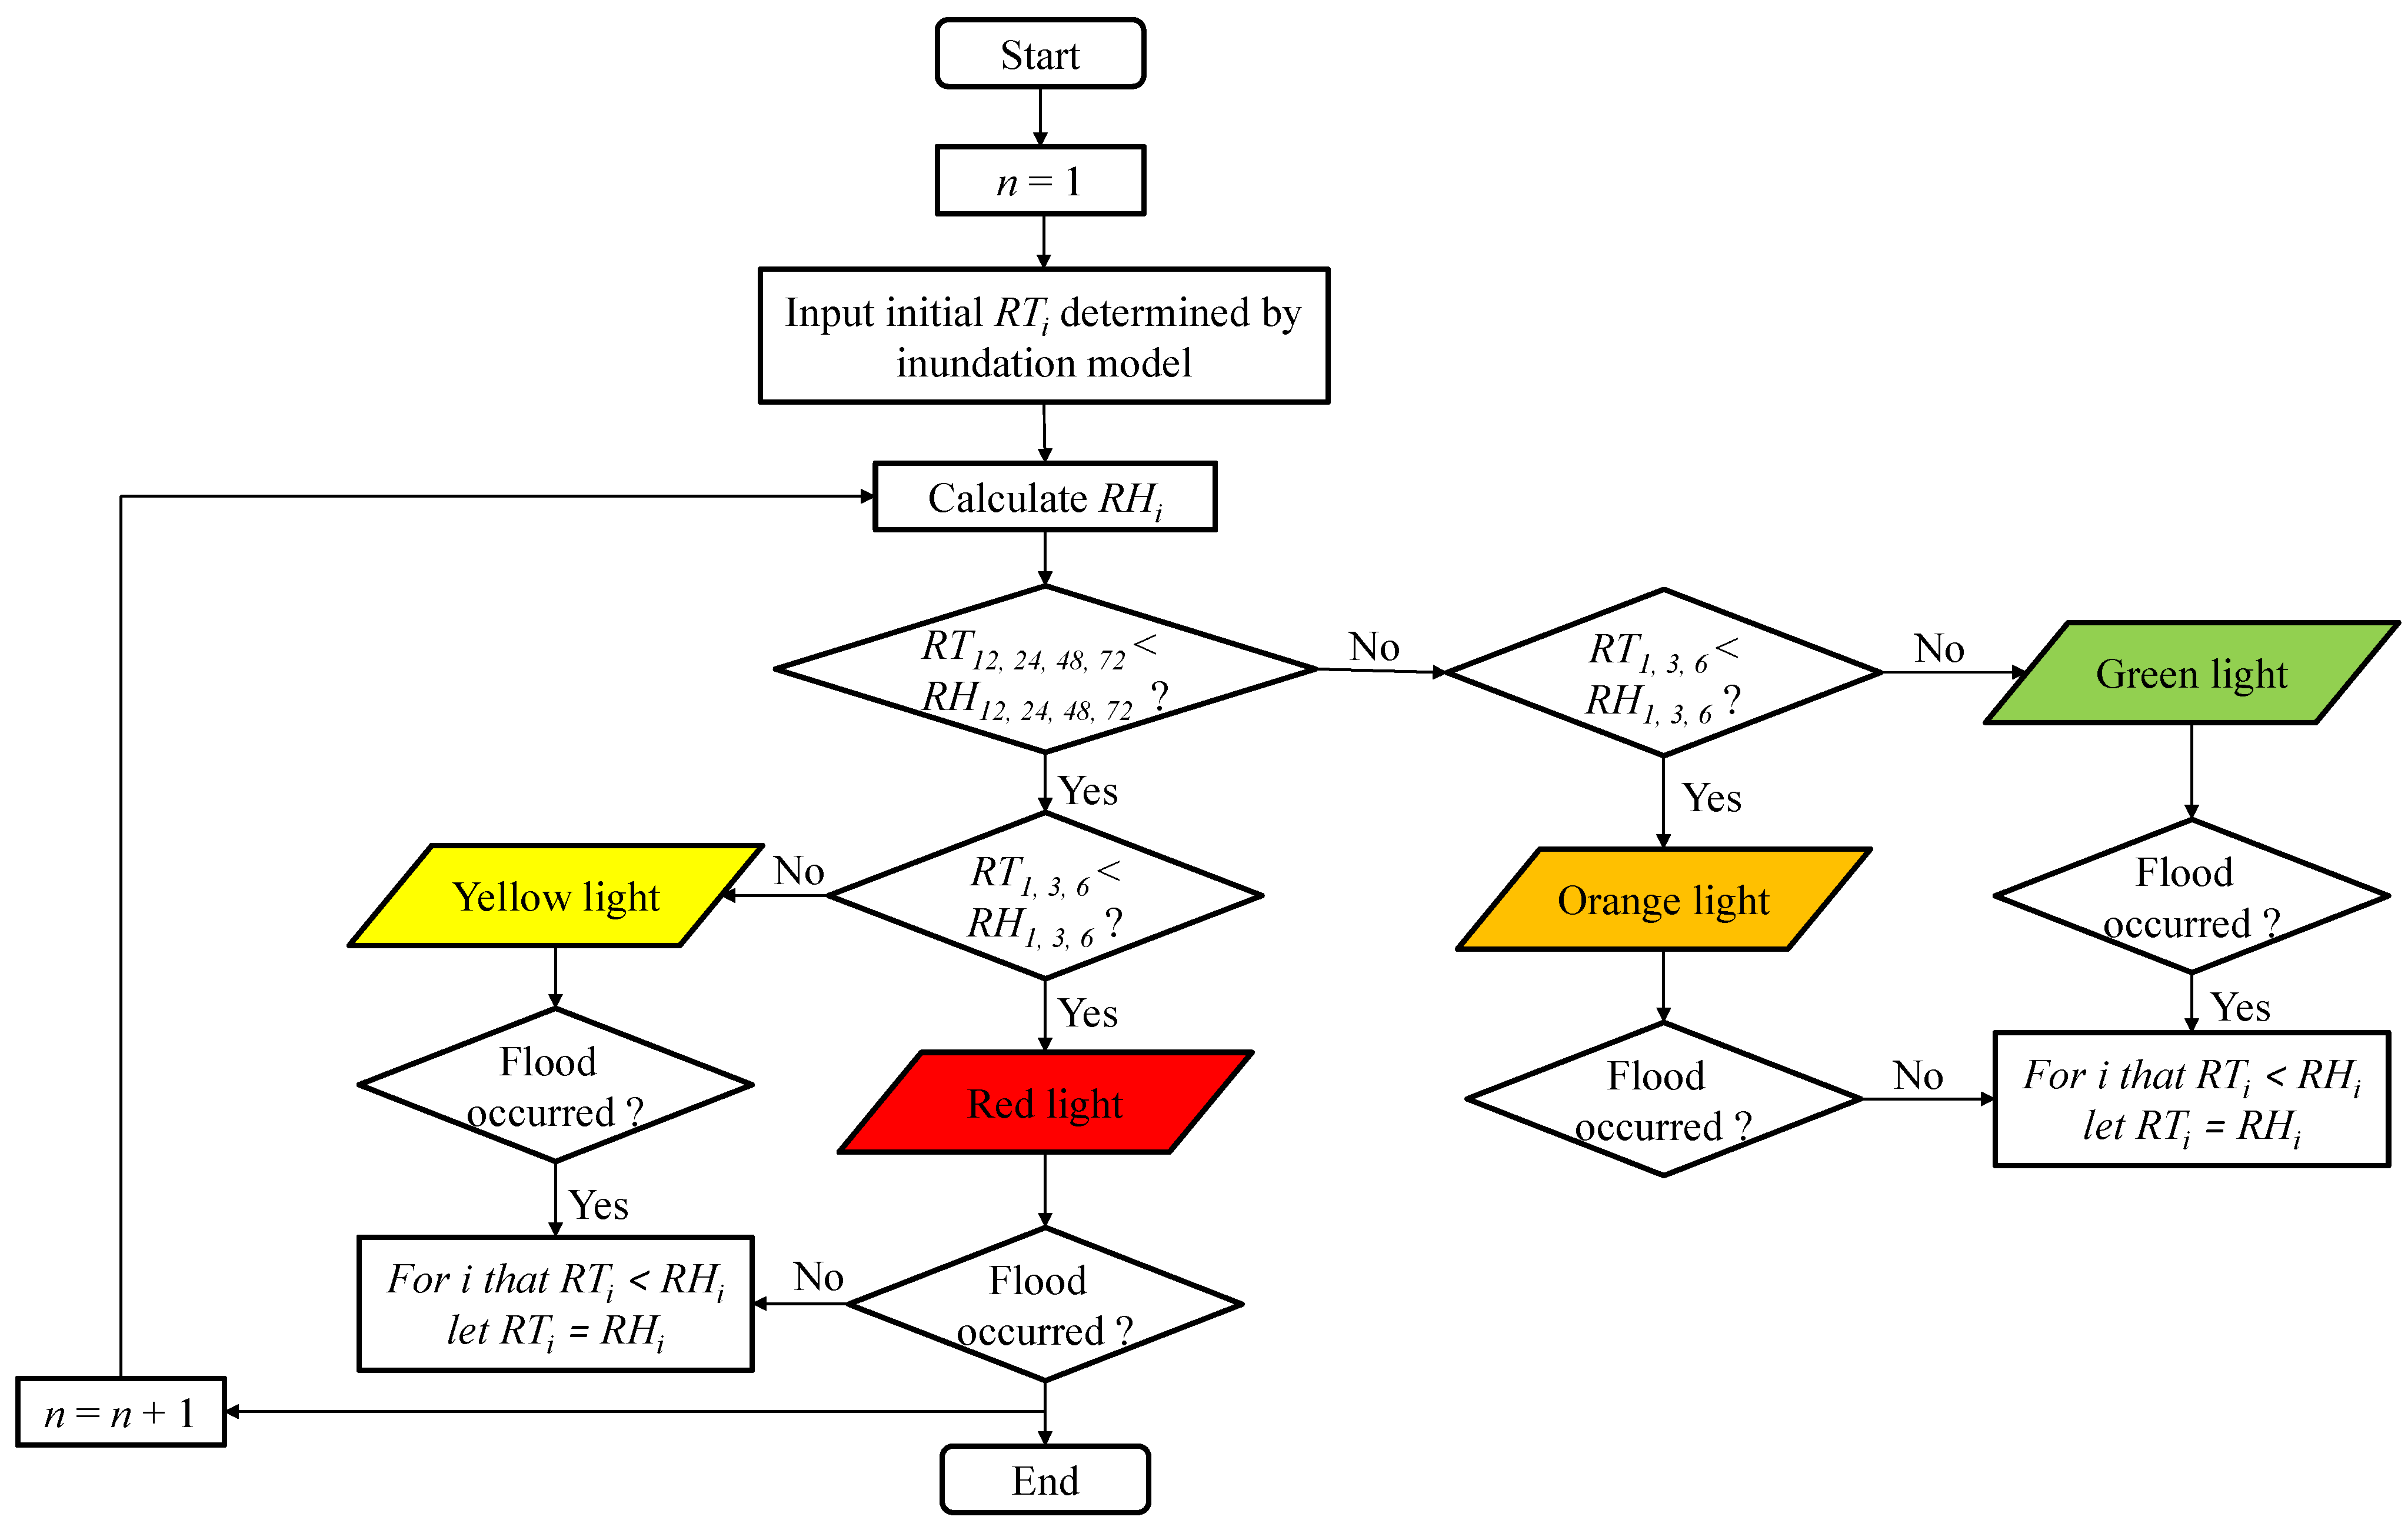
Figure 8 shows the workflow that details the procedure of updating and combining the rainfall thresholds with different durations to provide warnings for the 22 events. At the first event (), the values of rainfall thresholds with durations h determined by the inundation model are input. Second, the observed rainfalls are accumulated and compared with the thresholds under the seven durations to identify the ones being exceeded. If the exceeded thresholds have durations scatter in both the drainage ( h) and runoff ( h) groups, the red light will be given; if none of the exceeded thresholds has a duration ≥ 12 h, the orange light will be given; if none of the exceeded thresholds has a duration ≤6 h, the yellow light will be given. Otherwise, the light remains green. Third, according to Equation (1), will be updated as while experiencing a non-flood event with or a flood event with . For the sequential events, the procedures after the second step are repeated until .
Figure 8.
Workflow of updating and combing the rainfall thresholds to provide warnings.

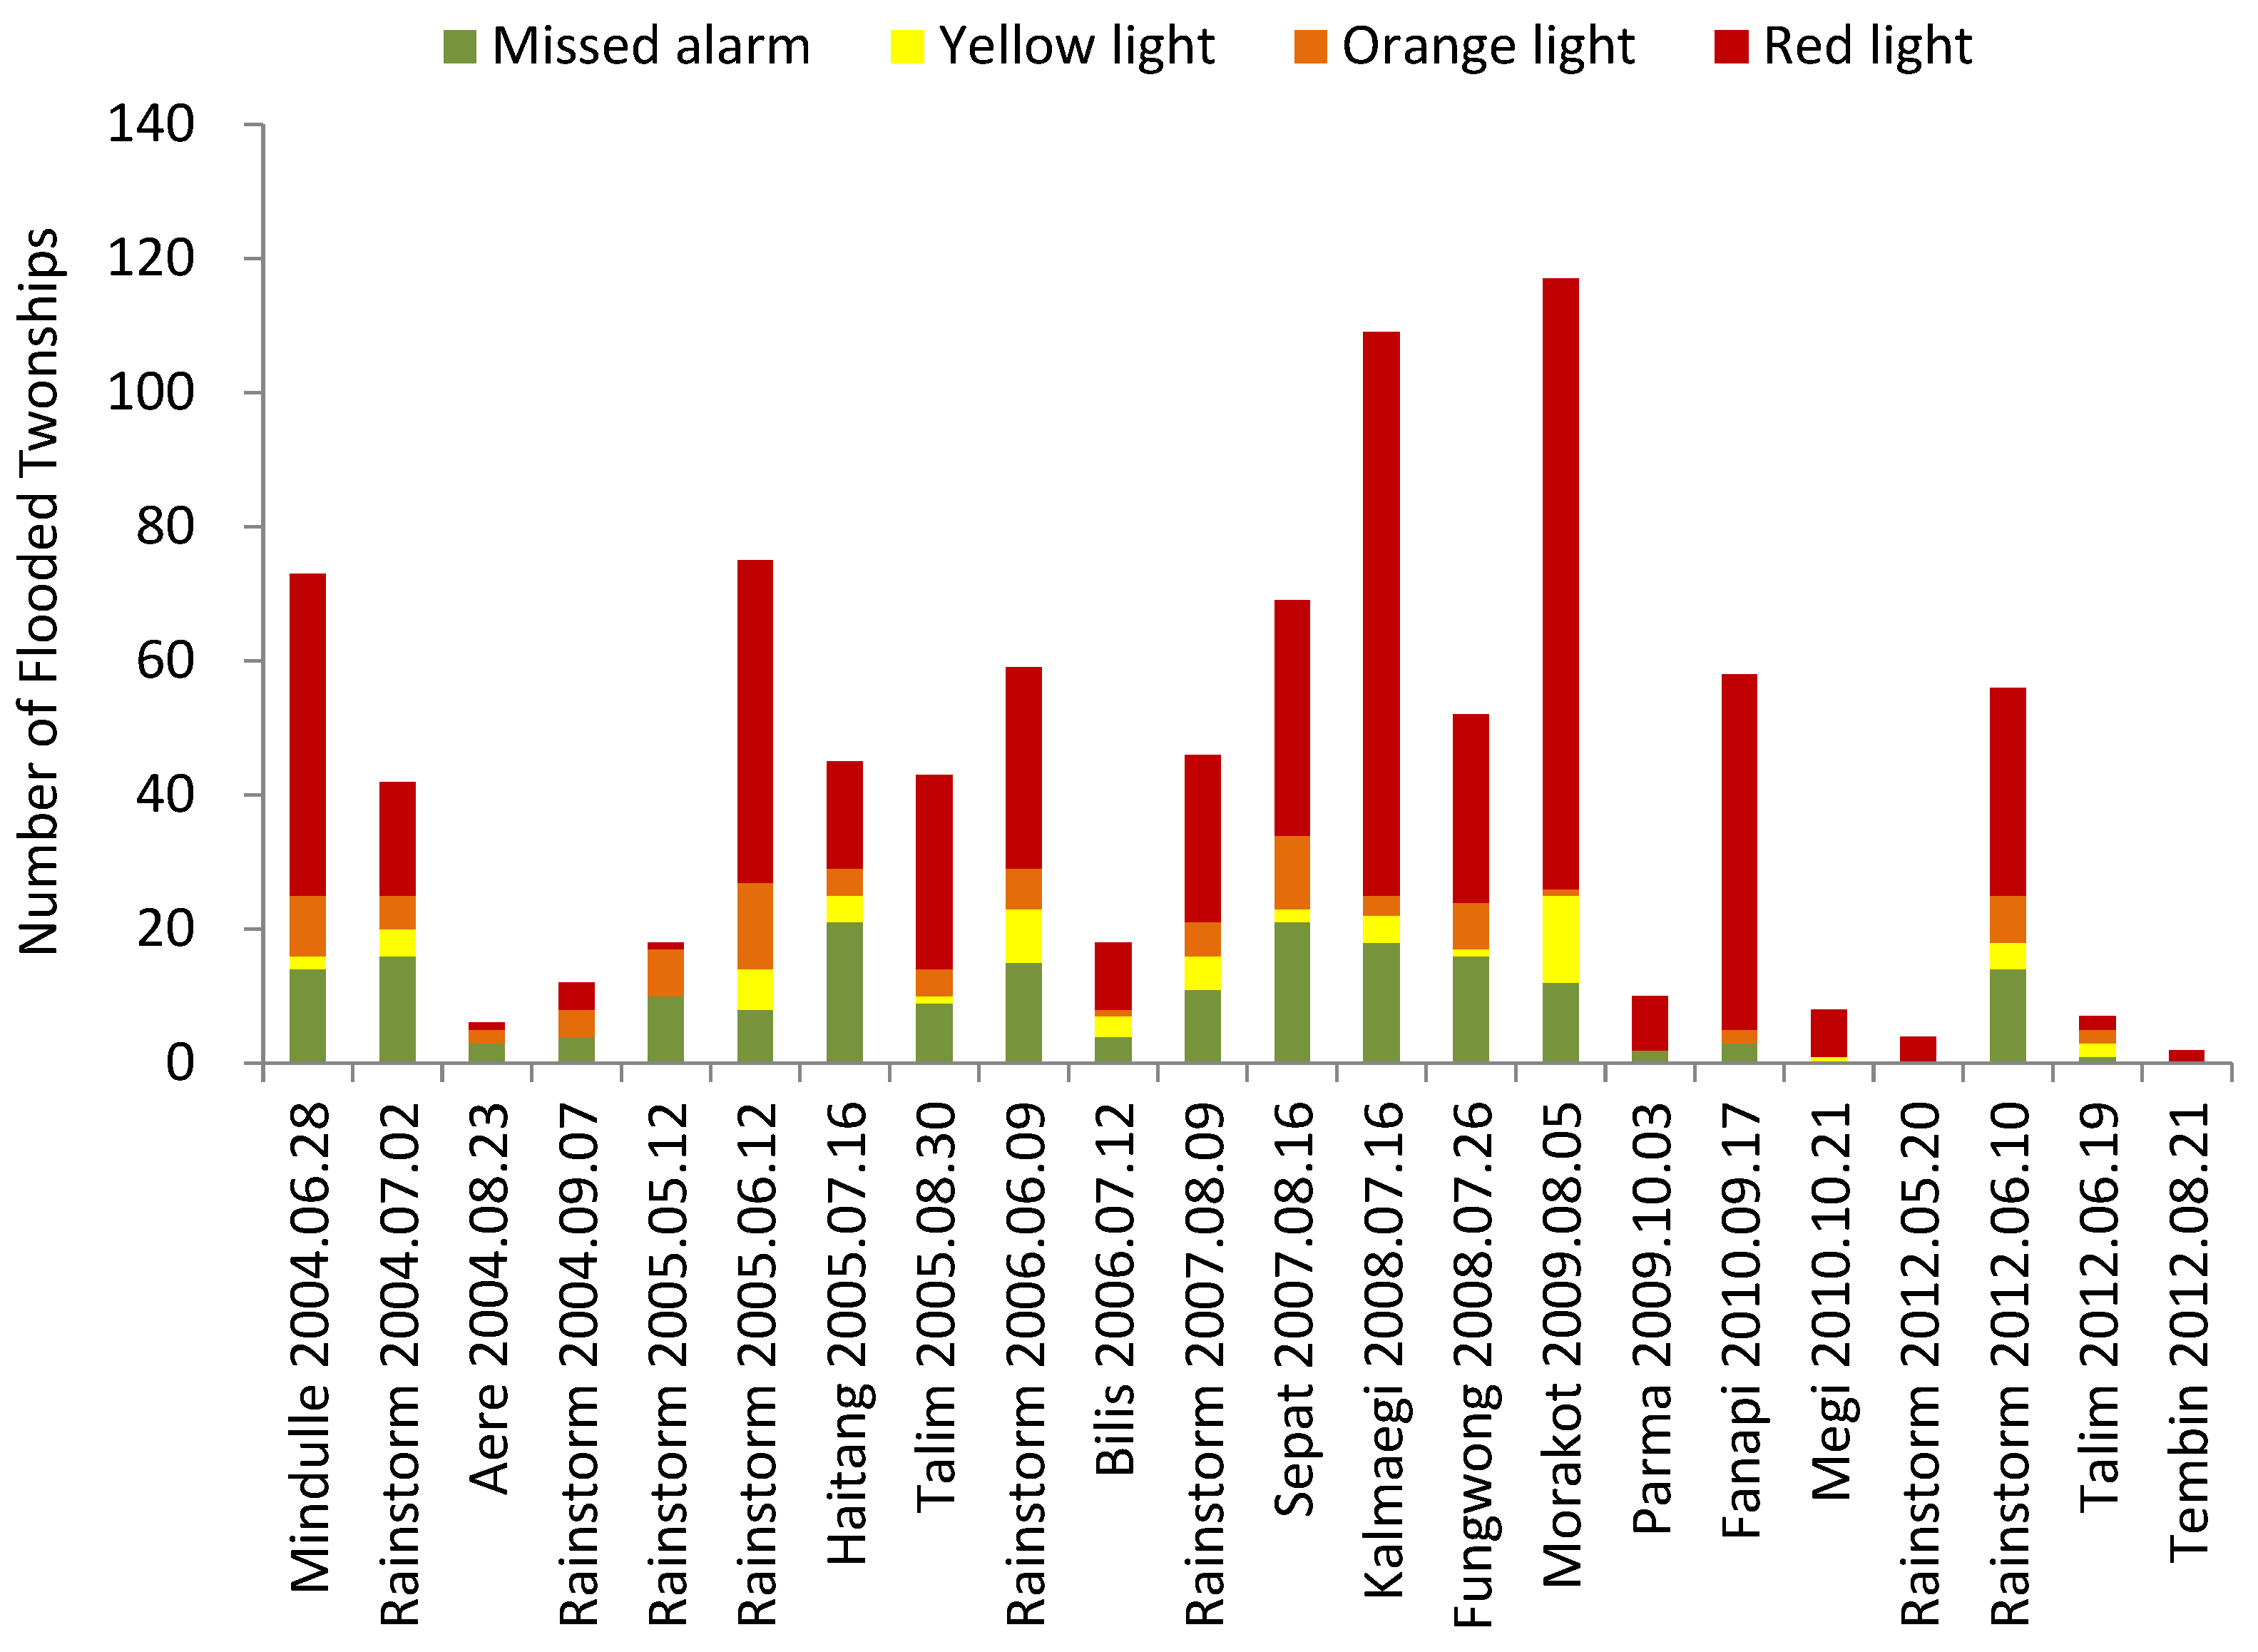
Figure 9 shows the highest level of warning lights ever given to the flooded townships during each rainfall event by the application of the presented method. It indicates that the number of miss-alarmed townships is small compared with the number of townships correctly-alarmed by red, orange, and yellow lights. It is a good sign to see that the low missed alarms do not come from over-warning since the false alarm rate remains low as well in Figure 7. In fact, the composition of warning lights can be regarded as a unique spectrogram that identifies individual event’s flooding characteristics. For events with orange lights more than yellow lights like Rainstorm 0612 and Typhoon Sepat, flash flooding would be the main concern in emergency operation. In the comparison between Morakot and Kalmaegi, Morakot possesses more yellow lights because of longer rainfall accumulation and more runoff-induced flooding despite the similar number of flooded townships. We emphasize once more that Figure 9 shows only the highest warning level, and each township should experience other warning lights during each event at different stages in the warning time series.
Figure 9.
The highest level of warning lights ever given to the flooded townships during historical rainfall events.
Figure 9.
The highest level of warning lights ever given to the flooded townships during historical rainfall events.

3.2. Warning Time Series
In order to take a closer look at the transformation of warning lights, five cases after 2009 out of the 22 events are selected to demonstrate the warning time series at five different townships as displayed in Figure 10a–e, respectively. The backgrounds of the five special cases are listed in Table 4. The five events are chosen for the tremendous amount of rainfall and the five townships are selected for having relatively detailed records on the timing of flood occurrence or retreat. However, compared with the dichotomous data (flood or non-flood), field data on the exact timing of flood evolution is relatively scarce in Taiwan. More research can now be carried out as the shortage of temporal data is being gradually addressed by modern monitoring technologies.
| Event | Time Window | Township | ||
|---|---|---|---|---|
| Name | Area (km2) | Accumulated Rainfall (mm) | ||
| Typhoon Morakot | 08.05–08.10, 2009 | Puzi | 50 | 562 |
| Typhoon Fanapi | 09.17–09.20, 2010 | Meinong | 120 | 479 |
| Typhoon Megi | 10.21–10.23, 2010 | Suao | 89 | 1452 |
| Rainstorm 0520 | 05.20–05.22, 2012 | Rende | 51 | 312 |
| Rainstorm 0610 | 06.10–06.14, 2012 | Jongli | 77 | 465 |
Since for all the five townships, the accumulated rainfall hyetographs are compared with rainfall thresholds for 1-, 3-, 6-, and 12-h durations, and the consequent warning lights are shown below the x-axes. Figure 10a shows the warning time series for Typhoon Morakot in 2009 at Puzi Township of Chiayi County. Morakot is one of the most deadly typhoons in Taiwan’s history, which caused hundreds of death and extensive loss due to long and extensive rainfall covering the whole island. One can see that there are three hours of yellow lights before the first red light at 09:00 on 9 August. As yellow lights usually appear when runoff thresholds (e.g., in this case) are exceeded by long-duration rainfall accumulations, they can be either a vanguard for upcoming red lights or a signal for rainfall retreat depending on the location relative to rainfall peaks. When the yellows lights appear before red lights, it actually indicates an initial hydrological condition in which retention space is being slowly occupied by floodwater accumulations. At this stage, any sudden increase of rainfall intensity can trigger severe flooding which will be alarmed by red lights to signify the need for immediate rescue. During the yellow lights, people should take flood defense measures and prepare for evacuation in case the situation gets worse. Though not being officially recorded, the exact timing of flood occurrence is presumed to be slightly before 12:00 on 9 August according to local news, which exactly falls within the period of red lights.
Shown in Figure 10b is the warning time series for Typhoon Fanapi in 2010 at Meinong Township of Kaohsiung City. The warning lights turn red from green at 19:00 on 19 September, when , and are simultaneously exceeded. This triple jump of warning level is not only triggered by the heavy rainfall starting at 18:00, but also caused by the rainfall accumulated between 09:00 and 16:00. According to field investigation, the timing of flood occurrence is correctly predicted by the first red light as shown in the figure. A similar phenomenon can be found from the warning time series for Typhoon Megi in 2010 at Suao Township shown in Figure 10c, in which the warning lights turn red from green at 12:00 on 21 October, one hour before flood occurrence. The red lights last for 12 h with record-breaking rainfall intensity larger than 100 mm/h lasting for 4 h and 24 h with accumulated rainfall amounting up to 100 mm. In both cases, one may notice that the orange lights appear prior to the red lights and shortly following the green ones, which can be seen as a signal for preventive evacuation in anticipation of another wave of heavy rainfall.
Figure 10d shows the warning time series for Rainstorm 0520 in 2012 at Rende Township of Tainan City. The warning lights turn orange at 05:00 on 20 May as hourly rainfall exceeds the 1-h threshold, and then soon turn red the following hour as 3-, 6-, and 12-h accumulated rainfalls all exceed corresponding thresholds. The orange light may last for only one hour, but it suggests imminent severe flooding and the need for evacuation. A complete cycle of warning light progression can be found in Figure 10e for Rainstorm 0610 in 2012 at Jongli Township of Taoyuan County. It describes how the warning levels rise from green, orange, to red lights, and then, fall back to yellow, then green lights in sequence. The orange light is issued at 23:00 on 11 June, indicating an emergent flood warning due to the high intensity of rainfall; three hours later, continuous rainfall turns the warning lights red for 7 h before they turn yellow. Figure 10d,e shows that the methodology is not only effective in predicting flood occurrence with the second red light, but is also efficient in avoiding over-warning, because investigations showed that the flood retreated just when the last red lights appeared.
Figure 10.
Warning time series for (a) Typhoon Morakot at Puzi Township; (b) Typhoon Fanipi at Meinong Township; (c) Typhoon Megi at Suao Township; (d) Rainstorm 0520 at Rende Township; (e) Rainstorm 0610 at Jongli Township ( denotes accumulated rainfall and denotes rainfall threshold with i h of duration).

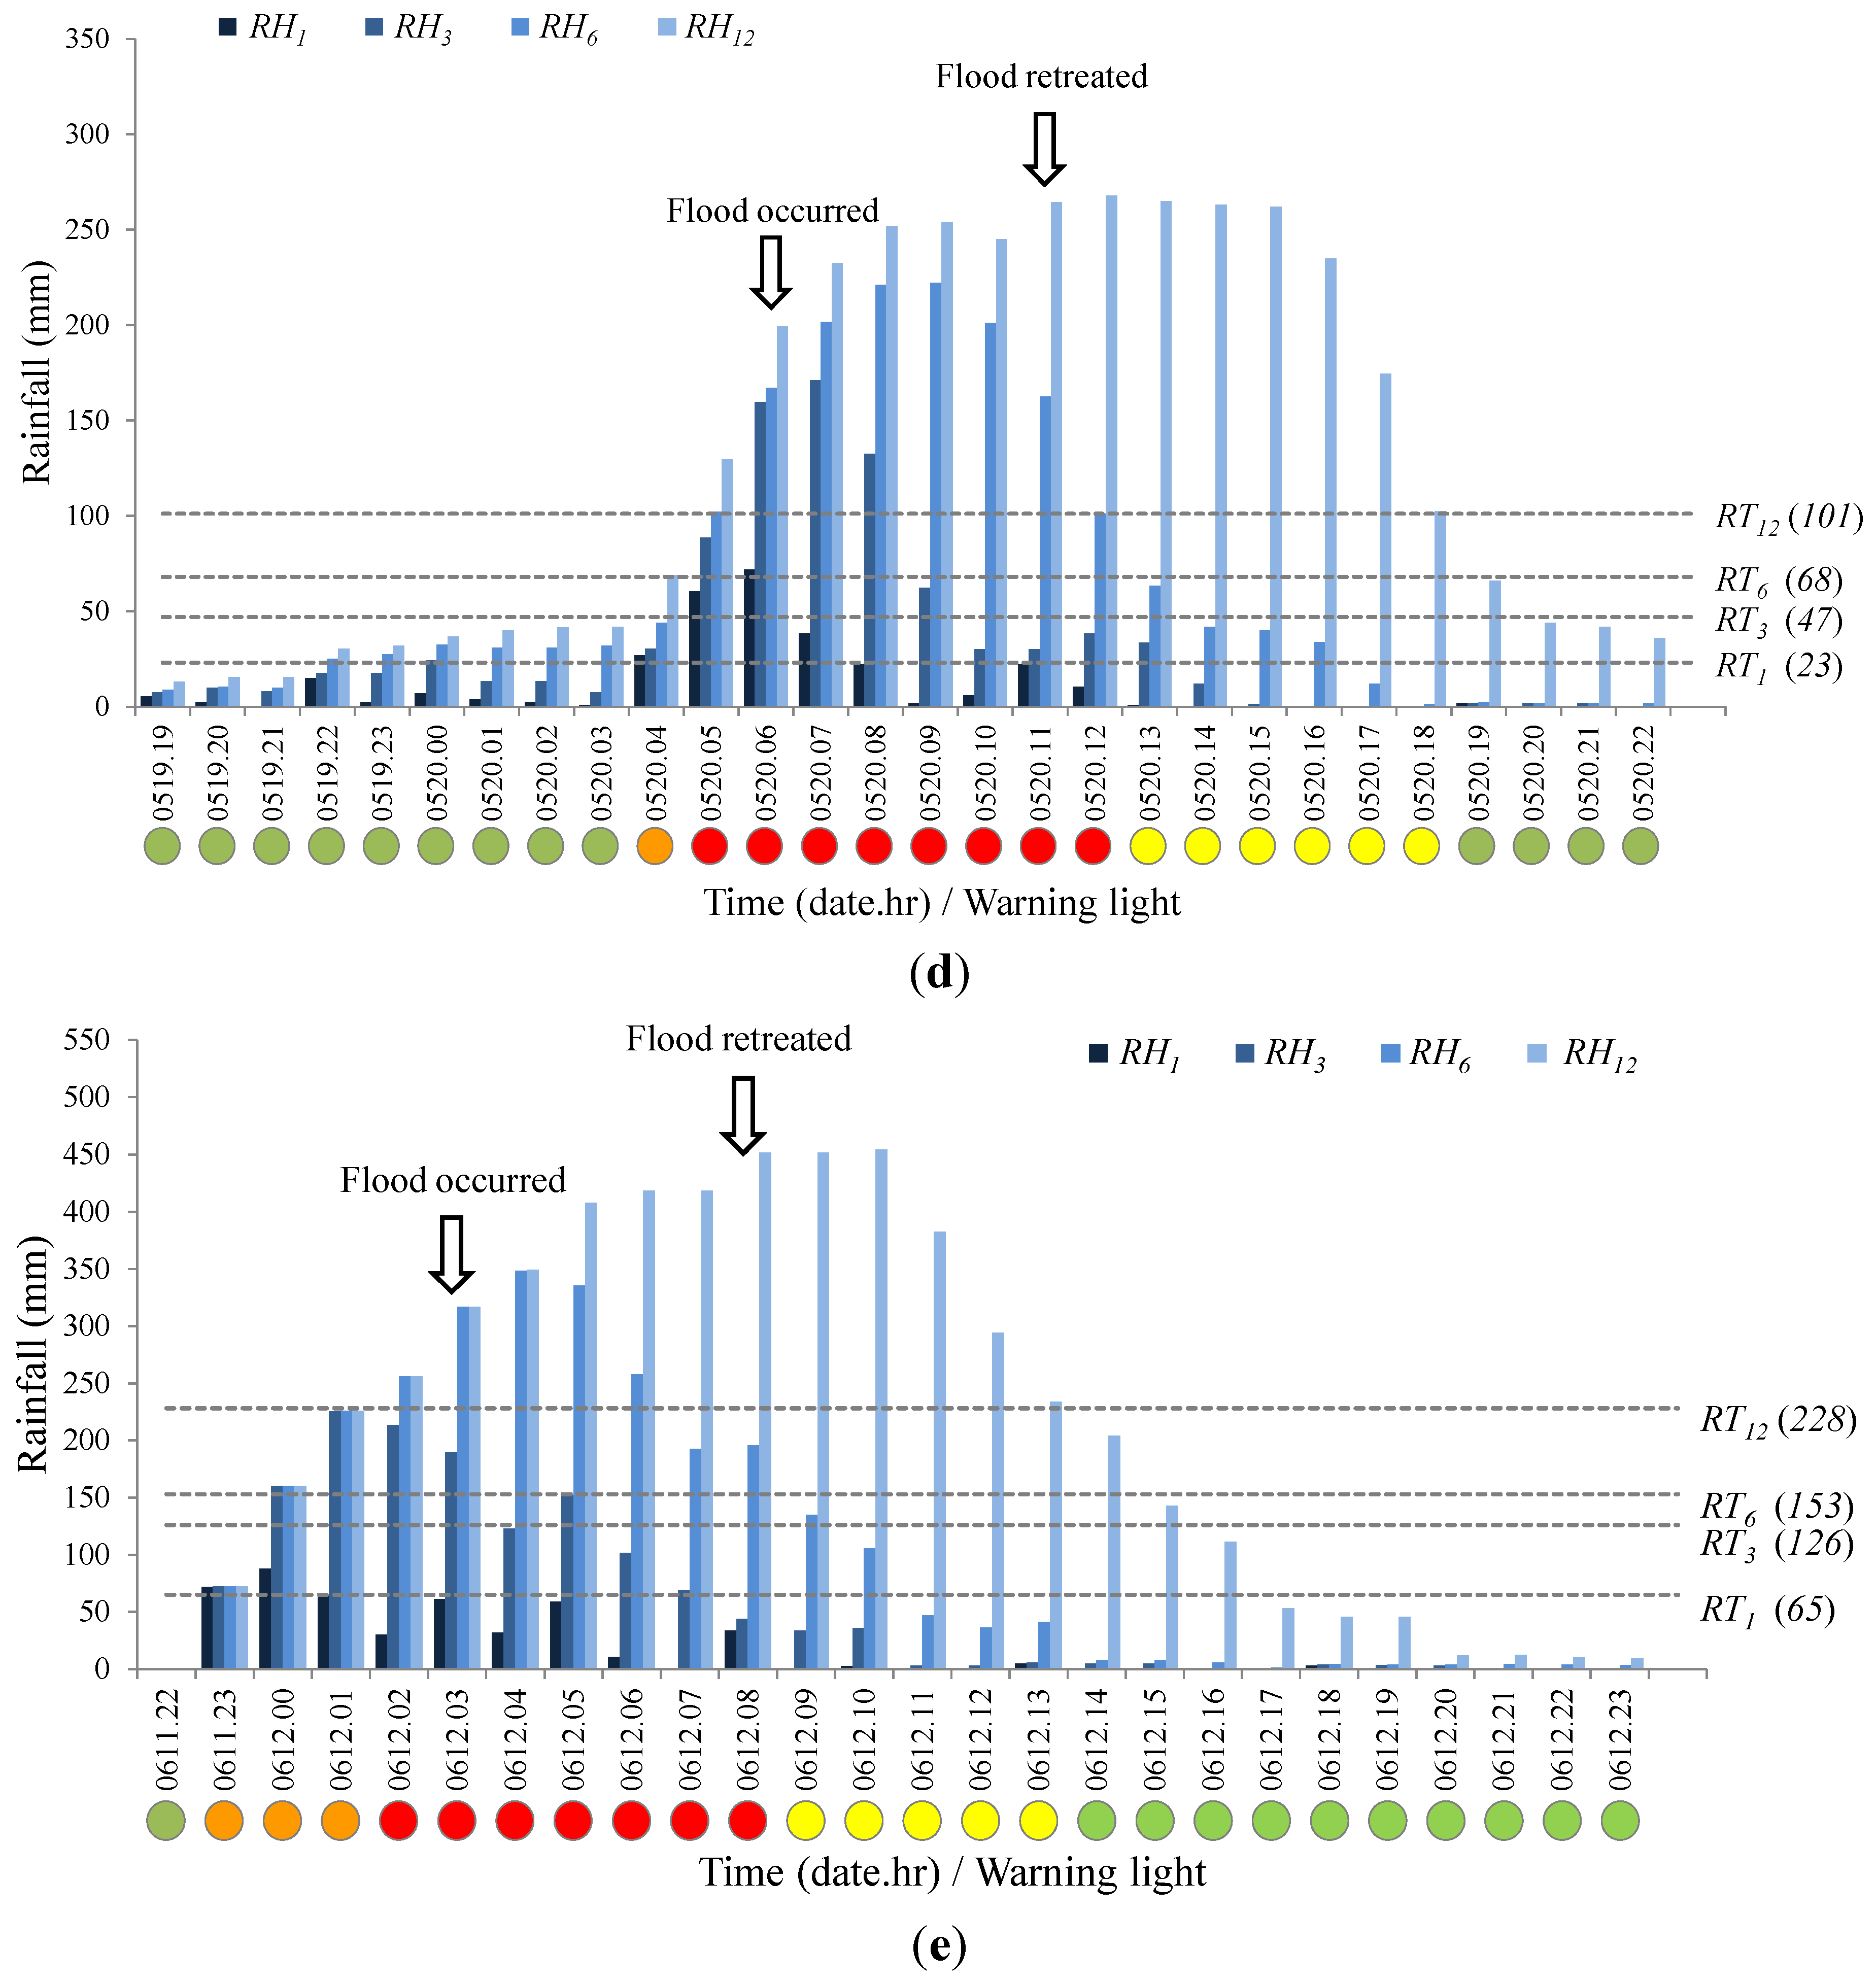
Table 5 summarizes the scenarios and measures required for the four warning lights. From green, yellow, orange, to red lights, the warning strengthens with the level of severity and emergency which requires various response measures, from standby, flood defense, evacuation, to rescue, respectively. Either for progressive typhoons or sudden rainstorms, case studies show that the transformation of warning lights is very rhythmic and logical, which can greatly reduce the confusion in flood warning and operation. However, for cases with high-intensity rainfall, the triple jump of warning lights could lead to insufficient response time. This could be overcome by comparing rainfall thresholds with high-resolution precipitation forecasts given by QPF (Quantitative Precipitation Forecasting) or WRF (Weather Research and Forecasting) in order to deliver warning messages before rainfall [55]. Applications in this regard have proven useful in improving preparedness at an earlier stage in order for decision-makers to take prompt action [56,57].
| Light | Scenario | Measure |
|---|---|---|
| Red | Severe flooding warning | Rescue |
| Orange | Flash flood warning | Evacuation |
| Yellow | Mild flood warning | Flood defense |
| Green | Safety | Standby |
4. Conclusions
Issuing warning information to the public when rainfall exceeds given thresholds is a simple and widely-used method for flood prevention. However, the threshold method is a criterion model by which warning levels are less gradable in terms of emergency and severity. In this study, an advanced methodology is proposed to include the diversity of rainfall threshold durations from physical viewpoints that help improve the warning sophistication for 252 urbanized townships in Taiwan. An inundation model and a total of 22 historical rainfall events between 2004 and 2012 are adopted for validating the proposed methodology.
Based on the rainfall durations, rainfall thresholds are divided into “drainage” and “runoff” thresholds. The drainage thresholds have shorter durations because they are affected by draining efficiency within a short period of time, while the runoff thresholds having longer durations are used to evaluate the level of rainfall accumulation needed to generate disastrous runoff. In accordance with the combination of drainage and runoff thresholds, flood warnings are classified into four levels distinguished by green, yellow, orange, and red lights. Green lights stand for “safety” with no thresholds being exceeded; yellow lights stand for “mild flood warning” with only runoff thresholds being exceeded; orange lights stand for “flash flood warning” with only drainage thresholds being exceeded; red lights stand for “severe flood warning” with both drainage and runoff thresholds being exceeded.
At the township level, the rainfall thresholds are initially determined by the inundation model and then adjusted stochastically by the 22 events with the maximum duration limited by the concentration time. In the process, the warning performance improves as the overall accuracy rate rises from 0.6 to 0.9 and the hit rate increasingly surpasses the false alarm rate. Five events after 2009 with more field data are especially selected to discuss the time series of flooding and warning at specific townships. In general, the warning time series is very rhythmic and logical while the red lights correctly predict the timing of flood occurrences; the orange lights appear before red lights to warn of imminent flooding; and the yellow lights appear after red lights to indicate flood retreat. According to the level of severity and emergency, green, yellow, orange and red lights require various response measures, from standby, flood defense, evacuation to rescue, respectively.
The classification of rainfall thresholds suggested in this study is very simple and can be quickly adopted to advance traditional rainfall threshold methods, especially for urban areas well protected from major river overflow by dike systems as in Taiwan. If the threat of river flooding cannot be neglected when encountering extreme rainfall or dike deficiency, the proposed method should be integrated with the theory accounting for critical discharges at specific river sections (e.g., FFG; [17]). The methodology for systematically combing these two methods can be established in future research. Moreover, the warning levels classified in the study can be further combined with exposure layers to evaluate the social impacts of flooding in future applications [58]. Finally, the application of rainfall forecasts in the rainfall threshold method is a crucial topic to increase warning lead time that requires further studies on quantifying and reducing the uncertainties in the process.
Acknowledgments
The authors would like to express their sincere gratitude to the National Science and Technology Center for Disaster Reduction for the computer facilities and the Water Resource Agency for providing the field data.
Conflicts of Interest
The authors declare no conflict of interest.
References
- Arnell, N.W.; Reynard, N.S. The effect of climate change due to global warming on river flow in Great Britain. J. Hydrol. 1996, 183, 397–424. [Google Scholar] [CrossRef]
- Pilling, C.G.; Jones, J.A.A. The impact of future climate change on seasonal discharge, hydrological processes and extreme flows in the Upper Wye experimental catchment, mid-Wales. Hydrol. Process. 2002, 16, 1201–1213. [Google Scholar] [CrossRef]
- Loukas, A.; Vasiliades, L.; Dalezios, N.R. Potential climate change impacts on flood producing mechanisms in Southern British Columbia, Canada using the CGCMA1 simulation results. J. Hydrol. 2002, 259, 163–188. [Google Scholar] [CrossRef]
- Jha, M.; Pan, Z.; Takle, E.S.; Gu, R. Impacts of climate change on streamflow in the Upper Mississippi river basin: A regional climate model perspective. J. Geophys. Res. 2004, 109, 1–12. [Google Scholar] [CrossRef]
- Simonovic, S.P.; Li, L. Methodology for assessment of climate change impacts on large-scale flood protection system. J. Water Res. Plan. ASCE 2003, 129, 361–372. [Google Scholar] [CrossRef]
- Zhu, T.; Lund, J.R.; Jenkins, M.W.; Marques, G.F.; Ritzema, R.S. Climate change, urbanization, and optimal long-term floodplain protection. Water Resour. Res. 2007, 43, 1–11. [Google Scholar] [CrossRef]
- Hsieh, L.S.; Jang, J.H.; Lui, W.C.; Tung, C.P. Runoff peak under climate change and associated flood management in Taiwan. J. Chin. Inst. Civil Hydraul. Eng. 2012, 24, 245–252. [Google Scholar]
- Barredo, J.I. Normalised flood losses in Europe: 1970–2006. Nat. Hazard. Earth Syst. 2009, 9, 97–104. [Google Scholar] [CrossRef]
- Teisberg, T.J.; Weiher, R.F. Background Paper on the Benefits and Costs of Early Warning Systems for Major Natural Hazards; World Bank: Washington, DC, USA, 2009. [Google Scholar]
- Rogers, D.; Tsirkunov, V. Global Assessment Report on Disaster Risk Reduction—Costs and Benefits of Early Warning Systems; United Nations: New York, NY, USA, 2011. [Google Scholar]
- Terminology Basic Terms of Disaster Risk Reduction; ISDR: Geneva, Switzerland, 2004; Available online: http://www.unisdr.org/2004/wcdr-dialogue/terminology.htm (accessed on 6 March 2015).
- Alfieri, L.; Salamaon, P.; Pappernberger, F.; Wetterhall, F.; Thielen, J. Operational early warning systems for water-related hazards in Europe. Environ. Sci. Policy 2012, 21, 35–49. [Google Scholar] [CrossRef]
- Carpenter, T.M.; Sperfslage, J.A.; Georgakakos, K.P.; Sweeney, T.; Fread, D.L. National threshold runoff estimation utilizing GIS in support of operational flash flood warning systems. J. Hydrol. 1999, 224, 21–44. [Google Scholar] [CrossRef]
- Priest, S.J.; Parker, D.J.; Hurford, A.P.; Walker, J.; Evans, K. Assessing options for the development of surface water flood warning in England and Wales. J. Environ. Manag. 2011, 92, 3038–3048. [Google Scholar] [CrossRef] [PubMed]
- Saeed, G.; Bahram, S.; Reza, M. Derivation of probabilistic thresholds of spatially distributed rainfall for flood forecasting. Water Resour. Manag. 2010, 24, 3547–3559. [Google Scholar] [CrossRef]
- Ntelekos, A.A.; Georgakakos, K.P.; Krajewski, W.F. On the uncertainties of flash flood guidance: Toward probabilistic forecasting of flash floods. J. Hydrometeorol. 2006, 7, 896–915. [Google Scholar] [CrossRef]
- Georgakakos, K.P. Analytical results for operational flash flood guidance. J. Hydrol. 2006, 317, 81–103. [Google Scholar] [CrossRef]
- Martina, M.L.V.; Todini, E.; Libralon, A. A Bayesian decision approach to rainfall thresholds based flood warning. Hydrol. Earth Syst. Sci. 2006, 10, 413–426. [Google Scholar] [CrossRef]
- Javelle, P.; Fouchier, C.; Arnaud, P.; Lavabre, J. Flash flood warning at ungauged locations using radar rainfall and antecedent soil moisture estimations. J. Hydrol. 2010, 394, 267–274. [Google Scholar] [CrossRef]
- Deshons, P. Prevision et suivi des crues urbaines. Experience de la ville de Marseille. Houilles Blanche 2002, 2, 56–59. (In France) [Google Scholar] [CrossRef]
- Mignot, E.; Paquier, A.; Haider, S. Modeling floods in a dense urban area using 2D shallow water equations. J. Hydrol. 2006, 327, 186–199. [Google Scholar] [CrossRef]
- Schuber, J.E.; Sanders, B.F. Building treatments for urban flood inundation models and implications for predictive skill and modeling efficiency. Adv. Water Resour. 2012, 41, 49–64. [Google Scholar] [CrossRef]
- Zhang, S.; Pan, B. An urban storm-inundation simulation method based on GIS. J. Hydrol. 2014, 517, 260–268. [Google Scholar] [CrossRef]
- FEMA, Before a Flood, 2012. Available online: http://m.fema.gov/before-flood (accessed on 6 March 2015).
- Environment Agency, Flood Warnings Summary. Available online: http://apps.environment-agency.gov.uk/flood/31618.aspx (accessed on 6 March 2015).
- McMillan, H.K.; Brasington, J. Reduced complexity strategies for modeling urban floodplain inundation. Geomorphology 2007, 90, 226–243. [Google Scholar] [CrossRef]
- Bates, P.D.; Horritt, M.S.; Fewtrell, T.J. A simple inertial formulation of the shallow water equations for efficient two dimensional flood inundation modelling. J. Hydrol. 2010, 387, 33–45. [Google Scholar] [CrossRef]
- Bidur Ghimire, A.S.C.M. Formulation of a fast 2-D urban pluvial flood model using a cellular automata approach. J. Hydroinform. 2013, 15, 676–686. [Google Scholar] [CrossRef]
- Liu, L.; Liu, Y.; Wang, X.; Yu, D.; Liu, K.; Huang, H.; Hu, G. Developing an effective 2-D urban flood inundation model for city emergency management based on cellular automata. Nat. Hazards Earth Syst. Sci. 2015, 15, 381–391. [Google Scholar] [CrossRef] [Green Version]
- He, Y.; Pappenberger, F.; Thielen-del Pozo, J.; Weerts, A.; Ramos, M.-H.; Bruen, M. Preface Towards practical applications in ensemble hydro-meteorological forecasting. Adv. Geosci. 2011, 29, 119–121. [Google Scholar] [CrossRef]
- Germann, U.; Berenguer, M.; Sempere-Torres, D.; Zappa, M. REAL-Ensemble radar precipitation estimation for hydrology in a mountainous region. Q. J. R. Meteorol. Soc. 2009, 135, 445–456. [Google Scholar] [CrossRef] [Green Version]
- Merwade, V.; Olivera, F.; Arabi, M.; Edleman, S. Uncertainty in flood inundation mapping: Current issues and future directions. J. Hydrol. Eng. 2008, 13, 608–620. [Google Scholar] [CrossRef]
- Dottori, F.; Baldassarre, G.D.; Todini, E. Detailed data is welcome, but with a pinch of salt: Accuracy, precision, and uncertainty in flood inundation modeling. Water Resour. Res. 2013, 49, 6079–6085. [Google Scholar] [CrossRef]
- Downton, M.W.; Morss, R.E.; Wilhelmi, O.V.; Gruntfest, E.; Higgins, M.L. Interactions between scientific uncertainty and flood management decisions: Two case studies in Colorado. Environ. Hazards 2005, 6, 134–146. [Google Scholar] [CrossRef]
- Jang, J.H.; Yu, P.S.; Yeh, S.H.; Fu, J.C.; Huang, C.J. A probabilistic model for real-time flood warning based on deterministic flood inundation mapping. Hydrol. Process. 2012, 26, 1079–1089. [Google Scholar] [CrossRef]
- Ridolfi, E.; Montesarchio, V.; Rianna, M.; Sebastianelli, S.; Russo, F.; Napolitano, F. Evaluation of rainfall thresholds through entropy: Influence of bivariate distribution selection. Irrig. Drain. 2013, 62, 50–60. [Google Scholar] [CrossRef]
- Water Resource Agency. National Flood Insurance Program. Pilot Study: A Case Studies and for Tang-Dee-Yang Area; Water Resource Agency: Taipei, Taiwan, 1997. [Google Scholar]
- Soil Conservation Service. National Engineering Handbook, Cross Section 4: Hydrology; US Department of Agriculture: Spring-field, VA, USA, 1971.
- Soil Conservation Service. Urban Hydrology for Small Watersheds, Technical Release 55; US Department of Agriculture: Spring-field, VA, USA, 1986.
- Sweeney, T.L. Modernized Areal Flash Flood Guidance; NOAA Technical Memorandum NWS HYDRO 44; Office of Hydrology: Silver Spring, MD, USA, 1992.
- Norbiato, D.; Borga, M.; Degli Esposti, S.; Gaume, E.; Anquetin, S. Flash flood warning based on rainfall thresholds and soil moisture conditions: An assessment for gauged and ungauged basins. J. Hydrol. 2008, 362, 274–290. [Google Scholar] [CrossRef]
- Flood Estimation Handbook; Institute of Hydrology: Wallingford, UK, 1999.
- Hsu, M.H.; Chen, S.H.; Chang, T.J. Dynamic inundation simulation of storm water interaction between sewer system and overland flows. J. Chin. Inst. Civil Hydraul. Eng. 2002, 25, 1711–1771. [Google Scholar] [CrossRef] [Green Version]
- Chen, A.S.; Hsu, M.H.; Chen, T.S.; Chang, T.J. An integrated inundation model for highly developed urban areas. Water Sci. Technol. 2005, 51, 2321–2229. [Google Scholar]
- U.S. Army Corps of Engineers Hydrologic Engineering Center. HEC-1 Hydrograph Package; Water Resources Support Center: Alexandria, VA, USA, 1992. [Google Scholar]
- Hsu, M.H.; Fu, J.C.; Liu, W.C. Flood routing with real-time stage correction method for flash flood forecasting in the Tanshui River, Taiwan. J. Hydrol. 2003, 283, 267–280. [Google Scholar] [CrossRef]
- Hsu, M.H.; Teng, W.H.; Wu, F.C. Inundation models for the Pa-chang creek basin in Taiwan. Proc. Natl. Sci. Counc. 1998, 22, 279–289. [Google Scholar]
- Huber, W.C.; Dickinson, R.E. Storm Water Management Model, User’s Manual Ver. IV; U.S. Environmental Protection Agency: Washington, DC, USA, 1988.
- Hsu, M.H.; Chen, S.H.; Chang, T.J. Inundation simulation for urban drainage basin with storm sewer system. J. Hydrol. 2000, 234, 21–37. [Google Scholar] [CrossRef] [Green Version]
- Natural Resources Conservation Service. National Engineering Handbook, Part. 630 Hydrology: Time of Concentration; Natural Resources Conservation Service: Washington, DC, USA, 2010.
- Chow, V.T.; Maidment, D.R.; Mays, L.W. Applied Hydrology; Mc-Graw-Hill Inc.: Columbus, OH, USA, 1988. [Google Scholar]
- Reed, S.; Schaake, J.; Zhang, Z. A distributed hydrologic model and threshold frequency-based method for flash flood forecasting at ungauged locations. Water Resour. Manag. 2007, 24, 3547–3559. [Google Scholar] [CrossRef]
- Fetter, C.W. Applied Hydrogeology, 4th ed.; Prentice Hall: Upper Saddle River, NJ, USA, 2001. [Google Scholar]
- Mason, S.J. A model for assessment of weather forecasts. Aust. Meteorol. Mag. 1982, 30, 291–303. [Google Scholar]
- Xiao, Q.; Sun, J. Multiple-radar data assimilation and short-range quantitative precipitation forecasting of a squall line observed during IHOP 2002. Mon. Weather Rev. 2006, 135, 3381–3401. [Google Scholar] [CrossRef]
- Mitidieri, F.; Papa, M.N.; Ciervo, F.; Berenguer, M.; Sempere-Torres, D.; Medina, V.; Bateman, A. Debris flow warning through radar nowcasting and critical rainfall thresholds: A case study in the Glarus Catchment (Switzerland). Eng. Geol. Soc. Territ. 2015, 3, 73–77. [Google Scholar]
- Alfieri, L.; Smith, P.J.; Thielen-del Pozo, J.; Beven, K.J. A staggered approach to flash flood forecasting—Case study in the C’evennes region. Adv. Geosci. 2013, 29, 13–20. [Google Scholar] [CrossRef] [Green Version]
- Calianno, M.; Ruin, I.; Gourley, J.J. Supplementing flash flood reports with impact classifications. J. Hydrol. 2013, 477, 1–16. [Google Scholar] [CrossRef]
© 2015 by the authors; licensee MDPI, Basel, Switzerland. This article is an open access article distributed under the terms and conditions of the Creative Commons Attribution license (http://creativecommons.org/licenses/by/4.0/).
Share and Cite
MDPI and ACS Style
Jang, J.-H. An Advanced Method to Apply Multiple Rainfall Thresholds for Urban Flood Warnings. Water 2015, 7, 6056-6078. https://doi.org/10.3390/w7116056
AMA Style
Jang J-H. An Advanced Method to Apply Multiple Rainfall Thresholds for Urban Flood Warnings. Water. 2015; 7(11):6056-6078. https://doi.org/10.3390/w7116056
Chicago/Turabian StyleJang, Jiun-Huei. 2015. "An Advanced Method to Apply Multiple Rainfall Thresholds for Urban Flood Warnings" Water 7, no. 11: 6056-6078. https://doi.org/10.3390/w7116056