Article

Spatio-Temporal Patterns of Water Table and Vegetation Status of a Deserted Area

1
College of Conservancy and Civil Engineering, Inner Mongolia Agricultural University, Hohhot 010018, China
2
Hydraulics/Water Resources Laboratory, Department of Civil and Environmental Engineering, Old Dominion University, Norfolk, VA 23529-0241, USA
*
Authors to whom correspondence should be addressed.
Water 2015, 7(10), 5788-5805; https://doi.org/10.3390/w7105788
Submission received: 19 August 2015 / Revised: 12 October 2015 / Accepted: 16 October 2015 / Published: 23 October 2015

Abstract

:
Understanding groundwater-vegetation interactions is crucial for sustaining fragile environments of desert areas such as the Horqin Sandy Land (HSL) in northern China. This study examined spatio-temporal variations in the water table and the associated vegetation status of a 9.71 km2 area that contains meadowland, sandy dunes, and intermediate transitional zones. The depth of the water table and hydrometeorologic parameters were monitored and Landsat Thematic Mapper (TM) and Moderate Resolution Imaging Spectroradiometer (MODIS) data were utilized to assess the vegetation cover. Spatio-temporal variations over the six-year study period were examined and descriptive groundwater–vegetation associations developed by overlaying a water table depth map onto a vegetation index map derived from MODIS. The results indicate that the water table depends on the local topography, localized geological settings, and human activities such as reclamation, with fluctuations occurring at annual and monthly scales as a function of precipitation and potential evapotranspiration. Locations where the water table is closer to the surface tend to have more dense and productive vegetation. The water table depth is more closely associated with vegetative density in meadowlands than in transitional zones, and only poorly associated with vegetation in sandy dunes.

1. Introduction

Groundwater-vegetation interactions have been widely studied and are well documented in the existing literature [1,2]. A comprehensive review of information on interactions between vegetation and groundwater that examined studies conducted before 1999 predominantly focused on the impacts of vegetation physiology (e.g., root systems) and management (e.g., grazing and removal) on groundwater recharge and discharge [1]. Most of the areas studied had well-established and dense vegetation cover, and a major finding of these earlier studies was that plants increase percolation rates by providing root channels to aid the flow of water [3,4,5,6,7], which is known as the mechanism of preferential flow.
This stands in sharp contrast with the information on how variations in the level of the groundwater table influences vegetation status, which is both scanty and incomplete [8,9,10,11]. Of the studies that have been published, Wang et al. [2] analyzed water table fluctuations in the lower Heihe River Basin and the corresponding responses of the vegetation growing by using integrated Moderate Resolution Imaging Spectroradiometer (MODIS) normalized difference vegetation index (NDVI) data. NDVI is a composite number that reflects the leaf area, biome, productivity, and percentage vegetation cover [12]. Previous studies [13,14,15] have confirmed that maximum NDVI can be a reliable indicator of vegetation cover and its growth condition, demonstrating that a year with a higher maximum NDVI value tends to have better vegetation growth (i.e., denser vegetation cover) and vice versa. In the lower Heihe River Basin, the vegetation response was obvious for water table depths of between 1.8 and 3.5 m, but less so for depths of more than 5 m to 6 m. For water table depths of less than 1.8 m, salinity increased significantly, adversely affecting vegetative growth [2]. Similar findings have been reported for the riparian zones along the Tarim River in northwest China [16,17], the San Pedro River in Arizona in the southwestern United States (U.S.) [18,19], and for a Californian semiarid oak savanna [20].
The studies cited above, along with most other studies reported in existing literature, were conducted in areas where perennial and/or ephemeral streams exist and stream flow is the dominant recharge source of groundwater. Vegetation in those areas is sustained by a combination of surface water and groundwater, so their results and methods may not be applicable for arid areas, especially desert areas [21]. Desert areas have very fragile hydrologic and environmental conditions and sparse vegetation coverage (<50%; classified as somewhat desertified) that is intermingled with mobile, semimobile, and/or semifixed sand dunes [22,23,24,25,26]. Given that about 25% of the global land are likely to become deserted, the protection of sparse vegetation in arid areas is very important to address the desertification-related environmental issues, which will increase frequency and intensity of dust storms or sandstorms that affect not only the adjacent rural areas but also distant metropolises [27,28,29,30].
The 51,700 km2 Horqin Sandy Land (HSL) is one of the largest deserts in Asia as a result of vegetation degradation in the past 30 years. In the HSL, surface water is negligible and the vegetation primarily depends on groundwater for survival and development [31,32,33,34]. Duan et al. [21] found that the spatio-temporal variation of vegetation in the HSL is dominated by groundwater availability and only slightly influenced by soil physicochemical properties such as soil texture, soil organic content, soil salinity, and plant physiology. Ma et al. [35] analyzed the relationship between vegetation ecotypes and groundwater depth in the HSL, and showed that the ranges of water table depth for hygrophyte, mesophyte, mesoxerophyte and xerophyte varied from 0.45 m to 1.66 m, 0.95 m to 2.20 m, 2.20 m to 4.59 m, and 3.45 m to 7.45 m, respectively. Wu [36] found that groundwater was key to vegetation growth in the HSL, and accounted for 36% of the total evapotranspiration (i.e., 162 mm) on average. Such a percentage could be increased to 60% (i.e., 270 mm) in a dry year such as in 2009. Based on our field observations, groundwater contributed 50.9% and 51.8% (i.e., 235 mm and 187 mm) of the total transpirations of maize in 2008 and 2009, respectively.
Because of the importance of groundwater, understanding how groundwater fluctuations affect the long-term development of vegetation is crucial for making efforts to sustain the fragile environment of desert areas. However, such an understanding has been greatly limited by scarce data, which makes it impossible to use advanced spatial statistical methods (e.g., geostatistical analysis and multivariate regression) [37,38]. The objectives of this study were therefore to conduct an exploratory analysis to examine: (1) spatio-temporal variations in the water table beneath a selected area within the HSL; and (2) the relationship between variations in the depth of the water table and the overall vegetation status of the selected area. This examination was primarily based on data collected by the authors, supplemented by data obtained from other sources.

2. Materials and Methods
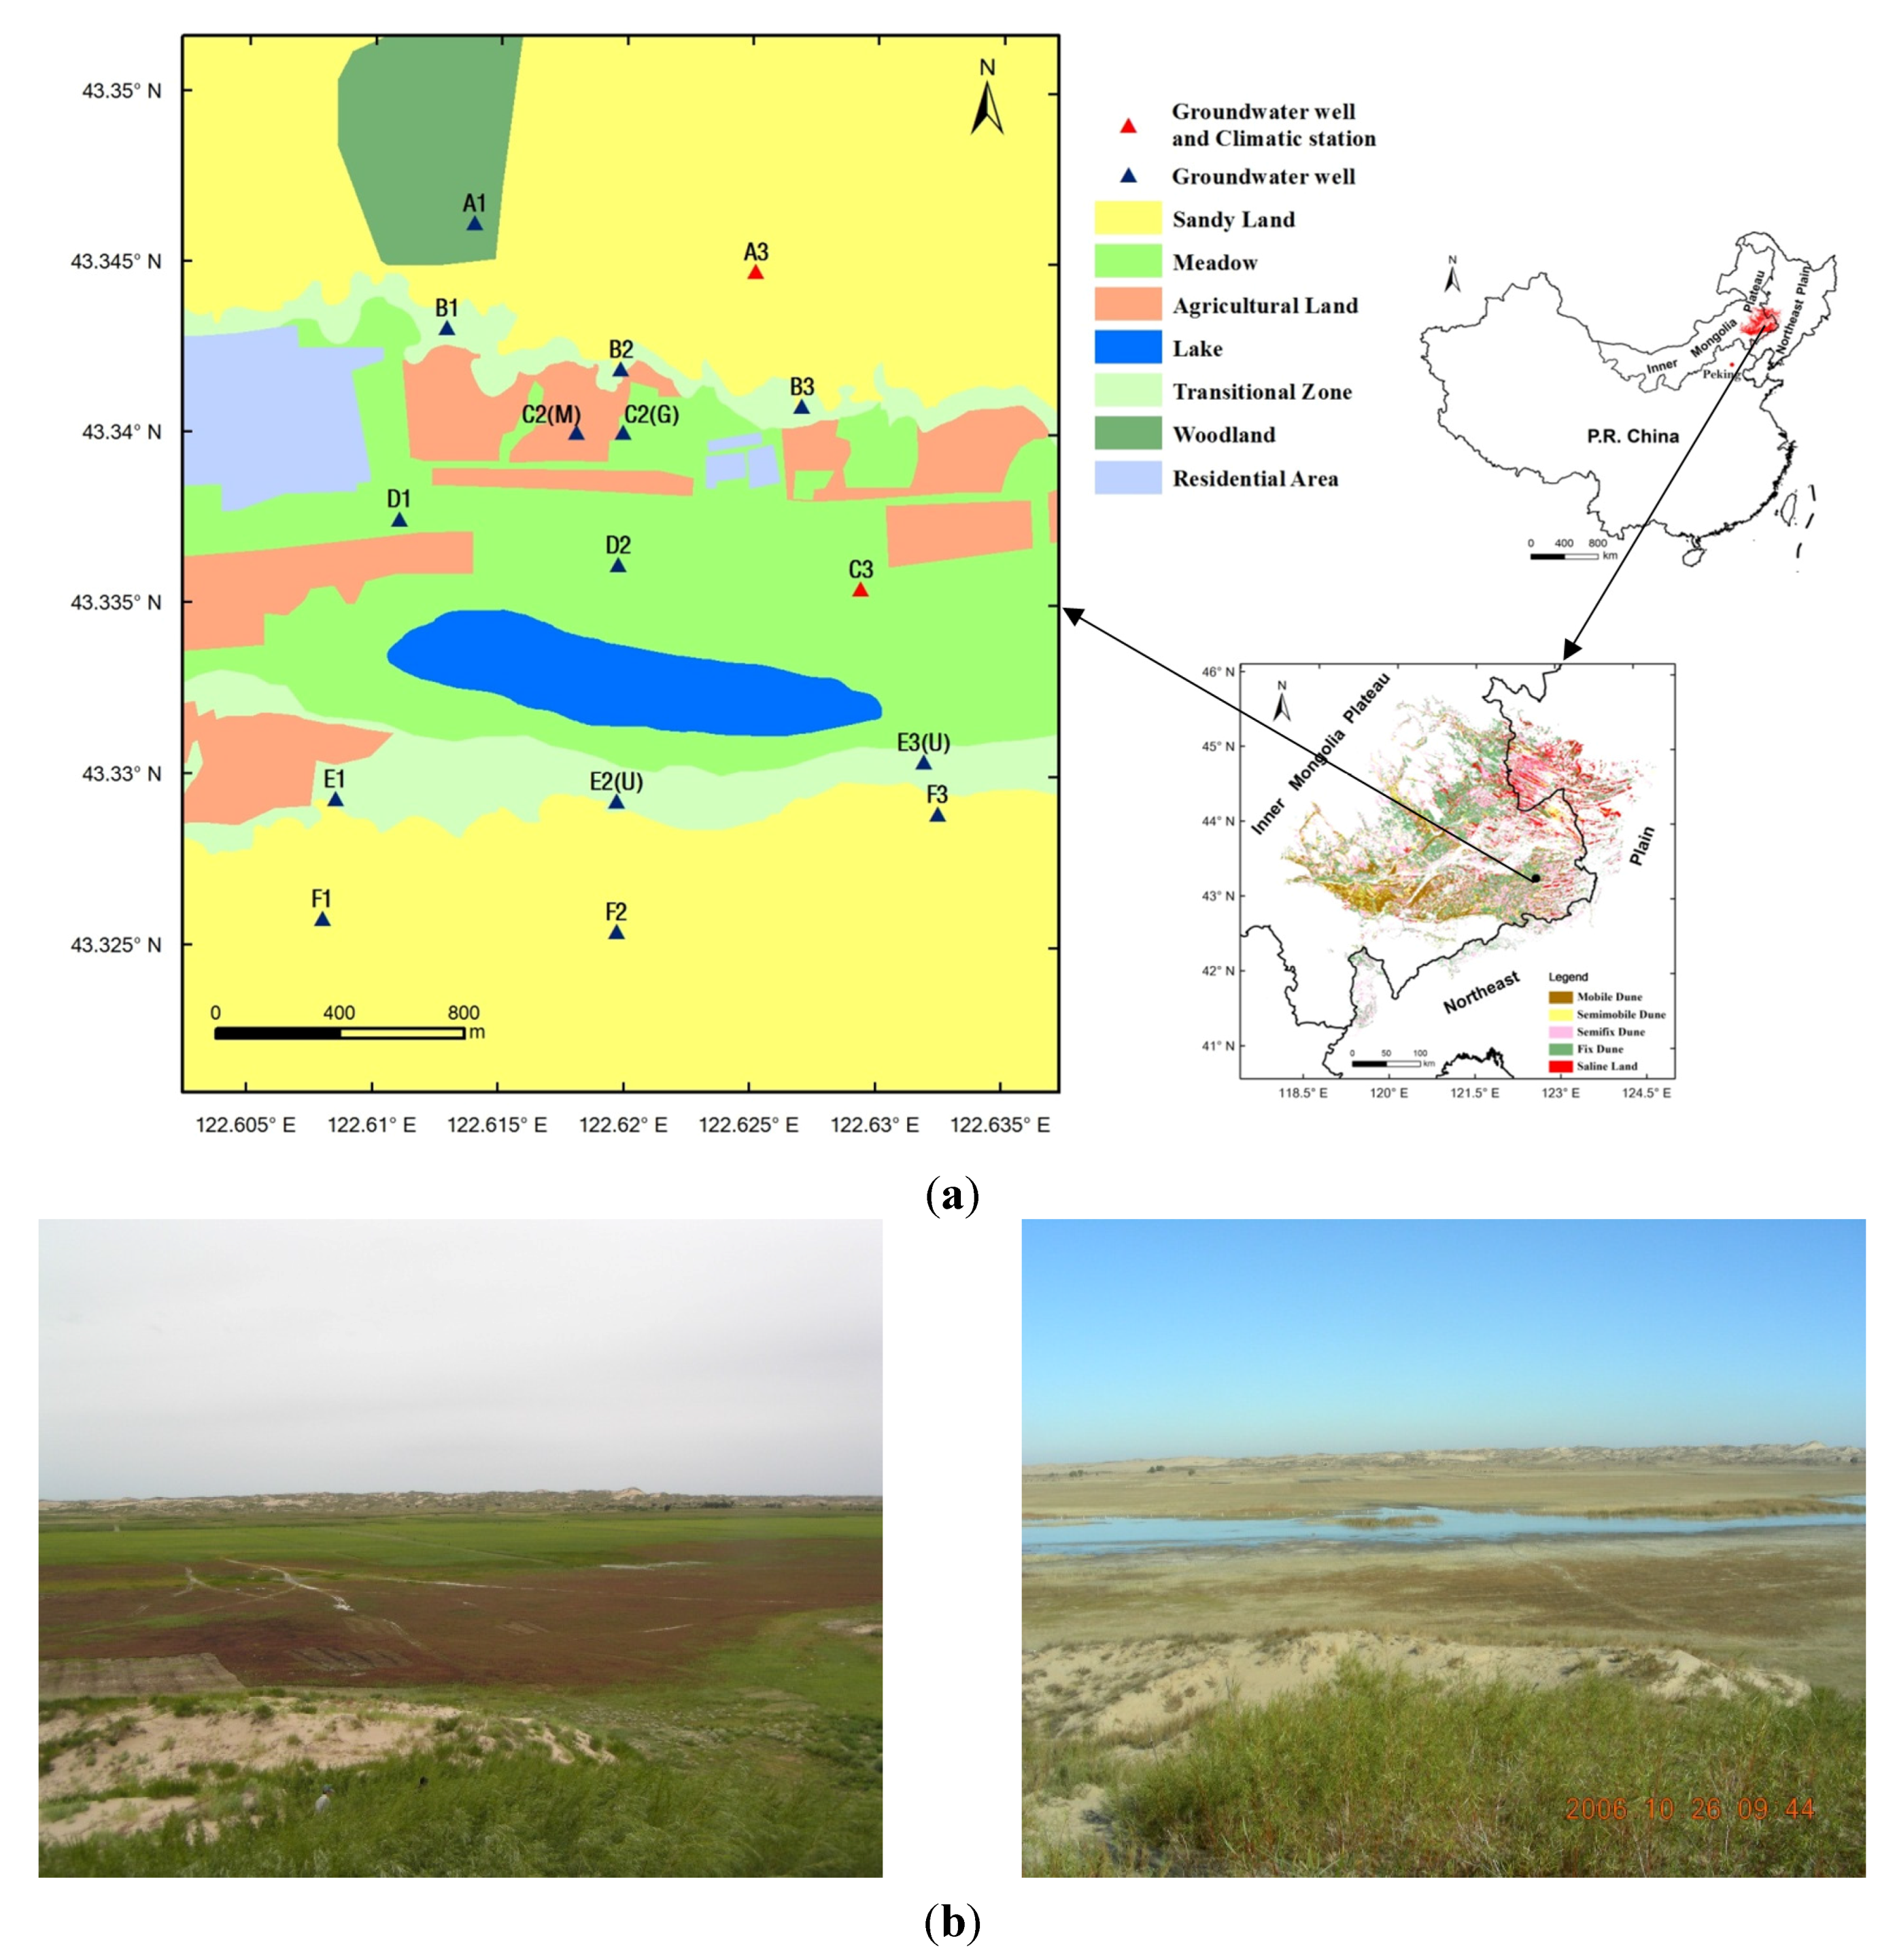
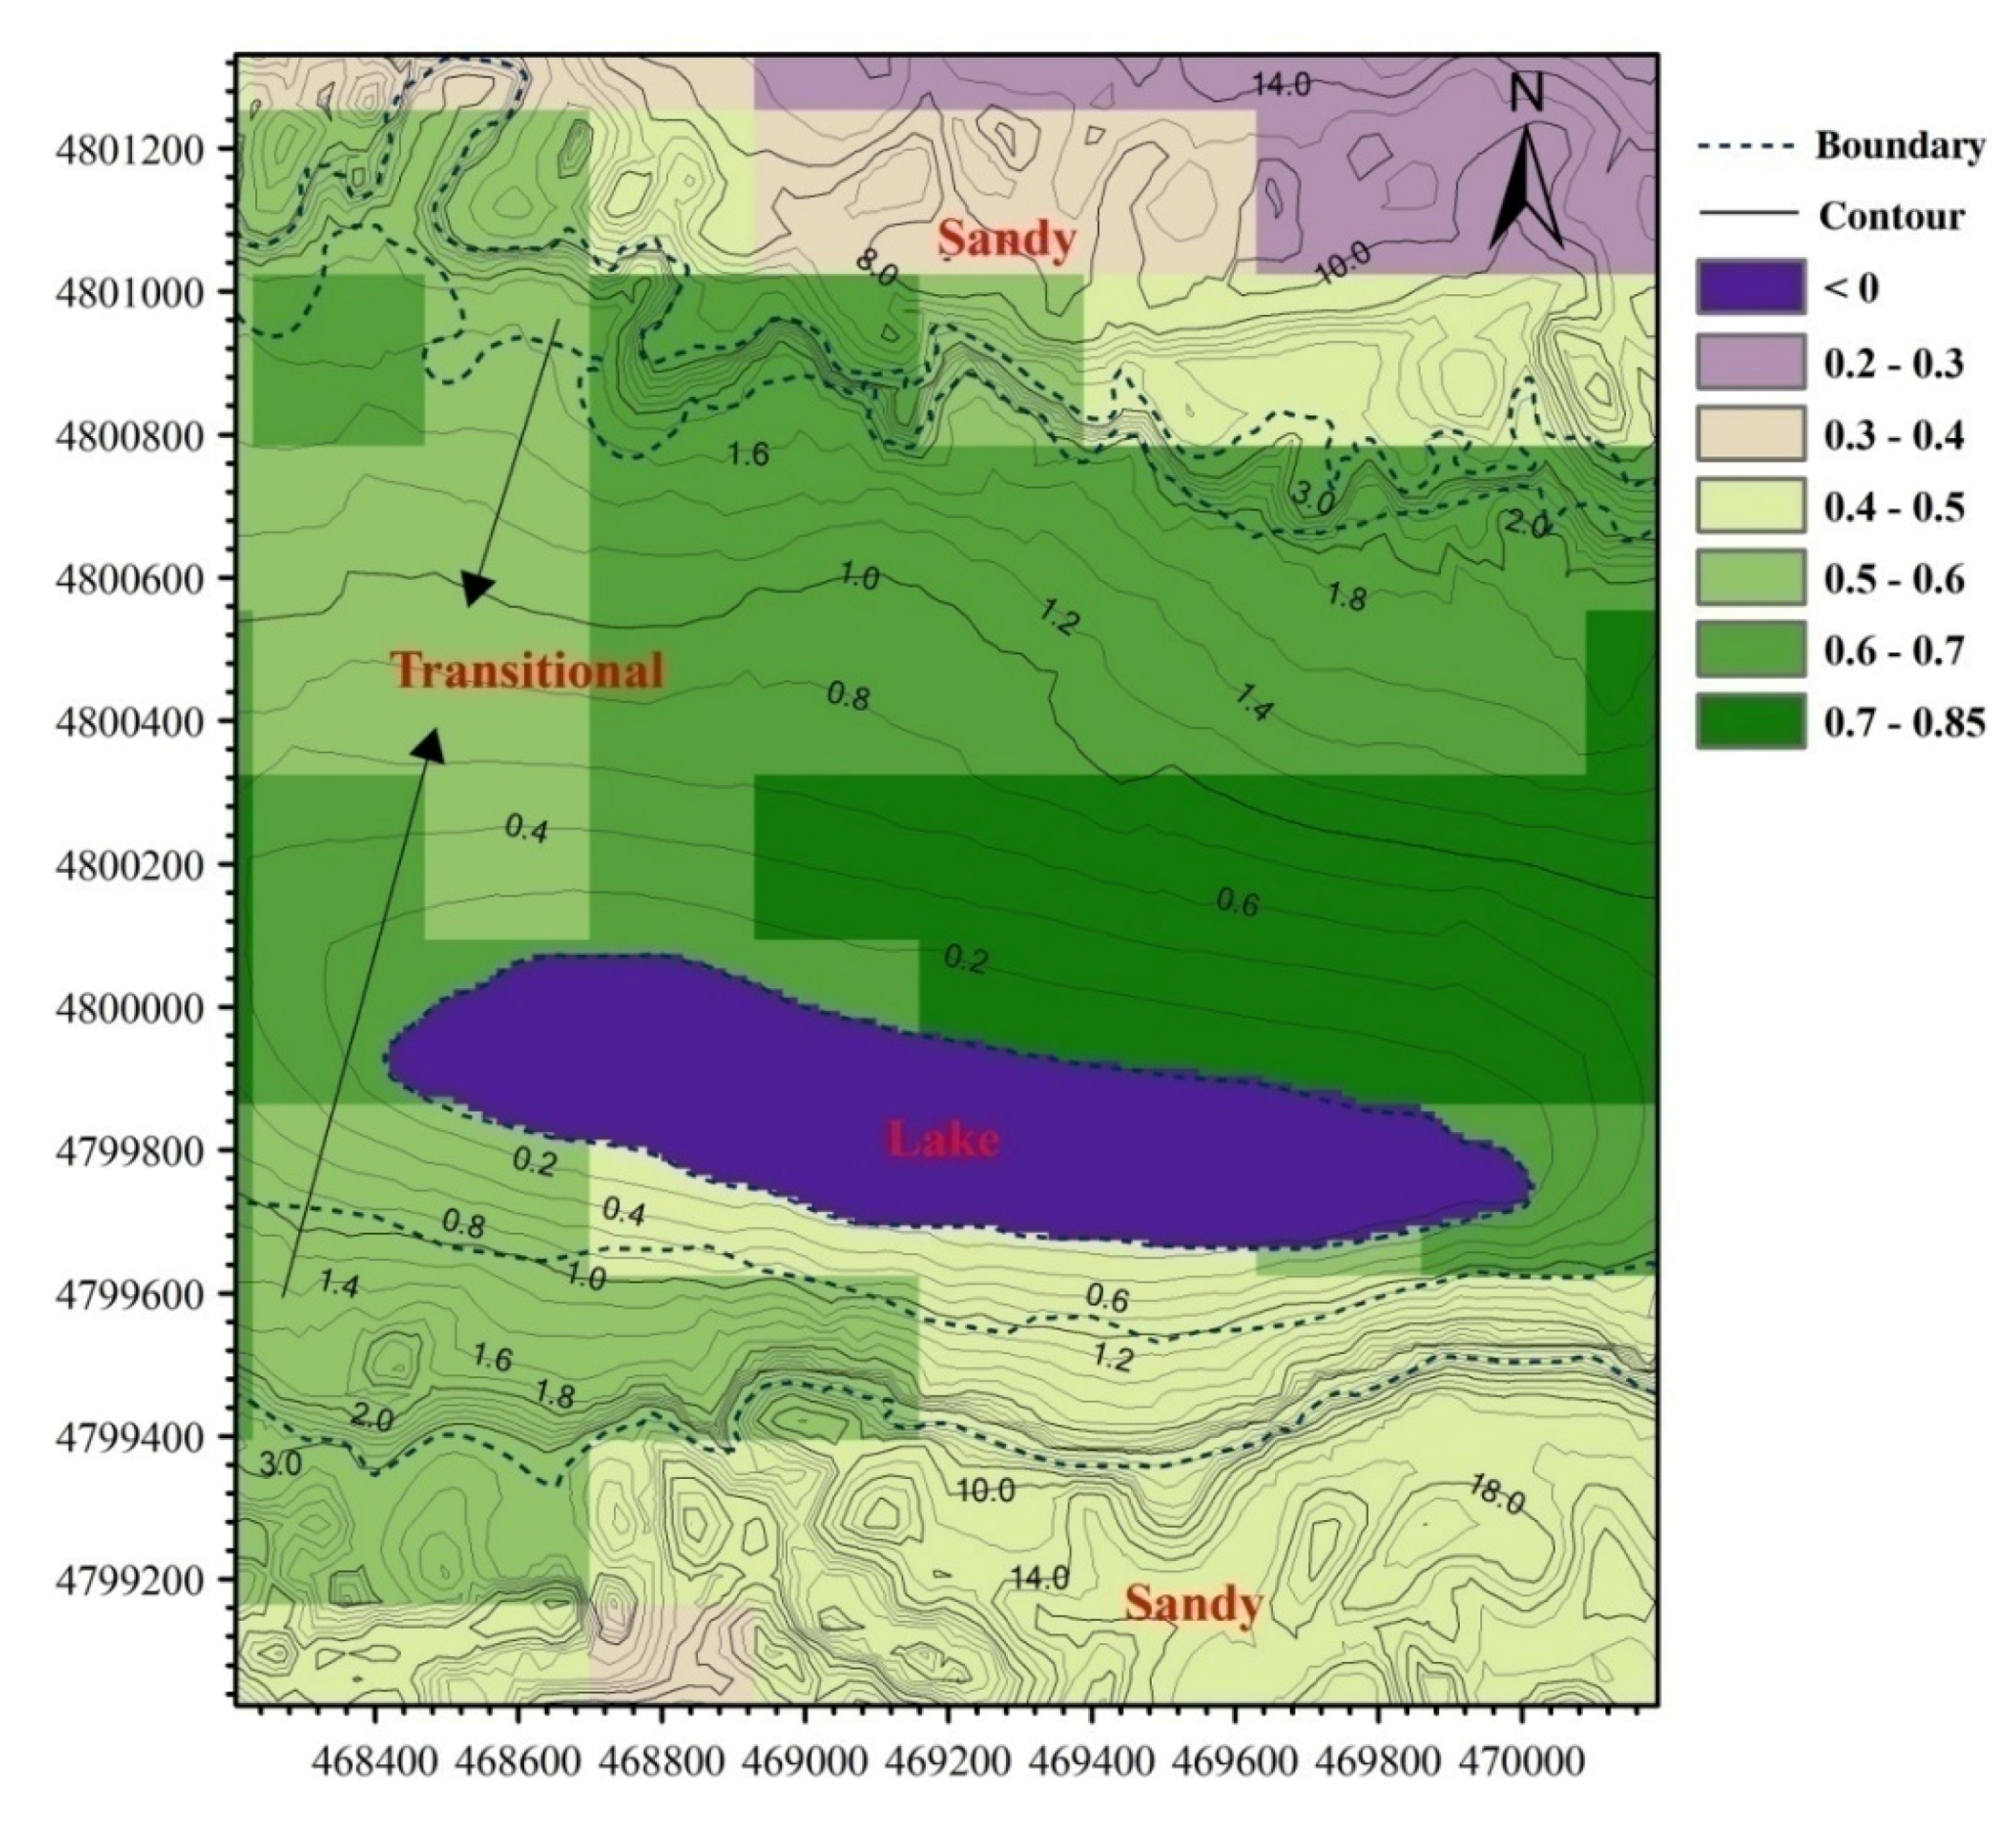
2.1. Study Area

A 9.71 km2 area (122°36.15' to 122°38.23' E, 43°19.25' to 43°21.10' N) within the 51,700 km2 HSL (118°35' to 123°30' E, 42°41' to 45°15' N) (Figure 1a) was selected for this study. This area is a typical semiarid agro-pastoral transitional zone with diverse landscape features of sandy dunes (54.5%), meadows (26.6%), agricultural land (10.4%), a lake (5.2%), and residential areas (3.3%). Based on a recent study of the local conditions conducted by Ma [35], this region has a temperate and semiarid continental monsoonal climate with an average annual precipitation of 389 mm, of which 69.3% falls during the growing season (June to August), and an average annual PET (potential evapotranspiration) of about 1412 mm. The average annual temperature is around 6.6 °C, with a minimum monthly mean temperature of −13.3 °C in January and a maximum temperature of 23.8 °C in July. The average annual wind speed is 3.8 m·s−1, with a minimum monthly mean wind speed of 3.0 m·s−1 in August and a maximum of 5.0 m·s−1 in April. The prevalent wind direction in winter and spring is northwest, whereas in summer and autumn it is southwest.
The aquifer that lies beneath the study area is composed of layers of Quaternary loose sediments that range in thickness from 100 m to 200 m. The sediments are mainly fine sand (particle sizes from 0.074 mm to 0.42 mm) in the upper layer of the aquifer, fine to medium sand (0.42 mm to 2.0 mm) in the mid layer, and coarse sand (2.0 mm to 4.75 mm) to gravel (4.75 mm to 76 mm) in the lower layer. Groundwater comes mainly from precipitation and can either be lost to phreatic evaporation or discharged into the lake in the study area (Figure 1).
The combination of dry-windy climate and vulnerable sandy soils favors wind erosion, which is likely to be a major reason for the rapid spread of desertification in this region [39] and the large-scale dust storms that plague the area [40,41]. The study area, which has a topographic elevation varying from 186 m to 232 m above mean sea level and consists of rolling sandy dunes and desert as well as flat interdune (i.e., meadow) lowlands, agricultural land, and a lake (Figure 1b), has an average dust storm outbreak frequency of 1.92 days per year. The sandy dunes are either bare or covered by sparse native plants such as Artimisia halodendron, Caragana microphylla, Salix gordejevii, and/or Populus; the lowlands are mainly covered with Leymus chinensis, Phragmites australis, and/or Ixeris chinensis. Based on a field reconnaissance conducted by the authors in June 2010, maximum root depths for these plants ranged from 5 cm to 1.6 m, with fine roots primarily developed within the 30 cm thick topsoil.
Figure 1. Map showing the: (a) location, landscape, and data collection points; and (b) topography and vegetation, of the study area.
Water 07 05788 g001

2.2. Instrumentation and Data Collection

A network of instruments was installed in the study area in 2003 to continuously collect data on the water table at 16 sites (Table 1), with additional hydrometeorology data being gathered at sites A3 and C3. The water table is measured using PC-2X transducers. For each observational well, a perforated iron pipe with an inner diameter of 5 cm was installed to prevent the collapse of the well borehole and to allow placement of the transducer. The wells have a depth of 5 m to 15 m and a wellhead at 0.2 m to 1.5 m above ground surface, depending on the local land cover and geographic location. The hydrometeorologic data, including rainfall, snowfall, sunshine duration, air temperature, relative humidity, wind speed, and barometric pressure, were collected either manually using gauges or by automated sensors (Table 2 and Table 3). These sites, which are maintained by the Agula Ecohydrological Experiment Station of the Inner Mongolia Agricultural University, were selected to monitor all the combinations of soils and land cover types within the study area, and are named using combinations of the six letters from A to F and three numbers, 1, 2, and 3 (Figure 1a and Table 1). The sites are protected by wire netting fences to prevent any unexpected interference from livestock and are accessed via narrow observation brick roads to minimize any disturbance to the natural conditions.
Table 1. Characteristics of the water table and hydrometeorologic sites.
SiteLand CoverSoil TextureElevation (m)Dominant Plant SpeciesVegetation Density (%)
A3Mobile duneSand199.35Artimisia halodendron<20
C3MeadowSandy loam188.50Leymus chinensis>50
A1Fixed duneSand194.20Populus>40
B2Fixed duneSand190.87Artimisia halodendron>40
C2(G)MeadowLoamy sand188.60Leymus chinensis20–50
C2(M)MeadowLoamy sand188.51Zea Mays L.>50
D1MeadowSandy loam188.52Leymus chinensis5–20
E1Fixed duneSand190.89Artimisia halodendron>40
E2(U)MeadowSandy loam189.59Leymus Chinensis, Phragmites australis, Ixeris chinensis20–50
E3(U)MeadowSandy loam188.42Leymus Chinensis, Phragmites australis, Ixeris chinensis>50
F1Fixed duneSand196.73Caragana microphylla>40
F3Semifixed duneSand198.20Salix gordejevii20–40
B1Fixed duneSand190.13Artimisia halodendron>40
B3Fixed duneSand191.30Artimisia halodendron>40
D2MeadowSandy loam189.03Leymus chinensis>50
F2Semifixed duneSand196.62Artimisia halodendron20–40
For this study, the depth of the water table was measured every 5 days from 1 April 2003 to the end of December 2009. Rainfall and snowfall were manually measured at the KTS sites from 1 June 2006 to 31 December 2009 using a Siphon rain gauge [42] and weighing method [43], respectively, on a daily basis. Sunshine duration was observed daily at sites A3 and C3 starting from 1 June 2007 using a sunshine duration instrument [44] and in June 2007, the data collected at sites A3 and C3 were enhanced by the addition of automated sensors to measure rainfall, air temperature, relative humidity, wind speed, and barometric pressure. The acquisition time interval for these sensors was set to 30 min. Data collected during periods when an instrument malfunctioned or was interfered with by livestock grazing in the area were flagged as missing. The remaining data used for the analysis were checked to ensure they fell within reasonable ranges for the parameters being monitored.

2.3. Other Data

A contour map for the study area with an elevation interval of 2 m stored in the dwg format of AutoCAD® 2002 (Autodesk, SanRafael, CA, USA) was used to delineate the topographic variations and the depths of the water table across the study area in ArcGIS® 9.2 (Environmental Systems Research Institute, Inc., Redlands, CA, USA). All the available Landsat 4-5 Thematic Mapper (TM) images for the study area from April 2003 to December 2009 were interpreted to visually delineate boundaries of the three major classes of land cover (i.e., sandy dunes, transitional zones, and meadowlands) as well as the long-term average seasonal sizes of the lake.
The Tongliao station (122°16′ E, 43°36′ N) is located 43 km northwest of the study area and has a ground elevation of 181 m, about 10 m lower than the average elevation of the study area. This station has been collecting hydrometeorologic data since 1951. The measured daily values at this station for precipitation, air temperature, relative humidity, wind speed, barometric pressure, and sunshine duration were used in this study to extend the measured time series for the study area.
MODIS images of the study area for the period April 2003 to December 2009 were analyzed to provide values of NDVI at 16-day intervals. In this study, NDVI was used to determine how the vegetation dynamics were influenced by fluctuations in the water table as well as precipitation and evapotranspiration variations.

2.4. Data Preprocessing

The number of years for which the parameters were measured varied from site to site (Table 2) and the measurement frequency at a given site was not consistent for all parameters. Thus, the raw data were first collapsed into a more manageable form. For the water table and for each observational well, daily values within a given month of a water year (December to November) were used to compute a median value as the mean monthly water table for that month of that year. The monthly values for a given season in the same year were arithmetically averaged to compute the mean seasonal water table. The seasonal values for that same year were in turn arithmetically averaged to compute the mean annual water table.
For each type of land cover, the mean annual water table for a given water year was computed to be the arithmetic average of the monthly water tables for the observational wells located within that land cover area. The annual mean monthly water table for each month was calculated as the arithmetic average of the monthly water tables for all the observational wells within the area of this land cover and for each month across the six measurement years.
For air temperature, relative humidity, wind speed, and barometric pressure, daily values were computed as the arithmetic average of all the observed values on that day. For each of these meteorological parameters, the areal value for a given day was computed to be the arithmetic average of the daily values at sites A3 and C3. In order to ensure these meteorological parameters shared the same time-series length as the water table, the computed areal daily values for each parameter were regressed in Microsoft Excel® (Microsoft Corporation., Redmond, WA, USA) with respect to the corresponding measured daily values of that parameter at the Tongliao station. The regression equations for each of the meteorological parameters were then used to estimate the areal daily values of the parameters for the period from April 2003 to the starting measurement date (Table 2) for the period for which daily values at the Tongliao station were available. As a result, a time-series dataset from 1 April 2003 to 31 December 2009 was created for all five meteorological parameters that could then be used to compute site daily PETusing the FAO56 Penman-Monteith method [45,46].
Table 2. Parameters measured. R (siphon gauge), SF, and SD were measured at 1 m above the surface of the ground on a daily basis; the R (sensor) was measured at 1 m; and T, RH, WS, and BP were measured at 2 m above the ground with an acquisition time interval of 30 min.
ParameterIDMeasurement MethodMeasurement Year
Water tableWT (m)TransducerApril 2003–December 2009
RainfallR (mm)Siphon gaugeJune 2006–December 2009
SnowfallSF (mm)Weighing gaugeJune 2006–December 2009
Sunshine durationSD (h)Sunshine instrumentJune 2007–December 2009
RainfallR (mm)TE525MM sensorJune 2007–December 2009
Air temperatureT (°C)HMP155A-L sensorJune 2007–December 2009
Relative humidityRH (%)HMP155A-L sensorJune 2007–December 2009
Wind speedWS (m·s−1)034B sensorJune 2007–December 2009
Barometric pressureBP (hPa)CS100 sensorJune 2007–December 2009
In addition, the 16-day values of NDVI were extracted from the MODIS images for each of the six study years (i.e., 2004 to 2009) and used to determine a maximum NDVI for that year. Finally, the vector topographic map was rasterized using the Raster Interpolation Tools of ArcGIS® 9.2 to generate a 10-m digital elevation model (DEM).

2.5. Analysis Method

The values for the annual mean depth of the annual water table at the 16 observational wells were used in Surfer 8.0® (Golden Software Inc., Golden, CO, USA) to generate a contour map. This map was then visually compared with the topographic map and the Landsat 4-5 TM images to examine how the spatial patterns of the water table are influenced by topography and land cover. Similarly, for each season the values for annual mean seasonal water table at the 16 observational wells were used to generate a contour map for that season. The four seasonal contour maps were then compared with each other and with the annual contour map to identify any discrepancies. In addition, visual plots were generated to examine the temporal trends in the water table depth at annual and monthly time scales for each of the three types of land cover and site by site. Furthermore, the temporal trends for a given time scale were examined to identify any causal relationships with precipitation and PET at the same time scale.
The contour map of annual mean annual water table was rasterized using the Raster Interpolation Tools of ArcGIS® 9.2, with a spatial resolution of 10 m. This rasterized water table contour map was subtracted from the 10-m DEM to generate a grid map of the annual mean depth of the water table. This grid map in turn was converted in ArcGIS® 9.2 into a contour map of the depth of the water table. Subsequently, this contour map was superimposed onto the maximum NDVI grid to examine the effects of fluctuations in the water table on vegetation growth and health. Finally, the values of maximum NDVI were regressed with respect to the mean annual water table, the precipitation and PET to partition the overall effects among these three factors.

3. Results and Discussion

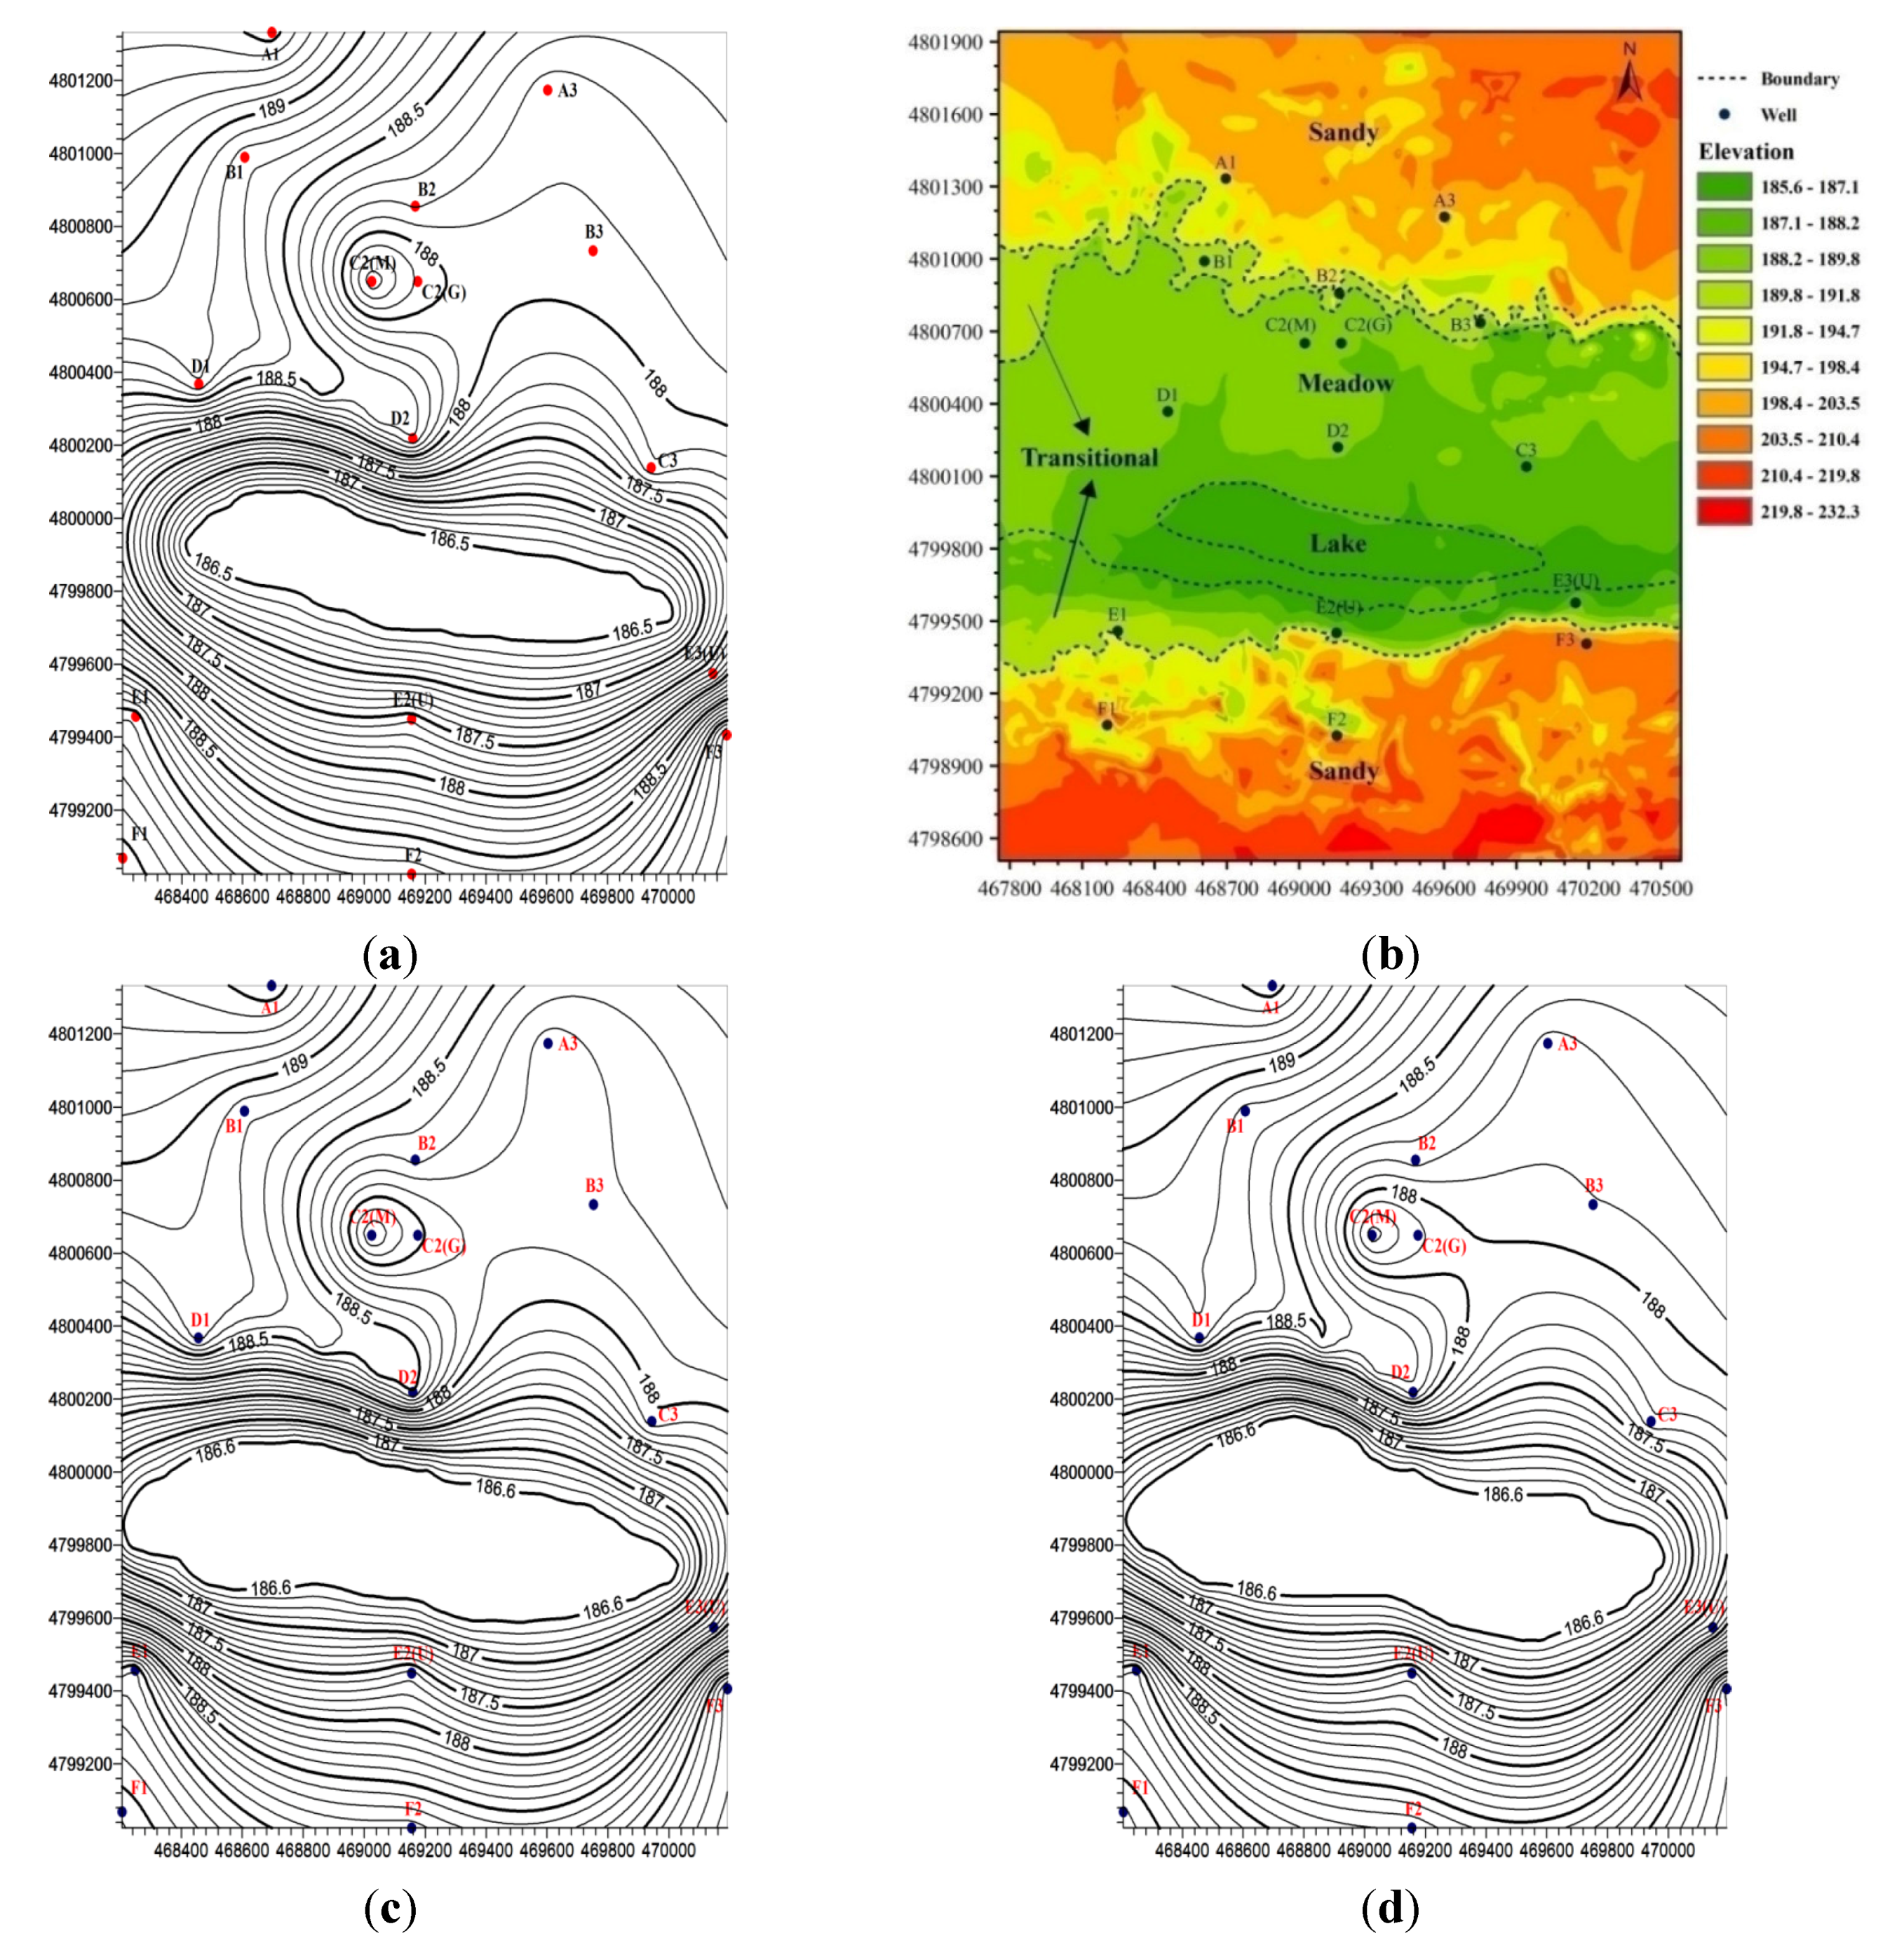
3.1. Water Table Spatial Patterns

The long-term (i.e., 2004 to 2009) annual mean water table level exhibited an overall pattern of decreasing from the sandy areas in the south and north of the study area to the transitional zones and then decreasing further in the meadowlands in the center of the study area (Figure 2a,b). The water table underneath the high-altitude (191.8 m to 232.3 m) peripheral sandy areas was almost 0.9 m above that underneath the medium-altitude (188.2 m to 191.8 m) transitional zones, which was in turn about 0.1 m above that underneath the low-altitude (187.1 m to 189.8 m) meadowlands (Table 3). This pattern follows that of the general topography: the sandy areas have a higher altitude than the transitional zones, which in turn have a higher altitude than the more fertile meadowlands in the valley bottoms (Figure 2b). The average surface gradient is around a 3 m drop in elevation per 100 m geographic distance (i.e., 3%). Groundwater in the northwest of the study area either flows into the lake at a hydraulic gradient of 0.65‰ to 1.05‰ or to the sink area surrounding sites C2(M) and C2(G) (Figure 2a) at a greater gradient of 1.08‰. This sink probably originated as a result of localized geological conditions such as the patch of higher ground between sites D2 and C3, as shown in Figure 2b, which formed a geological barrier to hinder the southeasterly flow of groundwater [21]. Another possible explanation is that the natural water table surrounding the sink was lowered by agricultural activities (Figure 1a) to such an extent that the groundwater flow direction beyond site C2(M) was reversed. This finding was reasonably compatible with the results reported by Ma et al. [35].
In addition, the groundwater in the northeast part of the study area flows into the lake at a much smaller hydraulic gradient of about 0.4‰, while groundwater in the south flows into the lake at a much steeper gradient of up to 5.0‰. Not surprisingly, the water table in the north of the lake exhibited more spatial heterogeneity than in the south of the study area (Figure 2a). Again, this can be attributed to the localized geological conditions as well as greater groundwater consumption by humans, livestock, and crops. In contrast, the spatial variability of the topography in the south is less marked (Figure 2b) and there is far less human activity.
The aforementioned pattern also holds for the long-term annual mean seasonal water table (Figure 2c–f). Although the lake’s surface area was smaller than average in the fall (Figure 2e versus Figure 2a), it was larger in the other three seasons. Because the lake is solely fed by groundwater, this variation in the lake surface area indicates that the water table fluctuates from season to season. The magnitude of this fluctuation ranged from 7 cm underneath the sandy dunes to 14 cm underneath the transitional zones (Table 3) but was most marked in the meadow and agricultural lands, where the water table depth was usually less than 2.0 m and could thus be directly influenced by seasonal variations in precipitation and evapotranspiration. In these areas, the water table was up to 10 cm lower in summer and fall than in spring and winter. The explanation for this observation is that vegetation (e.g., Leymus chinensis) and crops took more groundwater during the growing season; phreatic evaporation also tended to increase as the water table was closer to the surface in the summer and fall. The results of our analysis are consistent with previous study by Jia et al. [47]. In contrast, the region south of the lake exhibited negligible variation from season to season because of the much deeper water table (>4.0 m). For the sandy dunes, the water table tended to drop marginally from spring to winter as a result of water table fluctuations in the transitional zones and meadowlands. The water table in the transitional zones declined from spring to fall, but exhibited no detectable changes from fall to winter. The most obvious fluctuation occurred beneath the northeast corner of the study area (Figure 2c–f).
Figure 2. Contour plots of: (a) annual mean annual water table; (b) topography; (c) annual mean spring water table; (d) annual mean summer water table; (e) annual mean fall water table; and (f) annual mean winter water table. The units are in m and dots signify the sampling wells.
Water 07 05788 g002aWater 07 05788 g002b
Table 3. Mean annual water table levels in the study area.
Temporal ScaleLand Cover
Sandy Dune (m)Transitional Zone (m)Meadowland (m)Lake (m)
Spring (March to May)189.11188.31188.20186.60
Summer (June to August)189.10188.27188.07186.60
Fall (September to November)189.08188.17188.09186.50
Winter (December to February)189.04188.17188.14186.50
Annual average189.09188.23188.13186.50

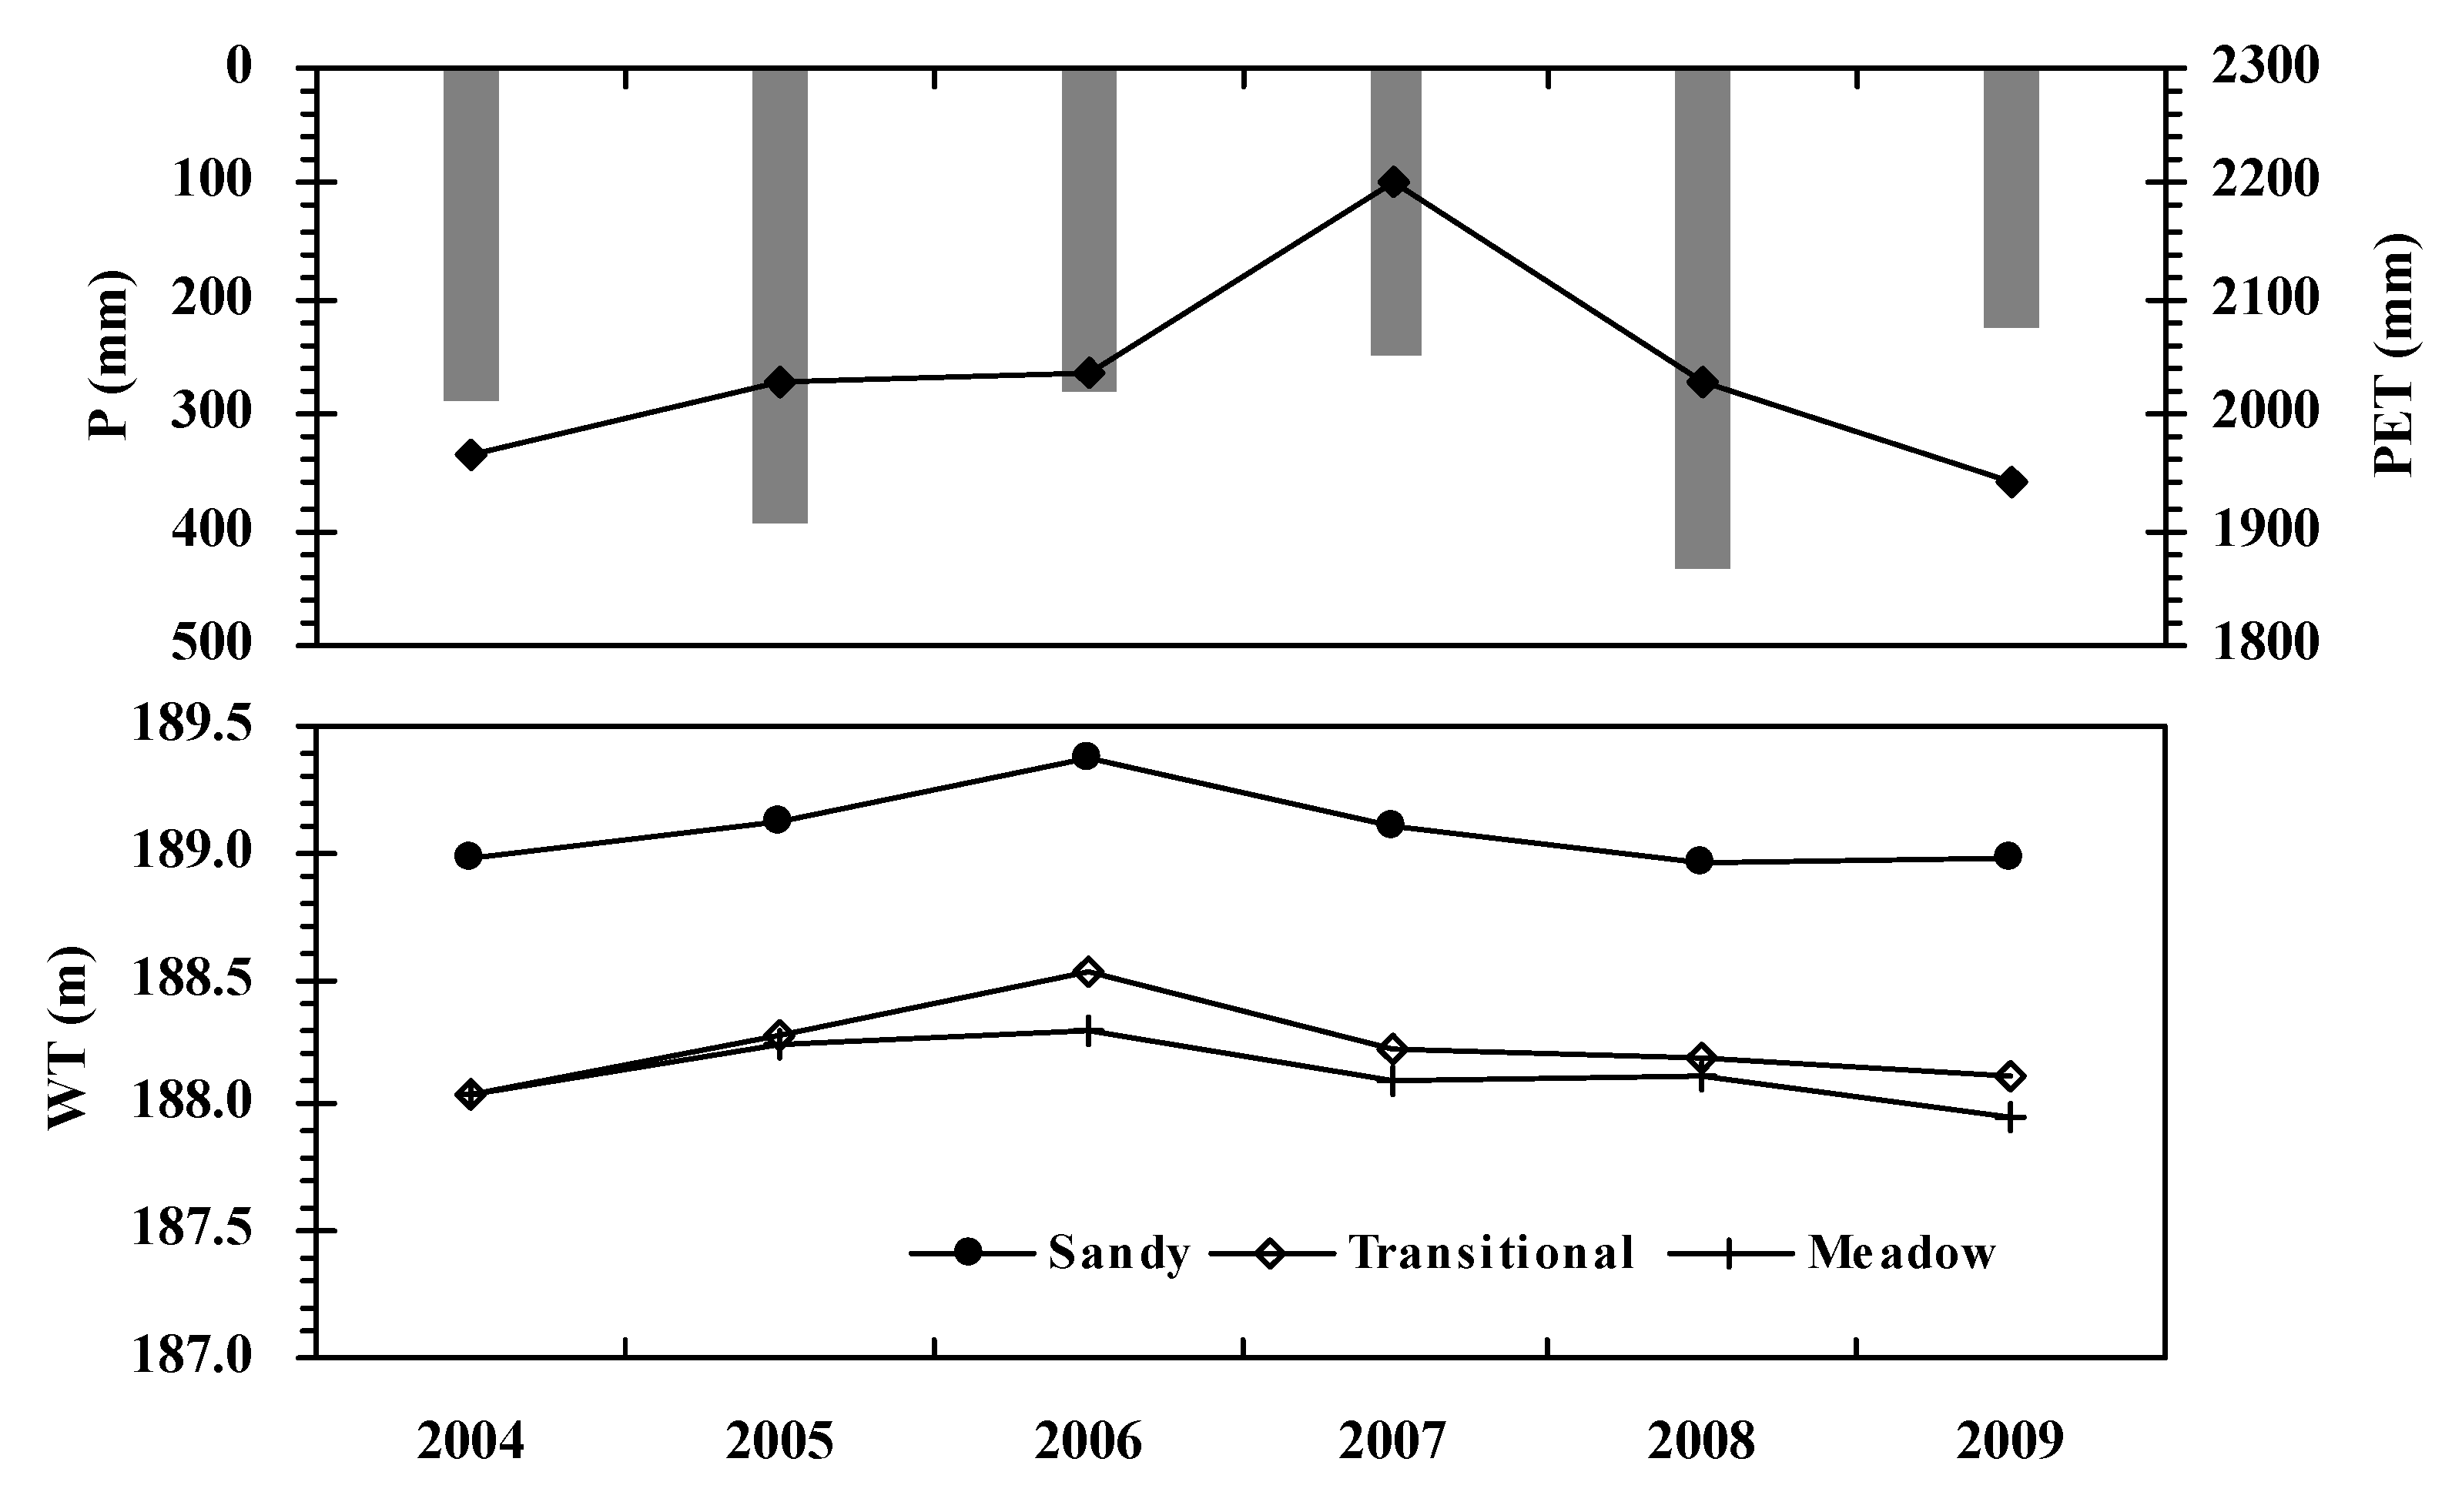
3.2. Water Table Temporal Trends

For any given water year, the mean annual water table depended on both the precipitation and PET (Figure 3). Regardless of the land cover, the water table was gradually rising before 2006 as a result of moderately high precipitation and low PET, but it started to decline after that year because the abnormally large PET (>2200 mm) in 2007 depleted soil water and thus resulted in greater-than-normal soil storage in the subsequent years. This result was consistent with those of previous studies [48,49], which reported that the resulting increase in the soil storage tended to diminish with the replenishment of infiltrated water to the aquifer. However, the unusually high precipitation (≈450 mm) in 2008 led to a slight increase (0.08 m) in water table underneath the meadowlands and slowed the decline of the water table underneath the transitional zones as well as the sandy areas. In addition, because of the relatively shallow depth of its water table (<2.0 m), the meadowland exhibited the most sensitive responses to precipitation and PET. The smaller fluctuations in the depth of the water table underneath the other two types of land cover were partially due to the greater depth of the underlying water table (>2.5 m), but the higher permeability (>415 mm·h−1) of the sandier soils in the sandy areas and transitional zones caused a dry topsoil layer to form immediately after a precipitation event that tended to restrict further soil evaporation, allowing more percolation into the aquifer underneath [50,51,52].
Figure 3. Responses of mean annual water table (WT) to cumulative annual precipitation (P) and potential evapotranspiration (PET) for the three land cover types in the study area. The average ground elevation is 212.0 m for the sandy areas (Sandy), 190.0 m for the transitional zones (Transitional), and 188.5 m for the meadowlands (Meadow).
Water 07 05788 g003
The monthly mean water table varied greatly within each water year in response to precipitation and PET for all three land cover types (Figure 4). Throughout the three winter months, the water table consistently exhibited a marginally decreasing trend because precipitation was in the form of snowfall and thus could not replenish the aquifer; PET was also near zero. Throughout the three spring months, snowmelt and additional rainfall tended to raise the water table but this replenishment effect was partially offset by the elevated PET. For the summer months, the water table exhibited an overall decline because PET was at its maximum. The sharp rises in the water table in July of 2005 and 2008 were caused by the large rainfall events that occurred in June 2005 (139 mm) and July 2008 (238 mm). Similarly, in the fall months the water table exhibited an overall decrease, though PET started to decline. This can mainly be attributed to reduced rainfall at this time of year. Because the depths of the water table under the three land cover types are distinctly different, the water table underneath the meadowlands can exhibit quicker responses (i.e., fluctuations) than that underneath the transitional zones, which in turn exhibit more sensitive responses than that underneath the sandy areas.
Figure 4. Responses of mean monthly water table (WT) to cumulative monthly precipitation (P) and potential evapotranspiration (PET) for the three land cover types in the study area. The average ground elevation is 212.0 m for the sandy areas (Sandy), 190.0 m for the transitional zones (Transitional), and 188.5 m for the meadowlands (Meadow).
Water 07 05788 g004

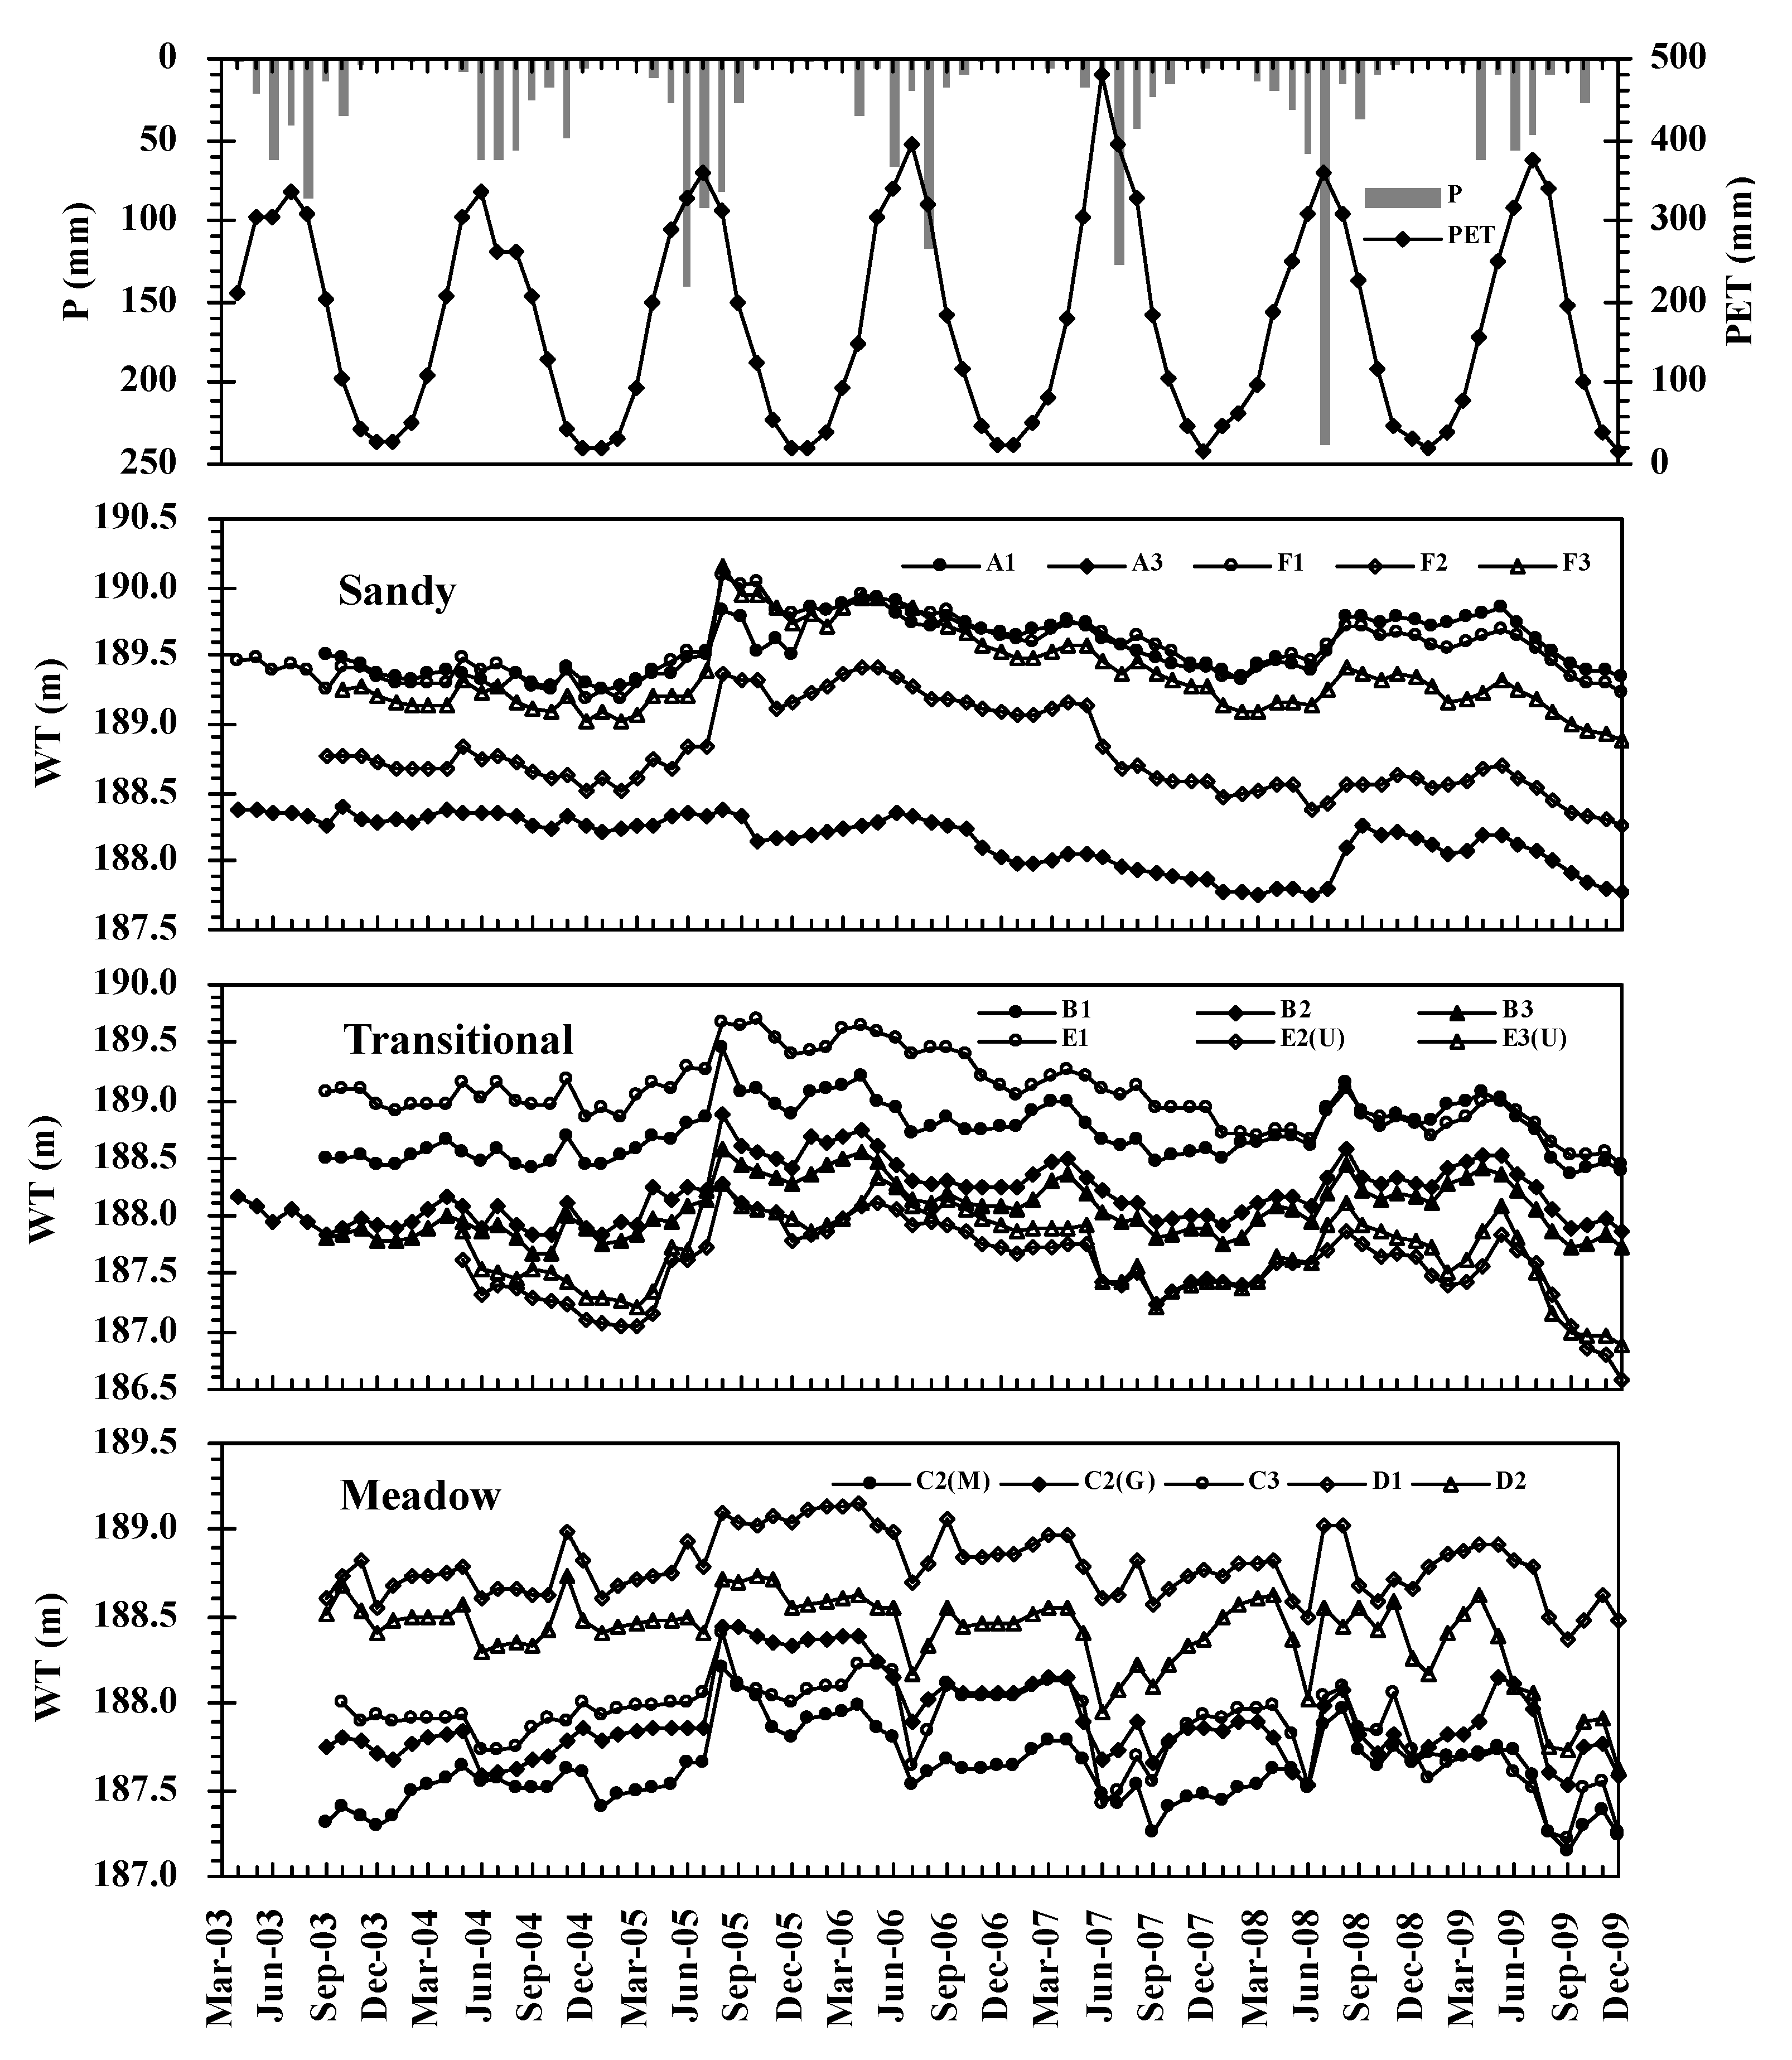
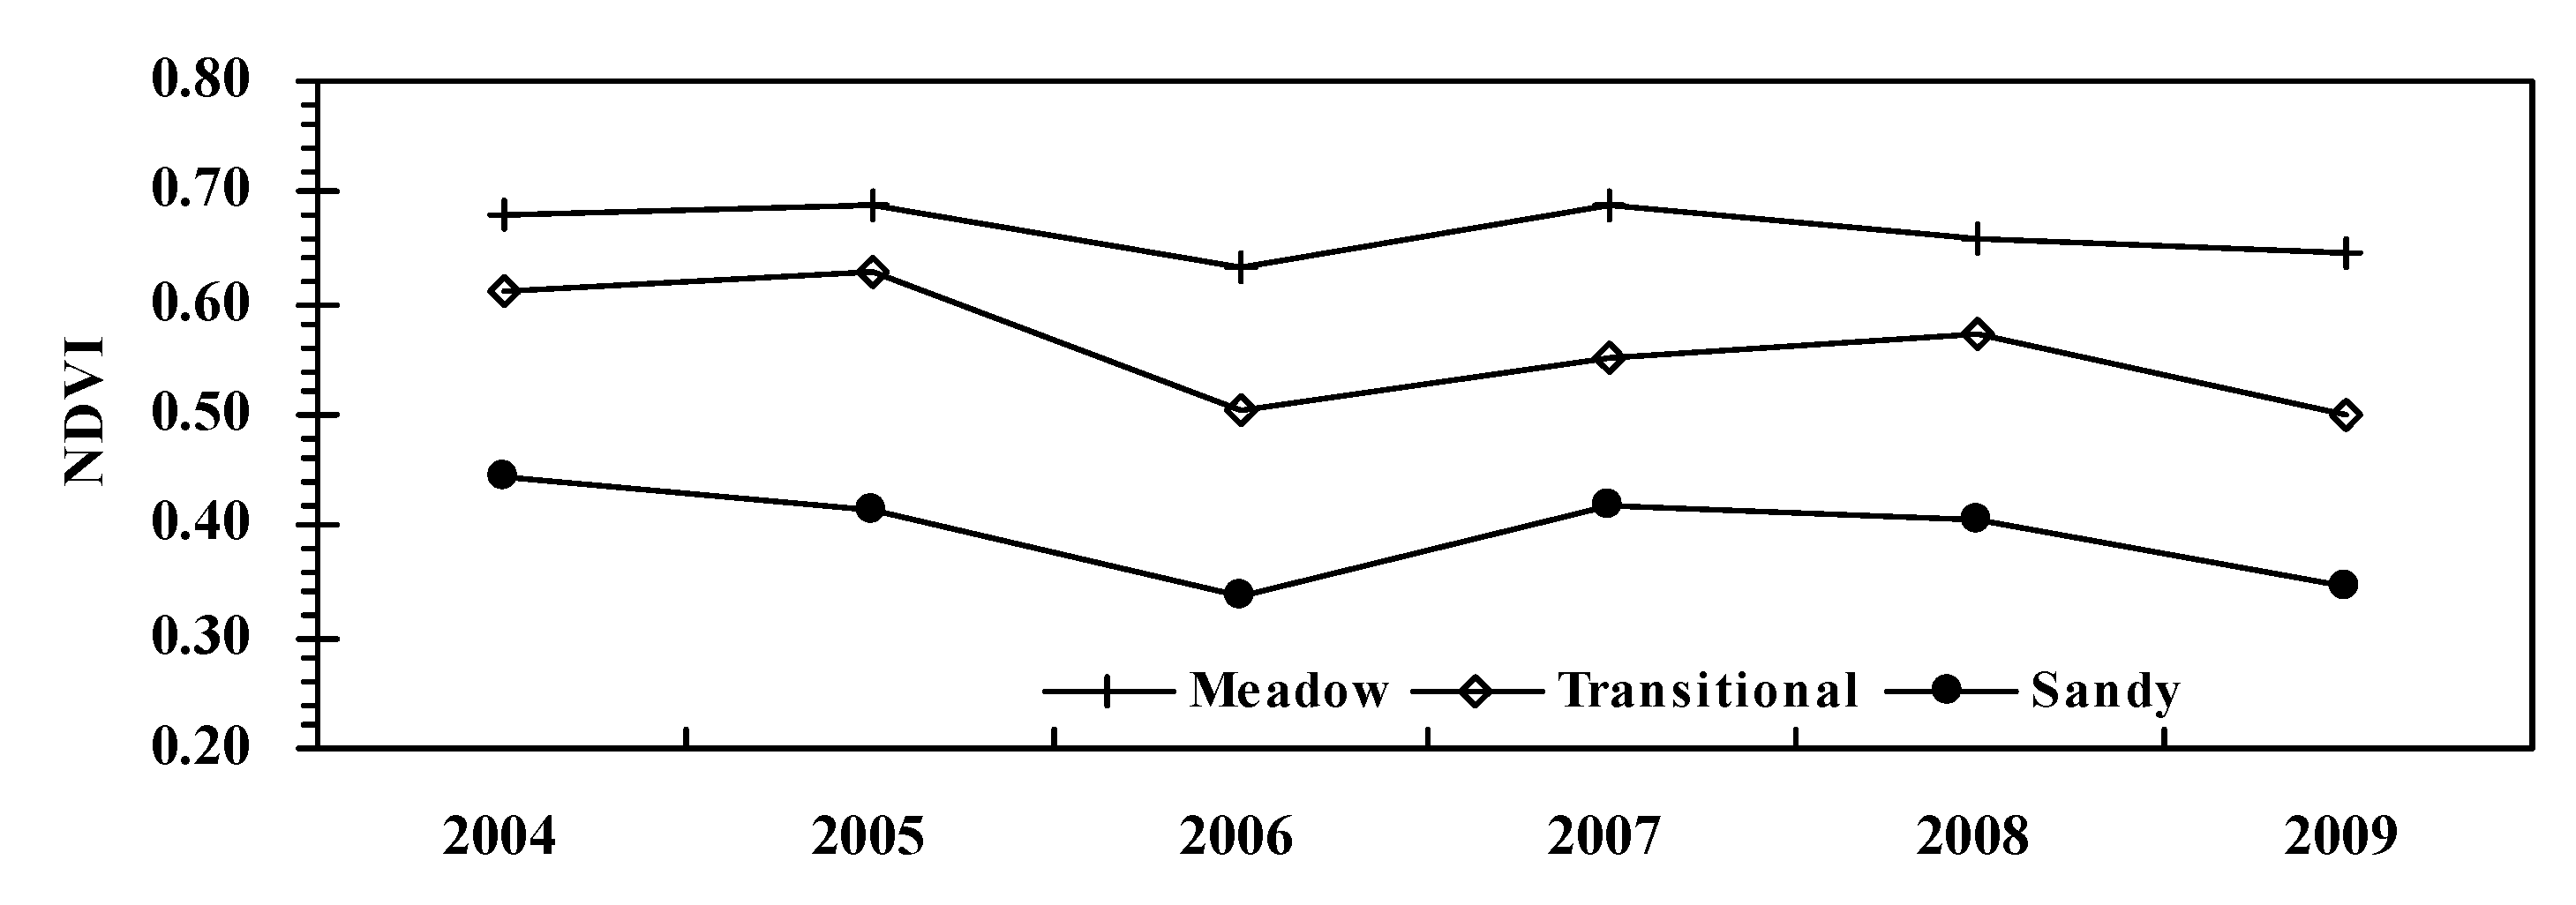
3.3. Effects of Variations in the Water Table Depth on Vegetation

Within the study area, regions where the water table is closer to the surface tended to have a better (i.e., more dense and productive) vegetation cover, as indicated by a larger value for the maximum NDVI (Figure 5). Vegetation cover was highest in the meadowlands, where the depth of the water table was less than 2 m, and worst in the sandy areas, where it was greater than 4 m. Vegetation cover in the transitional zones, where the depth varied from 0.6 m to 3 m, exhibited noticeable spatial variations. These findings are not in agreement with those of earlier researchers [16,18] because riparian zones and areas that are further away from waterways are governed by distinctly different groundwater cycling mechanisms [53].
Figure 5. Map showing the contours of annual mean annual depth to water table and the annual mean maximum Normalized Difference Vegetation Index (NDVI) grids. A contour interval of 0.2 m was used for depths of less than 2 m, an interval of 1 m for depths between 3 and 8 m, and an interval of 2 m for depths greater than 8 m.
Water 07 05788 g005
Across the meadowlands in the southeastern part of the study area, the water table was only up to 1.4 m below the surface and was thus covered by well-developed vegetation, as indicated by a value for the maximum NDVI of 0.7 or larger. However, toward the northwest and east of the area the vegetation deteriorated markedly, as indicated by the decreasing NDVI, because the increasing depth of the water table in these areas tended to limit the amount of groundwater available for vegetation transpiration [15,16]. Another possible explanation is that intensive human activities (e.g., farming) have destroyed the natural vegetation in these areas, resulting in a poorer vegetation cover. The impacts of these human activities can be seen most clearly in the eastern region, where although the depth of the water table was less than 1.4 m there was only a fairly-developed vegetation cover with a maximum NDVI of 0.5 to 0.6. The meadowlands in the south, which lie alongside the lake (Figure 5), had a water table depth of less than 0.8 m but a moderately poor or fair vegetation cover (maximum NDVI = 0.4 to 0.6). This is because soils in this region, is subjected to frequent inundation and soil erosion and salinization as a result of major fluctuations in the lake water surface level.
Across the sandy dunes, vegetation cover exhibited fewer spatial patterns, as indicated by the smaller variations (0.2 to 0.4) in the maximum NDVI (Figure 5). This can partially be attributed to the depth of the water table in this region was too deep (>4 m) for to exert a direct influence on vegetation development [15]. Similarly, because the water table in the upper transitional zone was more than 2 m deep, the vegetation cover across this zone exhibited slight variations only. In contrast, the vegetation cover across the lower transitional zone, where the depth of the water table was less than 2 m, exhibited a noticeable spatial pattern from the east to the west, with the maximum NDVI rising from 0.4 to 0.5 in the east to 0.6 in the west.
For every region within the study area, vegetation cover, as measured by maximum NDVI, varied from year to year (Figure 6). A multiple regression analysis revealed that the temporal variation was statistically correlated (R2 > 0.99) on the depth of the water table, precipitation, and PET. The depth of the water table explained 42%, 38%, and 7% of the variations presented by the maximum NDVI for meadowlands, transitional zones, and sandy dunes, respectively, while PET explained 25%, 7%, and 30%, respectively. Precipitation explained 3%, 17%, and 8% of the variations for meadowlands, transitional zones, and sandy dunes, respectively. These results imply that fluctuations in the water table are more significant for vegetation in the meadowlands than in the transitional zones, and have the least impact on vegetation in the sandy dunes because of the deep water table underneath them. Climate, represented in this study by PET, exerted a more direct influence on vegetation in the meadowlands and sandy dunes than in the transitional zones. This is probably because the relationship between PET and actual transpiration was weak at water table depths of 0.8 m to 2.0 m such as those found in the transitional zones [16]. The relatively low influence of precipitation for the meadowlands can be attributed to the fact that the already high water table in this region made groundwater always available for vegetation transpiration. In contrast, precipitation significantly increased the soil moisture in the thick dry soil profiles of the transitional zones and sandy dunes, thus enhancing the relationship between PET and actual transpiration. As a result, precipitation had a more direct influence on vegetation in these latter two regions.
Figure 6. Plot showing mean annual values for maximum Normalized Difference Vegetation Index (NDVI) averaged across the meadowlands (Meadow), the transitional zones (Transitional), and the sandy dunes (Sandy) in the study area.
Water 07 05788 g006

4. Conclusions

This study examined spatio-temporal variations in the depth of the water table beneath a 9.71 km2 area within the semiarid Horqin Sandy Land located in northern China using data collected from 2003 to 2009, Landsat 4-5 TM and MODIS images, and meteorological data from the Tongliao station. The investigation was implemented by cross-comparing various visualization plots and contour maps and utilizing a simple regression analysis. The results indicated that for the study area, the spatial patterns in the fluctuations in the depth of the water table were mainly controlled by the local topography, localized geological settings, and human activities, while the temporal trends primarily depended on precipitation and PET. As a result of long-term reclamation for agriculture, (for example, at site C2(M)), the water table was 0.3 m lower than that underneath adjacent areas (in this case, site C2(G)) where human disturbance was minimal. Within the study area, a region where the water table was closer to the surface tended to have better (i.e., more dense and productive) vegetation cover, as indicated by a higher value (>0.7) for maximum NDVI. Furthermore, our results also revealed that vegetation development was statistically correlated (R2 > 0.99) with the depth of the water table, precipitation, and PET. In particular, the depth of the water table explained 42%, 38%, and 7% of the variations presented by the maximum NDVI for meadowlands, transitional zones, and sandy dunes, respectively. This implies that vegetation is more sensitive to fluctuations in the depth of the water table in the meadowlands than in the transitional zones, and least sensitive in the sandy dunes.

Acknowledgments

This research was financially supported by the National Natural Science Foundation of China under contracts #51139002 and #51369016, the Ministry of Education Innovative Research Team under contract #IRT13069 and the Excellent Young Scientist Foundation of Inner Mongolia Agricultural University of China under contract #2014XYQ-11.

Author Contributions

This research article is part of the Ph.D. thesis of the first author, Limin Duan. Therefore, he is responsible for the research design, fieldwork, data analysis, and write-up. Tingxi Liu and Xixi Wang are the supervisors of this Ph.D. work. Yanyun Luo supported part of the MODIS and hydro-climatic data collection and is responsible for fieldwork.

Conflicts of Interest

The authors declare no conflict of interest.

References

  1. Maitre, D.C.; Scott, D.F.; Colvin, C. A review of information on interactions between vegetation and groundwater. Water SA 1999, 25, 137–152. [Google Scholar]
  2. Wang, P.; Zhang, Y.; Yu, J.; Fu, G.; Ao, F. Vegetation dynamics induced by groundwater fluctuations in the lower Heihe River Basin, northwestern China. J. Plant Ecol. 2011, 4, 77–90. [Google Scholar] [CrossRef]
  3. Allison, G.B.; Hughes, M.W. The use of natural tracers as indicators of soil-water movement in a temperate semi-arid region. J. Hydrol. 1983, 60, 157–173. [Google Scholar] [CrossRef]
  4. Johnston, C.D. Preferred water flow and localised recharge in a variable regolith. J. Hydrol. 1987, 94, 129–142. [Google Scholar] [CrossRef]
  5. Burch, G.J.; Moore, I.D.; Burns, J. Soil hydrophobic effects on infiltration and catchment runoff. Hydrol. Proc. 1989, 3, 211–222. [Google Scholar] [CrossRef]
  6. Scott, D.F. The influence of eucalypts on soil wettability. In Proceedings of the IUFRO Symposium on Intensive Forestry: The Role of Eucalypts, Durban, South Africa, 2–6 September 1991; Schonau, A.P.G., Ed.; pp. 1044–1056.
  7. Musto, J.W. Changes in Soil Physical Properties and Related Hydraulic Characteristics Caused by Eucalyptus Plantations. Master’s Thesis, University of Natal, Pietermaritzburg, South Africa, 1994. [Google Scholar]
  8. Mahoney, J.M.; Rood, S.B. Response of a hybrid poplar to water table decline in different substrates. For. Ecol. Manag. 1992, 54, 141–156. [Google Scholar] [CrossRef]
  9. Robbins, B.D.; Bell, S.S. Dynamics of a subtidal seagrass landscape: Seasonal and annual change in relation to water depth. Ecology 2000, 81, 1193–1205. [Google Scholar] [CrossRef]
  10. Munoz-Reinoso, J.C. Vegetation changes and groundwater abstraction in SW Doñana, Spain. J. Hydrol. 2001, 242, 197–209. [Google Scholar] [CrossRef]
  11. Riis, T.; Hawes, I. Relationships between water level fluctuations and vegetation diversity in shallow water of New Zealand lakes. Aquat. Bot. 2002, 74, 133–148. [Google Scholar] [CrossRef]
  12. Huang, F.; Wang, P.; Liu, X. Monitoring vegetation dynamic in Horqin Sandy Land from SPOT Vegetation Time series imagery. Int. Arch. Photogramm. Remote Sens. Spat. Inf. Sci. 2008, XXXVII, 915–920. [Google Scholar]
  13. Cuomo, V.; Lanfredi, M.; Lasaponara, R.; Macchiato, M.F.; Simoniello, T. Detection of inter-annual variation of vegetation in middle and southern Italy during 1985–1999 with 1 km NOAA AVHRR. J. Geophys. Res. 2001, 106, 17863–17876. [Google Scholar] [CrossRef]
  14. Hope, A.S.; Boynton, W.L.; Stow, D.A.; Douglas, D.C. Inter-annual growth dynamics of vegetation in the Kuparuk River watershed based on the normalized difference vegetation index. Int. J. Remote Sens. 2003, 24, 3413–3425. [Google Scholar] [CrossRef]
  15. Stow, D.; Hope, A.; McGuire, D.; Verbyla, D.; Gamon, D. Remote sensing of vegetation and land-cover change in Arctic tundra ecosystems. Remote Sens. Environ. 2004, 89, 281–308. [Google Scholar] [CrossRef]
  16. Cui, Y.; Shao, J. The role of groundwater in arid/semiarid ecosystems, Northwest China. Ground Water 2005, 43, 471–477. [Google Scholar] [CrossRef] [PubMed]
  17. Hao, X.; Li, W.; Huang, X.; Zhu, C.; Ma, J. Assessment of the groundwater threshold of desert riparian forest vegetation along the middle and lower reaches of the Tarim River, China. Hydrol. Process. 2010, 24, 178–186. [Google Scholar] [CrossRef]
  18. Stromberg, J.C.; Tiller, R. Effect of groundwater decline on riparian vegetation of semiarid region: The San Pedro, Arizona. Ecol. Appl. 1996, 61, 113–131. [Google Scholar] [CrossRef]
  19. Horton, J.L. Physiological response to groundwater depth varies among species and with river flow regulation. Ecol. Appl. 2001, 11, 1046–1059. [Google Scholar] [CrossRef]
  20. Miller, G.R.; Chen, X.; Rubin, Y.; Ma, S.; Baldocchi, D.D. Groundwater uptake by woody vegetation in a semiarid oak savanna. Water Resour. Res. 2010, 46, W10503.1–W10503.14. [Google Scholar] [CrossRef]
  21. Duan, L.; Liu, T.; Wang, X.; Wang, G.; Ma, L.; Luo, Y. Spatio-temporal variations in soil moisture and physicochemical properties of a typical semiarid sand-meadow-desert landscape as influenced by land use. Hydrol. Earth Syst. Sci. 2011, 15, 1865–1877. [Google Scholar] [CrossRef]
  22. Zhu, Z.; Chen, G. Sandy Desertification in China; Science Press: Beijing, China, 1994. [Google Scholar]
  23. Guan, W.; Zeng, W.; Jiang, F. Ecological studies on the relationship between the process of desertification and vegetation dynamics in the west of Northeast China: Community diversity and desertification process. Acta Ecol. Sin. 2000, 20, 93–98. (In Chinese) [Google Scholar]
  24. Zhao, H.; Zhao, X.; Zhang, T.; Wu, W. Desertification Processes and Its Restoration Mechanisms in the Horqin Sand Land; China Ocean Press: Beijing, China, 2004. [Google Scholar]
  25. He, S.; Qiu, L.; Jiang, D.; Lamusa, A.; Liu, Z.; Luo, Y. Sand-fixing effects of Caragana microphylla shrub in Horqin Sandy. Front. For. China 2008, 3, 31–35. (In Chinese) [Google Scholar] [CrossRef]
  26. Wang, G. Simulation Analysis for Water Transforming Based on Field Test for GSPAC System in Dune-Meadow-Dune Area in Horqin Sand. Ph. D. Thesis, Inner Mongolia Agricultural University, Hohhot, China, 2008. [Google Scholar]
  27. Van Rooyen, A.F. Combating desertification in the southern Kalahari: Connecting science with community action in South Africa. J. Arid Environ. 1998, 39, 285–297. [Google Scholar] [CrossRef]
  28. Dey, S.; Tripathi, S.N.; Singh, R.P.; Holben, B.N. Influence of dust storms on the aerosol optical properties over the Indo-Gangetic basin. J. Geophys. Res. 2004, 109, D20211. [Google Scholar] [CrossRef]
  29. Portnov, B.A.; Safriel, U.N. Combating desertification in the Negev: Dryland agriculture vs. dryland urbanization. J. Arid Environ. 2004, 56, 659–680. [Google Scholar] [CrossRef]
  30. Takemi, T. Explicit simulations of convective-scale transport of mineral dust in severe convective weather. J. Meteorol. Soc. Jpn. 2005, 83A, 187–203. [Google Scholar] [CrossRef]
  31. Gries, D.; Zeng, F.; Foetzki, A.; Arndt, S.K.; Bruelheide, H.; Thomas, F.M.; Zhang, X.; Runge, M. Growth and water relations of Tamarix ramosissima and Populus euphratica on Taklamakan desert dunes in relation to depth to a permanent water table. Plant Cell Environ. 2003, 26, 725–736. [Google Scholar] [CrossRef]
  32. Hipondoka, M.H.T.; Araniba, J.N.; Chirara, C.; Lihavha, M.; Macko, S.A. Vertical distribution of grass and tree roots in arid eco-systems of Southern Africa: Niche differentiation of competition. J. Arid Environ. 2003, 54, 319–325. [Google Scholar] [CrossRef]
  33. Lamontagne, S.; Cook, P.G.; O’Grady, A.; Eamus, D. Groundwater use by vegetation in a tropical savanna riparian zone (Daly River, Australia). J. Hydrol. 2005, 310, 280–293. [Google Scholar] [CrossRef]
  34. Liu, D.; Tian, F.; Hu, H.; Lin, M.; Cong, Z. A groundwater-vegetation interaction model for assessing the impacts of water transfer on ecological restoration in the lower Tarim River. In Proceedings of American Geophysical Union Fall Meeting 2010, San Francisco, CA, USA, 13–17 December 2010.
  35. Ma, L.; Liu, T. Relationship between vegetation ecotypes and groundwater with Horqin Sandy Land. J. Desert Res. 2007, 27, 55–59. (In Chinese) [Google Scholar]
  36. Wu, Y.; Liu, T.; Paula, P.; Duan, L.; Luis, S.P. Water use by a groundwater dependent maize in a semi-arid region of Inner Mongolia: Evapotranspiration partitioning and capillary rise. Agric. Water Manag. 2015, 152, 222–232. [Google Scholar] [CrossRef]
  37. Selle, B.; Thayalakumaran, T.; Morris, M. Understanding salt mobilization from an irrigated catchment in south-eastern Australia. Hydrol. Proc. 2010, 24, 3307–3321. [Google Scholar] [CrossRef]
  38. Runyan, C.W. Ecohydrological feedbacks between salt accumulation and vegetation dynamics: Role of vegetation-groundwater interactions. Water Resour. Res. 2010, 46. [Google Scholar] [CrossRef]
  39. Wang, T.; Zhu, Z.; Wu, W. Sandy desertification in the North of China. Sci. China Ser. D 2002, 45, 23–34. [Google Scholar] [CrossRef]
  40. Wang, X.; Oenema, O.; Hoogmoed, W.B.; Perdok, U.D.; Cai, D. Dust storm erosion and its impact on soil carbon and nitrogen losses in Northern China. Catena 2006, 66, 221–227. [Google Scholar] [CrossRef]
  41. Bagan, H.; Takeuchi, W.; Kinoshita, T.; Bao, Y.; Yamagata, Y. Land cover classification and change analysis in the Horqin Sandy Land from 1975 to 2007. IEEE J. Sel. Top. Appl. Earth Obs. Remote Sens. 2010, 3, 168–177. [Google Scholar] [CrossRef]
  42. Vasvári, V. Calibration of tipping bucket rain gauges in the Graz urban research area. Atmos. Res. 2005, 77, 18–28. [Google Scholar] [CrossRef]
  43. Liu, C.; Zhang, X.; Zhang, Y. Determination of daily evaporation and evapotranspiration of winter wheat and maize by large-scale weighing lysimeter and micro-lysimeter. Agric. For. Meteorol. 2002, 111, 109–120. [Google Scholar] [CrossRef]
  44. Michalsky, J.J. Comparison of a national weather service Foster sunshine recorder and the World Meteorological Organization standard for sunshine duration. Sol. Energy 1992, 48, 133–141. [Google Scholar] [CrossRef]
  45. Monteith, J.L. Evaporation and environment. In State and Movement of Water in Living Organisms, Proceedings of the 19th Symposium of the Society of Experimental Biology, Swansea, UK, 8–12 September 1964; Cambridge University Press: Cambridge, UK, 1965; pp. 205–234. [Google Scholar]
  46. Adeboye, O.B.; Osunbitan, J.A.; Adekalu, K.O.; Okunade, D.A. Evaluation of FAO-56 Penman-Monteith and temperature based models in estimating reference evapotranspiration using complete and limited data: Application to Nigeria. Agric. Eng. Int. CIGR J. 2009, 6, 1–25. [Google Scholar]
  47. Jia, K.; Liu, T.; Lei, H.; Duan, L. Lake evolution and effect analysis of meadow-dune area in the Horqin Sandy Land. J. Desert Res. 2015, 35, 1–9. (In Chinese) [Google Scholar]
  48. Yang, Y.; Ling, Q.; Wang, S.; Xu, S. Transformation between soil water and groundwater in the middle region of Dagu River. Acta Pedol. Sin. 2015, 15, 547–557. (In Chinese) [Google Scholar]
  49. Rahardjo, H.; Nio, A.; Leong, E.; Song, N. Effects of groundwater table position and soil properties on stability of slope during rainfall. J. Geotech. Geoenviron. Eng. 2010, 136, 1555–1564. [Google Scholar] [CrossRef]
  50. Ma, L. Study on Surface Environment Changes and the Response Relationships between the Former Changes and Hydrological-Weather Factors in Horqin Sandy Land. Ph. D. Thesis, Inner Mongolia Agricultural University, Hohhot, China, 2007. [Google Scholar]
  51. Mutziger, A.J.; Burt, C.M.; Howes, D.J.; Allen, R.G. Comparison of measured and FAO-56 modeled evaporation from bare soil. J. Irrig. Drain Eng. 2005, 131, 59–72. [Google Scholar] [CrossRef]
  52. Romano, E.; Giudici, M. On the use of meteorological data to assess the evaporation from a bare soil. J. Hydrol. 2009, 372, 30–40. [Google Scholar] [CrossRef]
  53. Brutsaert, W.; Sugita, M. Is Mongolia’s groundwater increasing or decreasing? The case of the Kherlen River basin. J. Hydrol. Sci. 2008, 53, 1221–1229. [Google Scholar] [CrossRef]

