1. Introduction
Growing population is increasing demand for water in many cities. In some arid and semiarid regions, climate change is projected to lead to reduced inflows to surface water reservoirs that have traditionally been the main sources of city water supply [
1,
2,
3,
4]. Municipal water utilities typically face requirements to ensure that customer water demand is satisfied with a prescribed reliability. For example, Water Corporation, the utility serving Perth, Australia has an objective of ensuring that the annual probability of a complete sprinkler ban is less than 0.5%, or a 1 in 200 year occurrence [
5].
Declining, more variable surface water supply and growing demand means that many urban water utilities are contemplating or have already made additional investments in less rain dependent supply sources. For example, Australia’s thirty largest utilities invested $30 billion in new municipal water infrastructure between 2006 and 2012 [
6]. Choosing from a range of possible water supply sources, timings and scales to meet supply reliability criteria cost effectively is challenging. Many supply options are long-lived capital assets and they often involve scale economies favouring large increments of investment. However, unknown future inflows and thus unknown supply reliability from existing surface water reservoirs mean that if the future turns out wetter than anticipated, large capital investments can be underutilised and the full capital plus operating cost of small amounts of water supplied to ensure demand is met reliably may be very large [
7].
This paper evaluates the economics of aquifer injection and banking of climate independent supplies to enable increased use of groundwater during drought when there is a low surface water supply. Another approach to balancing demand and supply pursued in places such as Arizona involves influencing household conservation ethics for example through landscaping changes that lead to reduced water demand [
8]. Conceptually, this water banking strategy would be cost effective because investment can be reduced through a rainfall-independent infrastructure that meets peak demand in drought, but is otherwise left idle. An additional reason to consider storage underground to meet demand during droughts is that evaporative losses from dammed reservoirs can be large in arid and semiarid settings. In contrast in some aquifers, particularly fresh aquifers, there may be potential to store water with little loss [
9].
2. Case Study Area
The case study described is based on Perth, Western Australia where demand for water has outstripped conventional supplies [
10], and surface water inflows to reservoirs are diminishing due to a changing climate. Perth has a population of 1.8 million with 2008 annual consumption of public supply water of 280 Mm
3/year [
11]. Its population is expected to grow to nearly 2.5 million by 2030. The utility providing public water expects demand to grow to between 380 (base case) and 425 Mm
3/year (worst case) by 2030, with actual demand depending on climate driven outdoor consumption growth, success of conservation measures, yard sizes in new housing development and actual population growth [
11].
Water is currently provided from three major sources, surface water storages in the hills located to the east of the metropolitan area, regional aquifers located below the metropolitan area, and seawater desalination plants. An important characteristic of the existing surface water supply is that it is highly variable. Perth has experienced a steep change in climate leading to systematically lower inflows in the past 35 years than the mean of the previous 100 years.
While there have recently been new supply investments, additional investments are still required over the coming decades, and an adaptive plan for these investments over the next ten years has been developed by the Water Corporation [
12]. Much of the focus for future investment in regional water plans is on two sources of rain independent supplies: seawater desalination and water recycling plants. The Water Corporation has developed an innovative strategy of replenishing confined aquifers with recycled water that has been treated to a very high standard [
13] to address an agreed regulatory framework [
14]. The utility would then withdraw more groundwater in times of drought. This would increase aquifer net recharge and net extraction in some years but would not increase cumulative net withdrawal of groundwater. Groundwater replenishment has been trialed and proven feasible at small scale (1.5 Mm
3/year) and it is likely it can be upscaled to large facilities with much lower unit costs.
This analysis investigates the cost effectiveness of groundwater replenishment as a potential future supply. The present analysis is built on readily available data and is a generalised approximation of Water Corporation’s Perth water supply sources and their potential uses, at annual time scale and aggregated at metropolitan area scale. Still we are able to demonstrate significant potential to meet a supply reliability constraint for Perth with less infrastructure investment and at considerably less cost, when replenishing groundwater and increasing withdrawals in drought is part of the supply solution. The paper concludes with a discussion of the relevance of these results for aquifers with different rates of storage loss.
3. Methodology
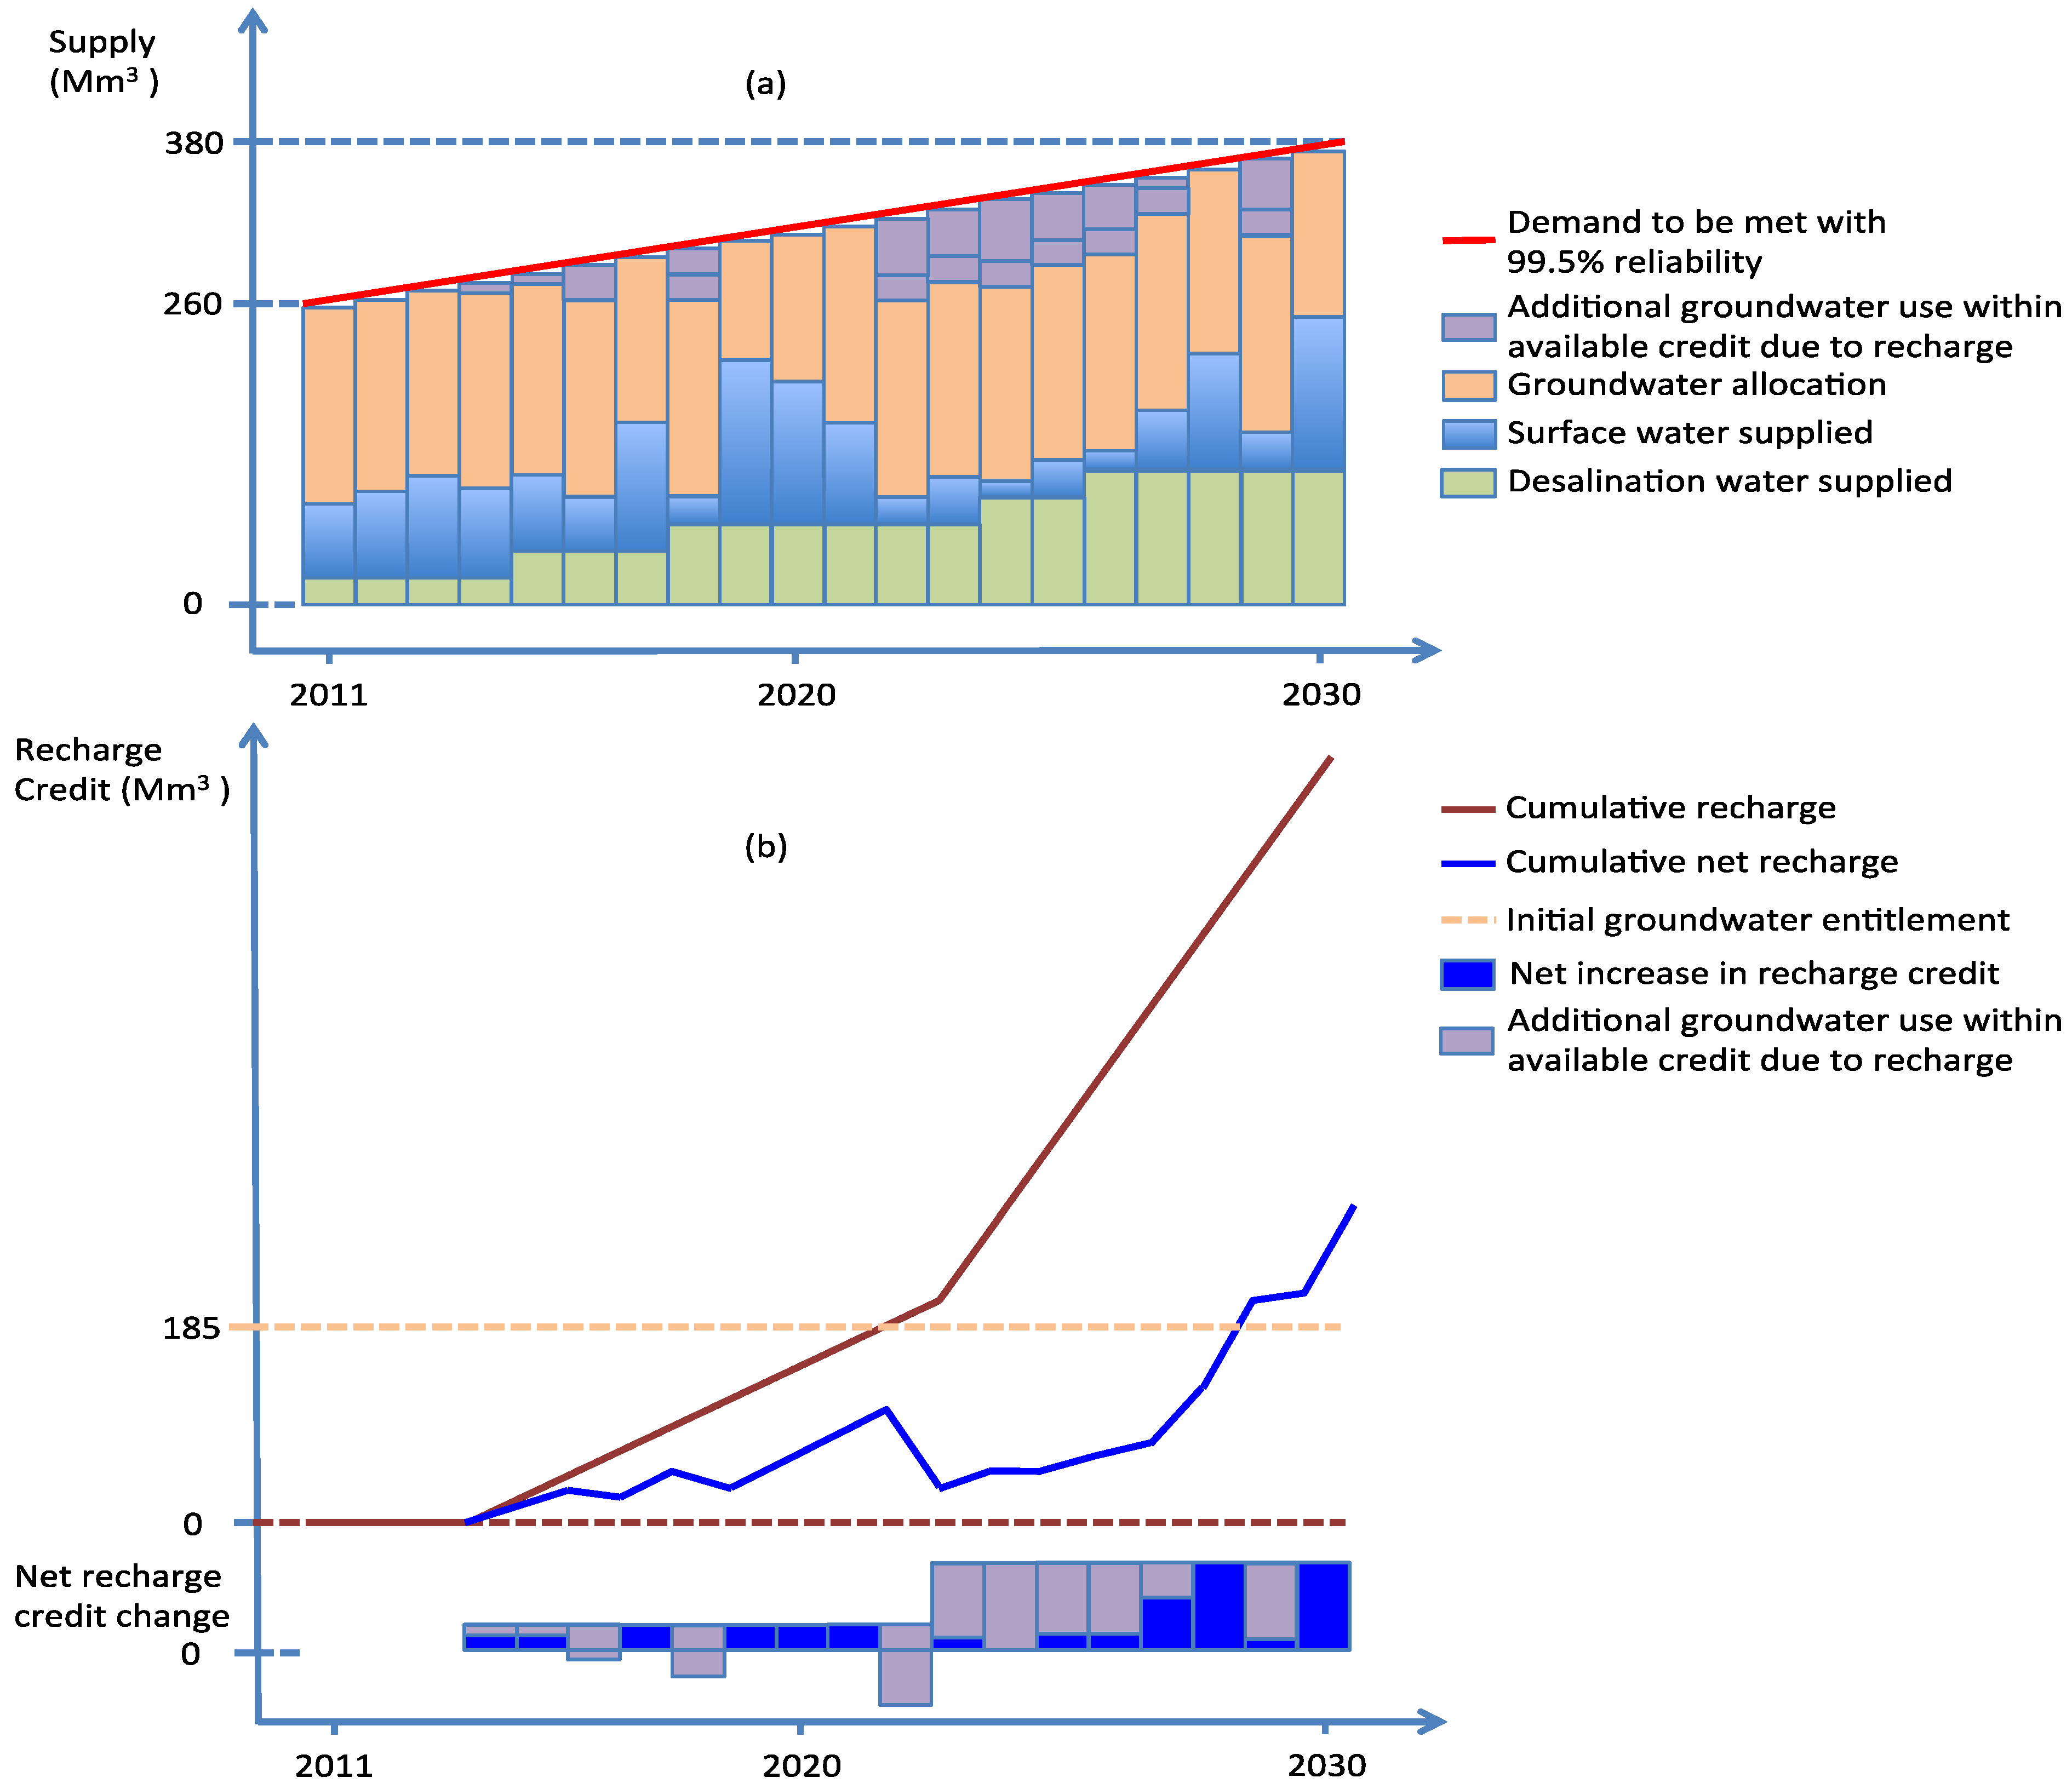
Demand for water in the Perth metropolitan area in 2030 is projected to exceed the recent portfolio of supply (a mix of groundwater, surface water, and seawater desalination), as shown in
Figure 1a. If managed aquifer recharge is used to create sufficient groundwater credit this can be drawn on in dry years to secure the required supply, as shown in
Figure 1a,b as an additional volume to the original groundwater entitlement. Groundwater recharge accumulates through the operation of the installed recharge capacity. The net recharge credit may be discounted annually to allow for losses of recharged water or fresh native groundwater as a consequence of the recharge operation over the losses that would have occurred without it. For example any increase in discharge of groundwater to the ocean due to increased hydraulic gradient attributable to recharge, which would be evaluated for specific recharge proposals, would be included in this depreciation term. In any year, this net recharge credit is diminished by the amount of additional withdrawals to meet water supply shortages over the pre-recharge entitlement.
Modelling was done to simulate two strategies to meet the growth in water demand 2011–2030 and to assess their water supply reliability. Consistent with Water Corporation planning documents we assume that one strategy involves new investments in desalination and in water recycling and water banking. In both treatments groundwater extraction levels in Perth for public water supply are restricted in line with current government regulation. In the without aquifer banking scenario the annual allocated groundwater extraction (120 Mm3/year) is assumed to be constant across years and supply to meet shortfall is dominated by desalination. In the with aquifer banking scenario any installed recharge capacity is used to replenish groundwater and gain accumulated recharge credits to allow additional extraction, when needed, over and above the pre-existing allocated groundwater extraction.
Figure 1.
An example of a portfolio of water supply and corresponding recharge credit: (a) the varying water supply portfolio to meet demand each year (taken from one Monte Carlo simulation; and (b) recharge credit accumulates based on operation of the installed recharge capacity. The net recharge credit available for extraction is the difference between accumulated recharge allowing for depreciation (losses) and accumulated withdrawals to meet water supply shortages.
A Monte Carlo analysis was used to account for variations in the annual amount of surface water available and this depended on inflows in the current and previous years and storage operation rules. In contrast, recycled water and desalinised water can be expected to be available for supply at levels up to plant capacity on a relatively constant basis. Though this is a slight simplification given that plants can experience operational problems or oil spills into ocean water can render a plant unusable for public water supply, these probabilities were considered to be sufficiently small to ignore.
Analysis is a two-step process. The first step is to determine the probability of supply meeting or exceeding demand, for a wide range of possible combinations of levels in investment in desalination and water recycling for groundwater replenishment. The supply, demand comparison algorithm accounted for stochastically varying surface water supply and the dynamics of aquifer water injection, withdrawal, losses and available recharge credits in the with aquifer banking scenario. For each possible combination of investment in desalination and recycling over a period of 20 years, 10,000 Monte Carlo realisations of surface water availability were run to calculate the percentage of the years that demand exceeds supply.
This process of calculating supply reliability is repeated for the “with-” and the “without aquifer banking” scenario. The results along with estimates of the capital and operating cost associated with a set of possible desalination and water recycling investments produce a set of cost and reliability estimates. These are input into an optimisation that solves for the cost minimising combination of investments that meets specified reliability criterion.
4. Case Study Detail
This analysis is built on readily available data and includes no detail of how Water Corporation and Perth water supply is currently configured and operated. As such, the study should be considered a somewhat stylised demonstration of the significant potential to meet a supply reliability with less infrastructure investment and at less cost, when banking is part of a supply solution.
Estimates of current water supply, and projected 2030 demand were extracted from Water Corporation and State Government reports that are readily available. The Water Corporation [
14] estimates 2030 yields from currently existing supply will be 260 Mm
3 in its “base case” planning scenario. It estimates 2030 demand for this scenario at 380 Mm
3 for the 2030 base case. Thus, there is a “gap” of an average of 120 Mm
3 that will have to be filled with new supply investment to meet projected 2030 base case scenario demand.
The stochastic nature of surface water supply was modelled using information from Water Corporation annual reports characterising how much water was actually supplied from surface water storages from 1996 to 2011 [
15]. A key feature of stochastic surface water supply that requires consideration in meaningful planning to reliably meet demand is how supply variability can involve multiple year sequences of relatively dry, normal or wet inflow. The length and duration of dry, normal or wet inflow year sequences are key parameters determining the reliability of surface water supply reliability. This is represented by a Markov process [
16] and assumes the climate regime of each year switches between three states: high, medium and low supply. We model evolution of these state variables as a discrete Markov chain process where one type of supply year is followed by one of the three possible states based on random probability draws. The probabilities of one state following another are defined with a matrix of transition probabilities for each state variable switching to another state. Note that the Markov chain was used to describe the volume of water supplied by reservoirs in successive years, not the volume of inflow to those reservoirs.
Actual observations of volumes of Perth water supplied from reservoirs from 1996 to 2011 were used to define several levels of supply states and the transition probability matrix between states. Ideally, Markov transition models are based on hydrology and storage operating process models backed by long hydrology time series and future improvement of this study could include such modeling. Still the Markov process approach does provide an opportunity to provide evaluation of reliability and cost effectiveness implications of long dry runs.
Reliability of supply was evaluated with all possible combinations of discrete increments of investment in desalination in 25 Mm
3 increments up to 150 Mm
3 of capacity above what now exists and discrete increments 10 Mm
3 capacity to recycle water up to 80 Mm
3. We assume that the capital cost per Mm
3 level of investment in desalination is
ccd $20 million; the capital cost per Mm
3 level of investment in recycling capability is
ccr $15 million; and the operating costs per Mm
3 level of investment in desalination and recycling capability are $0.8 and $0.6 million, respectively based on the Science Matters report [
17]. While it is true that in some circumstances recharge and withdrawal of water can be much less expensive than desalination. For our case study it is only slightly less expensive because in Perth the recharge water is highly treated prior to aquifer injection. Note that detailed modelling of cost per unit desalination is beyond the scope of this study and only flat estimation of cost is used here. We also model three levels of banked aquifer storage credit loss rate: 1%, 5% and 10% per annum. This represents a range of aquifer loss rates from typical small losses seen in slow moving large regional aquifers to much larger loss rates.
5. Results and Discussion
Results are shown below from simulations with- and without aquifer banking at two reliability criteria levels (95% and 99.5%) and for three annual rates of aquifer recharge credit loss. The minimum costs, optimal choices of Mm
3/yr capacity of desalination (
Dopt) and water recycling and aquifer replenishment (
Ropt) and estimated reliabilities (
α) derived from 10,000 simulations for each scenario are summarised in
Table 1.
Table 1.
Minimum costs, optimal choices, and reliabilities under different model scenarios and reliability requirements.
Table 1.
Minimum costs, optimal choices, and reliabilities under different model scenarios and reliability requirements.
| Scenario | Cost (A$M) | Optimal Investment Choices (Mm3/yr) | α |
|---|
| Reliability ≥ 95% |
| With aquifer banking |
| Loss rate = 1% | 1970 | Dopt = 25, Ropt = 50 | 96.51% |
| Loss rate = 5% | 2040 | Dopt = 25, Ropt = 60 | 96.77% |
| Loss rate = 10% | 2110 | Dopt = 25, Ropt = 60 | 95.22% |
| Without aquifer banking |
| | 3150 | Dopt = 125 | 100% |
| Reliability ≥ 99.5% |
| With aquifer banking |
| Loss rate = 1% | 2110 | Dopt = 25, Ropt = 60 | 99.82% |
| Loss rate = 5% | 2170 | Dopt = 25, Ropt = 70 | 99.90% |
| Loss rate = 10% | 2170 | Dopt = 25, Ropt = 70 | 99.57% |
| Without aquifer banking |
| | 3150 | Dopt = 125 | 100% |
The results show that highly reliable water supply to meet Perth 2030 urban demand is possible with or without groundwater banking. However, the level of infrastructure investment required and hence cost to achieve a given reliability can be much reduced when aquifer banking is possible. Both 95% and 99.5% supply reliability can be achieved with between 20 and 30 Mm3 less new water supply infrastructure capacity and at all aquifer loss rates considered. Aquifer banking appears to be a particularly attractive strategy especially when losses from banked storage are low. Estimated savings through water banking over strategies without water banking for a 1% aquifer loss rate, over the 20 year horizon exceed A$1 billion or 37% to 33% of total supply augmentation costs at 95% and 99.5% supply reliability criteria respectively. When the hypothetical recharge credit depreciation rate was increased from 1% p.a. to 10% p.a. savings declined but were still 33% to 31% for the same reliabilities.
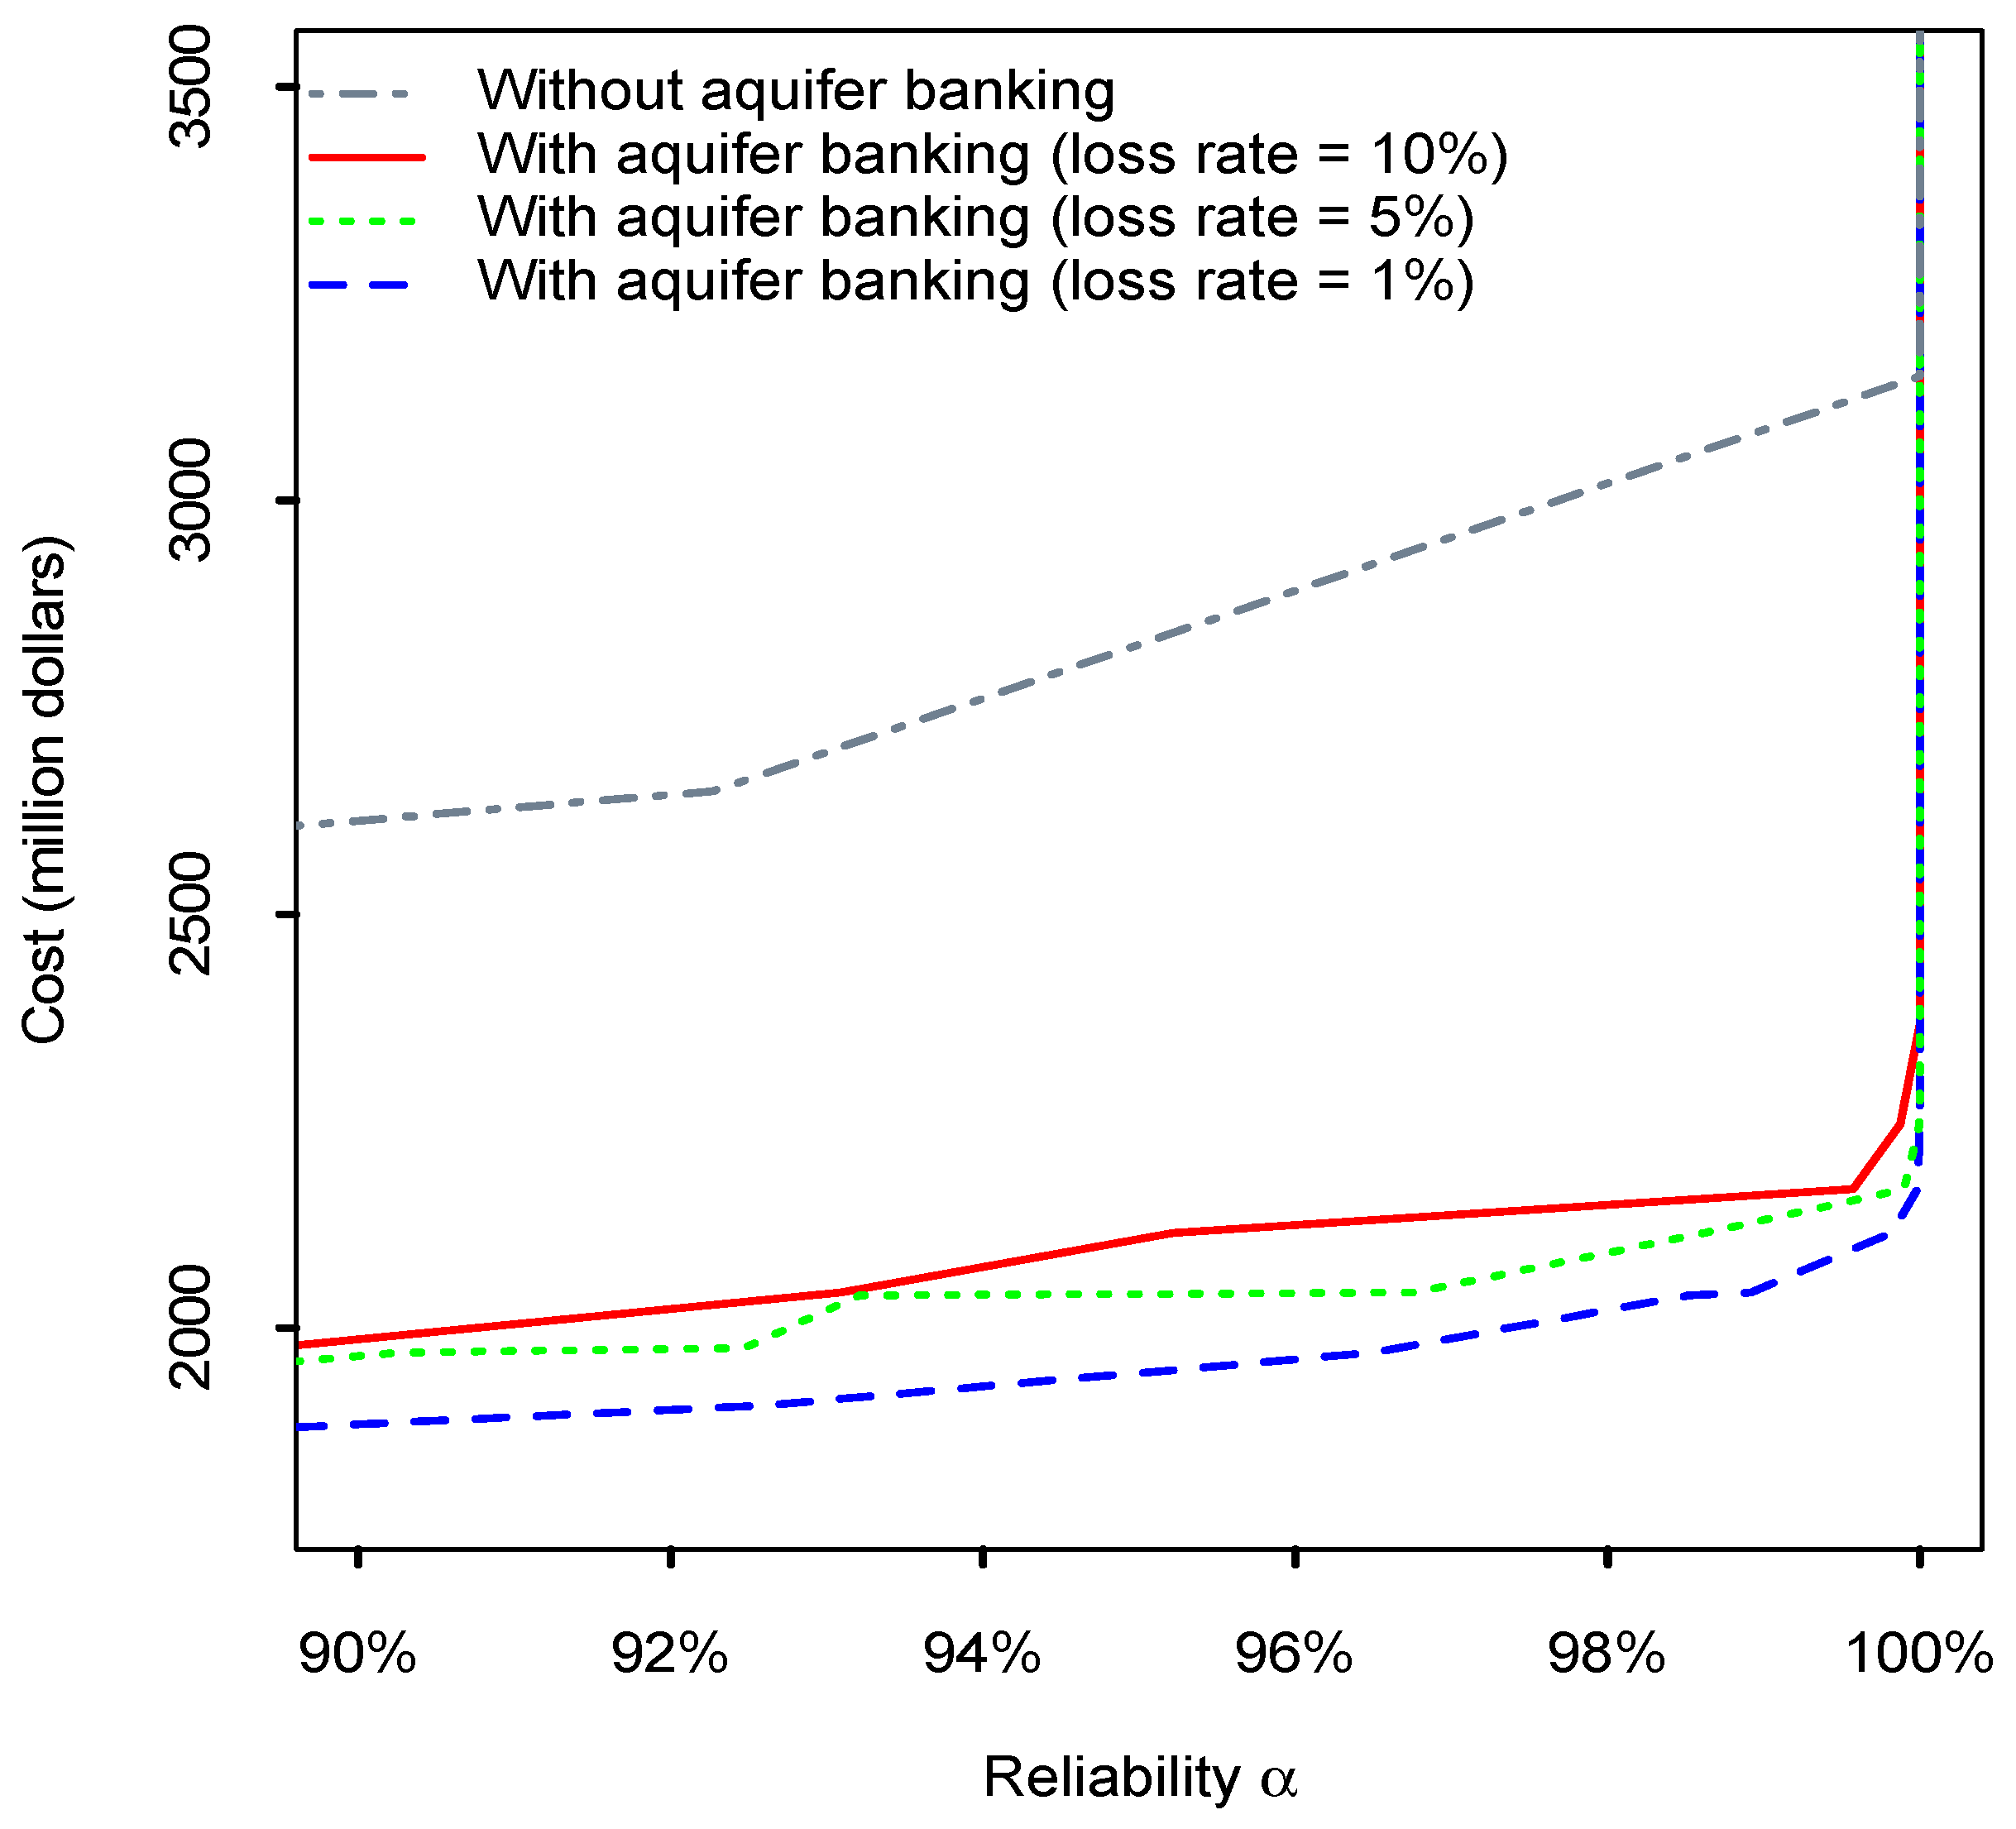
Figure 2 presents the trade-offs between cost and reliability (represented by the optimal pareto fronts) for with- and without aquifer banking scenarios and different rates of banked aquifer storage loss. With lower loss rates, the cost effectiveness advantage of ASR is greater, than with higher loss rates. To provide a certain security level of urban water supply, the aquifer banking scenarios outperform the without banking scenario in terms of cost for any given level of reliability.
Figure 2.
Optimal pareto fronts of different model scenarios for with- and without water banking and showing the effect of rates of storage depreciation between 1% and 10% per annum.
Figure 2.
Optimal pareto fronts of different model scenarios for with- and without water banking and showing the effect of rates of storage depreciation between 1% and 10% per annum.
6. Conclusions
A simplified case study based on Perth, Australia shows that an increasing demand for water can be met at the required reliability with less supply infrastructure and at less cost when it is possible to replenish the local aquifer and build a credit that can be drawn on in drought. This is because without such banking, “supply insurance” must be provided for droughts through infrastructure investments that are only infrequently used to achieve the required high reliability of supply at significantly higher average costs of supply. Hence it is demonstrated here that water banking in aquifers in order to provide drought and emergency supplies or “strategic storage” can provide a relatively low-cost insurance for cities with suitable aquifers. The economic analysis shows that aquifer banking provides greatest cost saving where there is little loss of the aquifer banked water. In aquifers with greater loss rates of stored water, the economics are still attractive compared with solutions that exclude water banking. It should also be noted that there are abstraction constraints that can limit the use of banked water in poor years depending on abstraction capacity. Finally, this study can be considered to be a qualitative demonstration of the potential benefit of groundwater banking; additional detailed analyses would be required to estimate benefits for an actual operational model.


