Hydrological Flood Simulation Using a Design Hyetograph Created from Extreme Weather Data of a High-Resolution Atmospheric General Circulation Model

 ,
,
Abstract
1. Introduction
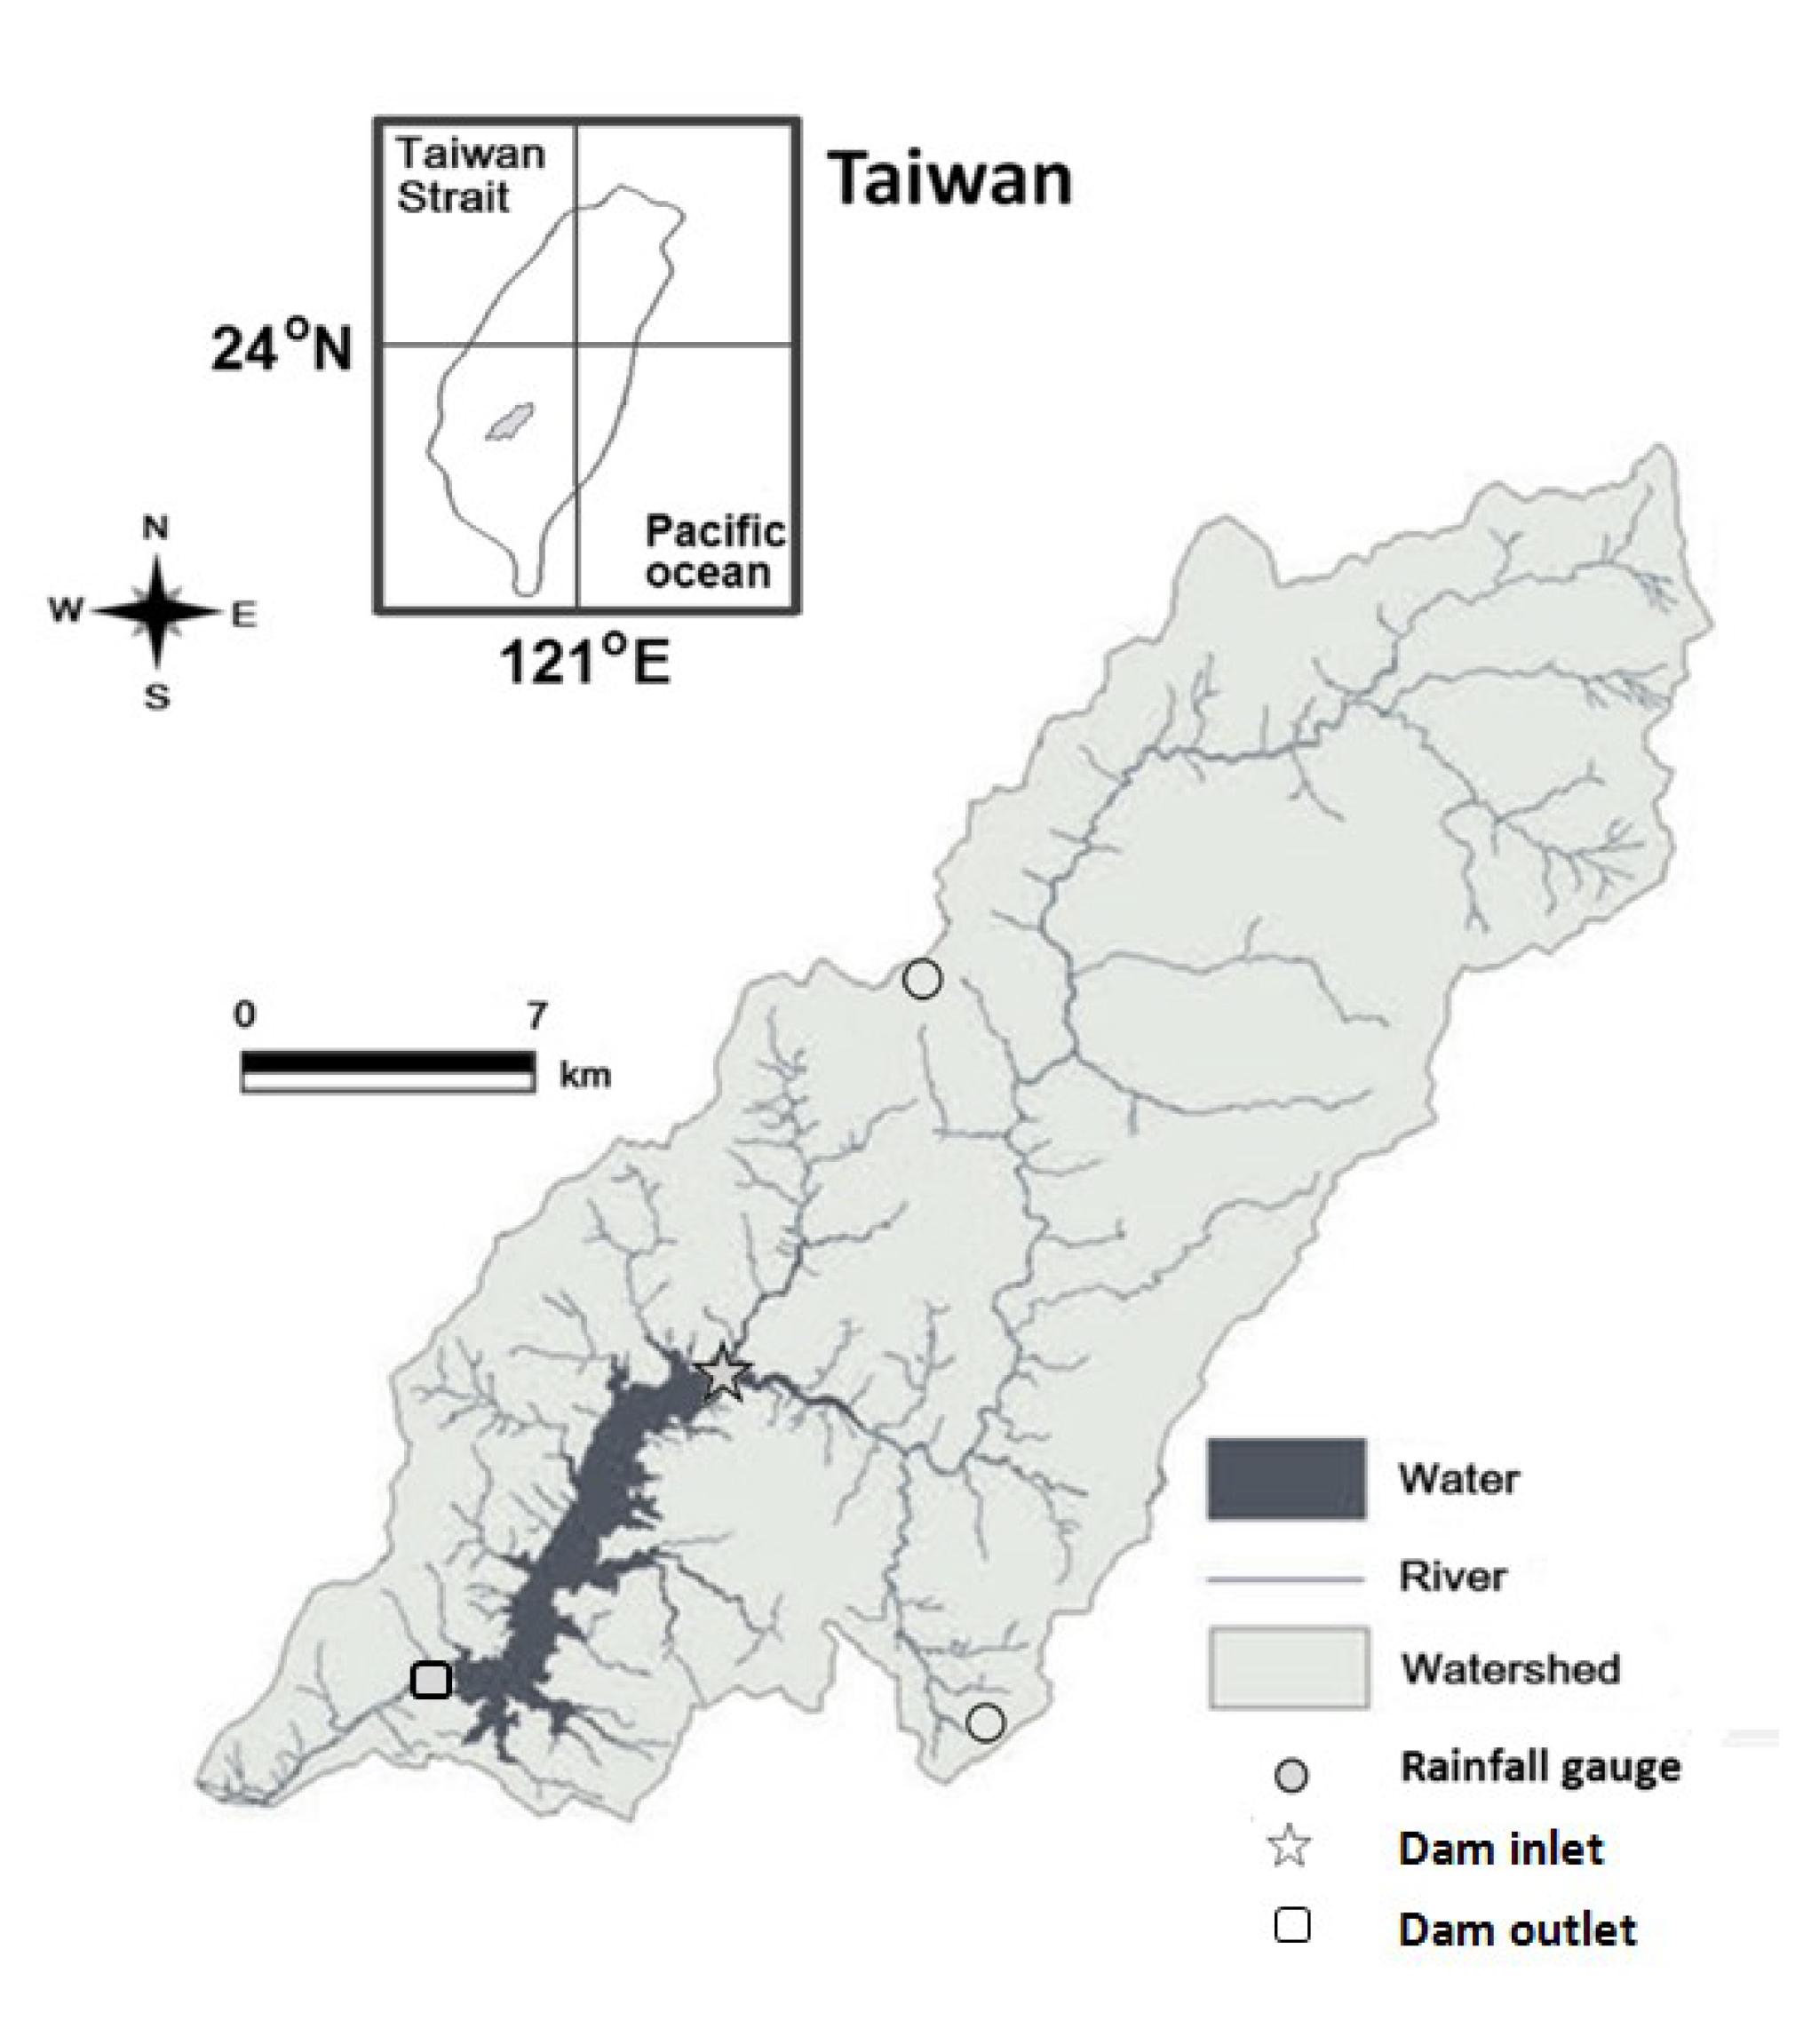
2. Study Site
3. Method
3.1. High Resolution Extreme Weather Data
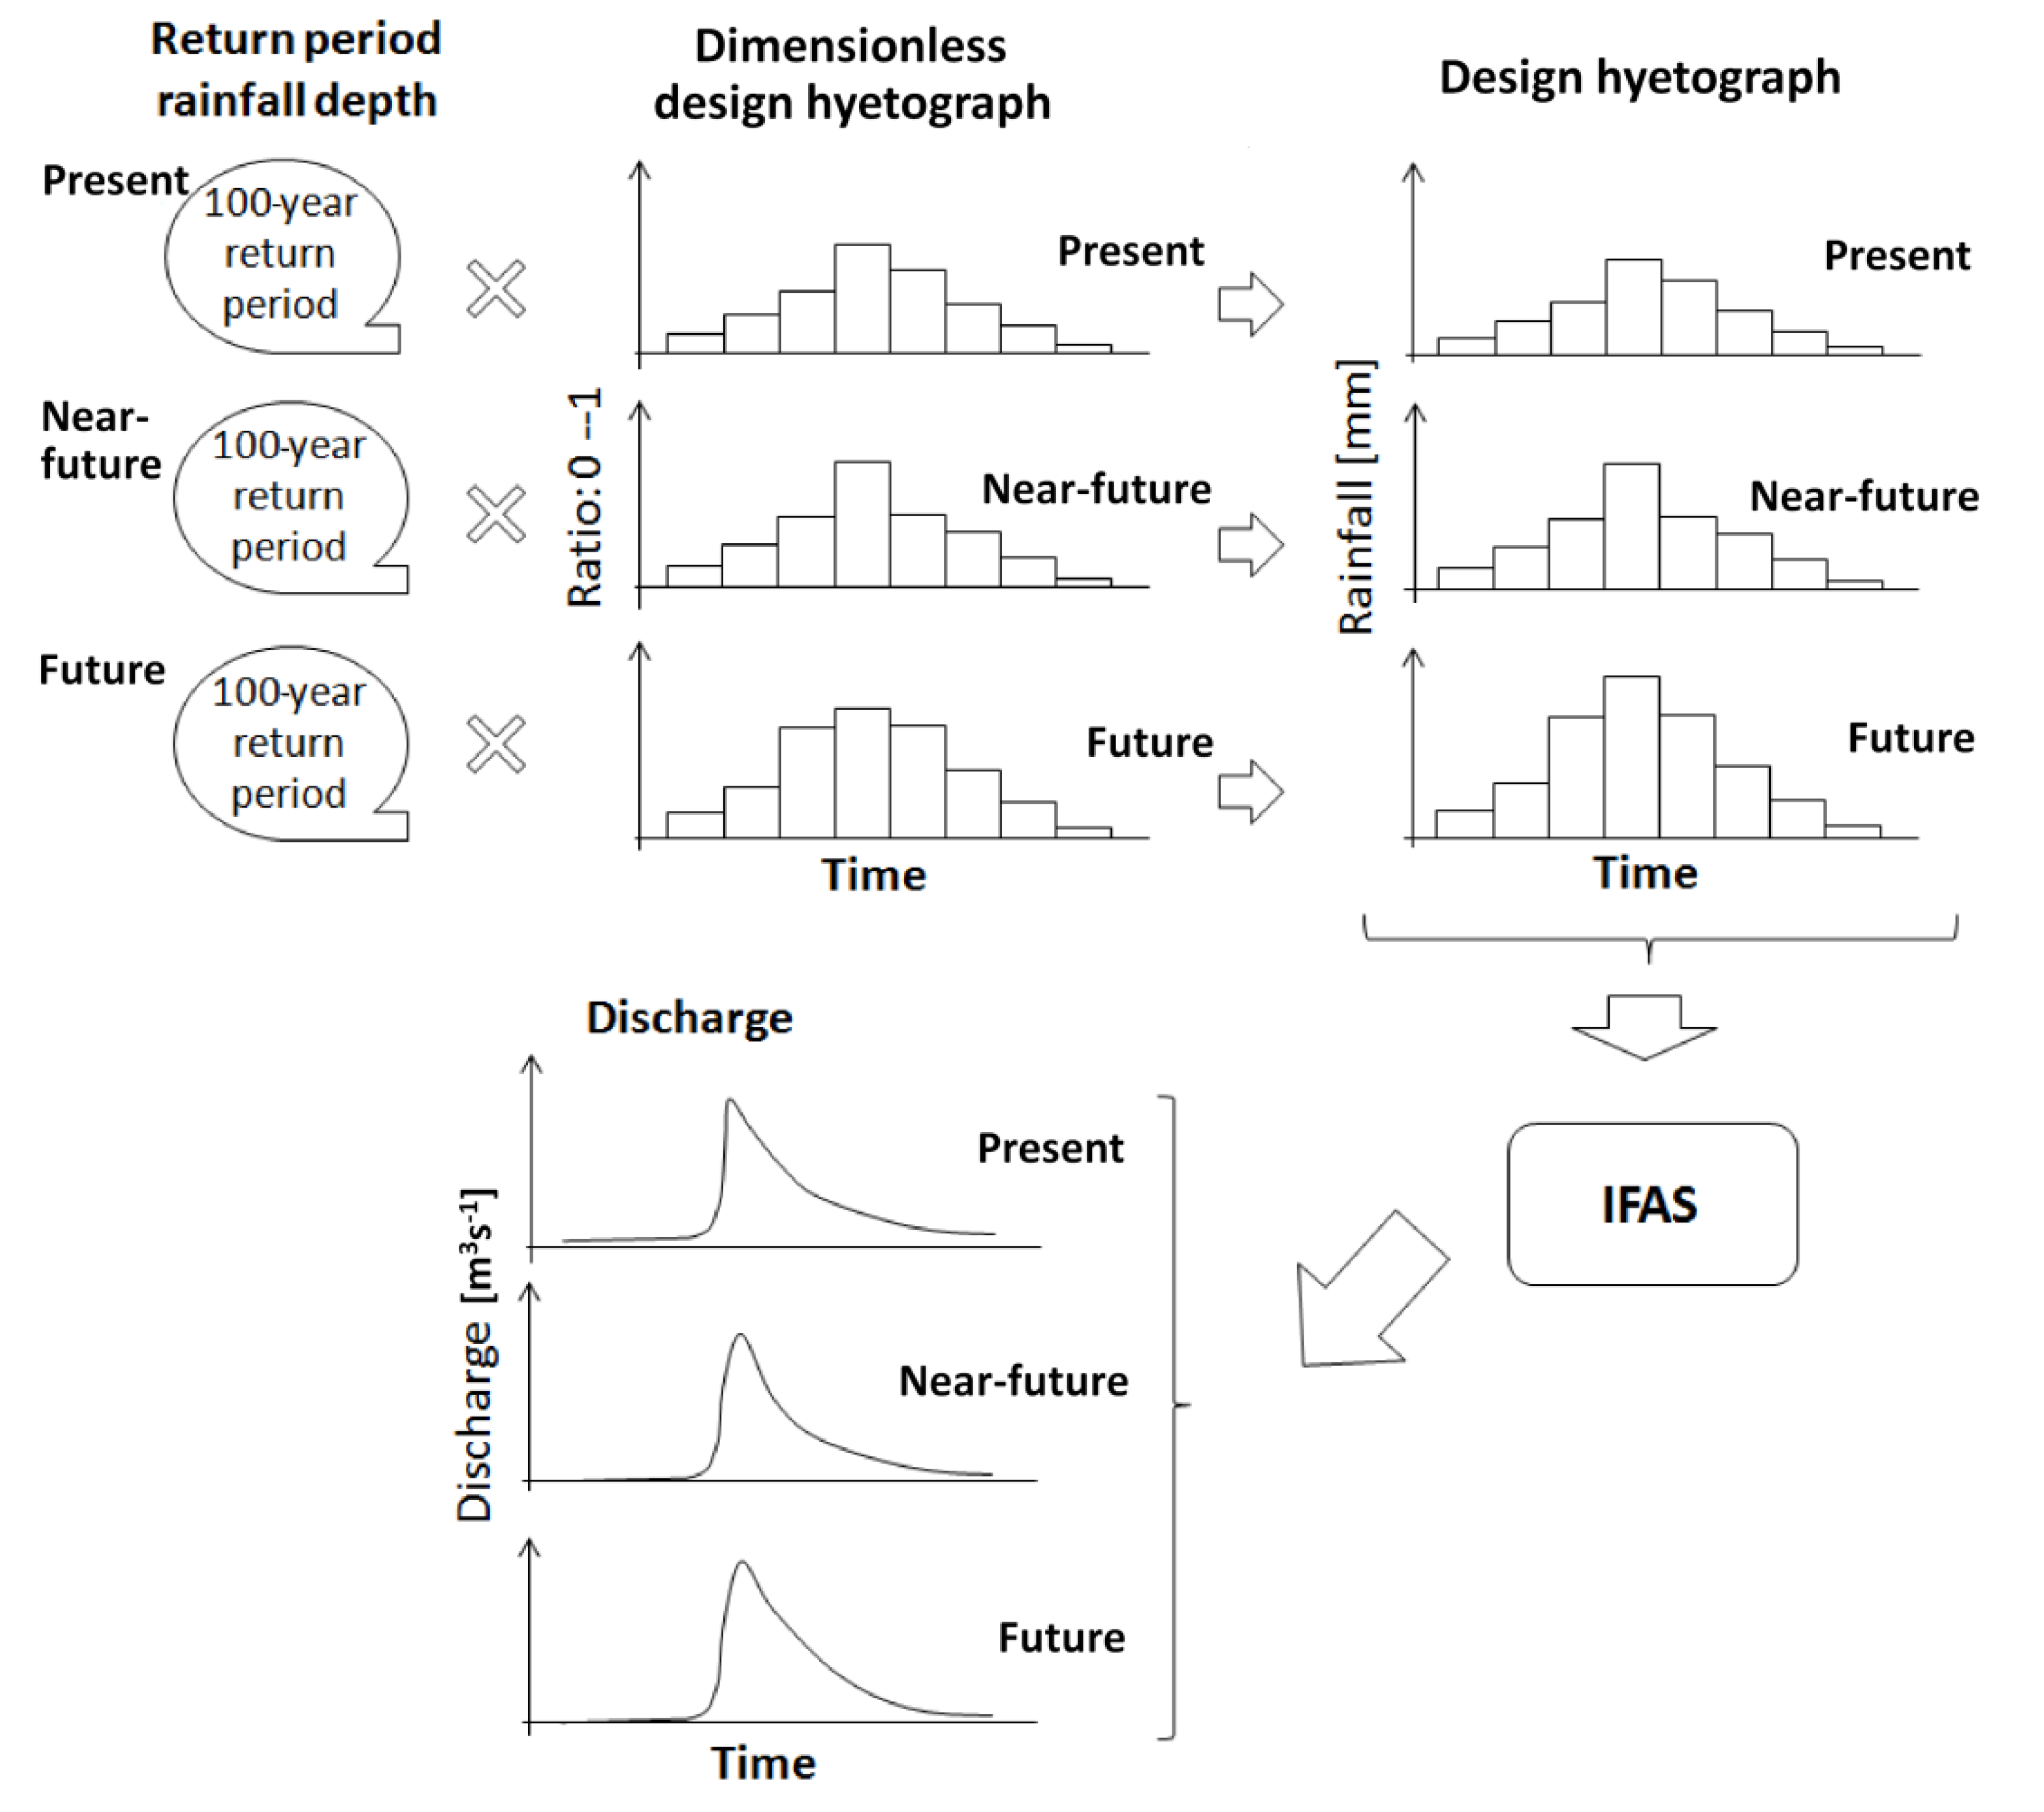
3.2. Artificial Rainfall and Discharge Simulation

3.2.1. Frequency Analysis
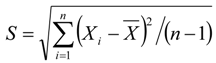

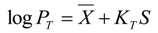


3.2.2. Verification for 100-Year Return Period Data

| Statistical variable | Present | Near-future | Future | |||
|---|---|---|---|---|---|---|
| 24 h | 72 h | 24 h | 72 h | 24 h | 72 h | |
| Standard deviation | 125.96 | 252.18 | 192.25 | 242.12 | 327.21 | 667.04 |
| Mean depth | 673.04 | 1312.31 | 1125.34 | 1653.58 | 1884.28 | 3511.55 |
| 5th quantile | 459.15 | 915.17 | 799.06 | 1272.06 | 1342.95 | 2493.82 |
| 95th quantile | 864.43 | 1751.74 | 1434.50 | 2053.11 | 2455.13 | 4669.44 |
3.2.3. Dimensionless Design Hyetograph
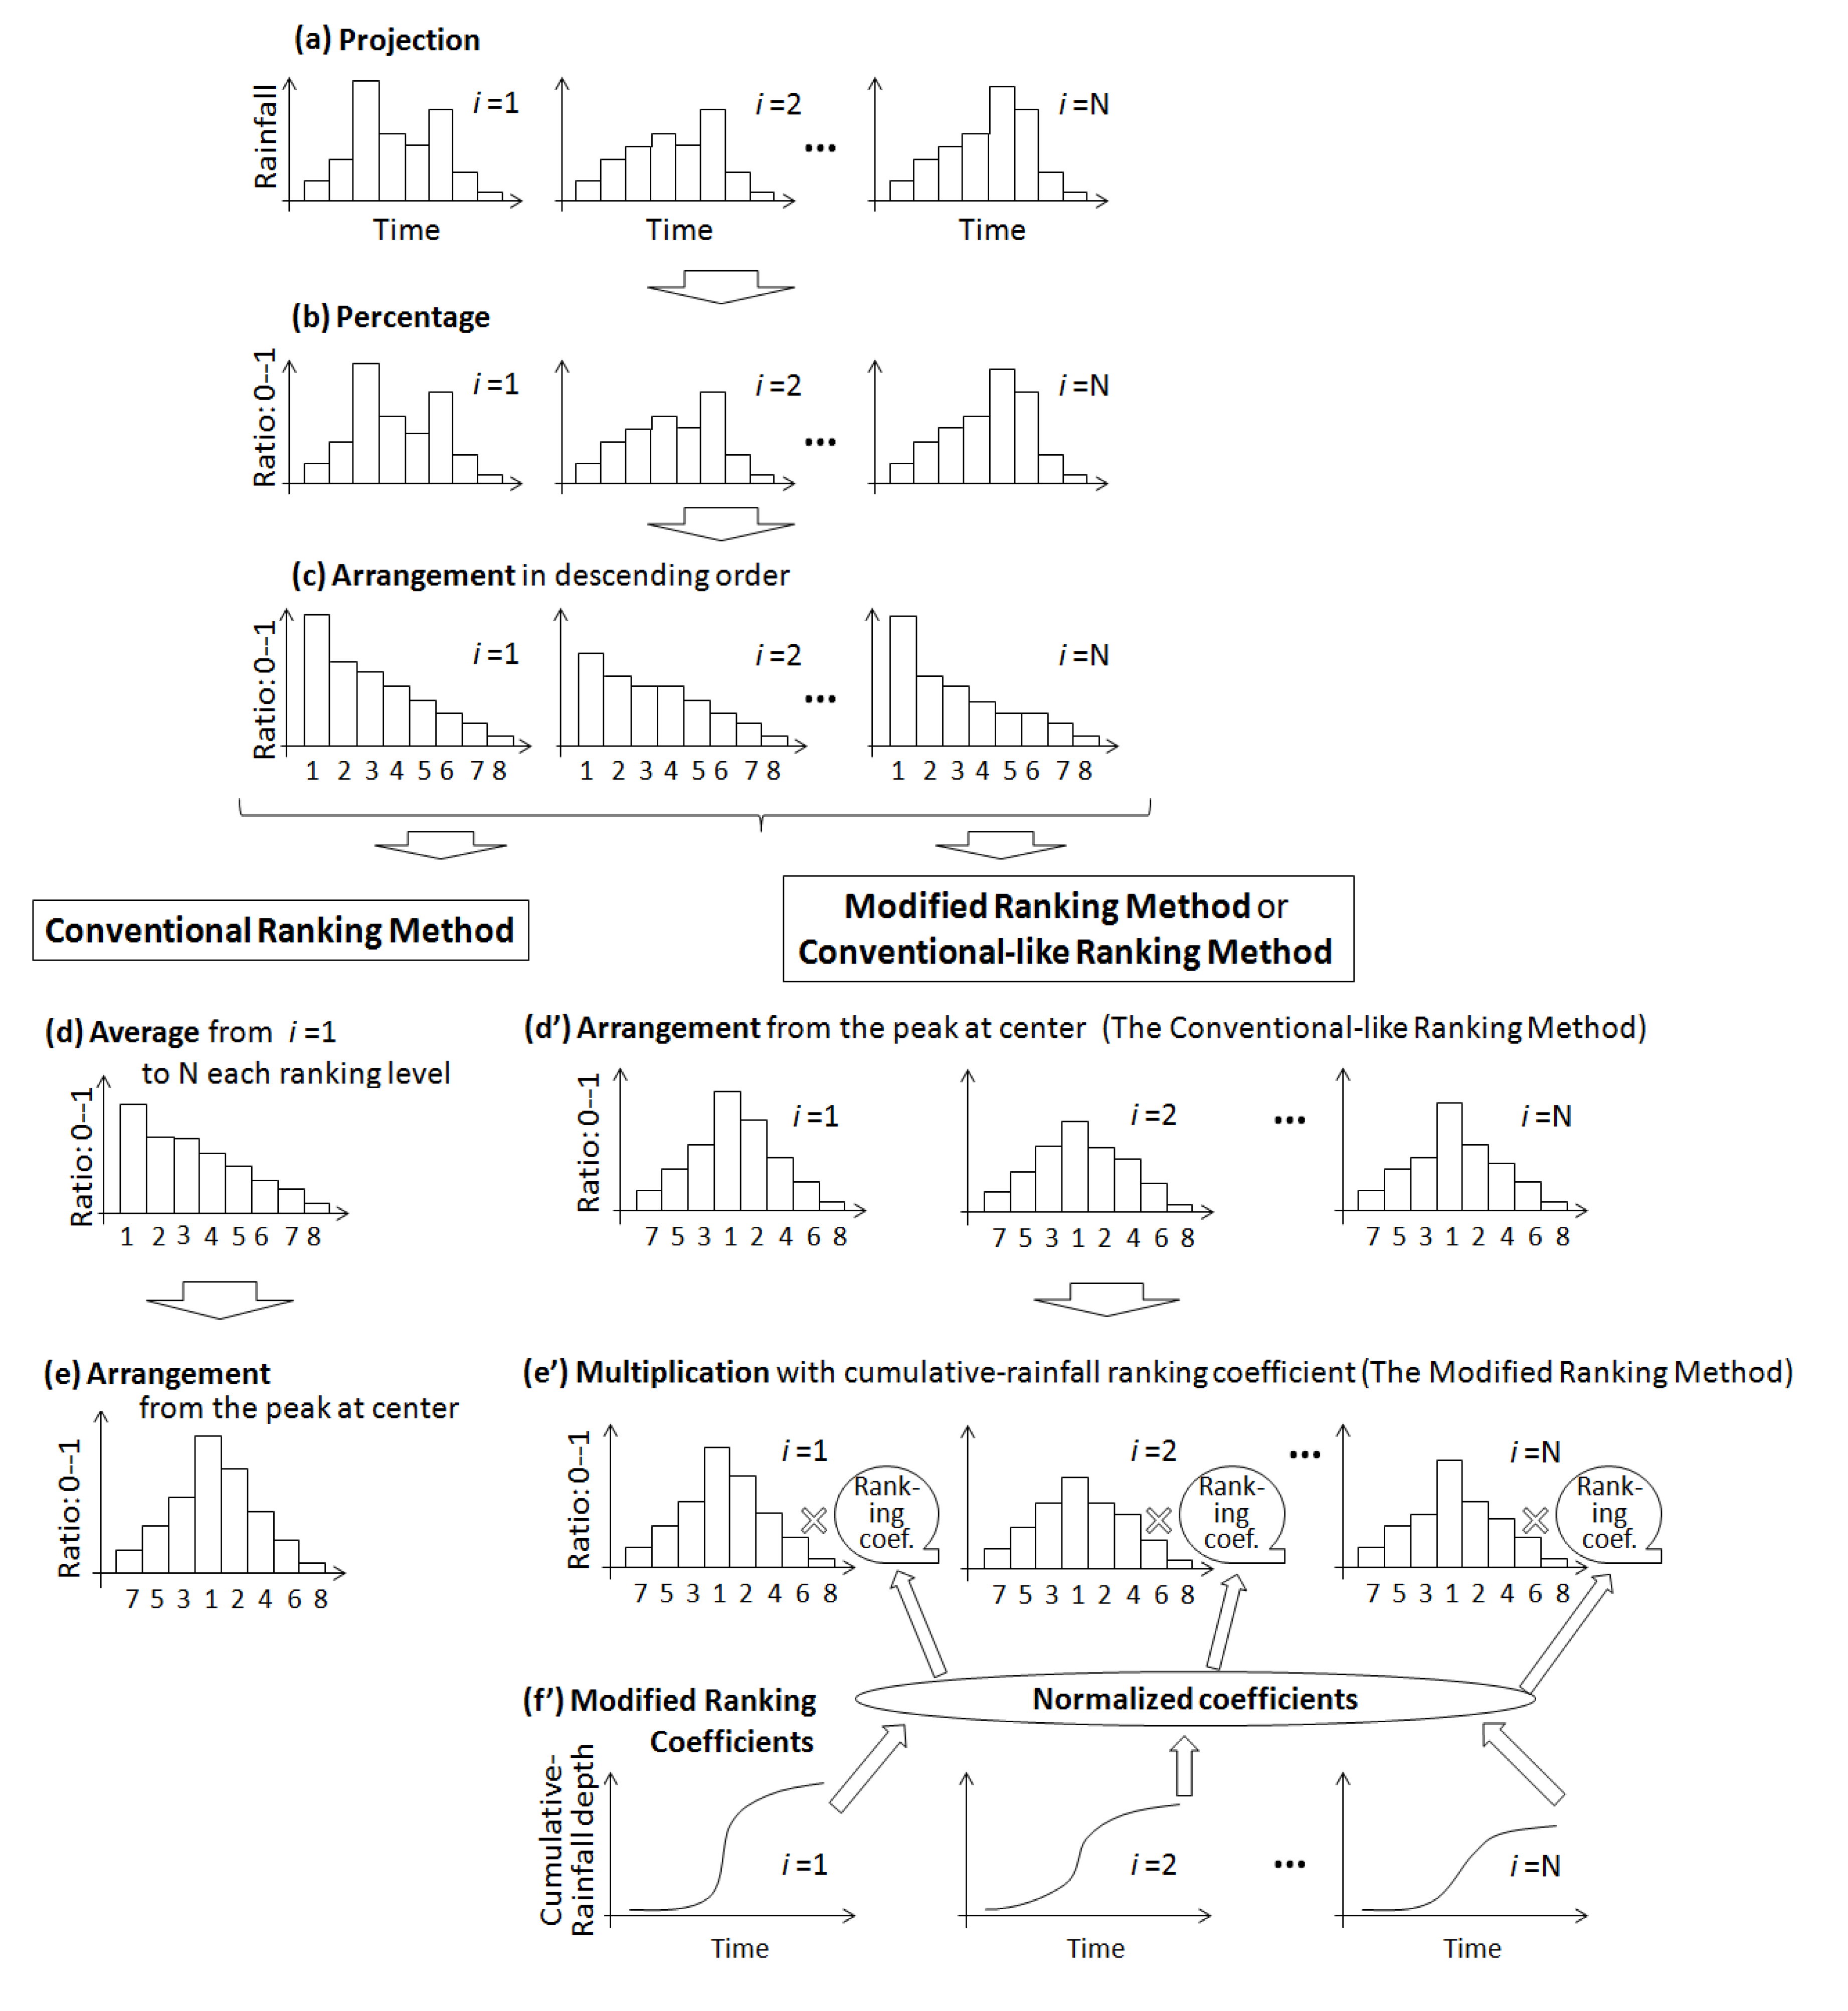
3.2.4. Flood Model
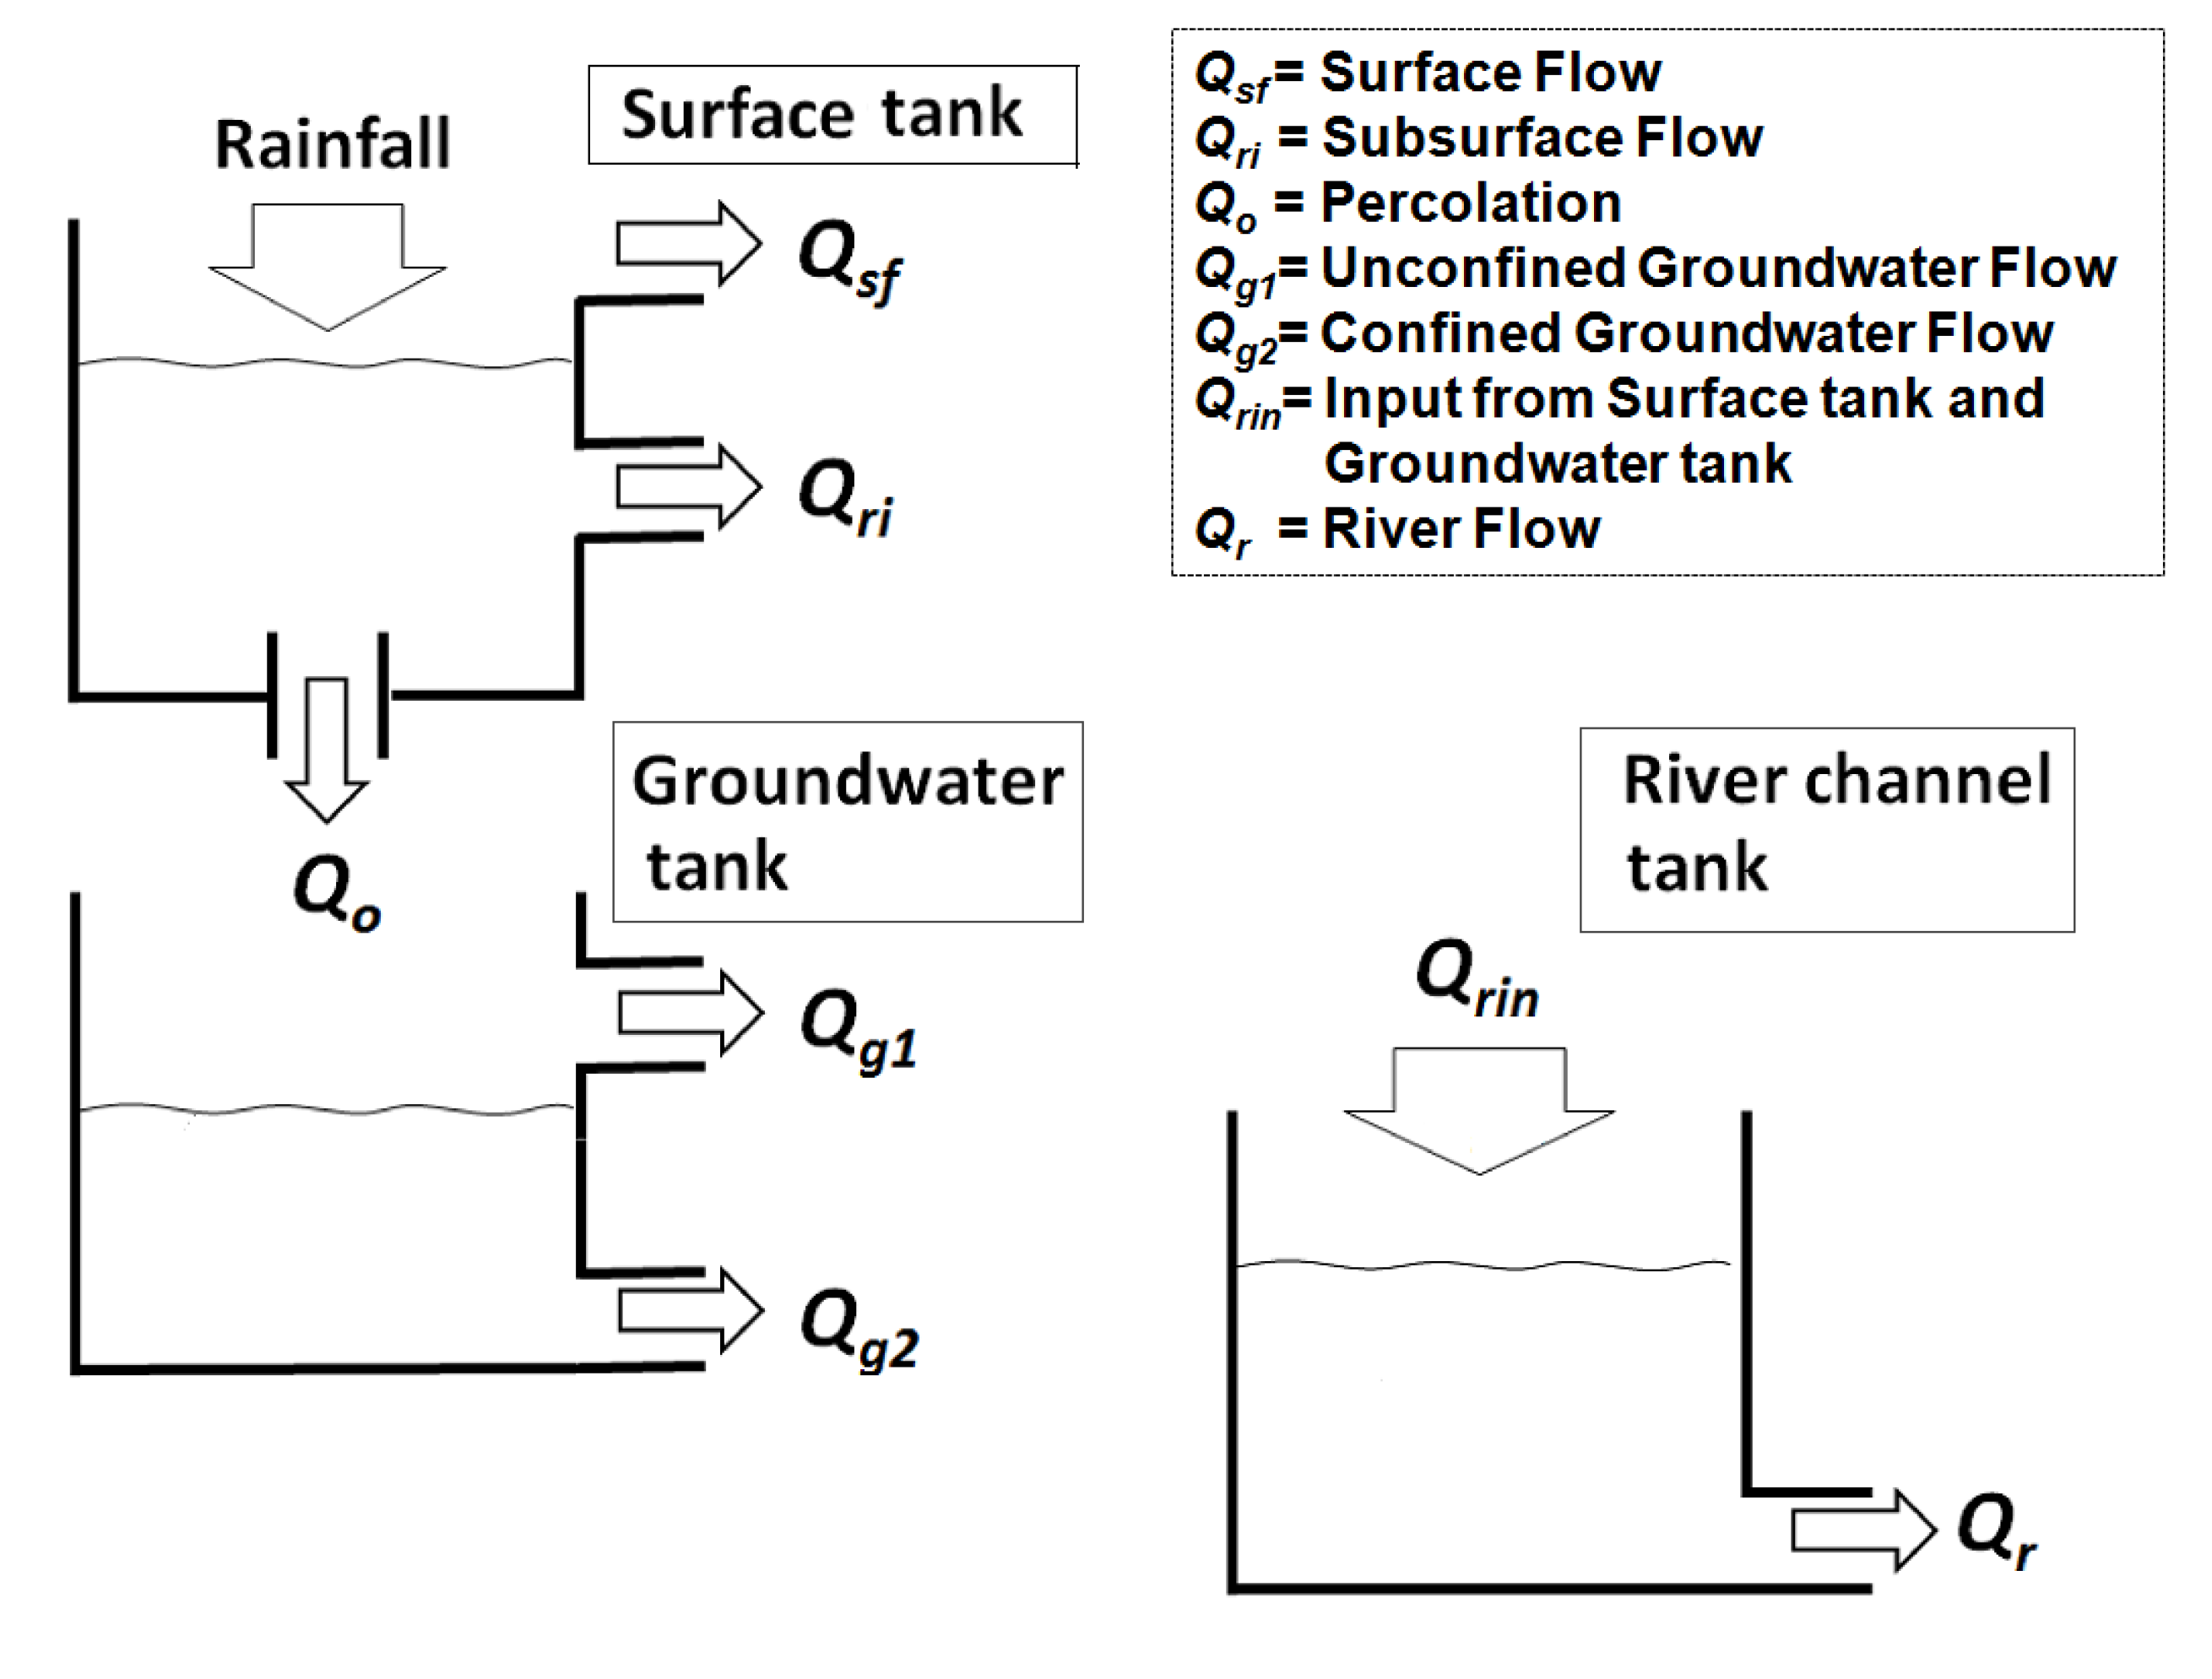
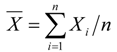
3.3. Sharpness Evaluation for a Temporal Distribution

4. Results and Discussion
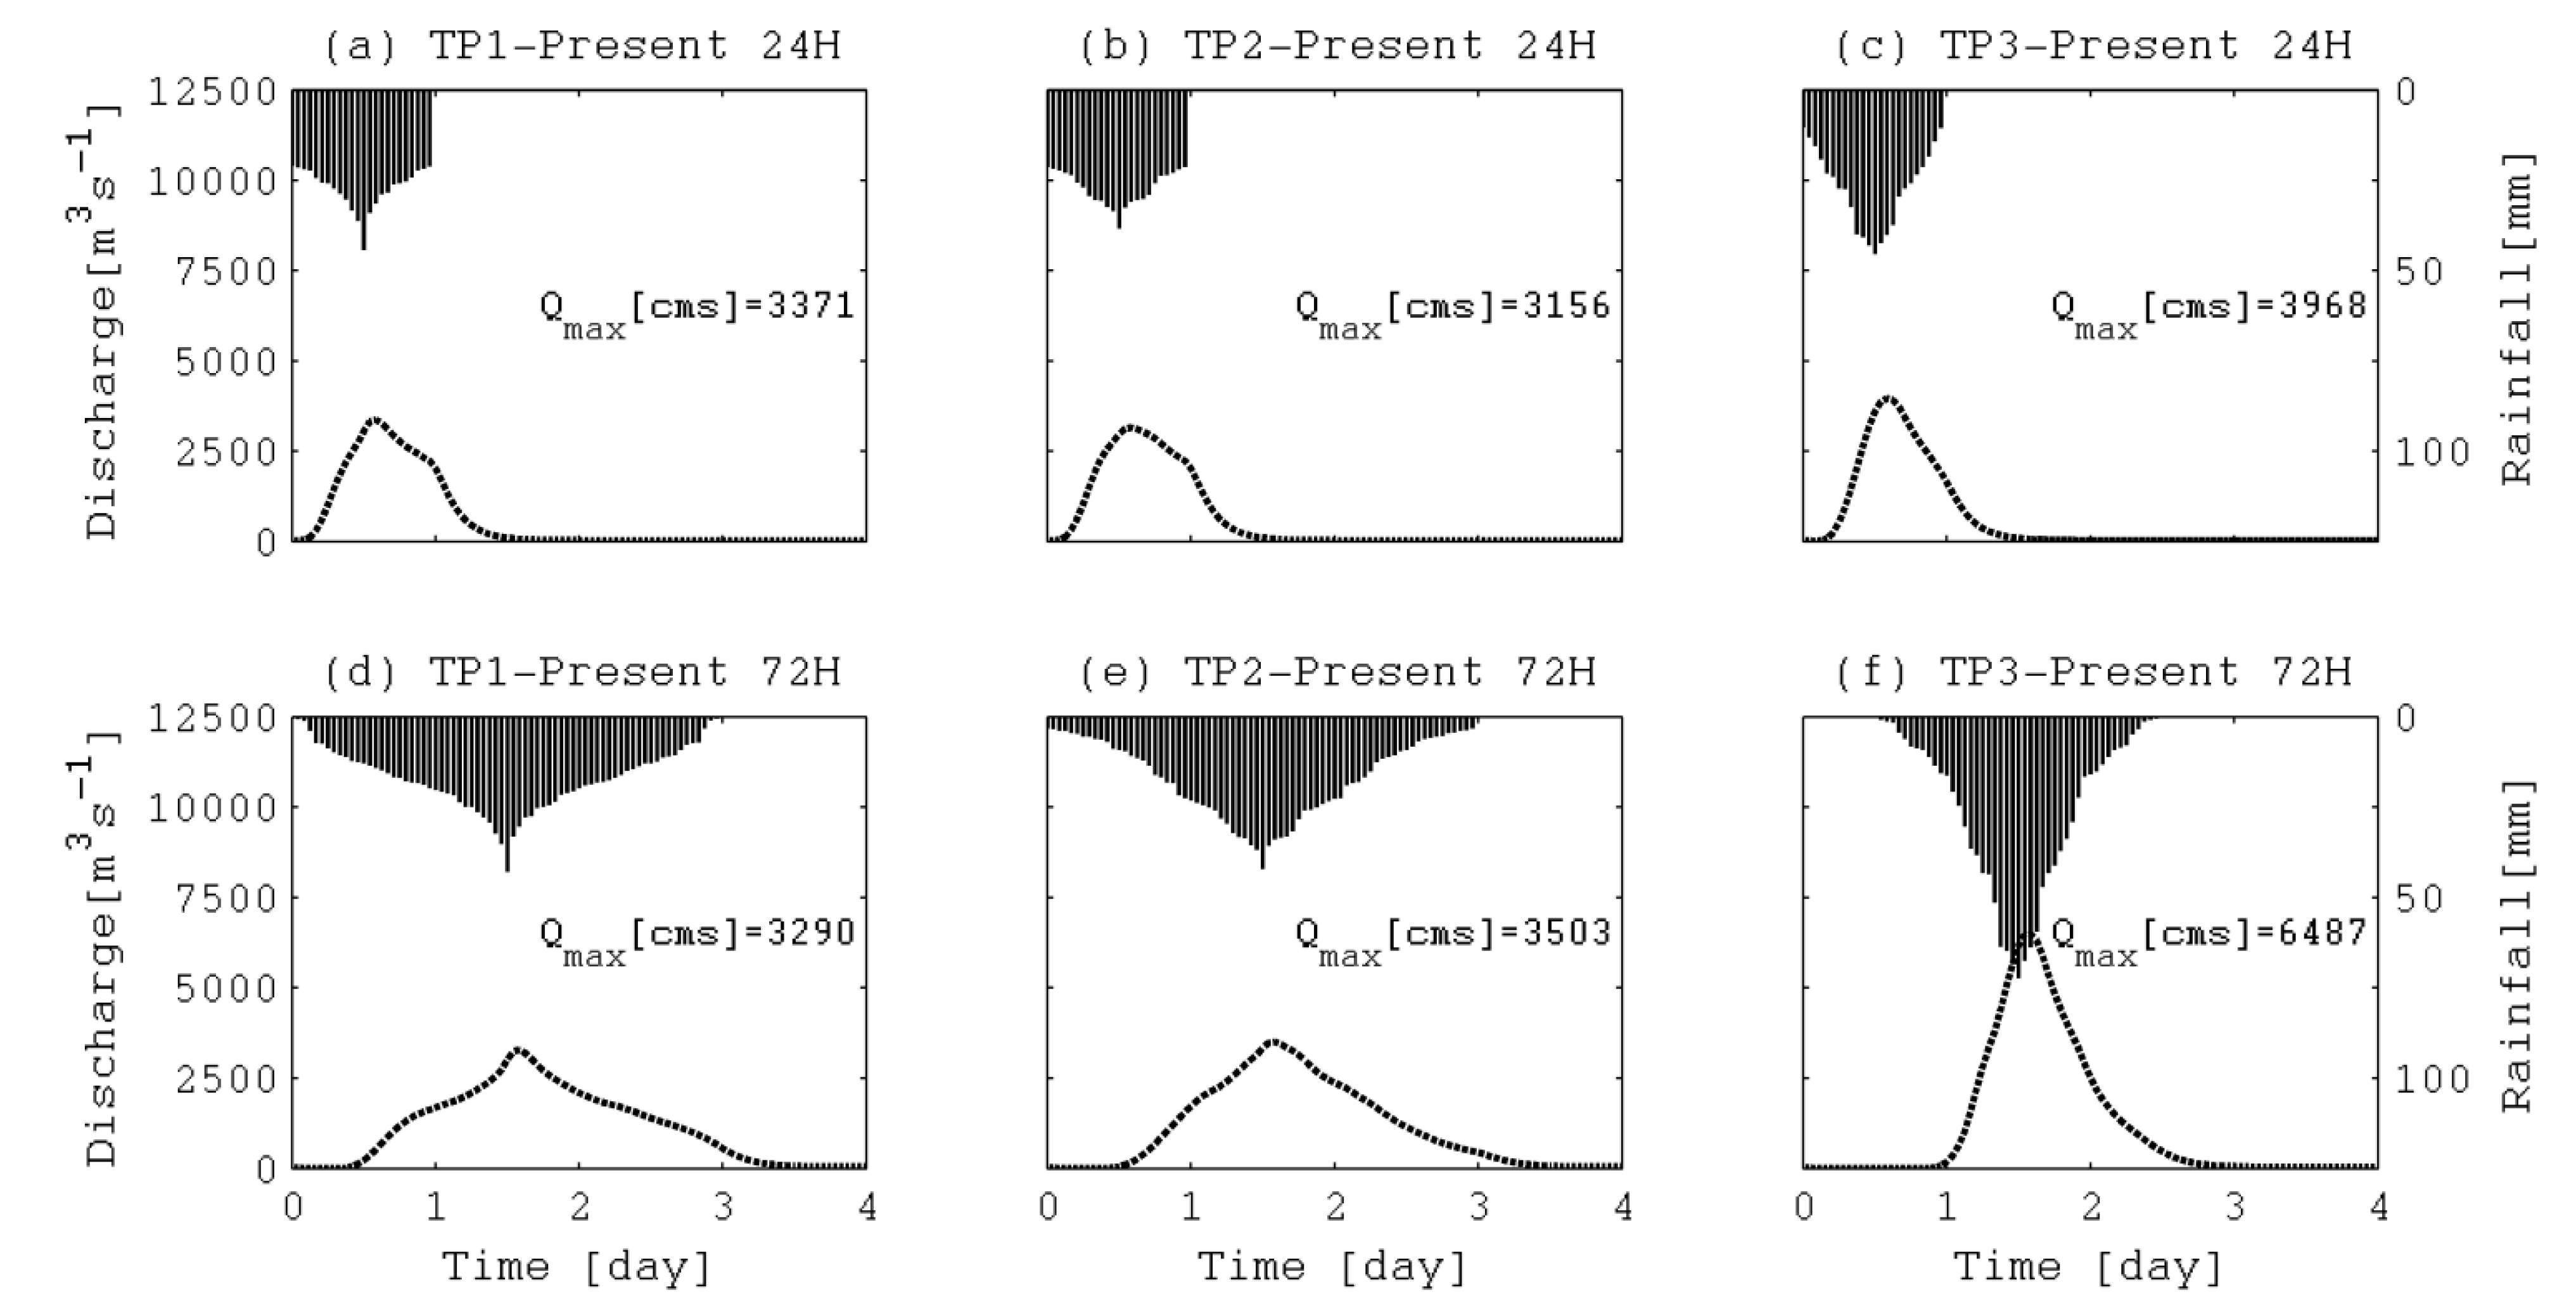
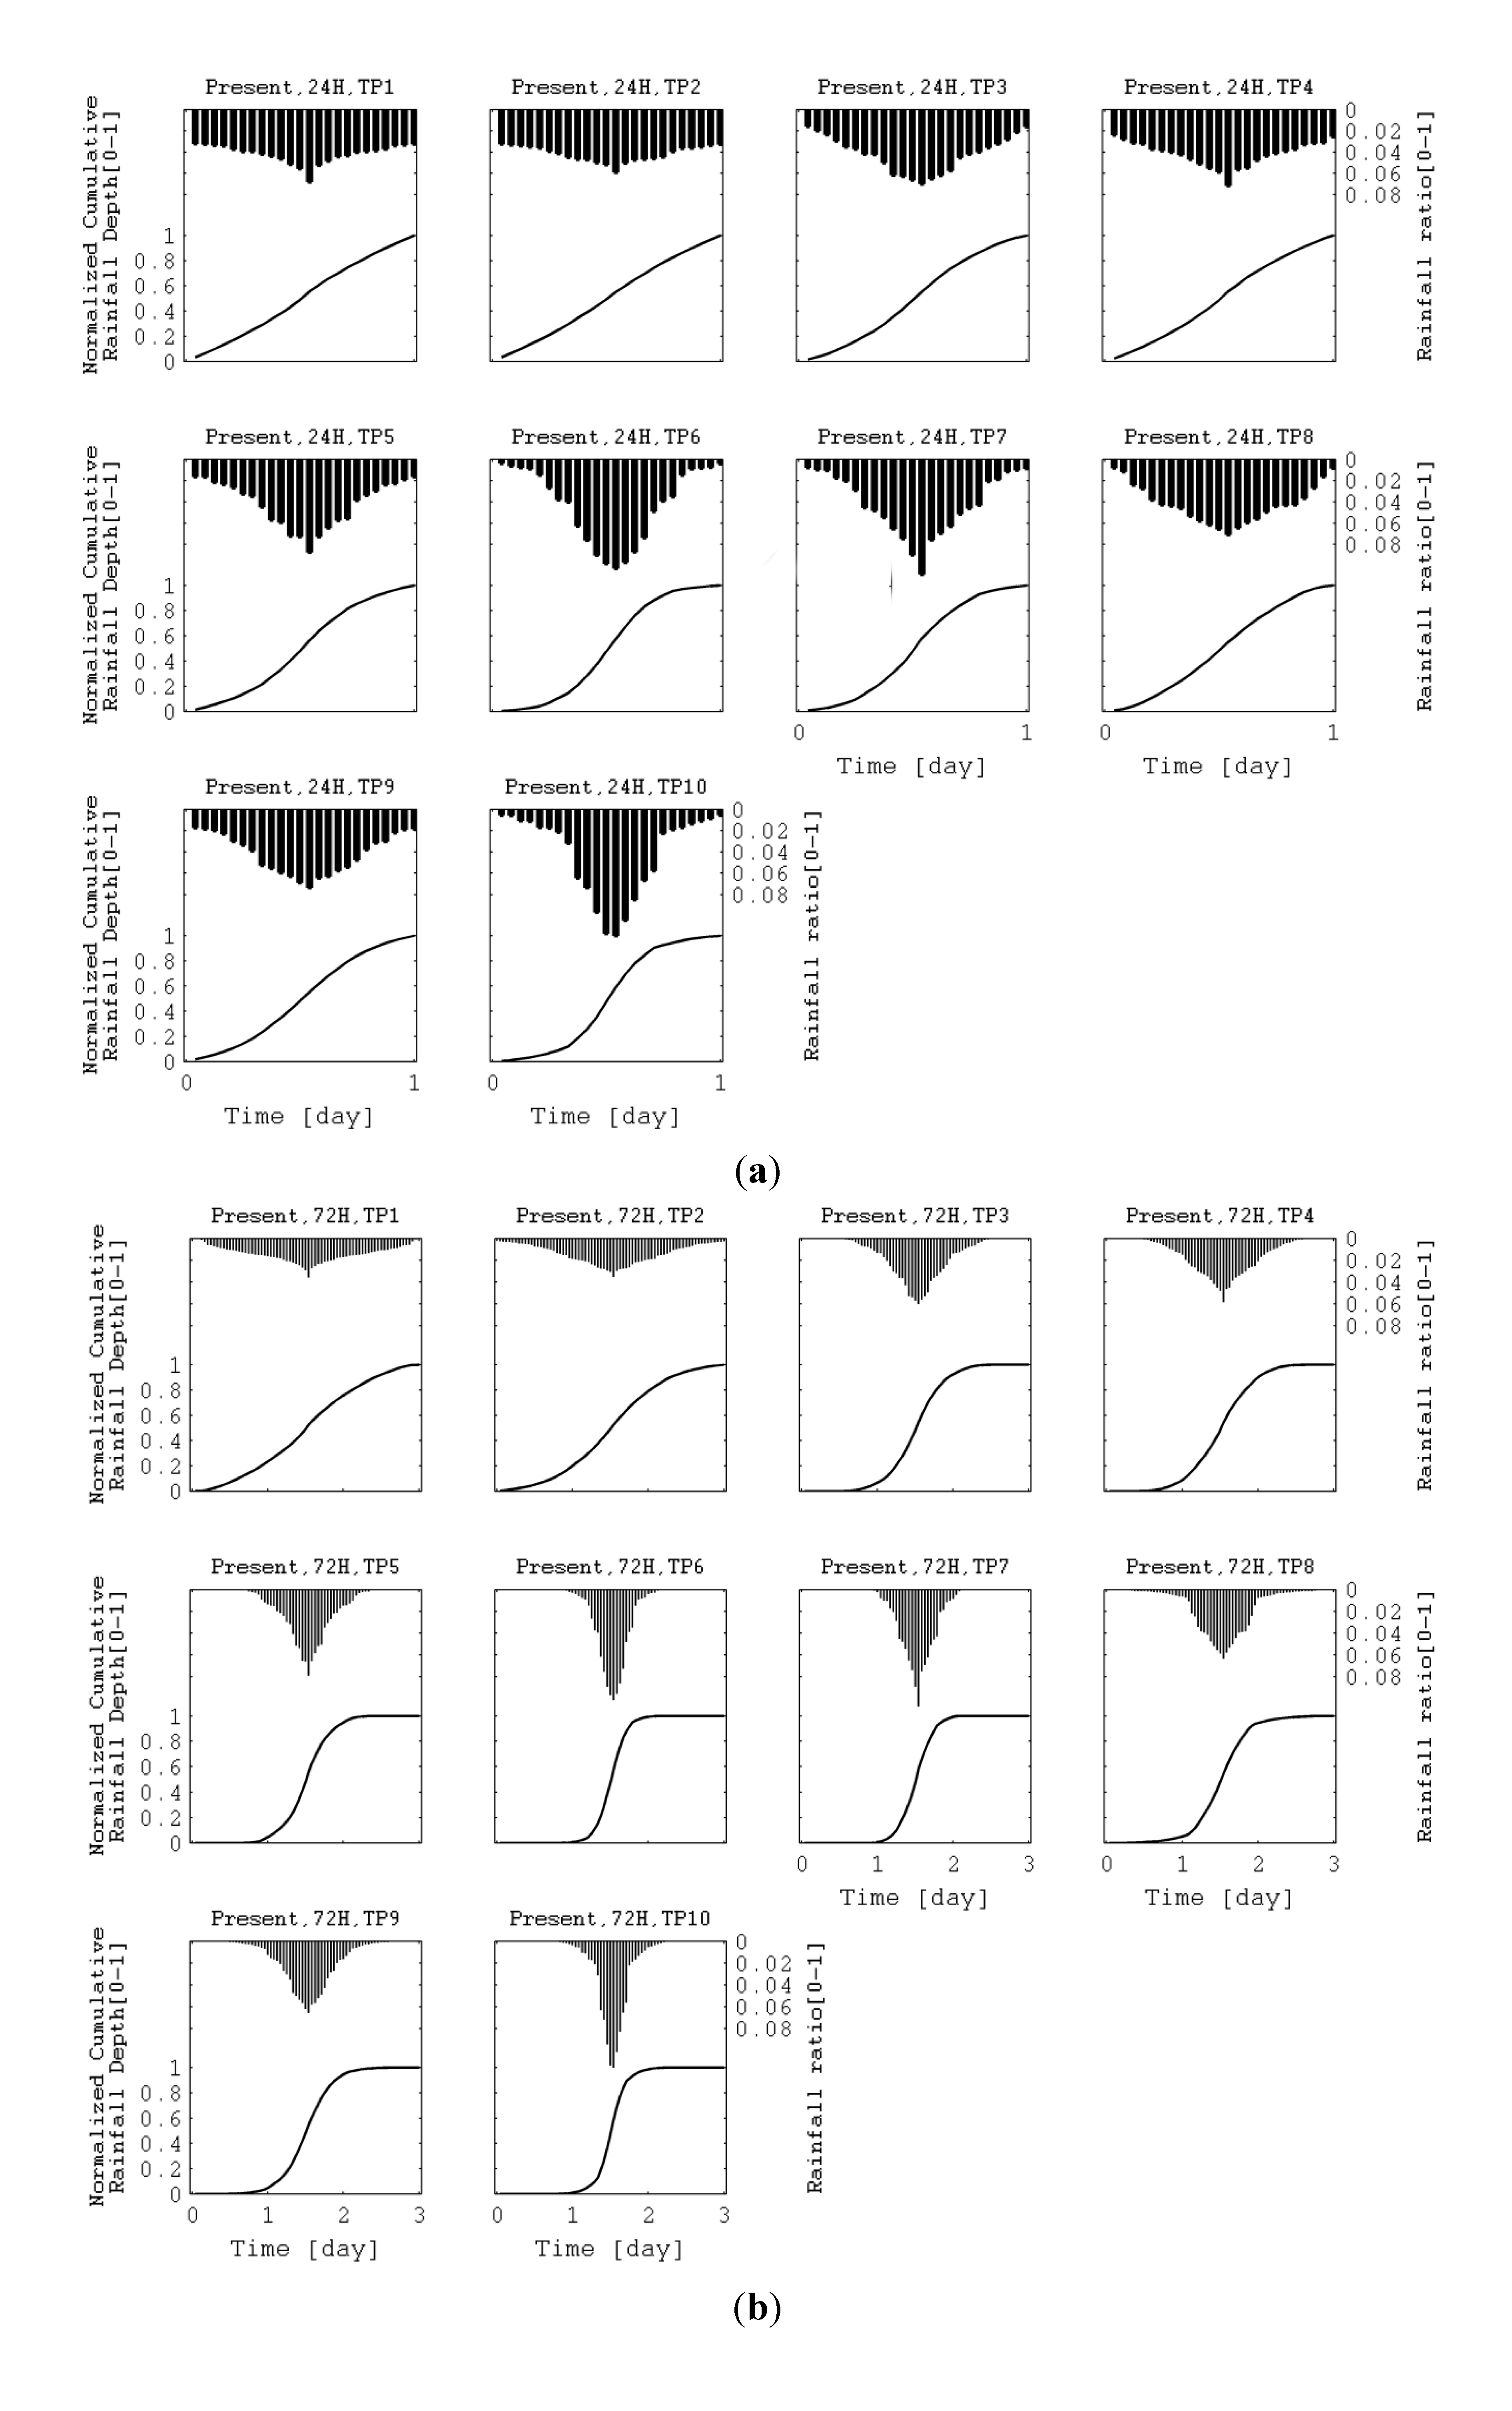
4.1. Use of Design Hyetograph without Modified Ranking Method Coefficients

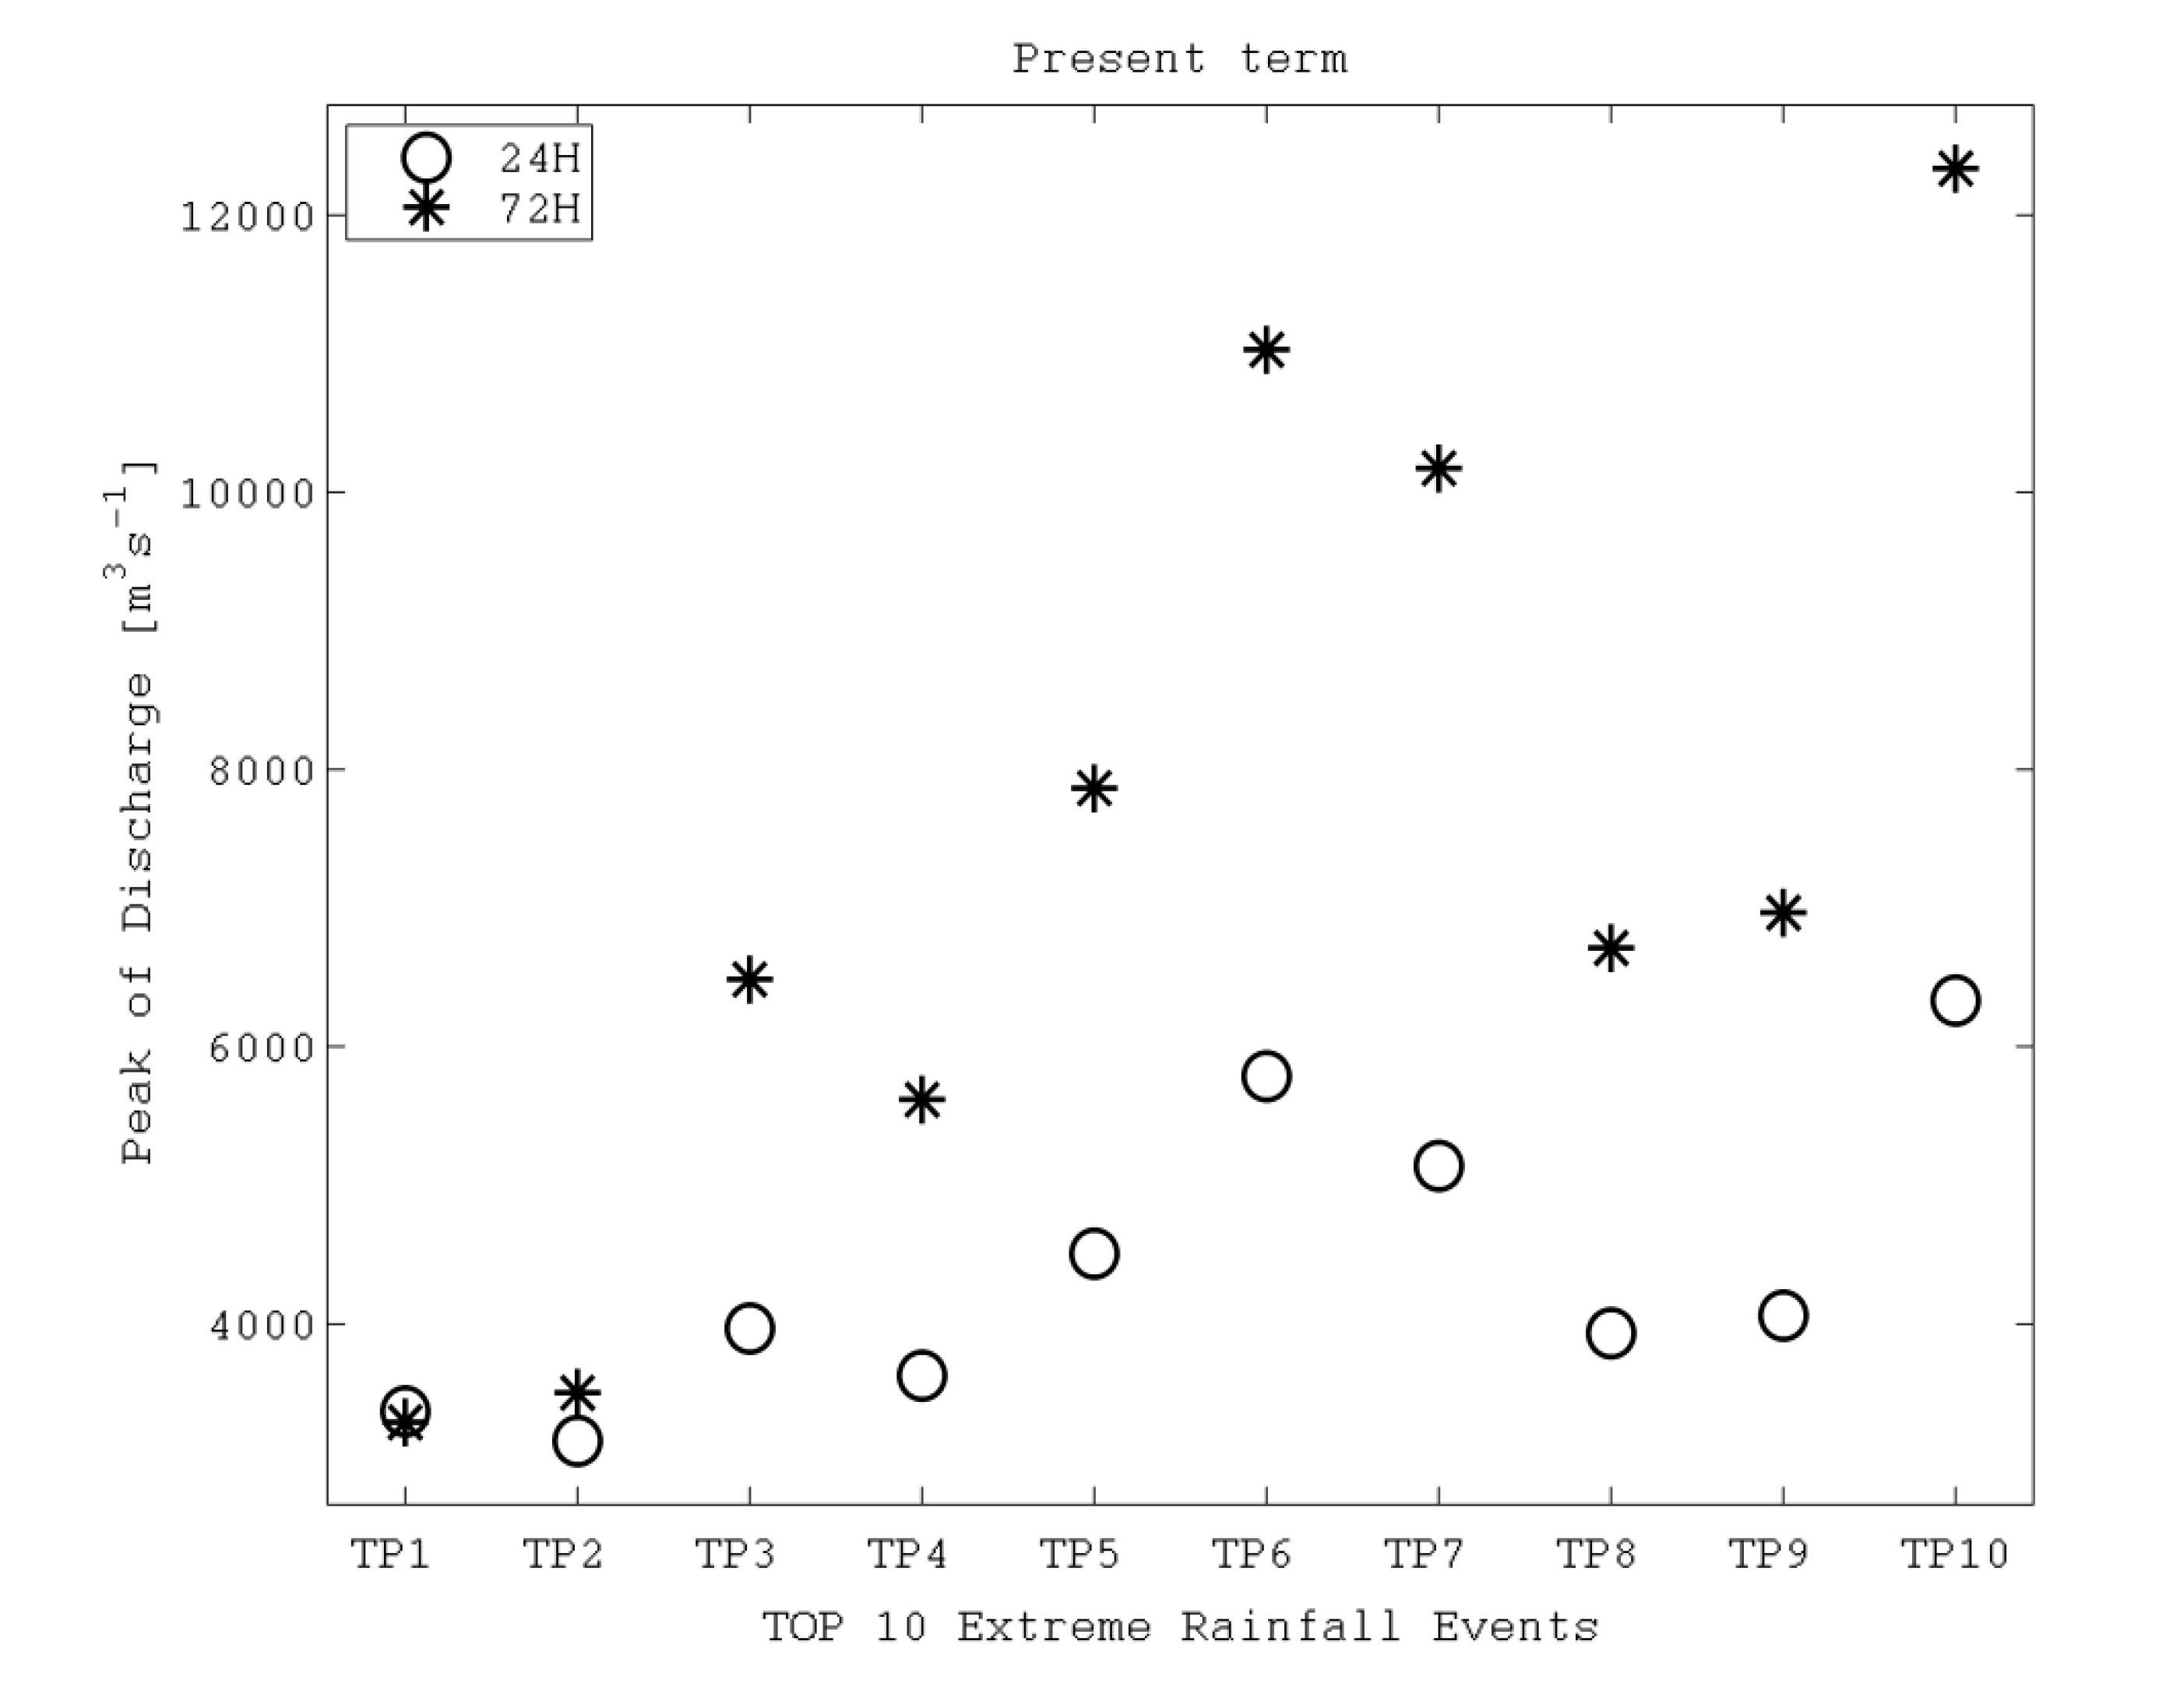
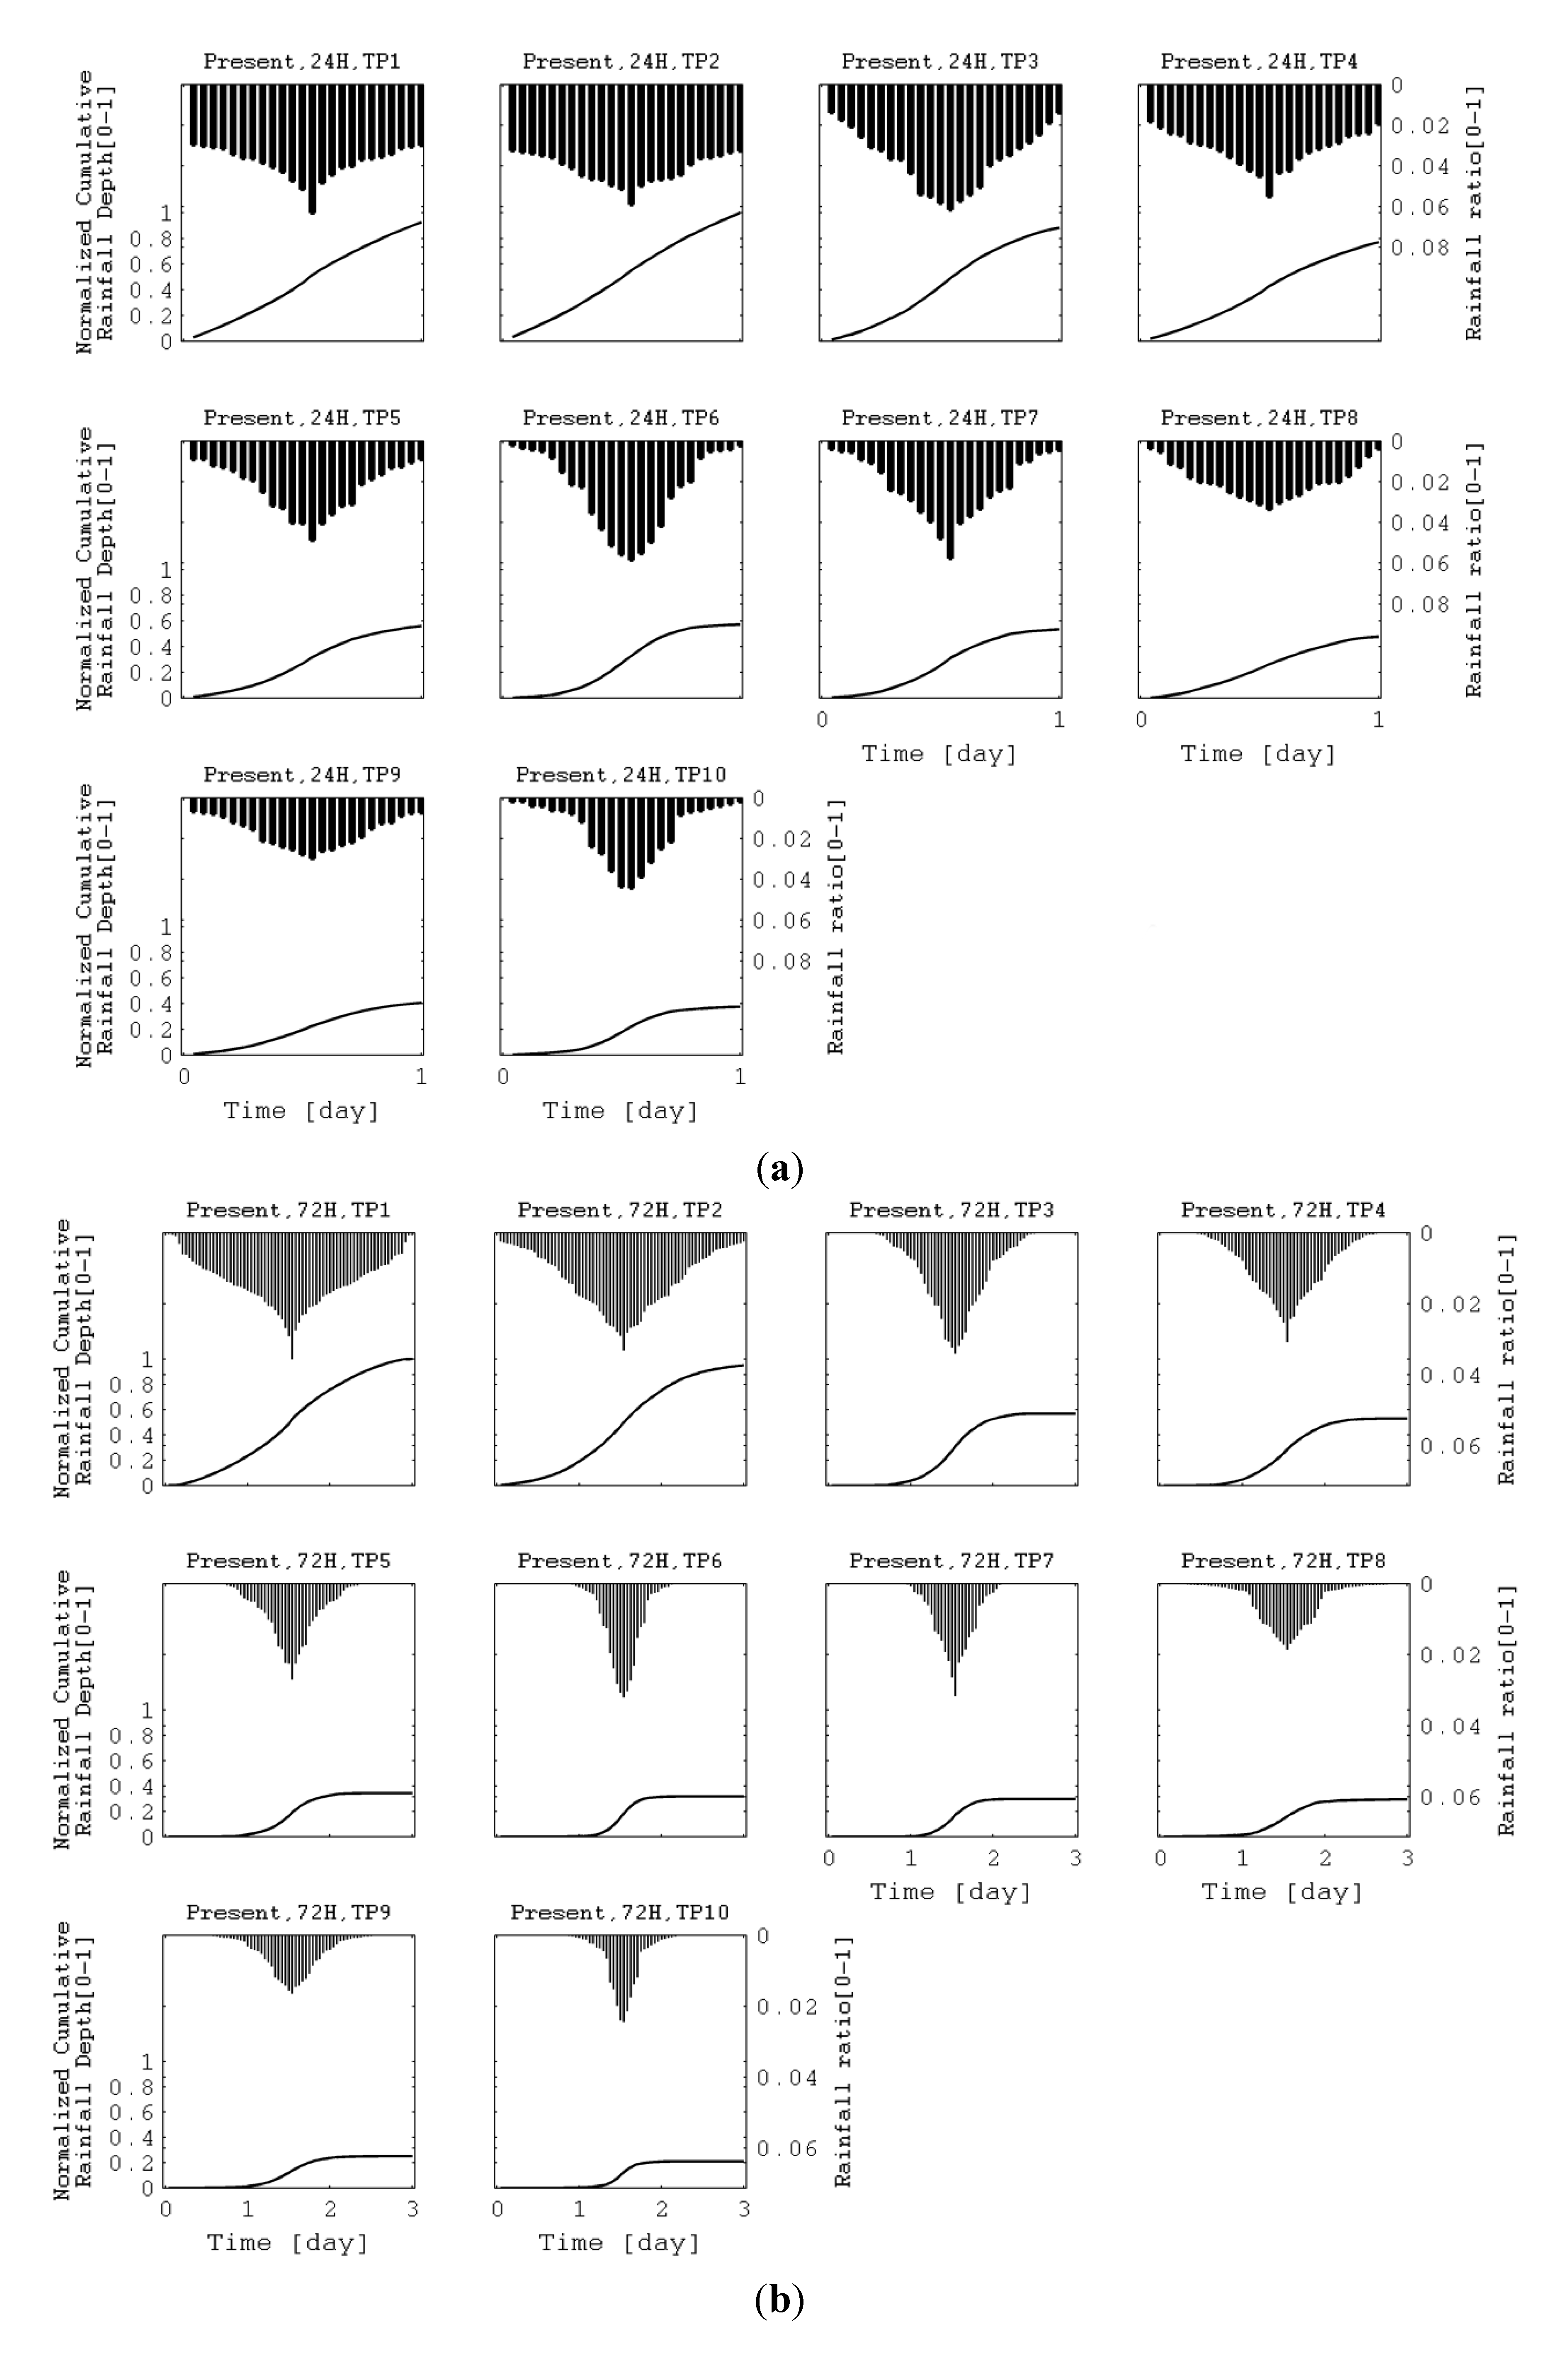
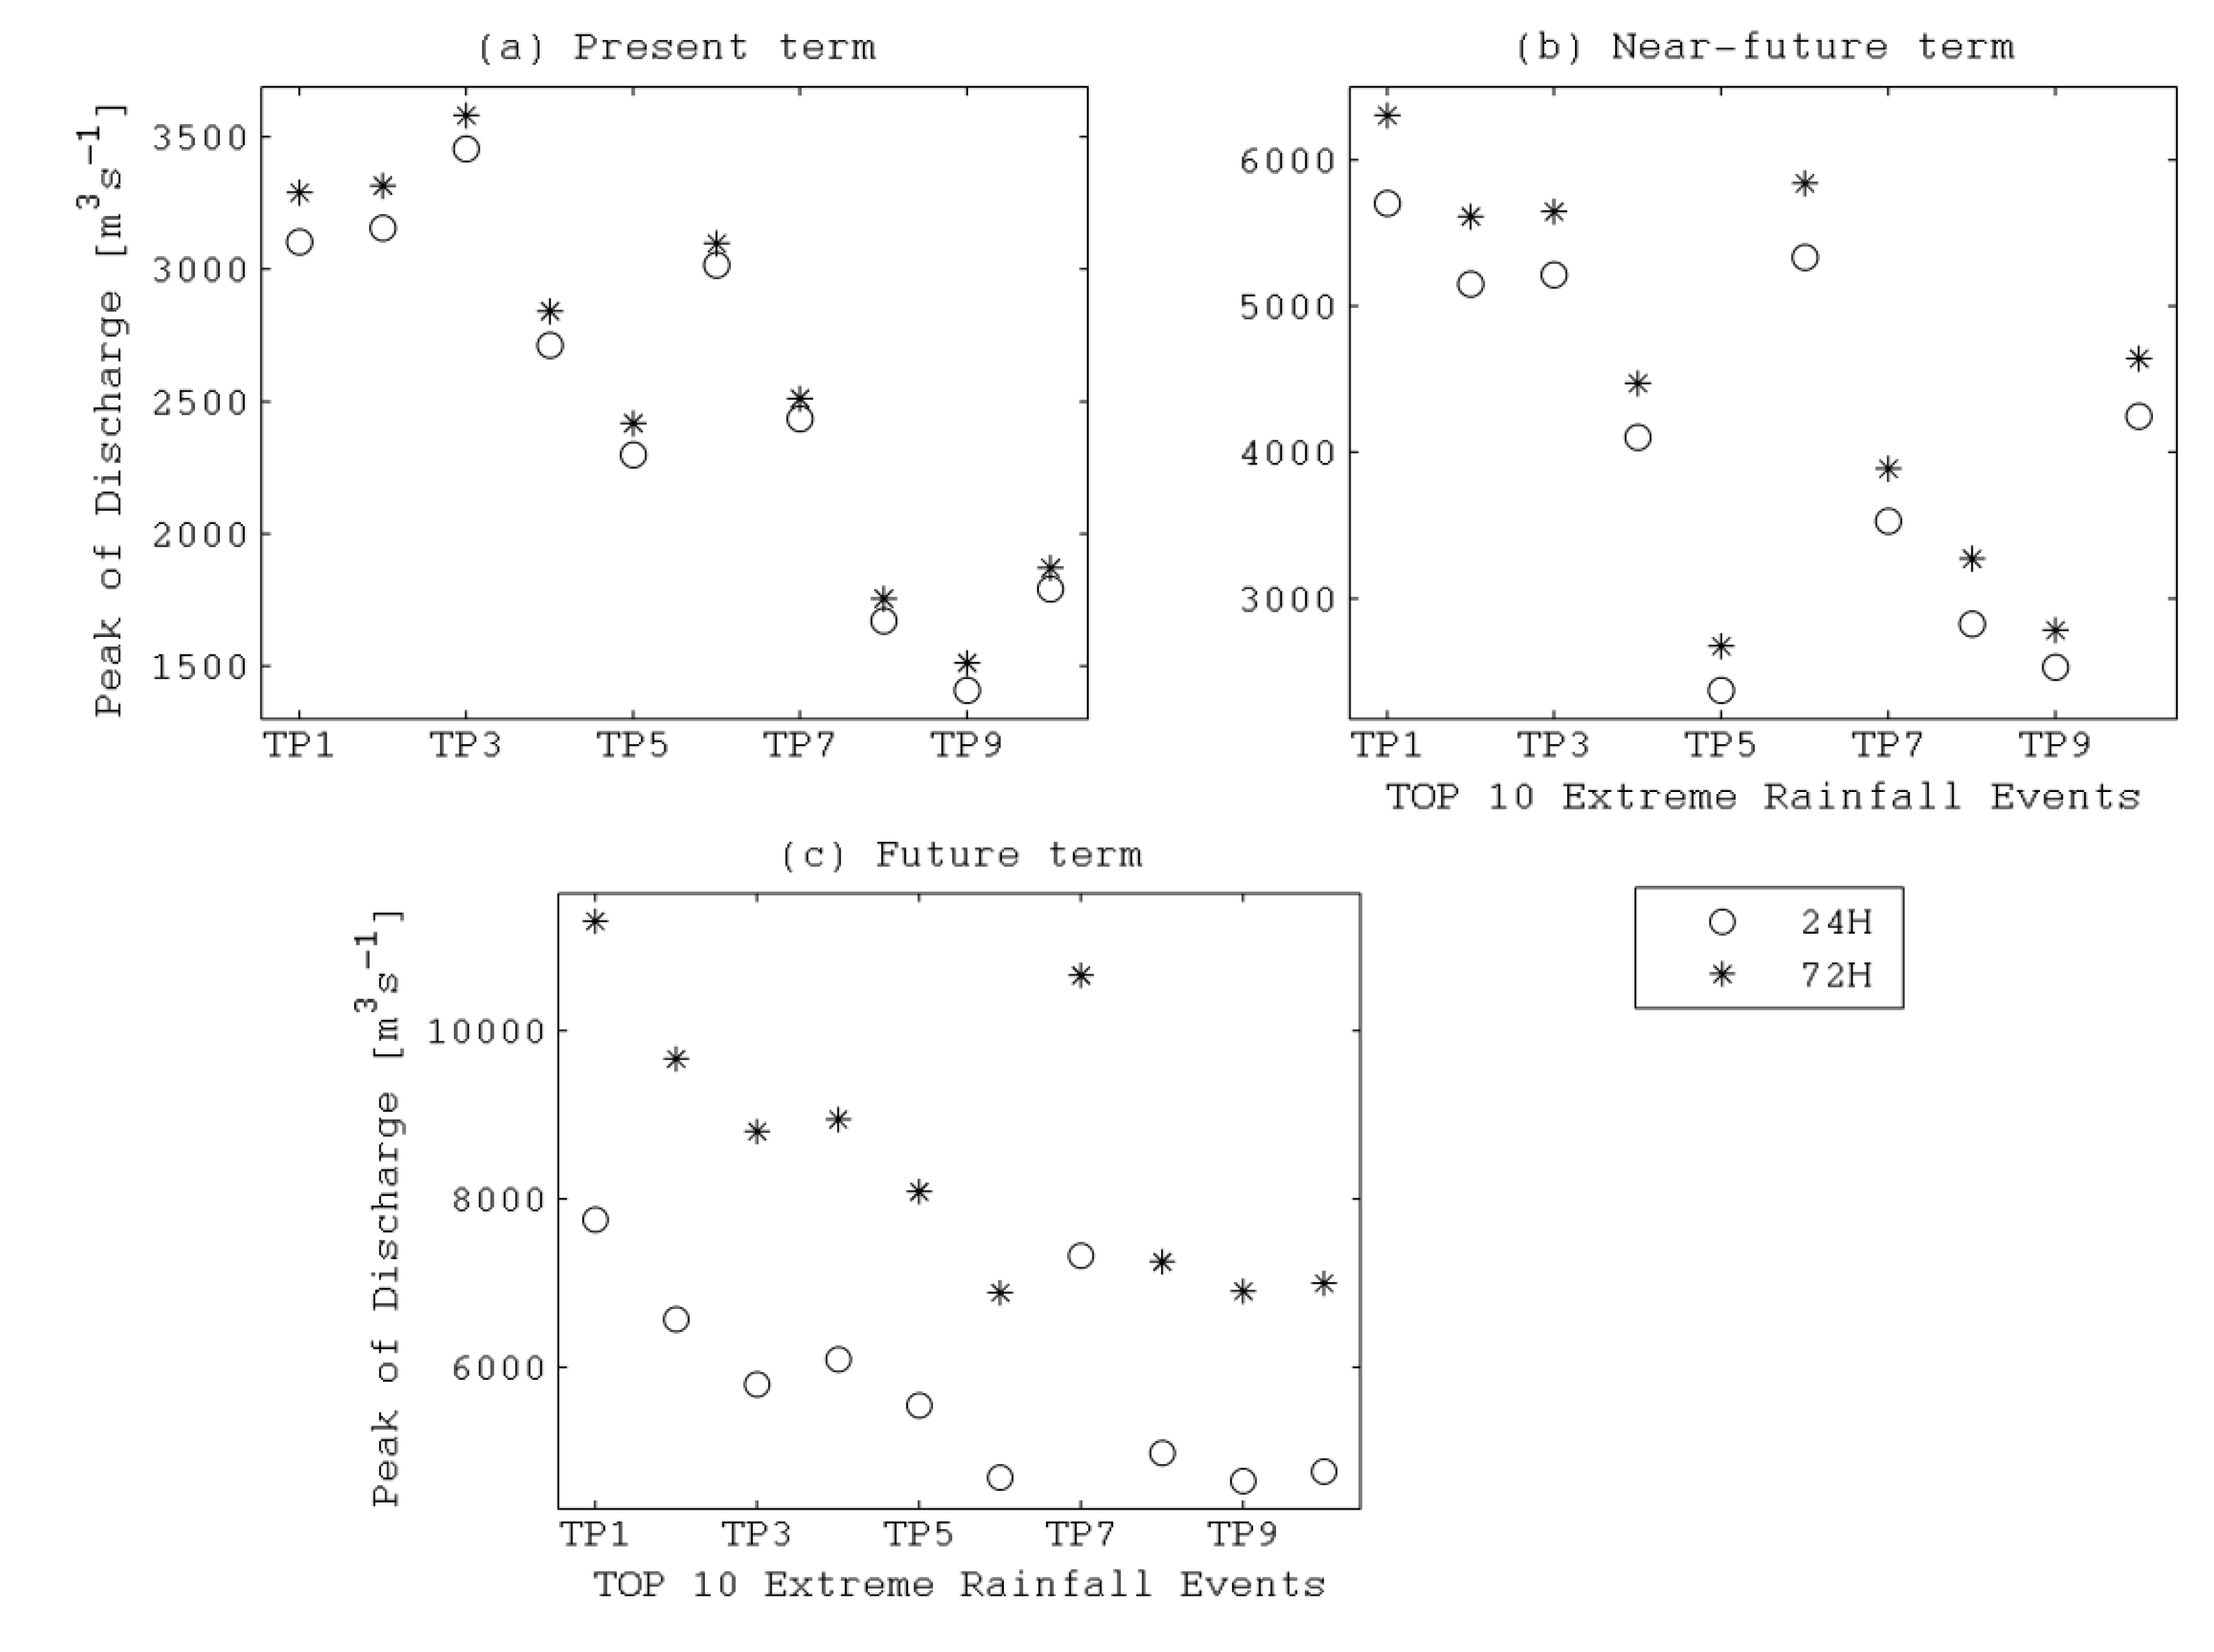
4.2. Use of Design Hyetograph with the Modified Ranking Method Coefficients
| Top 10 events | 24 h | 72h | ||
|---|---|---|---|---|
| Cumulative-rainfall depth (mm) | Kurtosis (none-unit) | Cumulative-rainfall depth (mm) | Kurtosis (none-unit) | |
| Present-TP 1 | 648.0 | −0.97 | 1202.1 | −0.70 |
| TP 2 | 648.2 | −1.00 | 1203.6 | −0.28 |
| TP 3 | 648.2 | −0.72 | 1202.3 | −0.03 |
| TP 4 | 648.0 | −0.88 | 1202.1 | −0.24 |
| TP 5 | 648.0 | −0.46 | 1201.8 | −0.01 |
| TP 6 | 648.3 | 0.06 | 1200.3 | 0.40 |
| TP 7 | 648.2 | −0.24 | 1201.8 | −0.14 |
| TP 8 | 648.3 | −0.81 | 1201.5 | 1.40 |
| TP 9 | 648.2 | −0.61 | 1199.8 | 0.35 |
| TP 10 | 648.1 | 0.52 | 1201.1 | 1.18 |
| Top 10 events | 24 h | 72h | ||
|---|---|---|---|---|
| Cumulative-rainfall depth (mm) | Kurtosis (none-unit) | Cumulative-rainfall depth (mm) | Kurtosis (none-unit) | |
| Present-TP 1 | 595.5 | −0.97 | 1256.1 | −0.70 |
| TP 2 | 642.7 | −1.00 | 1193.6 | −0.28 |
| TP 3 | 566.7 | −0.71 | 713.1 | −0.05 |
| TP 4 | 495.1 | −0.87 | 662.5 | −0.24 |
| TP 5 | 359.7 | −0.46 | 430.7 | −0.02 |
| TP 6 | 367.2 | 0.05 | 397.2 | 0.40 |
| TP 7 | 343.8 | −0.24 | 371.7 | −0.14 |
| TP 8 | 305.9 | −0.81 | 367.4 | 1.41 |
| TP 9 | 261.2 | −0.60 | 315.2 | 0.53 |
| TP 10 | 241.4 | 0.52 | 264.5 | 1.15 |
| Near-future-TP 1 | 959.9 | −0.84 | 1424.1 | −0.20 |
| TP 2 | 974.1 | −0.91 | 1142.3 | −0.78 |
| TP 3 | 956.7 | −0.96 | 1099.7 | −0.70 |
| TP 4 | 783.4 | −0.94 | 915.6 | −0.75 |
| TP 5 | 485.8 | −0.99 | 898.3 | −0.41 |
| TP 6 | 709.7 | −0.43 | 818.4 | 0.48 |
| TP 7 | 610.0 | −0.85 | 759.4 | −0.34 |
| TP 8 | 414.6 | −0.46 | 656.7 | 0.54 |
| TP 9 | 446.0 | −0.71 | 529.0 | −0.01 |
| TP 10 | 466.1 | −0.27 | 497.7 | −0.27 |
| Future-TP 1 | 1466.5 | −0.98 | 2675.4 | −0.68 |
| TP 2 | 1205.1 | −0.90 | 2459.0 | −0.52 |
| TP 3 | 977.0 | −0.92 | 2186.1 | −0.28 |
| TP 4 | 1225.5 | −1.02 | 2083.8 | −0.57 |
| TP 5 | 1116.4 | −1.03 | 1870.6 | −0.45 |
| TP 6 | 862.6 | −0.85 | 1789.1 | −0.49 |
| TP 7 | 1042.4 | −0.74 | 1474.7 | −0.73 |
| TP 8 | 844.5 | −0.81 | 1271.1 | −0.73 |
| TP 9 | 732.7 | −0.75 | 1232.8 | 0.21 |
| TP 10 | 736.3 | −0.60 | 1235.9 | −0.10 |
5. Conclusions
Acknowledgments
Conflicts of Interest
References
- Intergovernmental Panel on Climate Change (IPCC). Fourth Assessment Report of the IPCC; Solomon, S., Qin, D., Manning, M., Chen, Z., Marquis, M., Averyt, K.B., Tignor, M., Miller, H.L., Eds.; Cambridge University Press: Cambridge, UK; New York, NY, USA, 2007; p. 996. [Google Scholar]
- Intergovernmental Panel on Climate Change (IPCC). A Special Report of Working Groups I and II of the Intergovernmental Panel on Climate Change. In Managing the Risks of Extreme Events and Disasters to Advance Climate Change Adaptation; Field, C.B., Barros, V., Stocker, T.F., Qin, D., Dokken, D.J., Ebi, K.L., Mastrandrea, M.D., Mach, K.J., Plattner, G.-K., Allen, S.K., et al., Eds.; Cambridge University Press: Cambridge, UK; New York, NY, USA, 2012; p. 582. [Google Scholar]
- Ge, X.; Li, T.; Zhang, S.; Peng, M. What causes the extremely heavy rainfall in Taiwan during Typhoon Morakot 2009? Atmos. Sci. Lett. 2010, 11, 46–50. [Google Scholar]
- Chu, H.J.; Pan, T.Y.; Liou, J.J. Extreme precipitation estimation with typhoon Morakot using frequency and spatial analysis. Terr. Atmos. Ocean. Sci. 2011, 22, 549–558. [Google Scholar] [CrossRef]
- Lu, H.S.; Hwang, L.S.; Lin, J.P.; Lin, C.L.; Wang, C.H. Design hyetograph estimation of different durations in the Fushan area of north-eastern Taiwan. J. Chin. Soil Water Conserv. 2007, 38, 399–415. (in Chinese). [Google Scholar]
- Huff, F.A. Time distribution of rainfall in heavy storms. Water Resour. Res. 1967, 3, 1007–1019. [Google Scholar] [CrossRef]
- Lee, K.T.; Ho, J.Y. Design hyetograph for typhoon rainstorms in Taiwan. J. Hydrol. Eng. 2008, 13, 647–651. [Google Scholar] [CrossRef]
- Lin, G.F.; Chen, L.H.; Kao, S.C. Development of regional design hyetographs. Hydrol. Process. 2005, 19, 937–946. [Google Scholar] [CrossRef]
- Chien, F.C.; Kuo, H.C. On the extreme rainfall of Typhoon Morakot (2009). J. Geophys. Res. 2011, 116. [Google Scholar] [CrossRef]
- Oouchi, K.; Yoshimura, J.; Yoshimura, H.; Mizuta, R.; Kusunoki, S.; Noda, A. Tropical cyclone climatology in a global-warming climate as simulated in a 20 km-mesh global atmospheric model: Frequency and wind intensity analyses. J. Meteorol. Soc. Japan 2006, 84, 259–276. [Google Scholar] [CrossRef]
- Mizuta, R.; Oouchi, K.; Yoshimura, H.; Noda, A.; Katayama, K.; Yukimoto, S.; Hosaka, M.; Kusunoki, S.; Kawai, H.; Nakawaga, M. 20-km-mesh global climate simulations using JMA-GSM model. J. Meteorol. Soc. Japan 2006, 84, 165–185. [Google Scholar] [CrossRef]
- Kitoh, A.; Yatagai, A.; Alpert, P. First super-high-resolution model projection that the ancient “Fertile Crescent” will disappear in this century. Hydrol. Res. Lett. 2008, 2, 1–4. [Google Scholar] [CrossRef]
- Liu, C.M.; Wu, M.C.; Paul, S.; Chen, C.Y.; Lin, S.H.; Lin, W.S.; Lee, Y.C.; Hsu, H.H.; Tzeng, R.Y.; Chen, C.T. Super-ensemble of three RCMs for climate projection over East Asia and Taiwan. Theor. Appl. Climatol. 2011, 103, 265–278. [Google Scholar] [CrossRef]
- Tung, C.P. Climate change impacts on water resources of the Tsengwen creek watershed in Taiwan. J. Am. Water Resour. As. 2001, 37, 167–176. [Google Scholar] [CrossRef]
- Taiwan Water Resources Agency (WRA). Hydrological Year Book of Taiwan; (in Chinese). Republic of China Ministry of Economic Affairs: Taipei, Taiwan, 2004.
- Mizuta, R.; Yoshimura, H.; Murakami, H.; Matsueda, M.; Endo, H.; Ose, T.; Kamiguchi, K.; Hosaka, M.; Sugi, M.; Yukimoto, S.; et al. Climate simulations using MRI-AGCM3.2 with 20-km grid. J. Meteor. Soc. Japan 2012, 90A, 233–258. [Google Scholar] [CrossRef]
- Endo, H.; Kitoh, A.; Ose, T.; Mizuta, R.; Kusunoki, S. Future changes and uncertainties in Asian precipitation simulated by multiphysics and multi-sea surface temperature ensemble experiments with high-resolution Meteorological Research Institute atmospheric general circulation models (MRI-AGCMs). J. Geophys. Res. 2012, 117. [Google Scholar] [CrossRef]
- Kitoh, A.; Ose, T.; Kurihara, K.; Kusunoki, S.; Sugi, M. KAKUSHIN Team-3 Modeling Group. Projection of changes in future weather extremes using super-high-resolution global and regional atmospheric models in the KAKUSHIN program: Results of preliminary experiments. Hydrol. Res. Lett. 2009, 3, 49–53. [Google Scholar] [CrossRef]
- The Weather Research and Forecasting (WRF). Available online: http://wrf-model.org/ (accessed on 30 January 2014).
- Piani, C.; Haerter, J.O.; Coppola, E. Statistical bias correction for daily precipitation in regional climate models over Europe. Theor. Appl. Climatol. 2010, 99, 187–192. [Google Scholar] [CrossRef]
- Taiwan Climate Change Projection & Information Platform (CCIP). Available online: http://tccip.ncdr.nat.gov.tw/NCDR/main/index.aspx (accessed on 30 January 2014).
- Shih, D.S. Analysis of typhoon-induced rainfall patterns (in Chinese). Master’s Thesis, National Central University, Jhongli, Taiwan, May 2001; p. 141. [Google Scholar]
- Bobee, B.; Ashkar, F. The Gamma Family and Derived Distributions Applied in Hydrology; Water Resources Publications: Fort Collins, CO, USA, 1991. [Google Scholar]
- Griffis, V.W.; Stedinger, J.R. Log-pearson type 3 distribution and its application in flood frequency analysis. I: Distribution characteristics. J. Hydrol. Eng. 2007, 12, 482–491. [Google Scholar] [CrossRef]
- Chow, V.T.; Maidment, D.R.; Mays, L.W. Applied Hydrology; McGraw-Hill Publishing Company: New York, NY, USA, 1988; pp. 380–491. [Google Scholar]
- Kite, G.W. Frequency and Risk Analysis in Hydrology; Water Resources Publications: Fort Collins, CO, USA, 1977. [Google Scholar]
- Cheng, K.S.; Lin, G.F.; Yu, G.H.; Lee, K.T.; Wang, R.Y.; Hsu, M.H.; Yu, P.S. Hydrologic DesignApplication HandBook; Water Resources Bureau Research Reports; National Taiwan University, Department of Biological Environmental Systems Engineering: Taipei, Taiwan, 2001. (in Chinese) [Google Scholar]
- Efron, B.; Tibshirani, R. An Introduction to the Bootstrap; Chapman & Hall/CRC: Boca Raton, FL, USA, 1993; p. 456. [Google Scholar]
- Takasao, T.; Takara, K.; Shimizu, A. A basic study on frequency analysis of hydrologic data in the Lake Biwa basin, Annual of Disas. Prev. Res. Inst. Kyoto Univ. 1986, 29, 157–171. (in Japanese). [Google Scholar]
- Fukami, K.; Sugiura, Y.; Magome, J.; Kawakami, T. Integrated Flood Analysis System (IFAS Ver. 1.2), User’s Manual; Japan PWRI-Technical Note No.4148; Publisher: Tshukuba, Japan, 2009; p. 223. [Google Scholar]
- Sugiura, T.; Fukami, K.; Fujiwara, N.; Hamaguchi, K.; Nakamura, S.; Hironaka, S.; Nakamura, K.; Wada, T.; Ishikawa, M.; Shimizu, T.; et al. Development of Integrated Flood Analysis System (IFAS) and its applications. In Proceedings of the Conference on Hydroinfomatics, Concepción, Chile, 12-16 January 2009. [CrossRef]
- Aziz, A.; Tanaka, S. Regional parameterization and applicability of Integrated Flood Analysis System (IFAS) for flood forecasting of upper-middle Indus River. Pak. J. Meteorol. 2011, 8, 21–38. [Google Scholar]
- Yoshino, F.; Yoshitani, J.; Sugiura, M. A conceptual distributed model for large-scale mountainous basins. In Hydrology of Mountainous Regions. I—Hydrological Measurements; the Water Cycle; Lang, H., Musy, A., Eds.; IAHS Publisher: Lausanne, Switzerland, 1990; pp. 685–692. [Google Scholar]
- Hydrological Data and Maps Based on SHuttle Elevation Derivatives at Multiple Scales (HydroSHEDS). Available online: http://hydrosheds.cr.usgs.gov/index.php (accessed on 31 October 2013).
- International Steering Committee for Global Mapping (ISCGM). Available online: http://iscgm.org/cgi-bin/fswiki/wiki.cgi (accessed on 31 October 2013).
- UNEP. GNV25 Soil water holding capacity. Available online: http://www.grid.unep.ch/data/data.php (accessed on 31 October 2013).
- Thiessen, A.H. Precipitation averages for large areas. Mon. Weather Rev. 1911, 39, 1082–1084. [Google Scholar]
- Kimura, N.; Chiang, S.; Wei, H.P.; Su, Y.F.; Chu, J.L.; Cheng, C.T.; Liou, J.J.; Chen, Y.M.; Lin, L.Y. Hydrological flood simulation to Tsengwen reservoir watershed under global climate change with 20 km mesh Meteorological Research Institute atmospheric general circulation model (MRI-AGCM). Terr. Atmos. Ocean. Sci. 2013. submitted for publication. [Google Scholar]
- Nash, J.E.; Sutcliffe, J.V. River flow forecasting through conceptual models: Part I—A discussion of principles. J. Hydrol. 1970, 10, 282–290. [Google Scholar] [CrossRef]
- Yeh, C.L.; Yang, S.H.; Wei, S.T.; Hsieh, T.C. Review and Application of the River Warning Level and the RegionalDrainageAlertby Rainfall; (in Chinese). Water Resources Agency, Republic of China Ministry of Economic Affairs: Taipei, Taiwan, 2010. [Google Scholar]
- Liu, K.F.; Wu, Y.H.; Chen, Y.C.; Chiu, Y.J.; Shih, S.S. Large-scale simulation of watershed mass transport: A case study of Tsengwen reservoir watershed, southwest Taiwan. Nat. Hazards 2013, 67, 855–867. [Google Scholar] [CrossRef]
© 2014 by the authors; licensee MDPI, Basel, Switzerland. This article is an open access article distributed under the terms and conditions of the Creative Commons Attribution license (http://creativecommons.org/licenses/by/3.0/).
Share and Cite
Kimura, N.; Tai, A.; Chiang, S.; Wei, H.-P.; Su, Y.-F.; Cheng, C.-T.; Kitoh, A. Hydrological Flood Simulation Using a Design Hyetograph Created from Extreme Weather Data of a High-Resolution Atmospheric General Circulation Model. Water 2014, 6, 345-366. https://doi.org/10.3390/w6020345
Kimura N, Tai A, Chiang S, Wei H-P, Su Y-F, Cheng C-T, Kitoh A. Hydrological Flood Simulation Using a Design Hyetograph Created from Extreme Weather Data of a High-Resolution Atmospheric General Circulation Model. Water. 2014; 6(2):345-366. https://doi.org/10.3390/w6020345
Chicago/Turabian StyleKimura, Nobuaki, Akira Tai, Shen Chiang, Hsiao-Ping Wei, Yuan-Fong Su, Chao-Tzuen Cheng, and Akio Kitoh. 2014. "Hydrological Flood Simulation Using a Design Hyetograph Created from Extreme Weather Data of a High-Resolution Atmospheric General Circulation Model" Water 6, no. 2: 345-366. https://doi.org/10.3390/w6020345
APA StyleKimura, N., Tai, A., Chiang, S., Wei, H.-P., Su, Y.-F., Cheng, C.-T., & Kitoh, A. (2014). Hydrological Flood Simulation Using a Design Hyetograph Created from Extreme Weather Data of a High-Resolution Atmospheric General Circulation Model. Water, 6(2), 345-366. https://doi.org/10.3390/w6020345