1. Introduction
With increasing economic and population growth in developing countries, water scarcity and pollution problems have becoming increasingly prominent in northern China. Water environment management is supposed to be an efficient way to improve water quality and allocate water resources, specifically, wastewater reuse has drawn increasing attention as an integral part of water management [
1,
2,
3]. Reclaimed water is highly treated wastewater which is clear in appearance, odorless and is safe for a variety of beneficial uses [
4]. It has been used in large municipalities in total water management, especially in areas with scarce water resources but rapid population and economic growth rate [
5]. Tianjin municipality is a typical example of such areas. Therefore, this study aims to use an integrated water environment management system to improve water quality, properly allocate water resources, and support socio-economic development, while reclaimed water should be used as an efficient approach to support this system [
6].
Studies of water environment management and water reclamation in China are primarily concerned with theories and theoretical models at the national level [
7]. Another important research direction is the cost-benefit analysis of water related projects and technologies, and of the optimal scale of water resource utilization under various technological and institutional conditions [
8]. Research on the comprehensive dynamic modeling of water environment management system with focus on exploring potential and feasibility of water reclamation is relatively rare.
Several research adopted dynamic modeling and simulation approach to explore the potential of wastewater reuse and water resource management are used in China [
9]. Water resources problems contain many variables and constraints; it is necessary to use comprehensive optimization model and simulation method to estimate precisely the socio-economic and environment impacts that may result from reclaimed water utilization and water management decisions [
10,
11]. There are rare studies consider the connection of water resources, water pollution, and economic influences in one integrated system. Demonstrative research includes developing a complex system dynamics model (SD) reflecting interactions between water resources, Environmental Flow (EF) and socio-economy [
12]. In Japan, several researchers [
13,
14] have constructed simulation models to evaluate water utilization and water purification technologies in a systematic model; they utilized optimization models which can quantify and express mathematically all the planning objectives, including water utilization, wastewater treatment, population, and economic activities. Still, water resource recycle system is not included in their water management system.
Based on these considerations, this study utilized a dynamic optimization model to demonstrate water environment management system, with focusing on reclaimed water utilization to pursue sustainable development. The integrated water environment management system aims to precisely reflect current and future water management adjustments and their impacts, which includes water flow as water supply-demand-recycle, water pollutants flow as generation-emission-disposal, and socio-economic activities in one systematic model.
The dynamic optimization model we constructed is a combination of a socio-economic model and water environment model, which aims to comprehensively reflects water utilization and reuse and its contribution on improving the trade-off between economic and environment development. We adopted LINGO to express the water environment management model, LINGO as a linear programming procedure is often an efficient ways to solve optimization dynamic simulation problems [
15].
Simulation results can precisely forecast socio-economic trends, water supply and demand trends, and potential impacts of reclaimed water usage on achieving water environment improvement and economic development in research period. The framework established in this study and the results of the Tianjin case study help to better understand the complex systems and apply this water environment management system to solve water related issues in sustainable regional development.
2. Water Environment Management Modeling and System Construction
In order to construct an effective dynamic simulation model of water environment management system, we need to have the basic information of current situation in the catchment area, including social and economic, water resources supply and demand, water pollutants generation and treatment, and reclaimed water cycle situation.
2.1. Water Environment Management System Framework
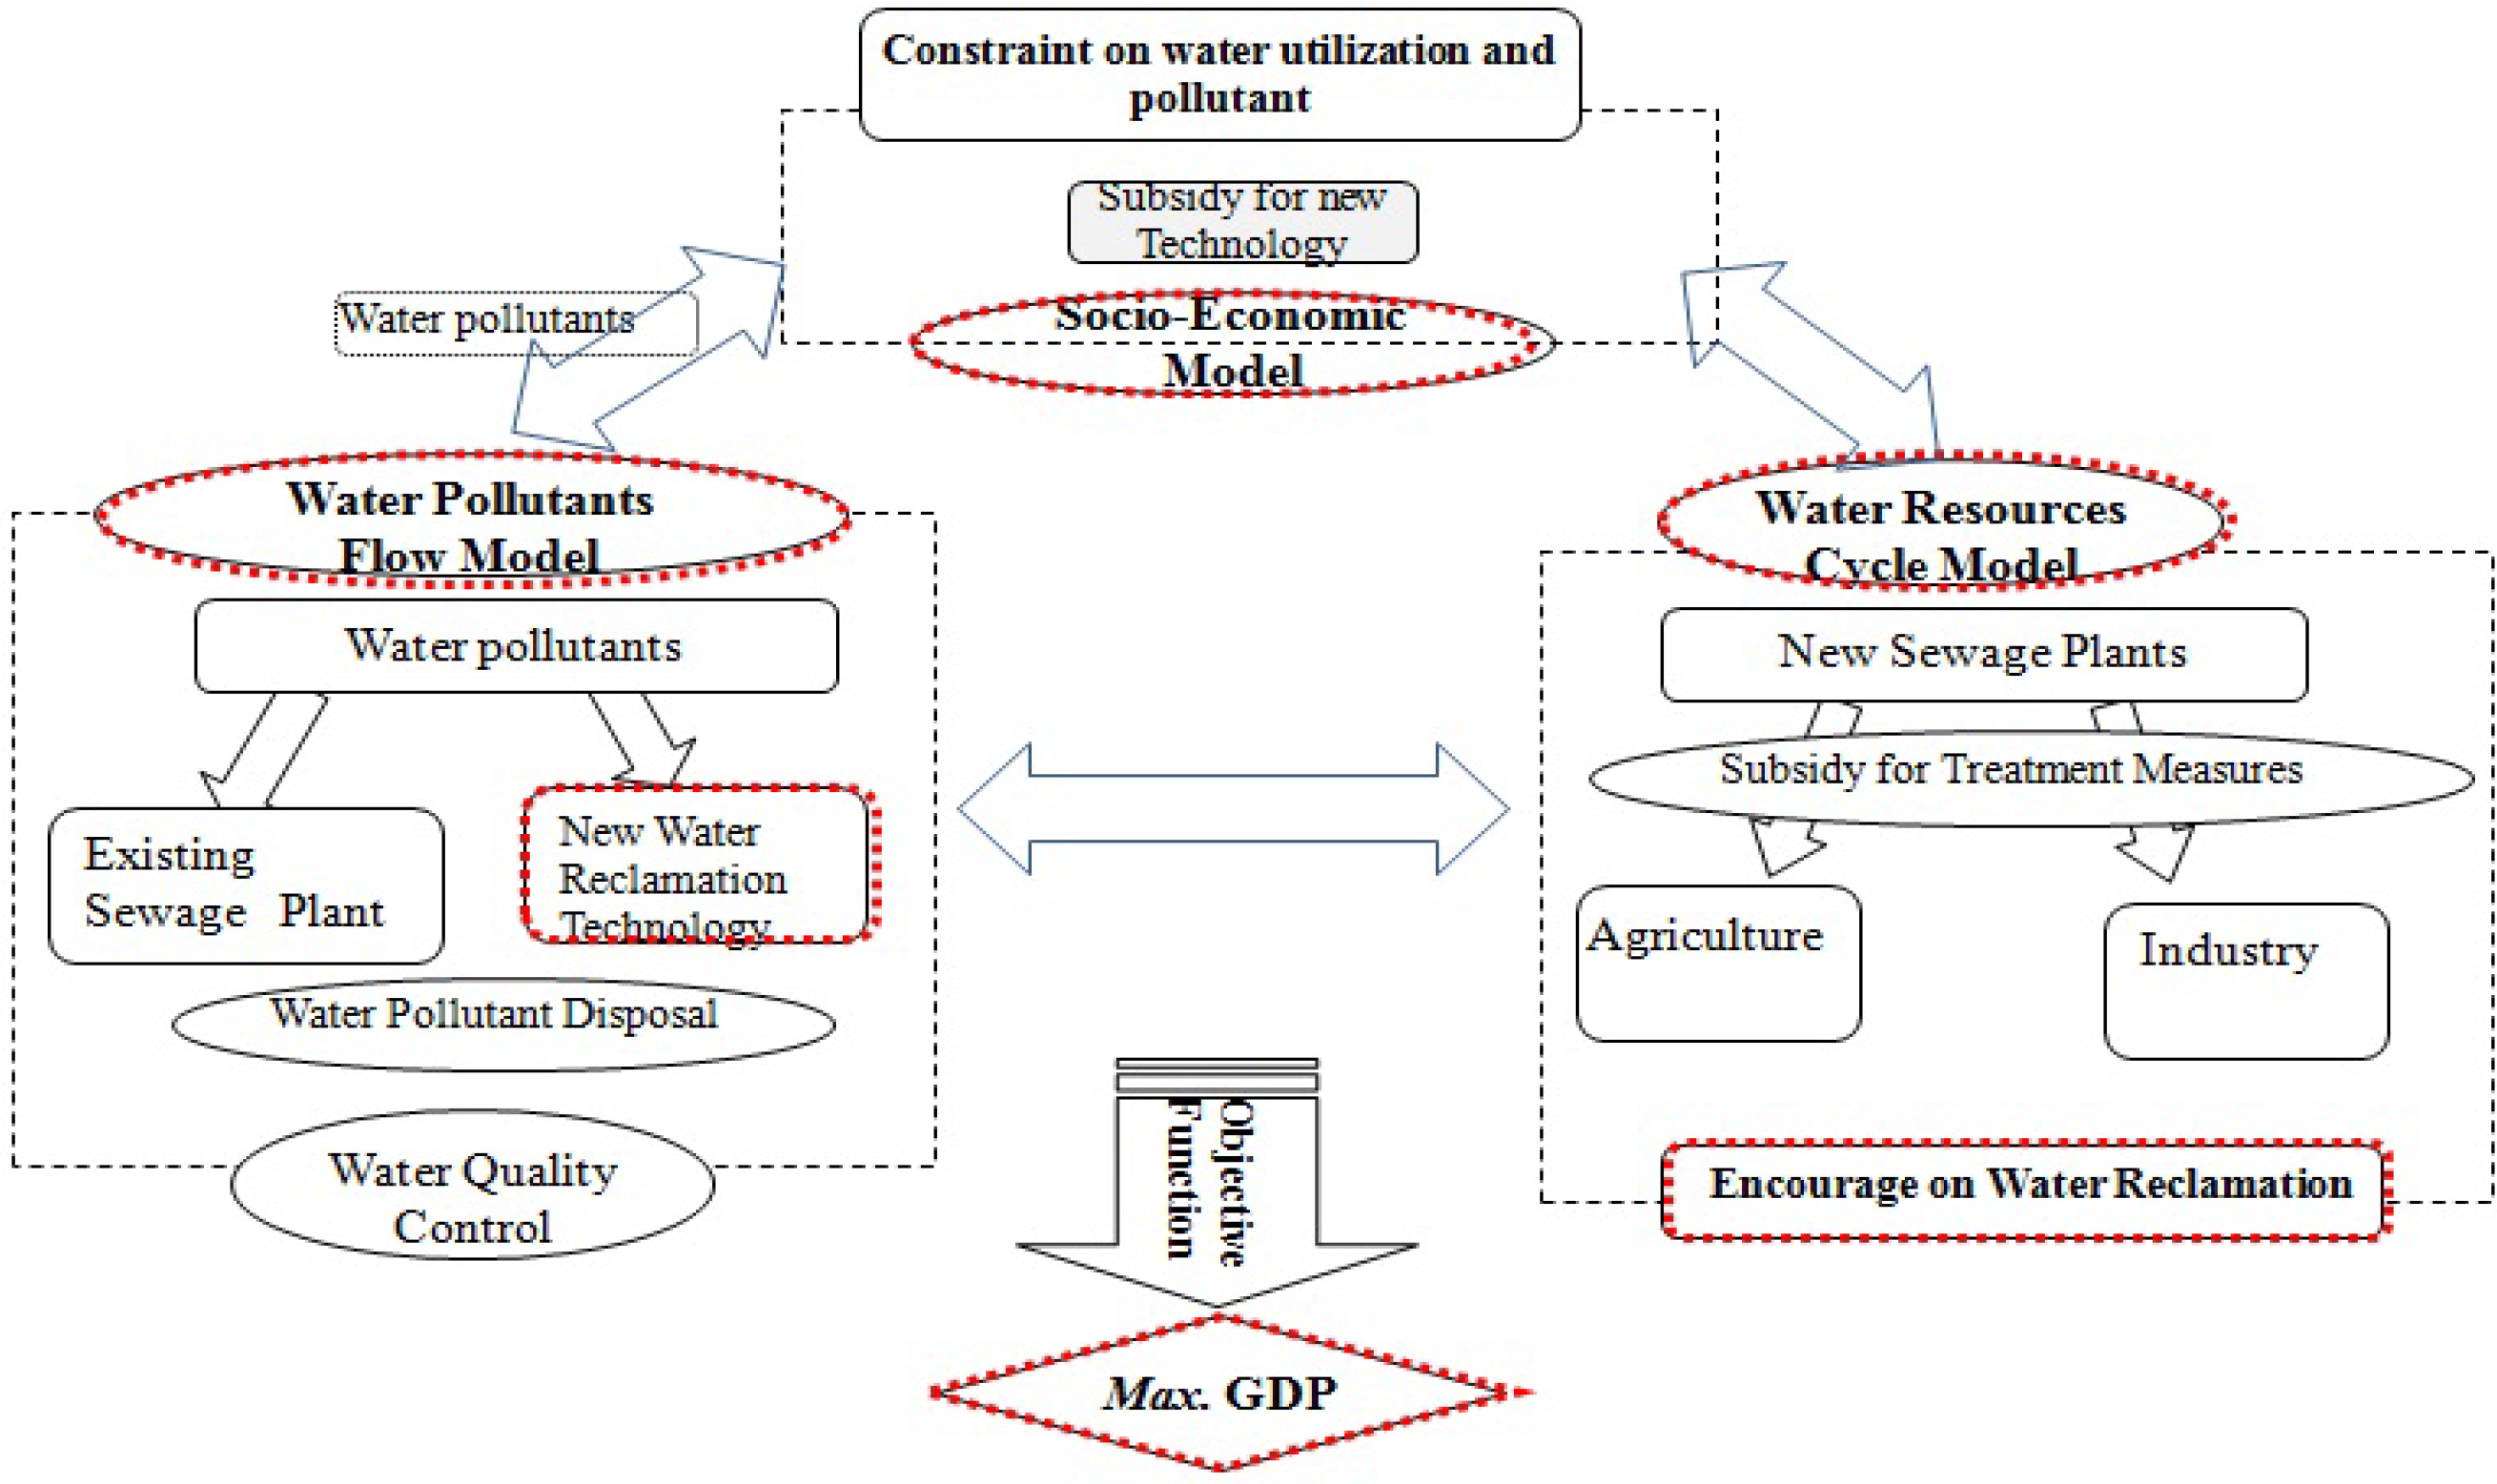
This research designed an integrated dynamic model of water environment management system focusing on water recycle. As demonstrated by
Figure 1, the comprehensive simulation model contains three sub-models: a social-economic model, a water pollutants flow balance model, and a reclaimed water cycle model. These three sub-models react with each other, encourage and constrain each other’s development obeying value flow balance and material flow balance.
Figure 1.
Implementation of the integrated dynamic model.
Figure 1.
Implementation of the integrated dynamic model.
Note: the highlighted area is the main objectives in this simulation model: Max GDP as the target with socio-economic, water pollutants and water resources constraints, while the model focuses on water reclamation using new technologies introduction to improve local sustainable development.
It is a combination of “Top Down” socio-economic model based on dynamic Input-Output model, and a “Bottom-Up” water resources cycle model with technologies introduction and evaluation. The water pollutants flow balance model utilizes new sewage plants installation to control water pollutants emission; the reclaimed water cycle model uses reclaimed water to provide water supply.
2.2. Social and Economic Development System
Local population and industry conditions provide the basis for constructing an socio-economic development system. We can choose whether maximize economic development or minimize water pollutants amount in this model to suit local plan. As in Tianjin city, economic development speed is high (16.5% of GDP increase rate in 2010) [
16], and local government has a target to maintain high developing trends in the short term. Therefore, in this case, the objective function was constructed to maximize the total GDP over the target term to determine an optimal development. The amount of water pollutants and water resources give constraints on social-economic development. In the descriptions of model, variables follow each equation. Because of a limitation of space, this paper just demonstrates the representative equations which can illustrate the logic of this simulation model. In these equations, en is the abbreviation for endogenous and ex is the abbreviation for exogenous.
where
Xm(
t) is the total production from industry
m (
m = 1, Primary industry;
m = 2, Secondary industry;
m = 3, Tertiary industry) (en);
GDP(
t) is determined by each industry’s production and value-added rate for industry m,
vm (ex).
The socio-economic model is constructed based on dynamic Input-Output model. Industrial production will be decided by certain constraints, such as industry Input-Output coefficient, consumption, investment, capital stock:
where
X(
t) is the column vector of total production from industry
m Xm(
t) at time
t (en); industry production should obey the input-output constraints between each industries,
A is the input-output coefficient matrix (ex);
C(
t) is the column vector of total consumption (en);
I(
t) is the column vector total investment (en); Especially, we adopt new water treatment plants usually to improve water environment as well as support residents and industries water demand,
ESP (
t) is the coefficient associated with the production induced by the construction of sewage plants (ex);
ISP (
t) is the total investment in sewage plants (en);
e(
t) is the column vector of net export (en.);
T(
t) is the column vector of production resulting from transfer between provinces in China (en.).
Also, industry production must obey the limitation of the production ability based on industry capital stock, where Km(t) is capital available for industry m at time t (en.). Industry production development should obey the capital stock constraints. Capital Km(t-1) is the capital available for industry m at time t−1, plus I m(t) investment for industry m at time t (en.), minus capital depreciation at time t−1. dm is depreciation rate of industry (ex.); αm is ratio of capital to output in industry m (ex.).
2.3. Water Resources Cycle System
Residents and manufactories activities have significant impacts on total water environment. Rapid economic and population growth also produces high demands for water resources, and substantial generation of water pollutants. These trends will further intensify the environmental problems related to water resources. Residents’ behavior and industry structure adjustments, as well as water reclamation technology can release water resources and environment pressures, and provide more space for socio-economic development.
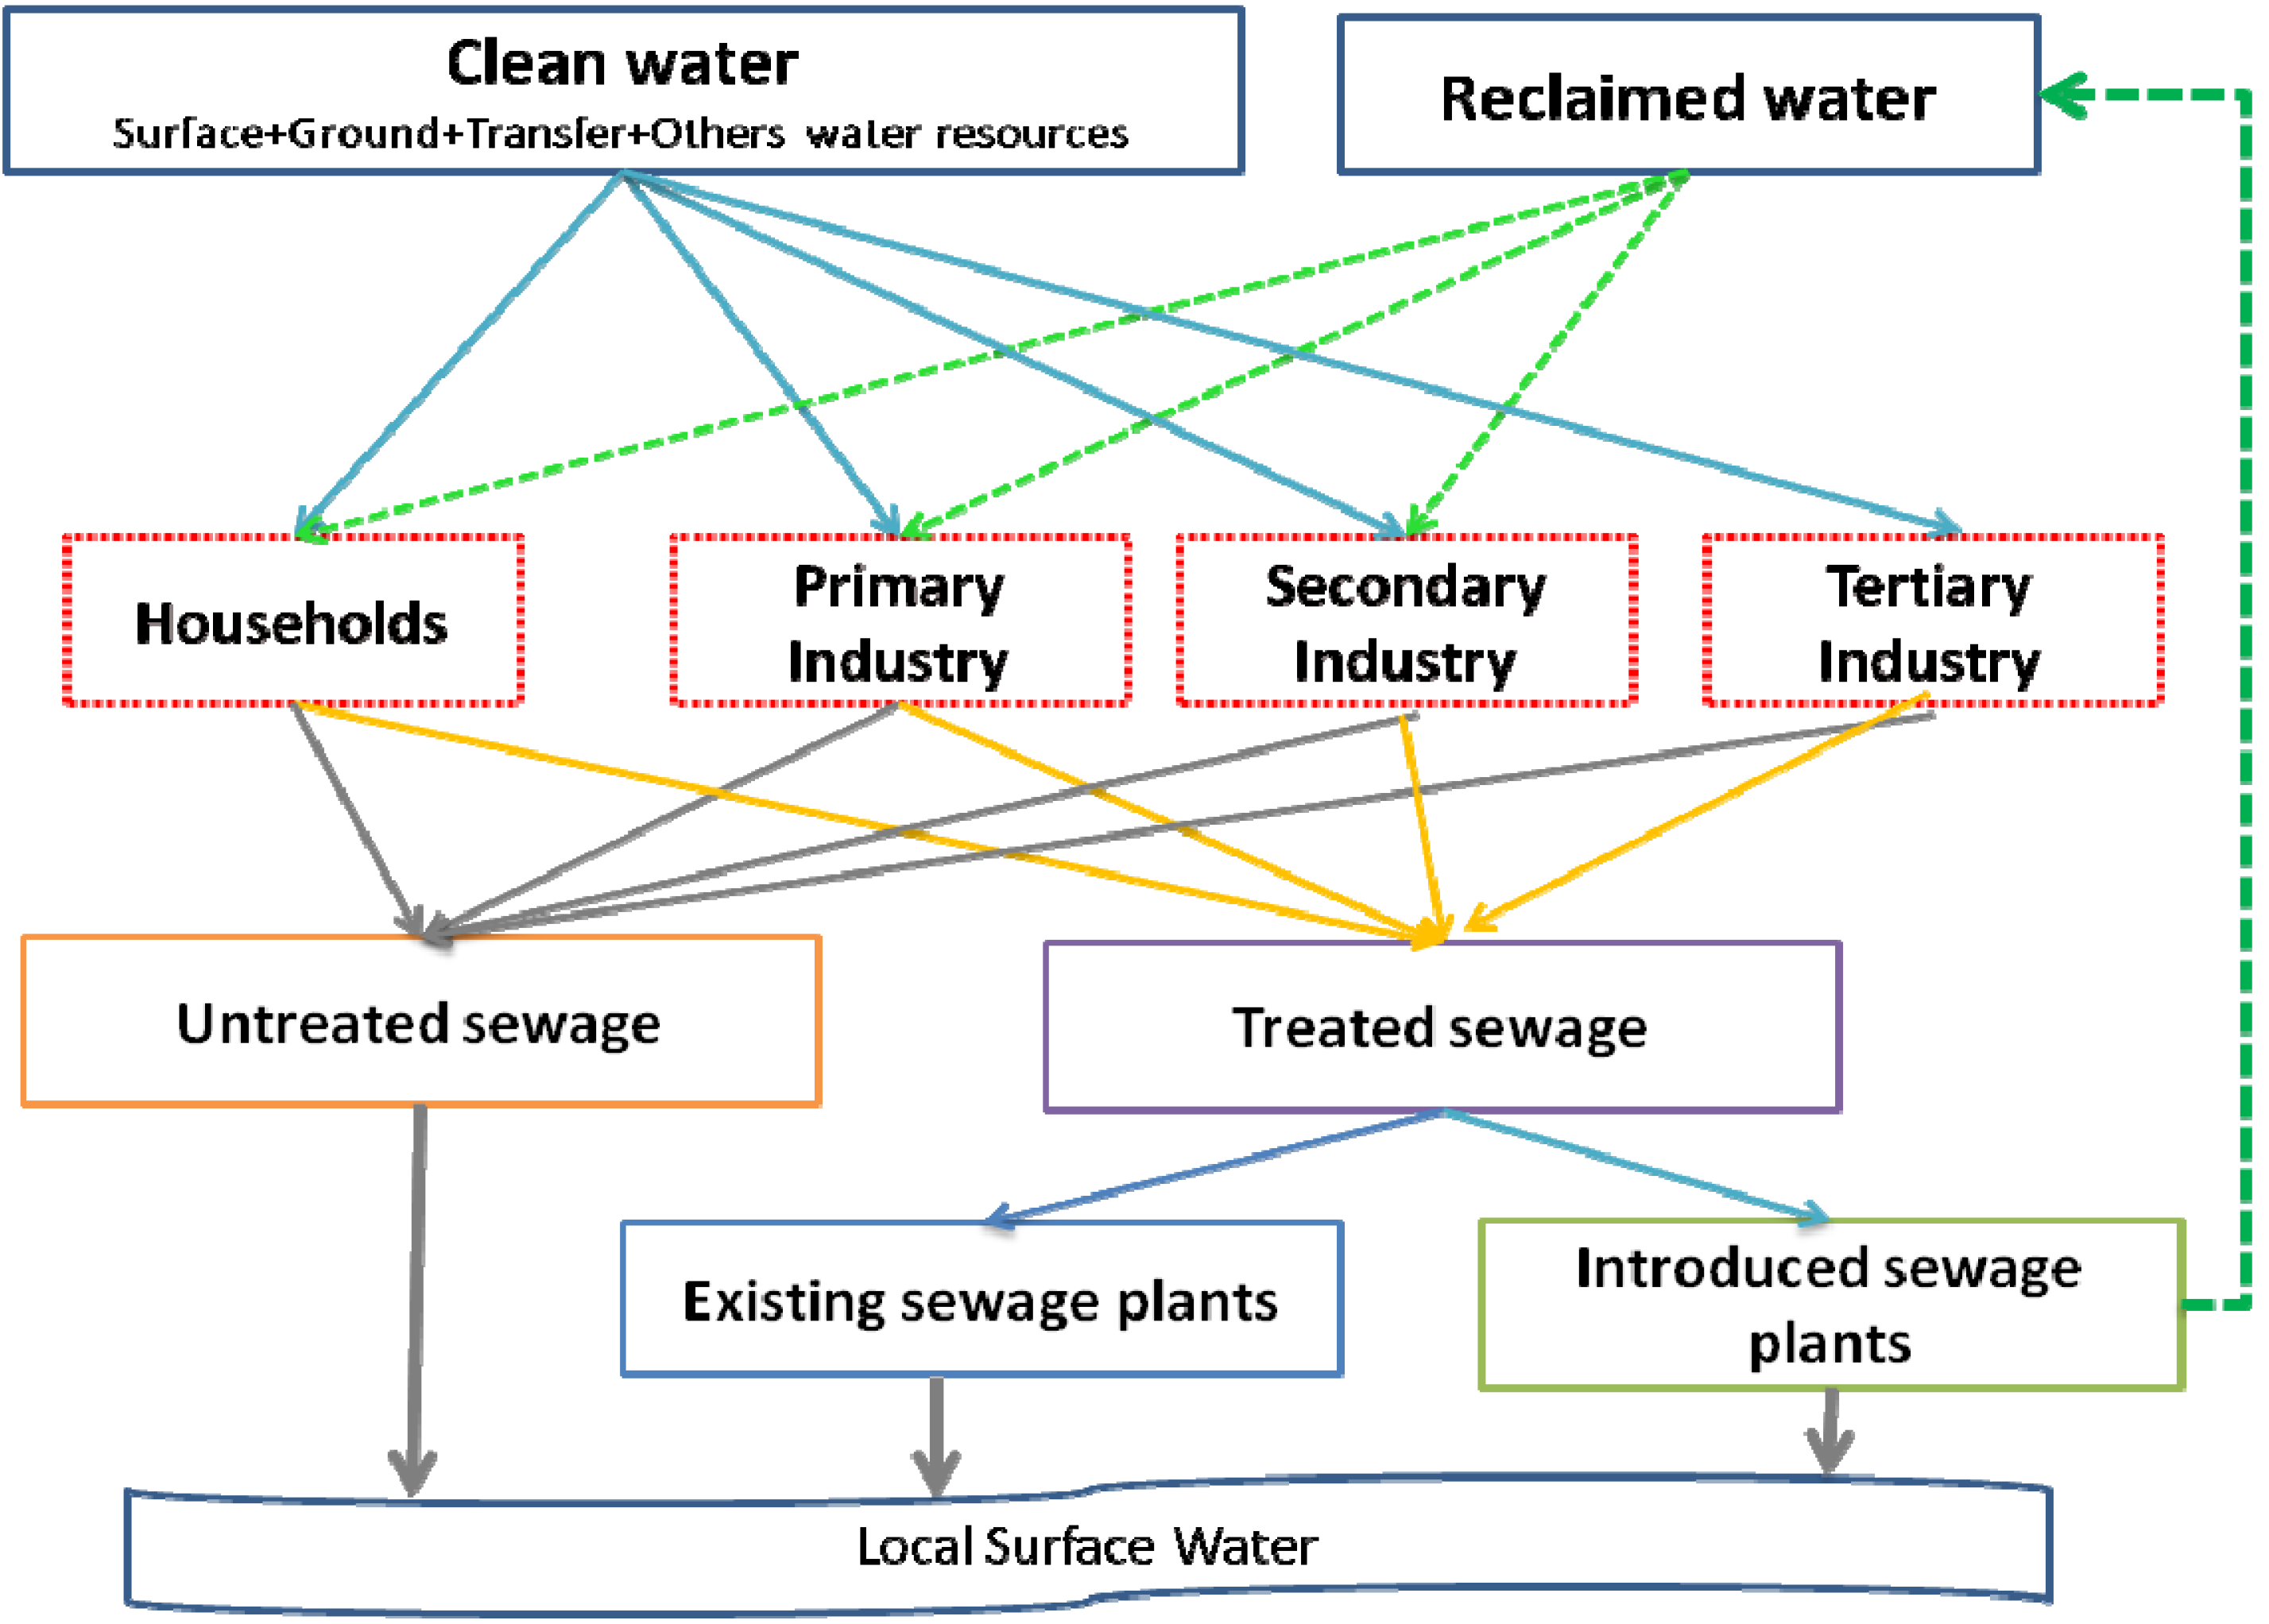
As demonstrated in
Figure 2, clean water and reclaimed water are the sources of the water supply. Reclaimed water is assumed to be used in primary and secondary industries, and households.
Figure 2.
Water flow in water resources cycle system.
Figure 2.
Water flow in water resources cycle system.
Note: the dot lines present the reclaimed water production, and distribution flows in this system.
Generally, the water supply must exceed the demand. Water demand is separated into 2 groups: household living water and industrial water (Here we have to mention that ecology water demand is fixed according to the prediction amount announced by local government, it will be added in the total water resources demand). Wastewater generated from secondary and tertiary industry, households will be treated by existing sewage plants and new installed sewage plants which are consistent with the local situation. New sewage plants with reclaimed water production capacity will provide reclaimed water to water supply. Wastewater discharged by primary industry, the wastewater disposed by existing sewage plants, and the residue wastewater discharged by new sewage plants will be emitted to local surface water directly. This is the water supply and demand balance, reclaimed water production and utilization balance in water resources cycle model. The same logic was used in a water pollutants flow balance model.
The total water supply is:
where
WS(
t) is the water supply (en);
WSP ![Water 06 00017 i004]()
is the clean water supply for industry m in region
j(en);
WSR ![Water 06 00017 i004]()
is the supply of reclaimed water for industry m(en);
WSP ![Water 06 00017 i005]()
is the clean water supply for households (en). Region (
j) classification should base on local administrative, economic, water environment situation.
The water demand is determined by socio-economic activities:
where
WD(
t) is the water demand (en) in region
j;
Ew ![Water 06 00017 i004]()
is the coefficient of water demand of industry m in region
j (ex);
Ew ![Water 06 00017 i005]()
is the coefficient of water demand of household living water in region
j (ex);
X ![Water 06 00017 i004]()
is the production of industry m in region
j (en);
Zj(
t) is the population in region
j (en).
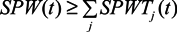
Wastewater is discharged by industry production and households. We will encourage all sewage produced (except by primary industry) to be treated to sewage plants, including existing and new sewage plants:
where
SPW(
t) is the amount of wastewater generated (en);
SPWTj(
t) is the amount of treated sewage water in region
j (en); the wastewater generated amount can be larger than treated amount.
Es ![Water 06 00017 i004]()
,
Es ![Water 06 00017 i005]()
are the sewage emission coefficients of industry
m and households in region
j, respectively (ex);
SPWT ![Water 06 00017 i010]()
and
SPWT ![Water 06 00017 i011]()
are the amounts of water treated by existing and new sewage plants, respectively, in region
j (en).
Therefore, the amount of reclaimed water reused for primary and secondary industry is determined by new established sewage plants.
where
RW(
t) is the amount of reclaimed water (en); α and β are the reclaimed water recycle rates of technology A and B (for example), respectively (ex);
![Water 06 00017 i013]()
and
![Water 06 00017 i014]()
are the amounts of water treated by new sewage plant A and new sewage plant B, respectively, in region
j (en).
2.4. Water Quality Control System
Environmental problems involving water will constrain local economic development under the current situation and trends in China [
17]. It is important to conduct water environment management with emphasize on water reclamation in order to solve regional water shortage and pollution problems while pursuing economic development. Water quality control is usually demonstrated by limitation of certain water pollutants emission amounts in regional plan. The representative indicators of water pollutants are Chemical Oxygen Demand (COD), ammonia (NH
3-N), Total Phosphorus (T-P), and heavy metal elements.
Water pollutants flow balance model reflects the process that water pollutants generated from household living and industry production, and then treated by sewage plants, including existing sewage plants and new constructed plants which have higher water pollutants disposal ability.
The total amount of water pollutants produced by economic and social activities is:
where
TP(
t) is the total net load of water pollutant at time
t (en);
Ep ![Water 06 00017 i004]()
and
Ep ![Water 06 00017 i005]()
are the coefficients of the pollutants from industry m and households, respectively, in region
j (ex);
STP ![Water 06 00017 i010]()
is the amount of water pollutants treated by existing sewage plants in region
j(en);
STP ![Water 06 00017 i011]()
is the amount of water pollutants treated by new installed sewage plants in region j(en).
STP ![Water 06 00017 i010]()
and
STP ![Water 06 00017 i011]()
are determined by
SPWT ![Water 06 00017 i010]()
and
SPWT ![Water 06 00017 i011]()
, different wastewater treatment plant will have different water pollutants reduction level.
2.5. Water Reclamation Technology Choices
In order to demonstrate the sewage treatment and reclaimed water production ability and their contribution on water supply support and water pollution reduction, we need to select demonstrative technologies to suite local situation and demand. For instance, Tianjin city needs water reclamation technologies with deeper sewage treatment and water reclamation ability to solve water pollution and shortage problems.
Sewage plants and technology choice is based on the demand for water pollutants reduction and reclaimed water recycle amount targets. The sewage water treatment amount of technology
A in region
j,
![Water 06 00017 i013]()
, need to be less than sewage water treatment capacity provided by sewage plants, which is
ta [sewage treatment amount of new sewage plant
A (ex.)] multiply
![Water 06 00017 i018]()
[sewage plant
A installation amount in region
j at time
t (en.)].
Also, investment for sewage plants construction is under local financial budget limit. Where iA and iB is the construction cost for each plant A and B. In this model, we neglected the maintenance cost for each plant; it can be added to suit different situation.
Here we on listed the demonstrative equations to reflect water environment management system, There are also some others equations to construct the system, such as the population changes, investment constraint for constructing new sewage plants, technology multiple choices, water pollutants reduction brought by various technologies.
3. Case Study and Data
Case study aims to further demonstrate the utilization of this model, and the process of using this model to propose an optimal water environment management plan pursue sustainable development while exploring the potential of reclaimed water reuse and applicable approaches. This study takes Tianjin as a target area, based on the consideration that Tianjin confronts heavy water shortage and water pollution problems, while speed economic and population growth will strengthen this situation. Tianjin city is located in an area of China in which serious water shortages occur. Also, the City has attempted to use integrated water environment management plan with emphasize on water reclamation and reuse. Therefore, it will be useful and necessary for Tianjin city to have an integrated plan for water environment management with emphasize on reclaimed water utilization. This study will use the water environment management model to run simulation, to verify the model accuracy in predicting the usage of reclaimed water to contribute water environment improvement and economic growth.
3.1. Constrains Setting for Dynamic Simulation
In this case study, we set a series of constrains for this comprehensive water environment management model: water pollutants emission limitation according to local government target −15% COD reduction by 2020 compared with that in 2009 (in case study, we adopted Chemical Oxygen Demand (COD) as major water pollutant index); water resources supply amount upper limit (2337 million m3 each as the upper limit for clean water resources supply); and industry development constrains defined by Input-Output model. Tianjin city can be divided into 11 regions based on administrative divisions and the regional plan (Six Urban Districts includes the six districts in the central urban area; Three Coastal Districts includes Tanggu, Hangu, and Dagang districts which have unified economic foundation and superior policy support).
3.2. Technologies Introduction
Since we utilize sewage treatment and water reclamation technology to solve current water environment problems in Tianjin city, we adopt Double Membrane Technology (Technology A) and Ceramic Membrane Water Treatment Technology (Technology B) in this analysis. Technology A is adopted from Beijing development area [
18]; it uses the MF (microfiltration) + RO (reverse osmosis) method for wastewater treatment. Technology B is developed from Japan (Metawater, Japan), it produces high-quality treated water; it has a stable operation with inferior input water, a high water resource recycle rate (more than 90%), a low operating cost, and ease of cleaning. Compared to Technology B, Technology A’s treatment capacity is greater, but its recycle rate and the quality of the reclaimed water are lower. A specific comparison of these 2 technologies is shown in
Table 1.
Table 1.
Comparison between Technology A and B.
Table 1.
Comparison between Technology A and B.
| Technologies | Wastewater treatment capacity-C (1000 ton/year) | Reclaimed water production capacity (1000 ton/year) | Investment-I (million CNY) | Output water quality | Reference |
|---|
| COD (mg/L) | TP (mg/L) | Reclaimed water recycle rate- α and β (estimated) |
|---|
| Technology A | 36,500 | 29,200 | 165 | <15 | <0.5 | 80% | [17] |
| Technology B | 10,950 | 9,850 | 70 | 2–6 | <0.1 | 90% | [18] |
3.3. Exogenous Data
Taking Tianjin city as an example, this study elaborates the classification of water resources flow in water environment management system. The total amount of water resources in 2009 is 2337 million m
3, or 190 m
3 per capita. This value is only 1/13 of the national average for China and 1/52 of the world average. Moreover, the structure of the water supply is not stable. The water supply consists primarily of a total of 103 million m
3 of polluted surface water. The 68 million m
3 of groundwater is used while groundwater faces over-exploitation. One-quarter of the water supply (58 million m
3) is provided by water transferred from the Yellow river or the Luan river. Dependence on transferred water produces not only a waste of resources but also an unstable supply. The amount of reclaimed water is only 1.2 million m
3, and reclaimed water projects are just beginning [
19]. In water demand, primary industry occupies the biggest water consumption, which needs to be improved in the future. Wastewater emitted by Primary industry is without treatment; it is directly emitted to the local surface water. The reuse rate of reclaimed water is only 2% in Tianjin in 2009, whereas the wastewater disposal rate is 82% according to Tianjin water statistics yearbook.
Table 2 shows the industry production and initial data in 2009, while
Table 3 is the Input-Output coefficient between these three industries.
Table 4 is the exogenous coefficients of water demand, wastewater and pollutant generation for each industry.
Table 2.
Economic indicators and initial data in 2009.
Table 2.
Economic indicators and initial data in 2009.
| Indicator | Description (Billion CNY) | m = 1 | m = 2 | m = 3 |
|---|
| Primary industry | Secondary industry | Tertiary industry |
|---|
| C | Consumption | 6,855 | 5,566 | 9,886 |
| I | Investment | 1,758 | 14,908 | 5,927 |
| e | Net export | 330 | 1,693 | 448 |
| T | Domestic Transfer | 4,609 | 9,515 | −6,918 |
| X | Total production | 25,841 | 86,771 | 28,156 |
Table 3.
Input-output coefficient between three industries for Tianjin city in 2007.
Table 3.
Input-output coefficient between three industries for Tianjin city in 2007.
| Indicators | m = 1 | m = 2 | m = 3 |
|---|
| A | m = 1 | 0.0829 | 0.0105 | 0.0055 |
| m = 2 | 0.3938 | 0.5997 | 0.1909 |
| m = 3 | 0.0884 | 0.1534 | 0.2588 |
| v (Added value ratio) | 0.4575 | 0.2468 | 0.5449 |
Table 4.
Coefficient indicators of water demand, sewage generation and water pollutant emission.
Table 4.
Coefficient indicators of water demand, sewage generation and water pollutant emission.
| Indicators | Description | Units | m = 1 | m = 2 | m = 3 | Z (Household) |
|---|
| Ew | Coefficient of water demand | 1000 m3/million CNY | 43.33 | 0.29 | 0.27 | 27.99 |
| Es | Coefficient of sewage discharge | 1000 m3/million CNY | 22.80 | 0.08 | 0.10 | 32.74 |
| Ep | Coefficient of pollutant emission | ton/million CNY | 3.10 | 0.45 | 0.22 | 28.11 |
Data are collected and calculated based on Tianjin Yearbook 2010, Tianjin Environment Bulletin in 2010, and Tianjin Water Bureau Statistical Year Book 2010 published by China Statistics Press, Tianjin Environment Protection Bureau, and Tianjin water bureau press respectively.
4. Simulation Results and Discussions
Based on data processing and simulation, this integrated water environment management system can provide estimation of reclaimed water reuse capacity, water supply and demand balance, and wastewater generation and treated in the research period; as well as economic and water quality control achievement under the set scenario.
4.1. Water Resources Supply, Demand, and Reuse Estimation
Reclaimed water can effectively contribute clean water supply, and reduce water pollutants according to simulation results. The amount of reclaimed water increases significantly. With the chosen two kinds of technology, the total reclaimed water recycle rate increases to 58% while its amount is 418 million tons. In order to produce such amount of reclaimed water, Tianjin city needs to construct 22 new sewage plants with Technology A and B, while the total budget is 2.93 billion CNY, with only 0.39 billion CNY per year.
As shown in
Figure 3, the ratio of reclaimed water to the amount of total wastewater keeps increasing. This also demonstrates the new sewage plants with reclaimed water production productivity can substitute existing sewage plants step by step. New installed sewage plants have high water treatment ability, and relatively low cost compared with existing sewage plants. Along with the stricter constraints on water pollutant emission, the simulation will construct more sewage plants to achieve water pollutants targets.
Among the 22 new plants that will be built in Tianjin, 15 are with technology A and 7 are with technology B. In former years, sewage plants with technology A were constructed to benefit from their superior capacity. Subsequently, technology B is installed and high-quality water treatment is obtained. The simulation also specifies the distribution of new sewage plants in 11 regions of Tianjin shown in
Table 5.
The regional construction plan shown in
Table 5 proves that the simulation allocates new sewage plants to the areas that lack sewage disposal ability and in which local government can offer sufficient financial capacity and industry can develop. Regions with high population and rapid economic development will construct more sewage plants in the long run, such as the six urban districts and three coastal districts. Generally, the different technologies chosen can contribute their specific advantages to Tianjin city during different times.
Figure 3.
Reclaimed water utilization recycle trend 2010–2020.
Figure 3.
Reclaimed water utilization recycle trend 2010–2020.
Table 5.
Regional installation plan for Technology A and B.
Table 5.
Regional installation plan for Technology A and B.
| Technologies | Six Urban Districts | Three Coastal Districts | Dongli District | Xiqing District | Jinnan District | Beichen District | Jinghai County | Total |
|---|
| A | 5 | 6 | 1 | 1 | 1 | 0 | 1 | 15 |
| B | 1 | 0 | 4 | 0 | 0 | 2 | 0 | 7 |
4.2. Economic Developing Trend
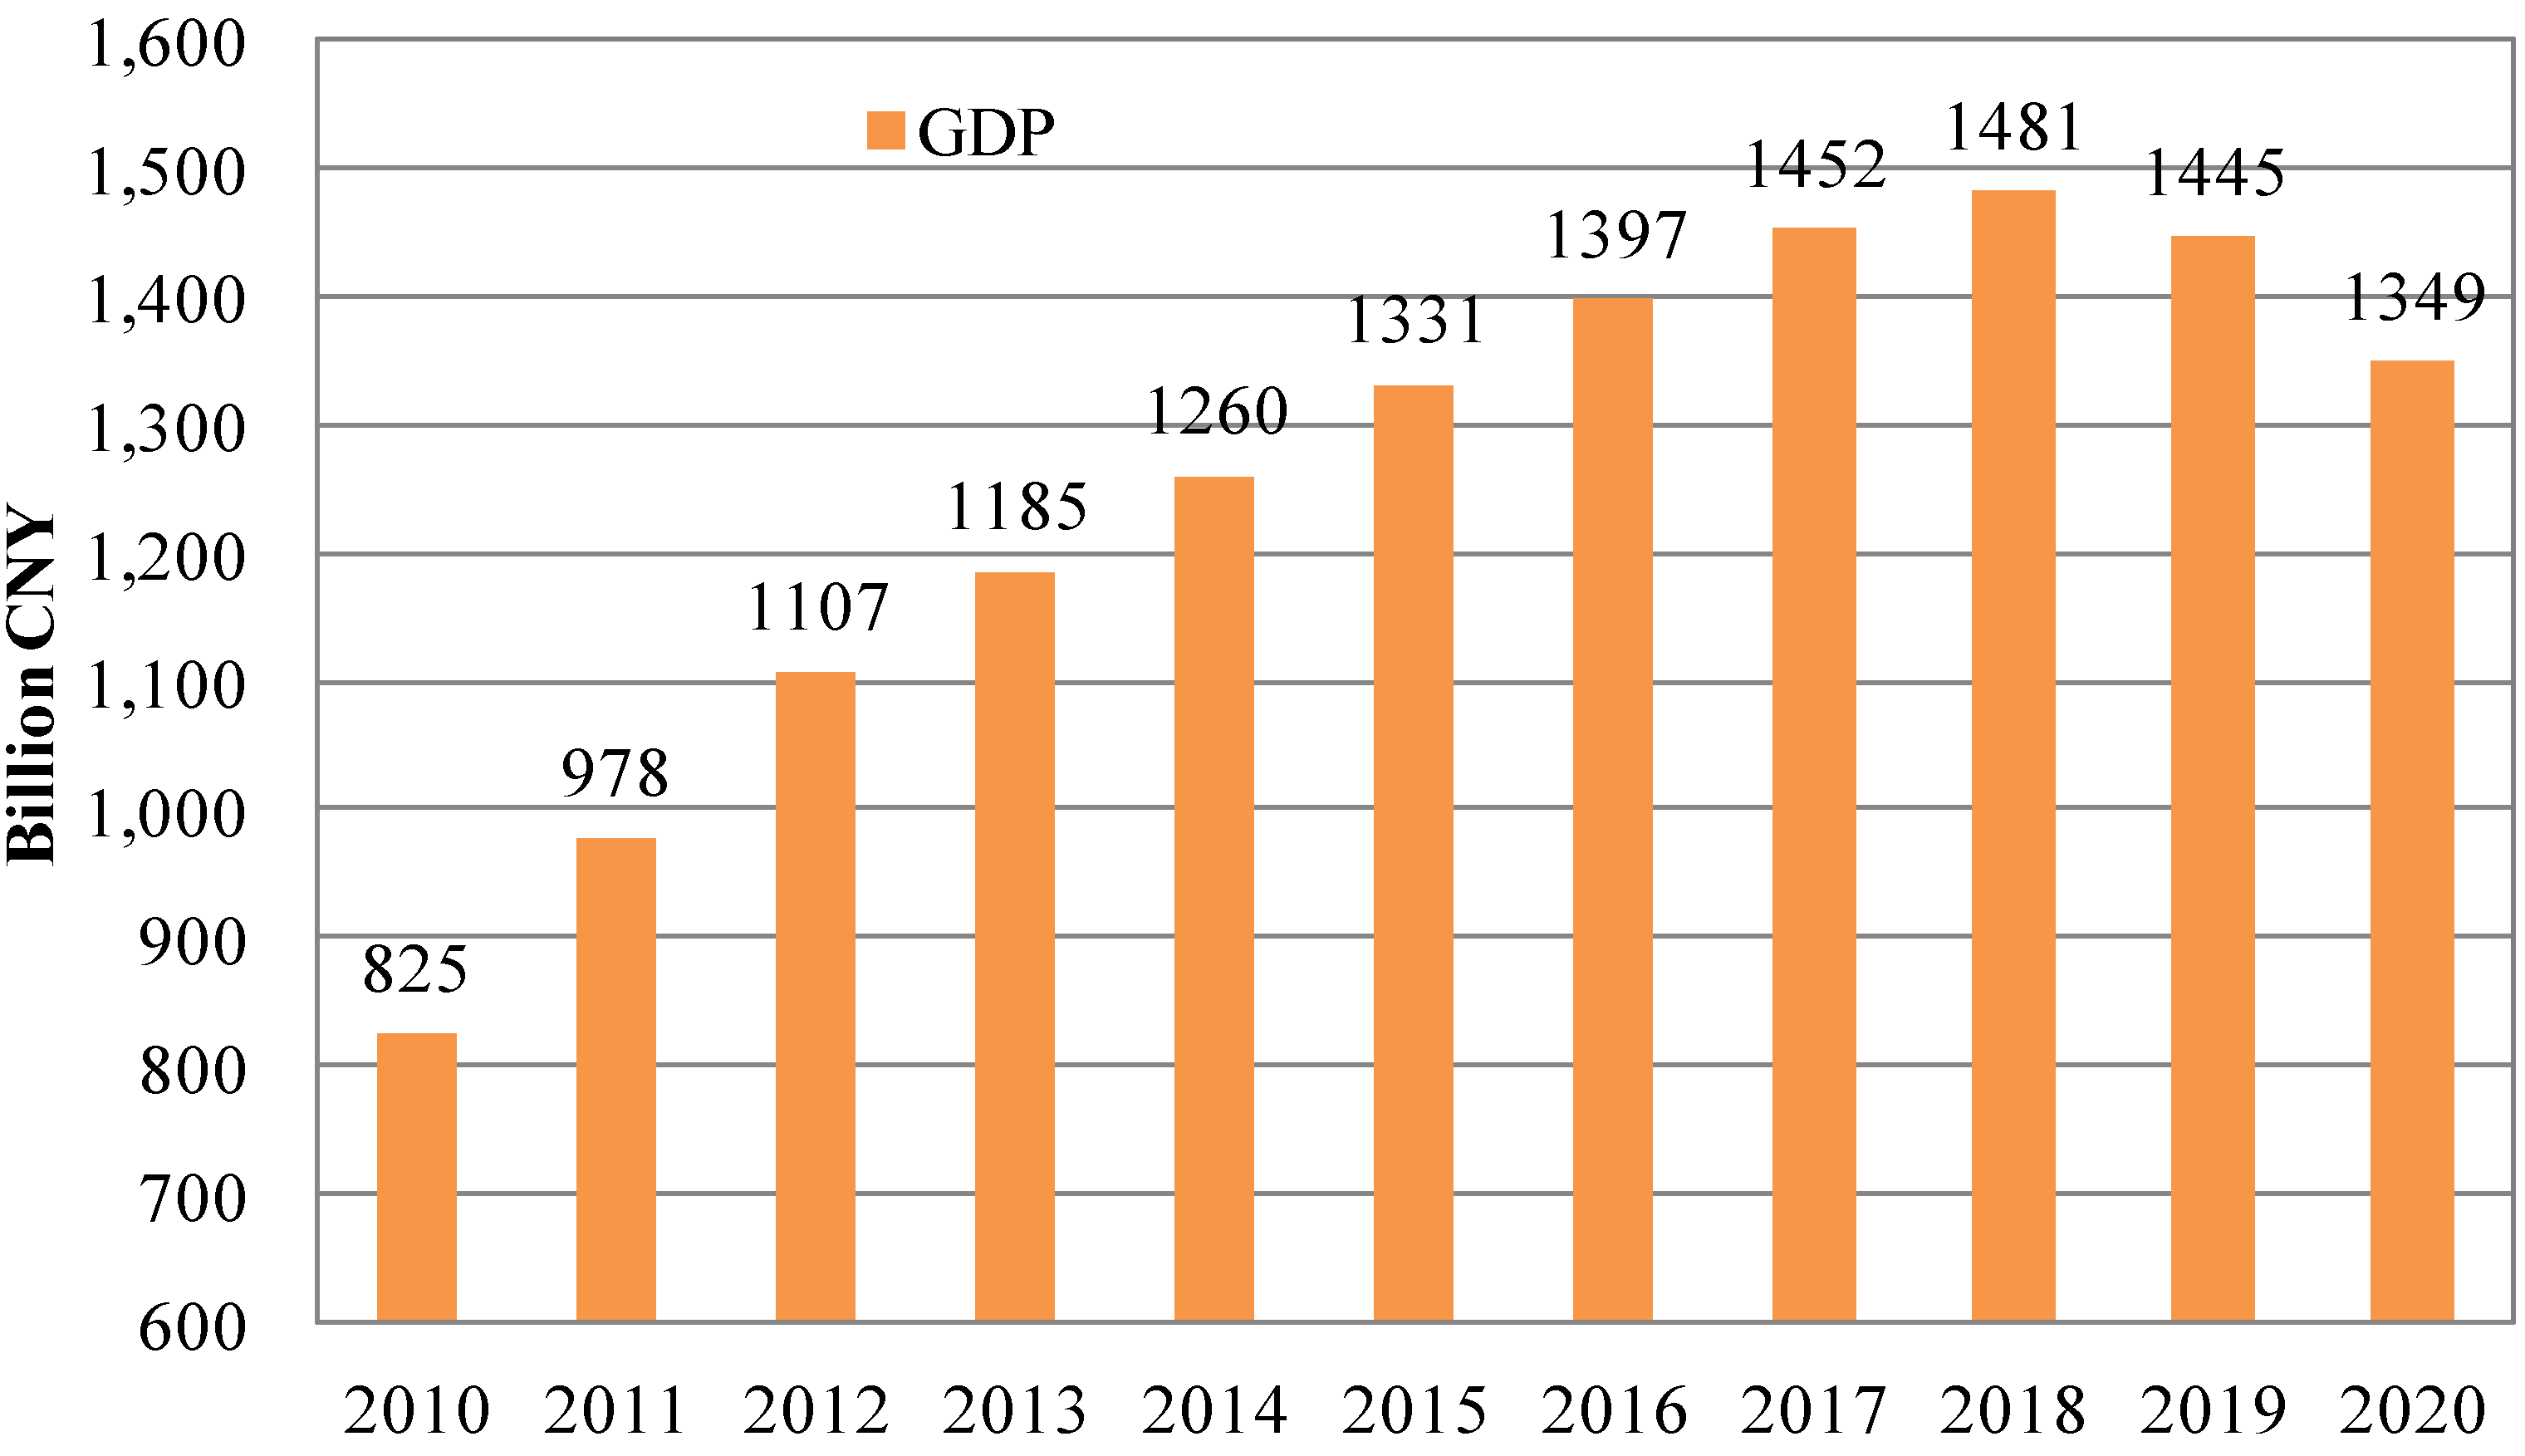
This comprehensive model cannot only provide reclaimed water utilization potential, but also the socio-economic, environment, water resources developing estimates based on our simulation results. Because of reclaimed water production and utilization in Tianjin, the total GDP in Tianjin can improve steadily. Because the encouragement of new water reclamation plants construction, they can treat wastewater in depth in order to reduce the total amount of water pollutants emit to the surface water. Therefore, socio-economic can get steady improvement even with stricter water pollutants emission constraints. In this case, the optimum GDP achieved in simulation is 1349 billion CNY of Tianjin city in 2020. The annual growth rate in this case is 5.3%.
However, we can see from
Figure 4 that he rate of increase of the GDP is higher during the first 8 years of the period analyzed than during the subsequent years. Simulation results demonstrate that the GDP cannot continue to increase after 2018. This reason for GDP decrease in the latter years is because the current technology or a strict water pollutant constraint cannot support both economic and environmental improvements. New technology updates or other relative incentive policies are needed in the future.
Figure 4.
Estimate of GDP from 2010 to 2020.
Figure 4.
Estimate of GDP from 2010 to 2020.
4.3. Water Environment Improving Trend
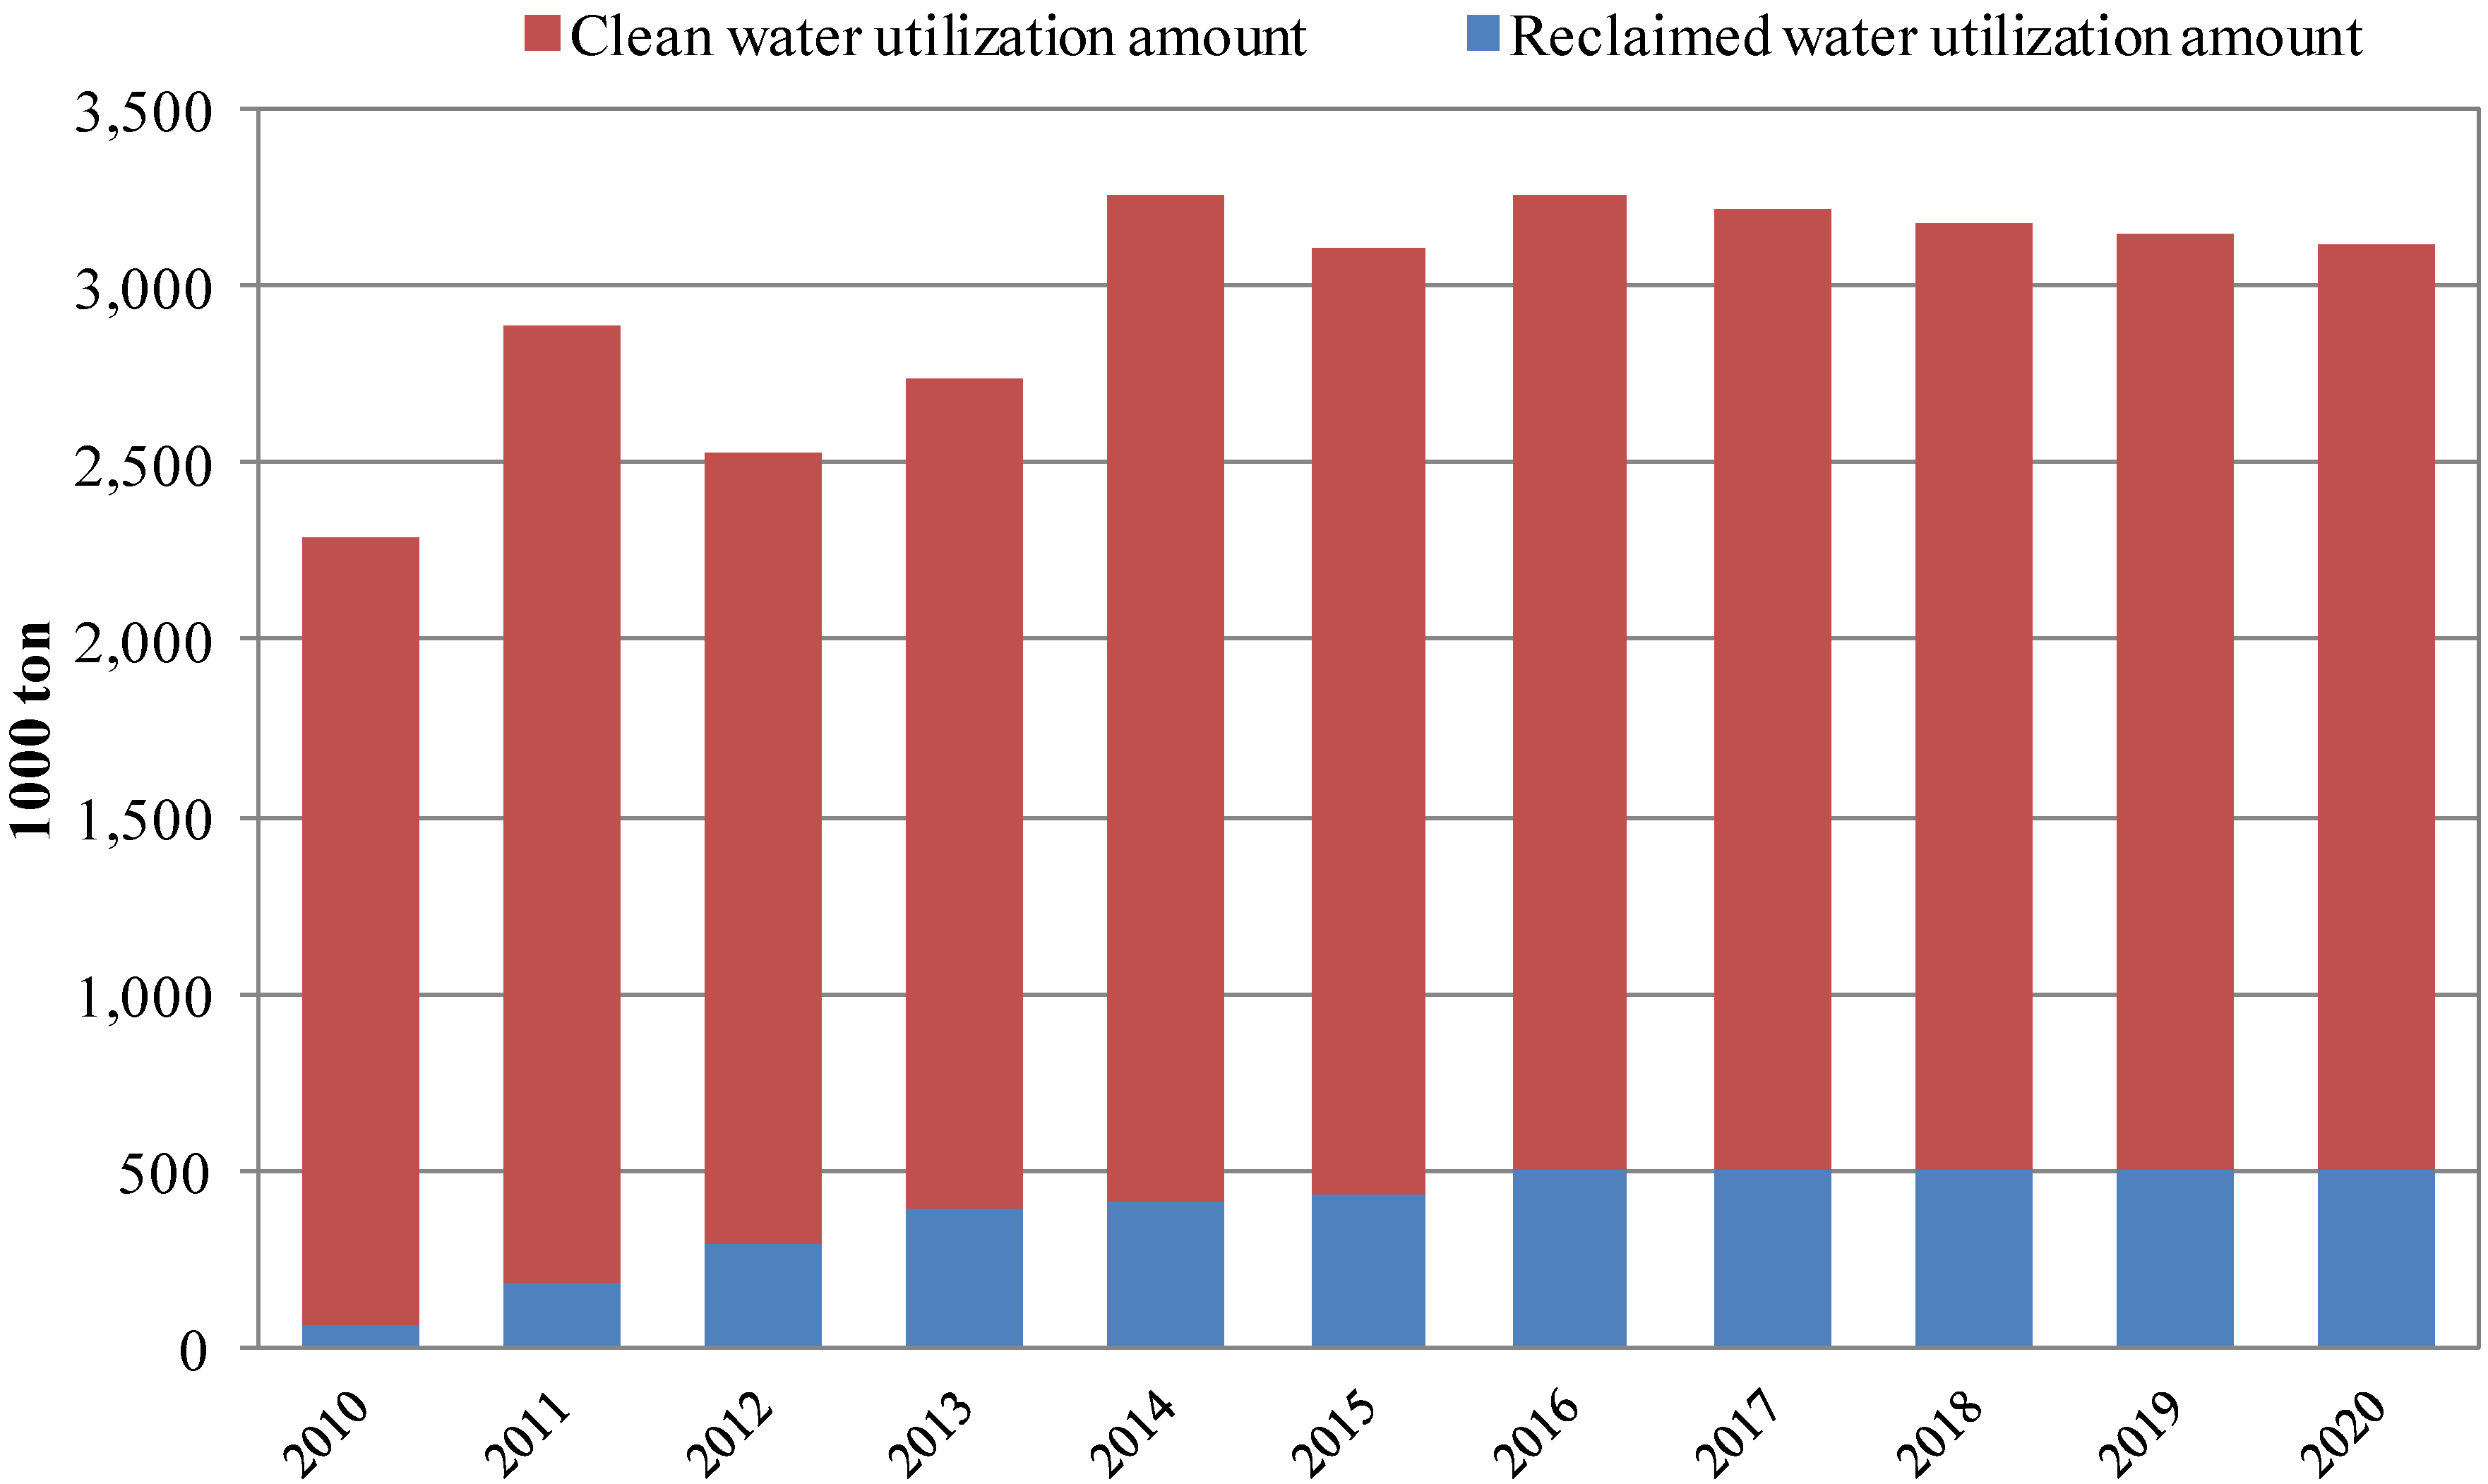
The simulation also shows that reclaimed water can effectively support the development of the water supply in
Figure 5. In 2009, only 0.5% of the water supply comes from reclaimed water. In 2020, 16% of the total water supply can be furnished by reclaimed water. While the total water demand is 2611 million tons in 2020, water reclamation and management approach can save 418 million tons of clean water. Reclaimed water contributes substantially to water conservation. This source of water is important for Tianjin due to the water shortage. This option is also less expensive than transferring water from southern China or seawater desalination.
Figure 5.
Water resources supply structure trend from 2010 to 2020.
Figure 5.
Water resources supply structure trend from 2010 to 2020.
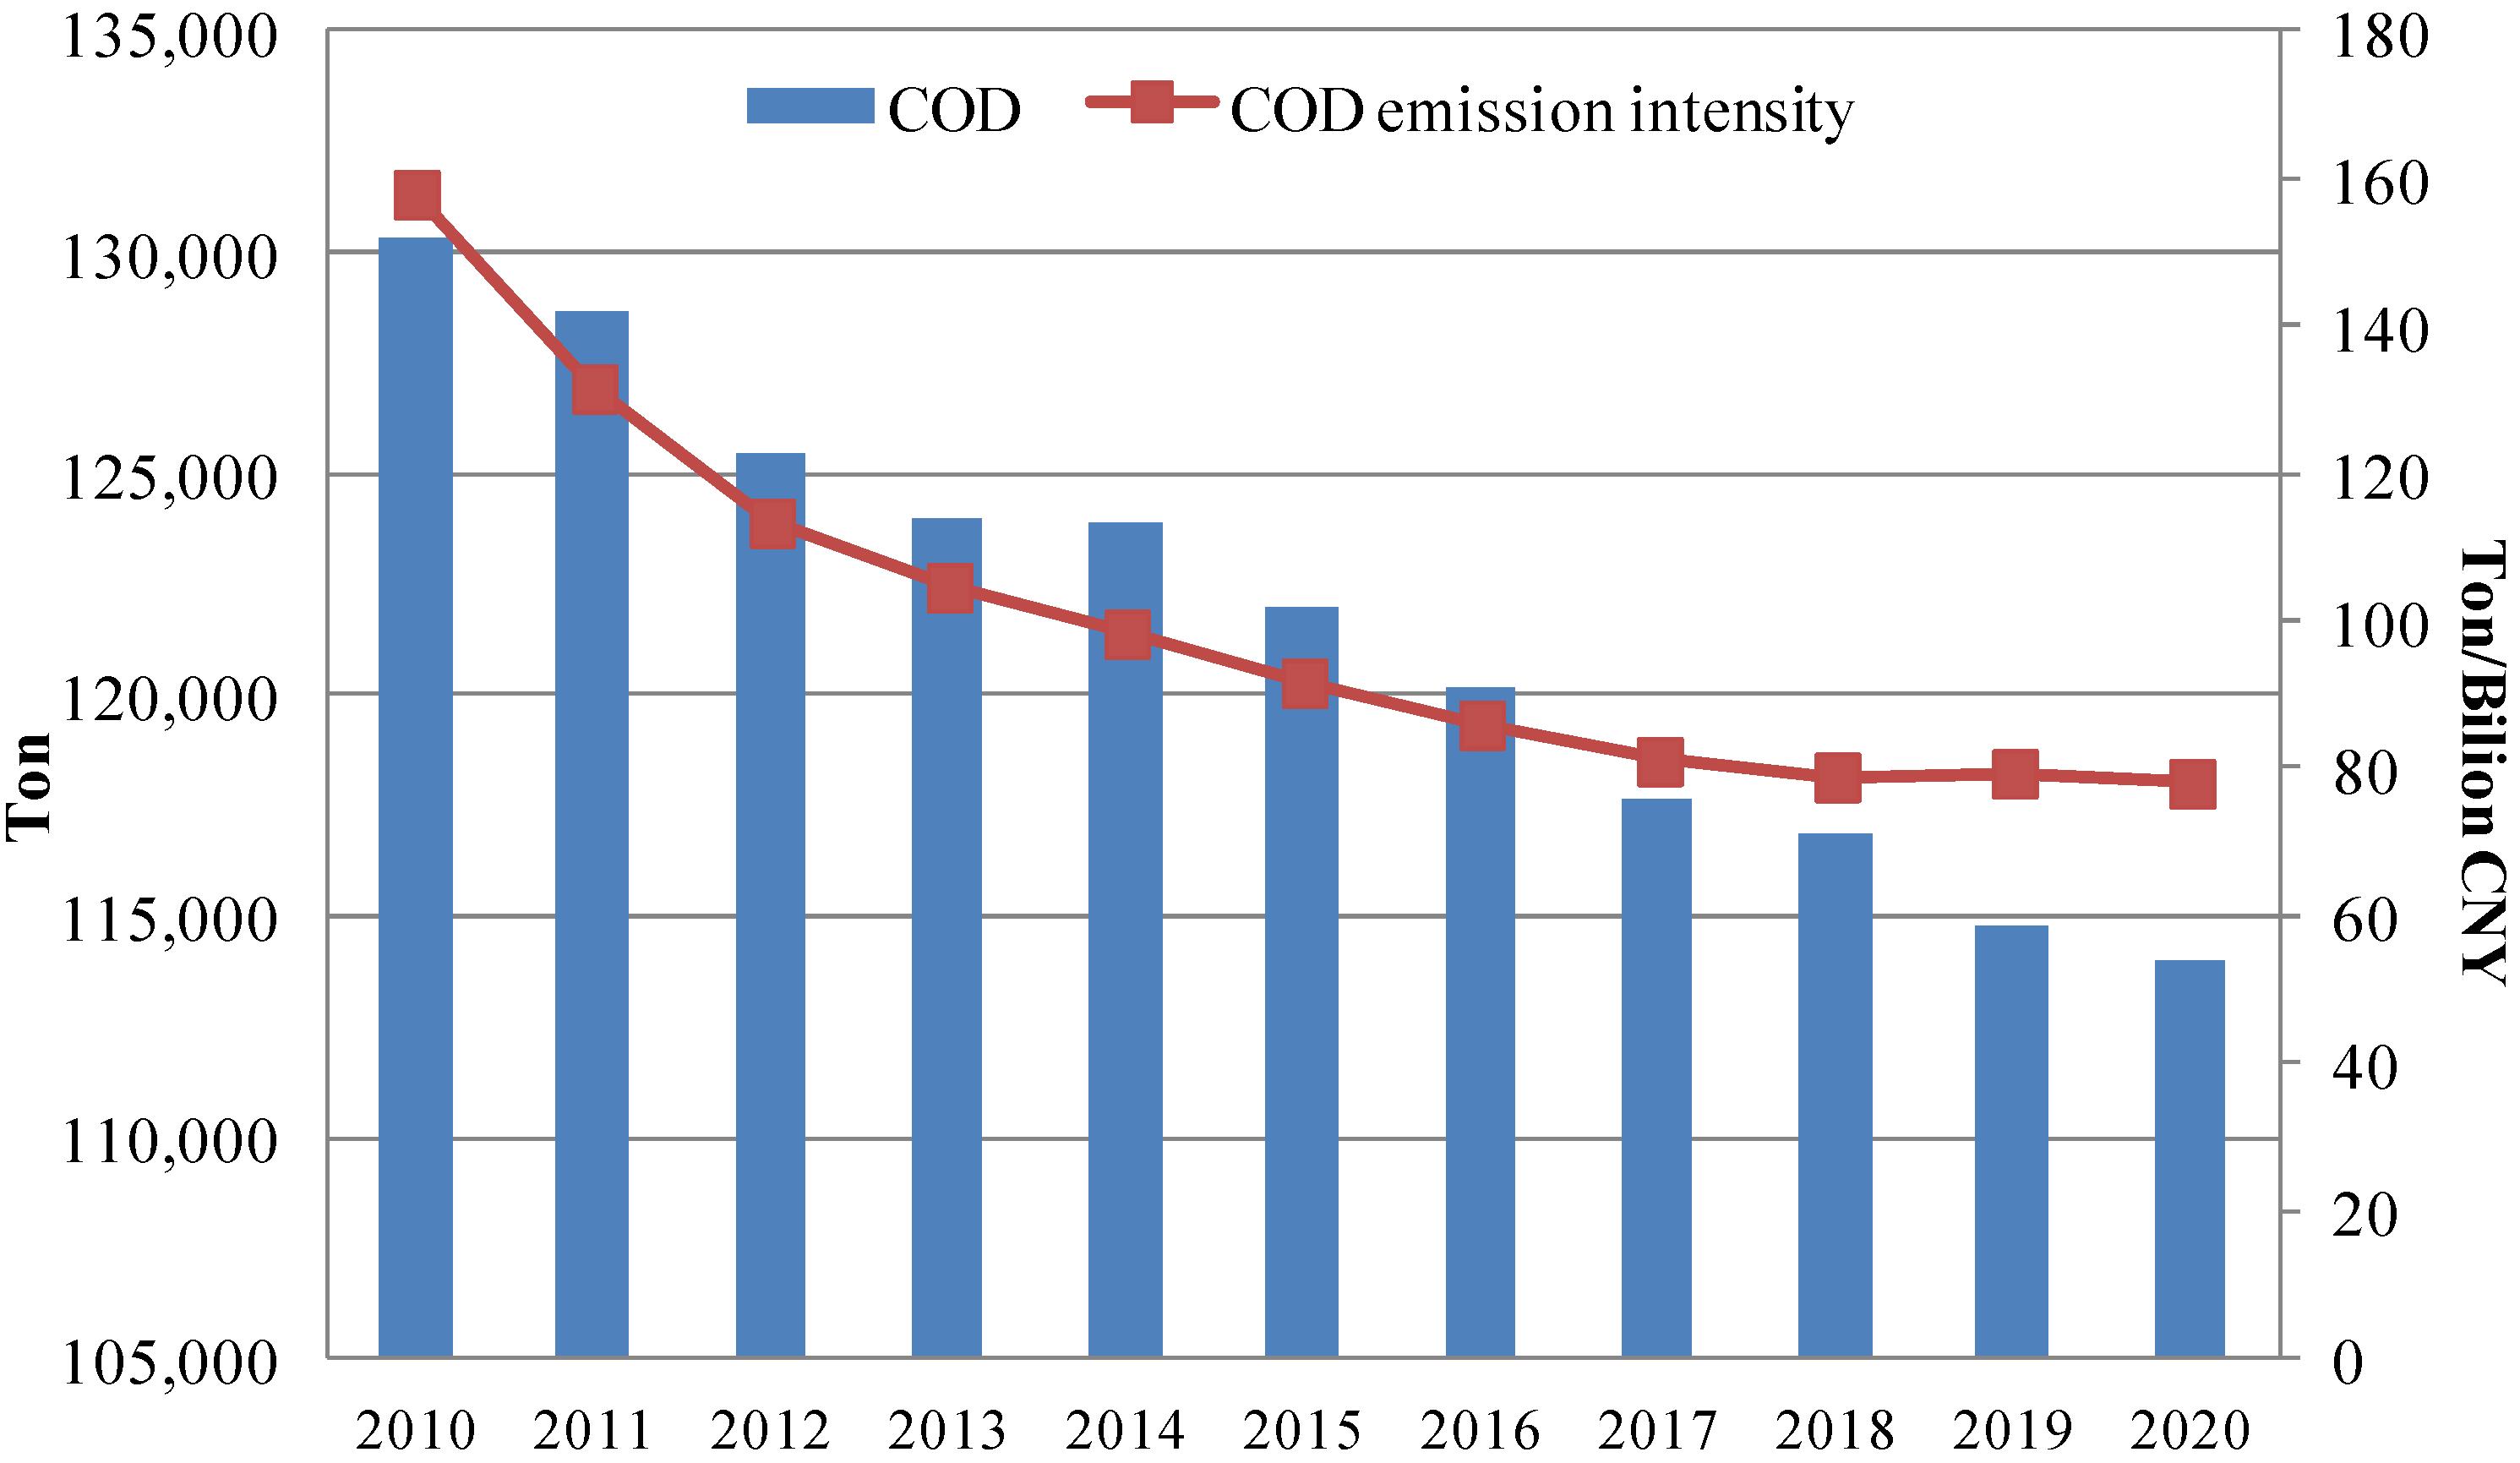
Furthermore, because of high water pollutants reduction ability, water reclamation can contribute for water quality control and water environment improvement (shown in
Figure 6). Under this circumstance, the emission amount of water pollutant COD can also be significantly reduced by 14.4%, from 133,100 ton in 2010 to 113,989 ton in 2020, while water pollutant emission intensity is highly reduced too. Water pollutant emission amount is decreased because of new sewage plants utilization, even through socio-economic activities are keeping stable increasing trend, new technology with higher COD disposal ability will contribute for water pollutants reduction, therefore loose constraints for economic development.
Figure 6.
Water pollutants emission and intensity estimates from 2010 to 2020.
Figure 6.
Water pollutants emission and intensity estimates from 2010 to 2020.
The simulation results in the case study demonstrate that dynamic optimization modeling of water environment management system can be effective in describing the relationship between water resources-water environment-socio-economic development in one integrated system. Based on the simulation results, we can see the simulation results are reasonable and useful for local planning for promoting reclaimed water with applicable approaches, including technologies, investments, locations. Furthermore, we can get an optimal development with environment-economic benefits are considered. Therefore, we believe this constructed model can effectively reflect current situation, and estimate developing trend of water environment and economic under the realistic condition of regional planning.
5. Conclusions
This study constructed an integrated water resources-water environment-social and economic model to manage regional water environment. The simulation practice in the case study area shows that this water environment management system can effectively used in managing water supply-consumption-treatment-recycle, while supporting economic and social development. Also, the simulation provides detailed approaches to realize the developing plan, including technologies choices, investments, and construction plans. The constructed model is proven to be an applicable and efficient way in release water shortage pressure, reduce water pollution, as well as achieving sustainable development.
This comprehensive simulation modeling approach can serve as a pre-evaluation resource for local government and provide a basis for policy-making and for the development of specific plans. Furthermore, dynamic simulation was used to forecast the environmental and economic development in the future, with comprehensive results including the effects of technologies installation; it can even provide guidance for the introduction of new technology introduction in the future. However, there are some limitations in this model, the industrial classification is not sufficient to describe industries’ difference in water demand and water pollution emission; water resources divide is not enough to demonstrate the water structure changes. We will continue our work to make a more integrated water environment management system to provide concrete regional plans. Also, a validation analysis for this model should be established to prove the accuracy for the simulation model.
In short, we maintain that comprehensive water environment management system, especially focused on water reclamation and recycle, can be easily applied in regional plans or policy-making to improve water environment and support socio-economic development [
20]. The modeling approach can be used to identify preferred design-variable values and operating policies for integrated water resources management [
21]. Moreover, dynamic simulation modeling can be an effective tool in achieving the dual development targets, socio-economic development and environmental conservation in the catchment area. This research can also be easily replicated and can establish a useful basis for decision making in regard to the comprehensive management of environmental issues, especially water resources.


 is the clean water supply for industry m in region j(en); WSR
  is the clean water supply for households (en). Region (j) classification should base on local administrative, economic, water environment situation.


 and SPWT
  are the amounts of water treated by existing and new sewage plants, respectively, in region j (en).
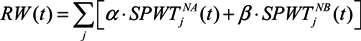
 and
and  are the amounts of water treated by new sewage plant A and new sewage plant B, respectively, in region j (en).

 [sewage plant A installation amount in region j at time t (en.)].


