Article

On the Vulnerability of Water Limited Ecosystems to Climate Change

1
School of Engineering, University of Basilicata, via dell'Ateneo Lucano, 10, Potenza 85100, Italy
2
Department of Civil and Environmental Engineering, Princeton University, E-Quad Princeton, NJ 08544, USA
*
Author to whom correspondence should be addressed.
Water 2013, 5(2), 819-833; https://doi.org/10.3390/w5020819
Submission received: 25 April 2013 / Revised: 6 June 2013 / Accepted: 13 June 2013 / Published: 21 June 2013
(This article belongs to the Special Issue Ecological Watershed Management)

Abstract

:
Society is facing growing environmental problems that require new research efforts to understand the way ecosystems operate and survive, and their mutual relationships with the hydrologic cycle. In this respect, ecohydrology suggests a renewed interdisciplinary approach that aims to provide a better comprehension of the effects of climatic changes on terrestrial ecosystems. With this aim, a coupled hydrological/ecological model is adopted to describe simultaneously vegetation pattern evolution and hydrological water budget at the basin scale using as test site the Upper Rio Salado basin (Sevilleta, NM, USA). The hydrological analyses have been carried out using a recently formulated framework for the water balance at the daily level linked with a spatial model for the description of the spatial organization of vegetation. This enables quantitatively assessing the effects on soil water availability on future climatic scenarios. Results highlighted that the relationship between climatic forcing (water availability) and vegetation patterns is strongly non-linear. This implies, under some specific conditions which depend on the ecosystem characteristics, small changes in climatic conditions may produce significant transformation of the vegetation patterns.

1. Introduction

Patterns of vegetation on the landscape are mainly a function of the availability of light [1,2], nutrients [3,4,5], and soil moisture [6,7] that support plant growth, and other environmental conditions, such as temperature and snow, that determine the timing and length of the growing season [8,9]. Therefore, plant types, species richness, distribution and structure of vegetation are under the influence of climate at the regional scale [10], and resources availability (including water, nutrients, etc.), soil type and surface morphology at the local scale [11,12]. Vegetation patterns could have a profound role in the coupled dynamics of water, energy, and carbon in a region [13,14,15,16].
Vegetation, as interface between soil and atmosphere, plays a key role in biogeochemical cycles through photosynthesis and the subsequent production of organic matter and oxygen [17,18]. It exerts important control on the entire water balance recycling more than one half of the annual precipitation [19]. Consequently change in land cover, such as deforestation in the lowland tropics as well as grazing in semiarid regions, can induce a reduction of the precipitation amounts and an increase of temperatures [20,21]. Vice versa, a change in climatic conditions may modify the spatial patterns of vegetation in a way that is not fully understood.
Understanding and predicting vegetation patterns and their response to climate and other environmental stressors is a critical research challenge [22]. The complex interaction among biological, geophysical and geochemical processes makes difficult to define specific mechanisms of ecohydrological optimization in space. Vegetation patterns have often been used to investigate the relationships between the spatial structure of vegetation and the nature of competition, disturbance, and resource heterogeneity across a range of ecosystems and scales. It is recognized that many outstanding issues in plant ecology end ecohydrology are directly related to an incomplete understanding of the dynamics and persistence of spatial patterns [23].
In this framework, it is growing the interest on the impacts of climate on the interplay between vegetation and water availability. The latest report on climate change of the Intergovernmental Panel on Climate Change (IPCC) shows, on a global scale, a linear trend of increase in global average temperature of the last one hundred years (1906–2005) of about 0.74 °C (±0.18 °C), and significant changes in precipitation strongly heterogeneous in space [24]. Central Europe and the Mediterranean basin represent a vulnerable area, where rainfall reduction and increased temperatures may affect plant and animal species, regulating environmental characteristics.
The plant species may respond to climate change adapting to new conditions, using their plasticity, or through the selection of genetic variants whose physiology allows survival under the new climatic conditions. An alternative or complementary response of some species is the shift in time of the phases of the life cycle, or in space and depth of the rooting system. The sensitivity of different species to changing climate can cause the abundance of common species and, conversely, the disappearance of the rarest [25]. This process, together with a highly uneven distribution of species undermines biodiversity.
The preservation of environmental diversity is necessary for the regulation of the hydrological cycle and biogeochemical cycles of carbon and nitrogen, flood protection, the availability of genetic diversity in agriculture, the natural pollination and the stability of ecosystems (e.g., [26]). Leaving aside the processes of biological evolution, the effects of climate change on species and ecosystems can be grouped into the following major categories [27,28]: (a) impacts on the physiology and behavior of species; (b) impacts on the lifecycle; (c) impacts on the geographical distribution; (d) impacts on the composition and interactions of species in ecological communities.
If changes on physiology and life cycle may increase the resilience of ecosystems, changes in composition and distribution of vegetation patterns may deteriorate the environmental diversity. Several authors have investigated the effects of climate change on the spatial structure of vegetation. Some of these works relate the trends of precipitation and temperature with index NDVI and phenological measures. This type of analysis showed a negative effect of the decline in rainfall of Mediterranean forests, a positive effect due to the increase in temperature of mountain forests [29] and an anticipation of the growing season and delayed senescence (grass and bushes of the Alps and Central Europe) [30,31].
In this context, there is a clear need to develop conceptual models that are capable of interpreting and predicting spatial pattern formation especially in dryland (and similar ecosystems) that are the most vulnerable environments to eventual climatic change (e.g., [32,33,34]).
In semiarid environment, where water is the driving force in shaping the vegetation distribution and composition [35,36,37], theories of self-organization are often invoked to explain the emergent patterns [38,39,40,41,42,43].
Based on the Eagleson’s optimality hypothesis, ecosystem tends to minimize its water demand stress while maximizing soil moisture [38]. Using this pioneering idea, several authors developed cellular automata (CA) models where local interactions, describing competition of trees and grasses for water and energy, are represented by mathematical rules over a domain of regular grids. In particular, competition among plants, plant establishment and mortality processes are tied to rainfall and plant water stress [44,45,46]. The results of these CA models highlighted the importance of spatial processes in maintaining savanna ecosystem [47], and supported the concept that local-scale interactions can drive large-scale vegetation patterns [48].
These ecohydrological models represent a useful tool to describe the effects of climate on natural ecosystems and landscape. Among others, Caylor et al. [49] recently proposed an interesting CA model where vegetation patterns are defined according to two main factors: soil water stress and river basin morphology. In the present study, we explored the potential of this model using different climatic scenarios to explore the impact of changes on the climatic forcing on semiarid environments. With this specific aim, we generated a number of synthetic vegetation patterns over a well-known basin located in central New Mexico, NM, USA.

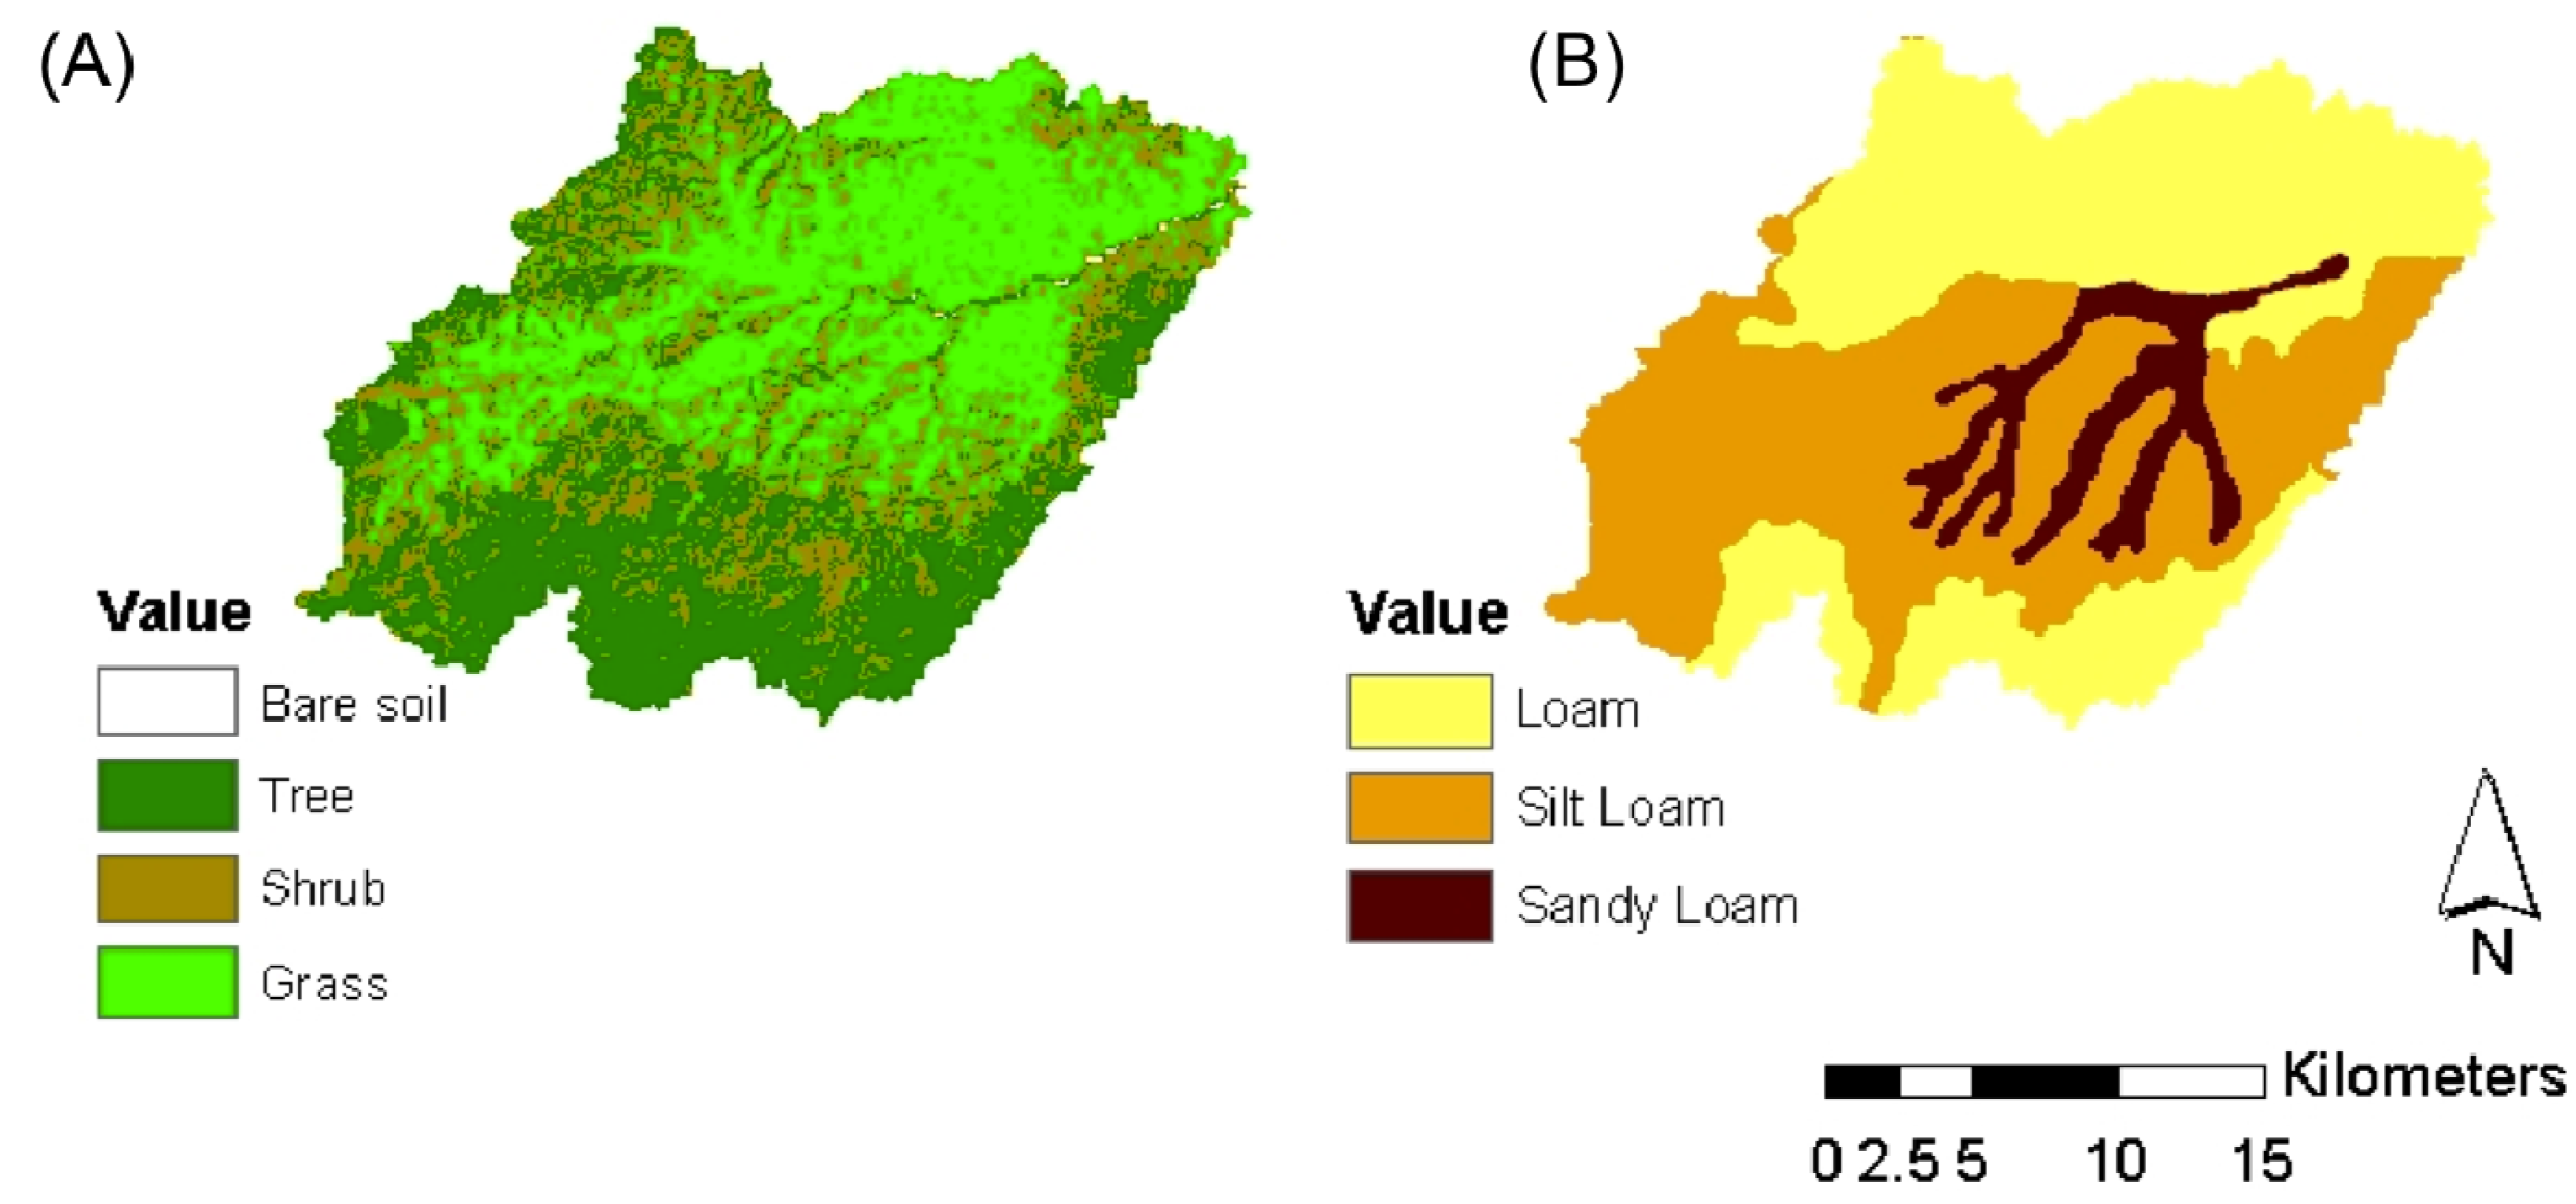
2. Description of the Case Study

The study area is the Upper Rio Salado basin located near the Sevilleta Long-term Ecological Research (LTER) site in central New Mexico (Figure 1). This represents an ideal area to study water-controlled ecosystems in which soil moisture plays a critical role. The basin is characterized by a marked heterogeneity in vegetation composition that may be influenced by the basin topography.
The basin covers an area of 464 km2 and its elevation ranges from 1985 m above sea level (a.s.l.) to 2880 m a.s.l. It contains three different soil textures: loam and silty loam, in the upper part of the basin, and sandy-loam along the channel network. The composition of vegetation cover can be distinguished in three different plant functional types: grassland (25.4%), shrubland (28%), and forest (45.7%). A small fraction of the basin (<1%) is represented by bare soil. Maps of soil texture and vegetation cover are given in Figure 2. More detailed information about the site is available in Caylor et al. [50].
Figure 1. Map of vegetation (A); and soil texture (B) of the Upper Rio Salado basin (Sevilleta, NM, USA).
Water 05 00819 g001
Figure 2. Land cover fractions of the Rio Salado basin: (A) as a function of the altitude (m); (B) for the three soil types identified in the basin; (C) as a function of the basin aspect; and (D) as a function of slope classes.
Water 05 00819 g002
A preliminary description of the characteristics of the vegetation of the Rio Salado Basin is depicted in Figure 2, where the vegetation composition is described as a function of: local elevation, basin aspect ratio, local slope, and soil textures. It is instructive to look at this graph that provides an evidence of the effects of the morphology (local elevation, basin aspect ratio, and local slope) and soil texture on vegetation composition. In the present case, morphological characteristics seem to be a relevant controlling factor even if we are dealing with an arid river basin, while soil texture has a minor role.
For the scope of the work, analyses are focused on the growing season in order to describe the state of plant during this phase. To this aim, the rate of rainfall, R(t), is represented as a marked Poisson process of storm arrival in time with rate λ(d−1), each storm having a depth h(mm), where h is modeled as an exponentially distributed random variable with mean α(mm). Both rainfall and temperature are strongly controlled by local elevation, consequently these variables were assumed spatially variable using the following relationships between elevation (x expressed in meter above the sea level) and parameters of rainfall processes (λ and α) or mean temperature estimated for the growing season.
Water 05 00819 i001
Water 05 00819 i002
Water 05 00819 i003
Equations above were derived by Caylor et al. [50] using data recorded in the period 1990–2001. This equations allow to define the following climatic characteristics averaged over the basin area: α = 5.75 mm, λ = 0.28 day-1, and Ta = 17.83 °C.

3. Methodological Approach

We investigated the influences of climate on the spatial pattern of vegetation using an ecohydrological model able to couple dynamics of soil moisture and its linkage with vegetation. In particular, soil moisture dynamics are described following the approach proposed by Laio et al. [51], while the vegetation water stress is computed using the formulation proposed by Porporato et al. [52]. Finally, the vegetation distribution is simulated using the CA model proposed by Caylor et al. [49] using different climatic scenario.

3.1. Soil Moisture and Vegetation Water Stress

Soil moisture is a crucial link between hydrological and biogeophysical processes through its controlling influence on transpiration, runoff generation, carbon assimilation and nutrient absorption by plants (e.g., [38,53,54,55]). Its evolution in time and space is driven by different processes acting over a variety of scales influencing severity and persistence of water stress in plants, the outcomes of ecological competition, and the sustainability of vegetation communities (e.g., [56,57,58]).
Recent research has achieved significant progress in the description of vertically-lumped water balance dynamics through the development of a steady-state probability density function of soil moisture within the growing season [51,59]. This approach is based on the steady-state solution of the stochastic differential equation for the soil water balance in which the rainfall represents the stochastic forcing. The definition of the analytical expression for the steady-state probability distribution of soil moisture has allowed elucidating the complex and nonlinear interplay among climate, soil, and vegetation, and their impacts on vegetation water stress, plant carbon assimilation, soil bio-geochemical cycles, and land-atmosphere interaction [60].
Here we provide a brief summary of the concepts used to derive the dynamic water stress index proposed by Porporato et al. [52] based on the probabilistic structure of soil moisture derived by Laio et al. [51]. This index provides a quantitative measure of the water stress experienced by plants during the growing season.
The concept is derived from the so-called “static” water stress ζ that measures the state of stress of the plants as a function of the relative saturation of soil, s(t), [52]:
Water 05 00819 i004
where the exponent q accounts for the non-linear relationship between the plant stress and the soil water content, sw is the relative soil saturation at the wilting point and s* at the point in which plant start to close stomata.
The static stress does not account for the temporal dynamic of soil moisture, for this reason Porporato et al. [52] introduced the two variables: Tξ the length of the time intervals in which the relative soil saturation is below a threshold ξ (in the present case represented by s*), and the number, Water 05 00819 i010
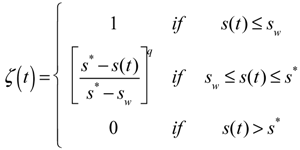
, of such intervals during the growing season.
The mean number of upcrossing during a growing season of length Tseas is obtained from the rate of occurrence, νξ, as
Water 05 00819 i005
where p(ξ) represents the probability density function and p(ξ) represents the soil water loss function evaluated at ξ.
The mean time duration of the soil moisture below the threshold ξ is:
Water 05 00819 i006
These metrics allow the definition of the average dynamic water stress under steady state conditions that is defined as:
Water 05 00819 i007
where Water 05 00819 i011 
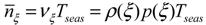
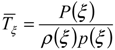
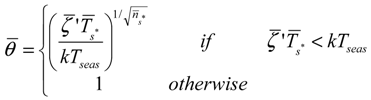
is the average static water stress during the periods of stress conditions; k is an index of plant resistance to water stress; Tseas is the length of growing season; Water 05 00819 i012 is the average length of water stress evaluated in s*; Water 05 00819 i013 is the mean rate of water stress in s*. In this case considering the climatic characteristics of the area, we adopt a parameter k equal 0.75.
This modeling approach has been used to describe the average dynamic water stress of each functional vegetation type using the same parameters of the work by Caylor et al. [50].

3.2. Vegetation Model

The cellular automata network model proposed by Caylor et al. [49] is used to describe impact of climate on vegetation pattern. This model was already validated on the Upper Rio Salado basin demonstrating the ability of a simple cellular automata model, driven by a feasible optimality principle, in the description of the actual vegetation pattern [49]. The model adopts as a key input the dynamic water stress of each vegetation type considered.
The approach is aimed at the modeling of the steady state conditions of a vegetation mosaic, initiated from a random condition containing 1/3 each of trees, shrub and grass. The initial random vegetation mosaic is modified through the iteration of local interactions that occur between adjacent locations, assuming that interaction occur in the moving preferentially in the downstream direction. These interactions are defined such that vegetation replacement can occur at a randomly chosen location in an adjacent downstream location, according to a replacement probability defined using the different hypothesis. In particular, the replacement probability (P) adopted is the following:
Water 05 00819 i008
The probabilistic replacement procedure is repeated until the mosaic of vegetation, initially random, evolves to a steady state condition in which there will be no further changes. A first version of the model involved a comparison between the considered cell and the neighboring cells chosen in the downstream direction following the drainage network (“network model”).
This tool can be used to investigate the possible effects of climate change on the landscape. In order to quantify the impact of climate change on the structure and composition of vegetation pattern, the spatial characteristics of land cover (composition and configuration of different patches) have been studied using landscape ecology indices (e.g., [61,62,63]). In particular, we described the landscape modification through perceptual coverage of different plant types and a landscape diversity index. Diversity indices are mathematical functions that combine richness and evenness in a single measure, although usually not explicitly. Although there are many others, one of the most commonly used diversity index in ecology is the Shannon diversity and also the Simpson diversity, and Fisher’s α.
In the present application, we will focus on the Shannon’s evenness index (SHDI) that accounts for both abundance and evenness of species in the landscape. This index has the same expression of the informational entropy and is defined as:
Water 05 00819 i009
where pi = is the proportion of landscape occupied by the class i. The term pi is computed based on total landscape area (A) excluding any internal background present. SHDI increases as the number of different patch types (i.e., patch richness) increases and/or the proportional distribution of area among patch types become more equitable.

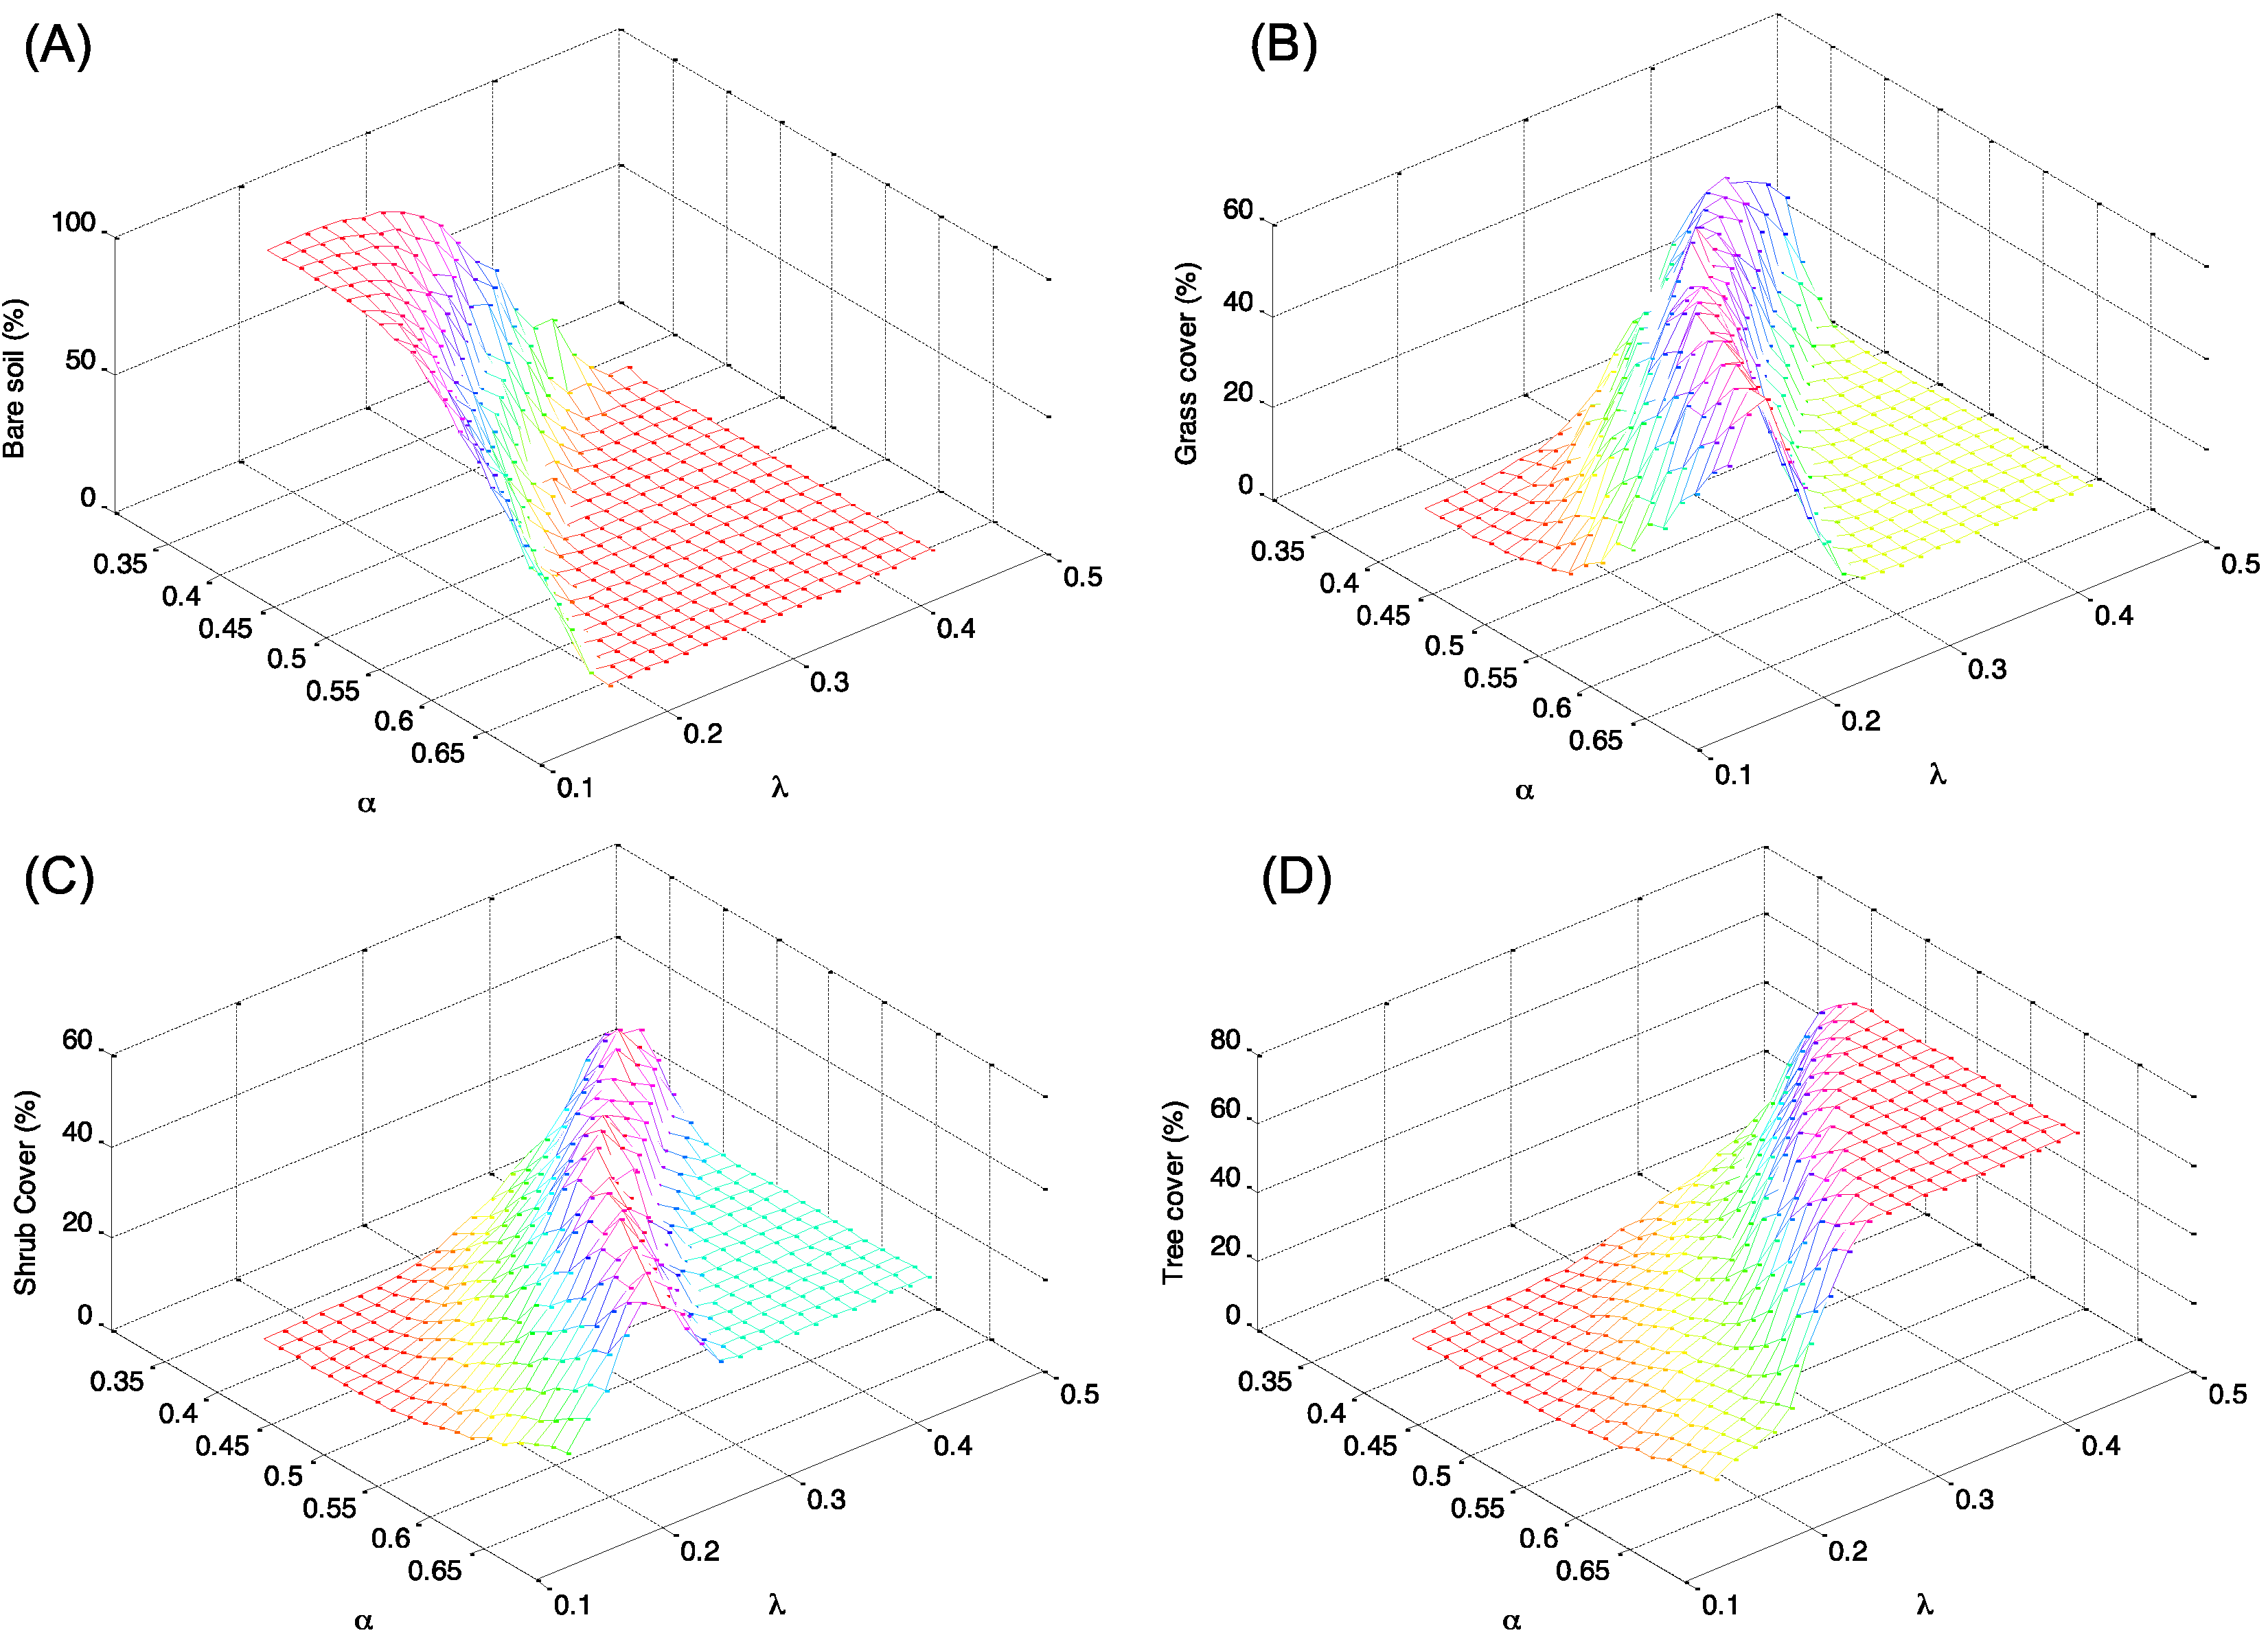
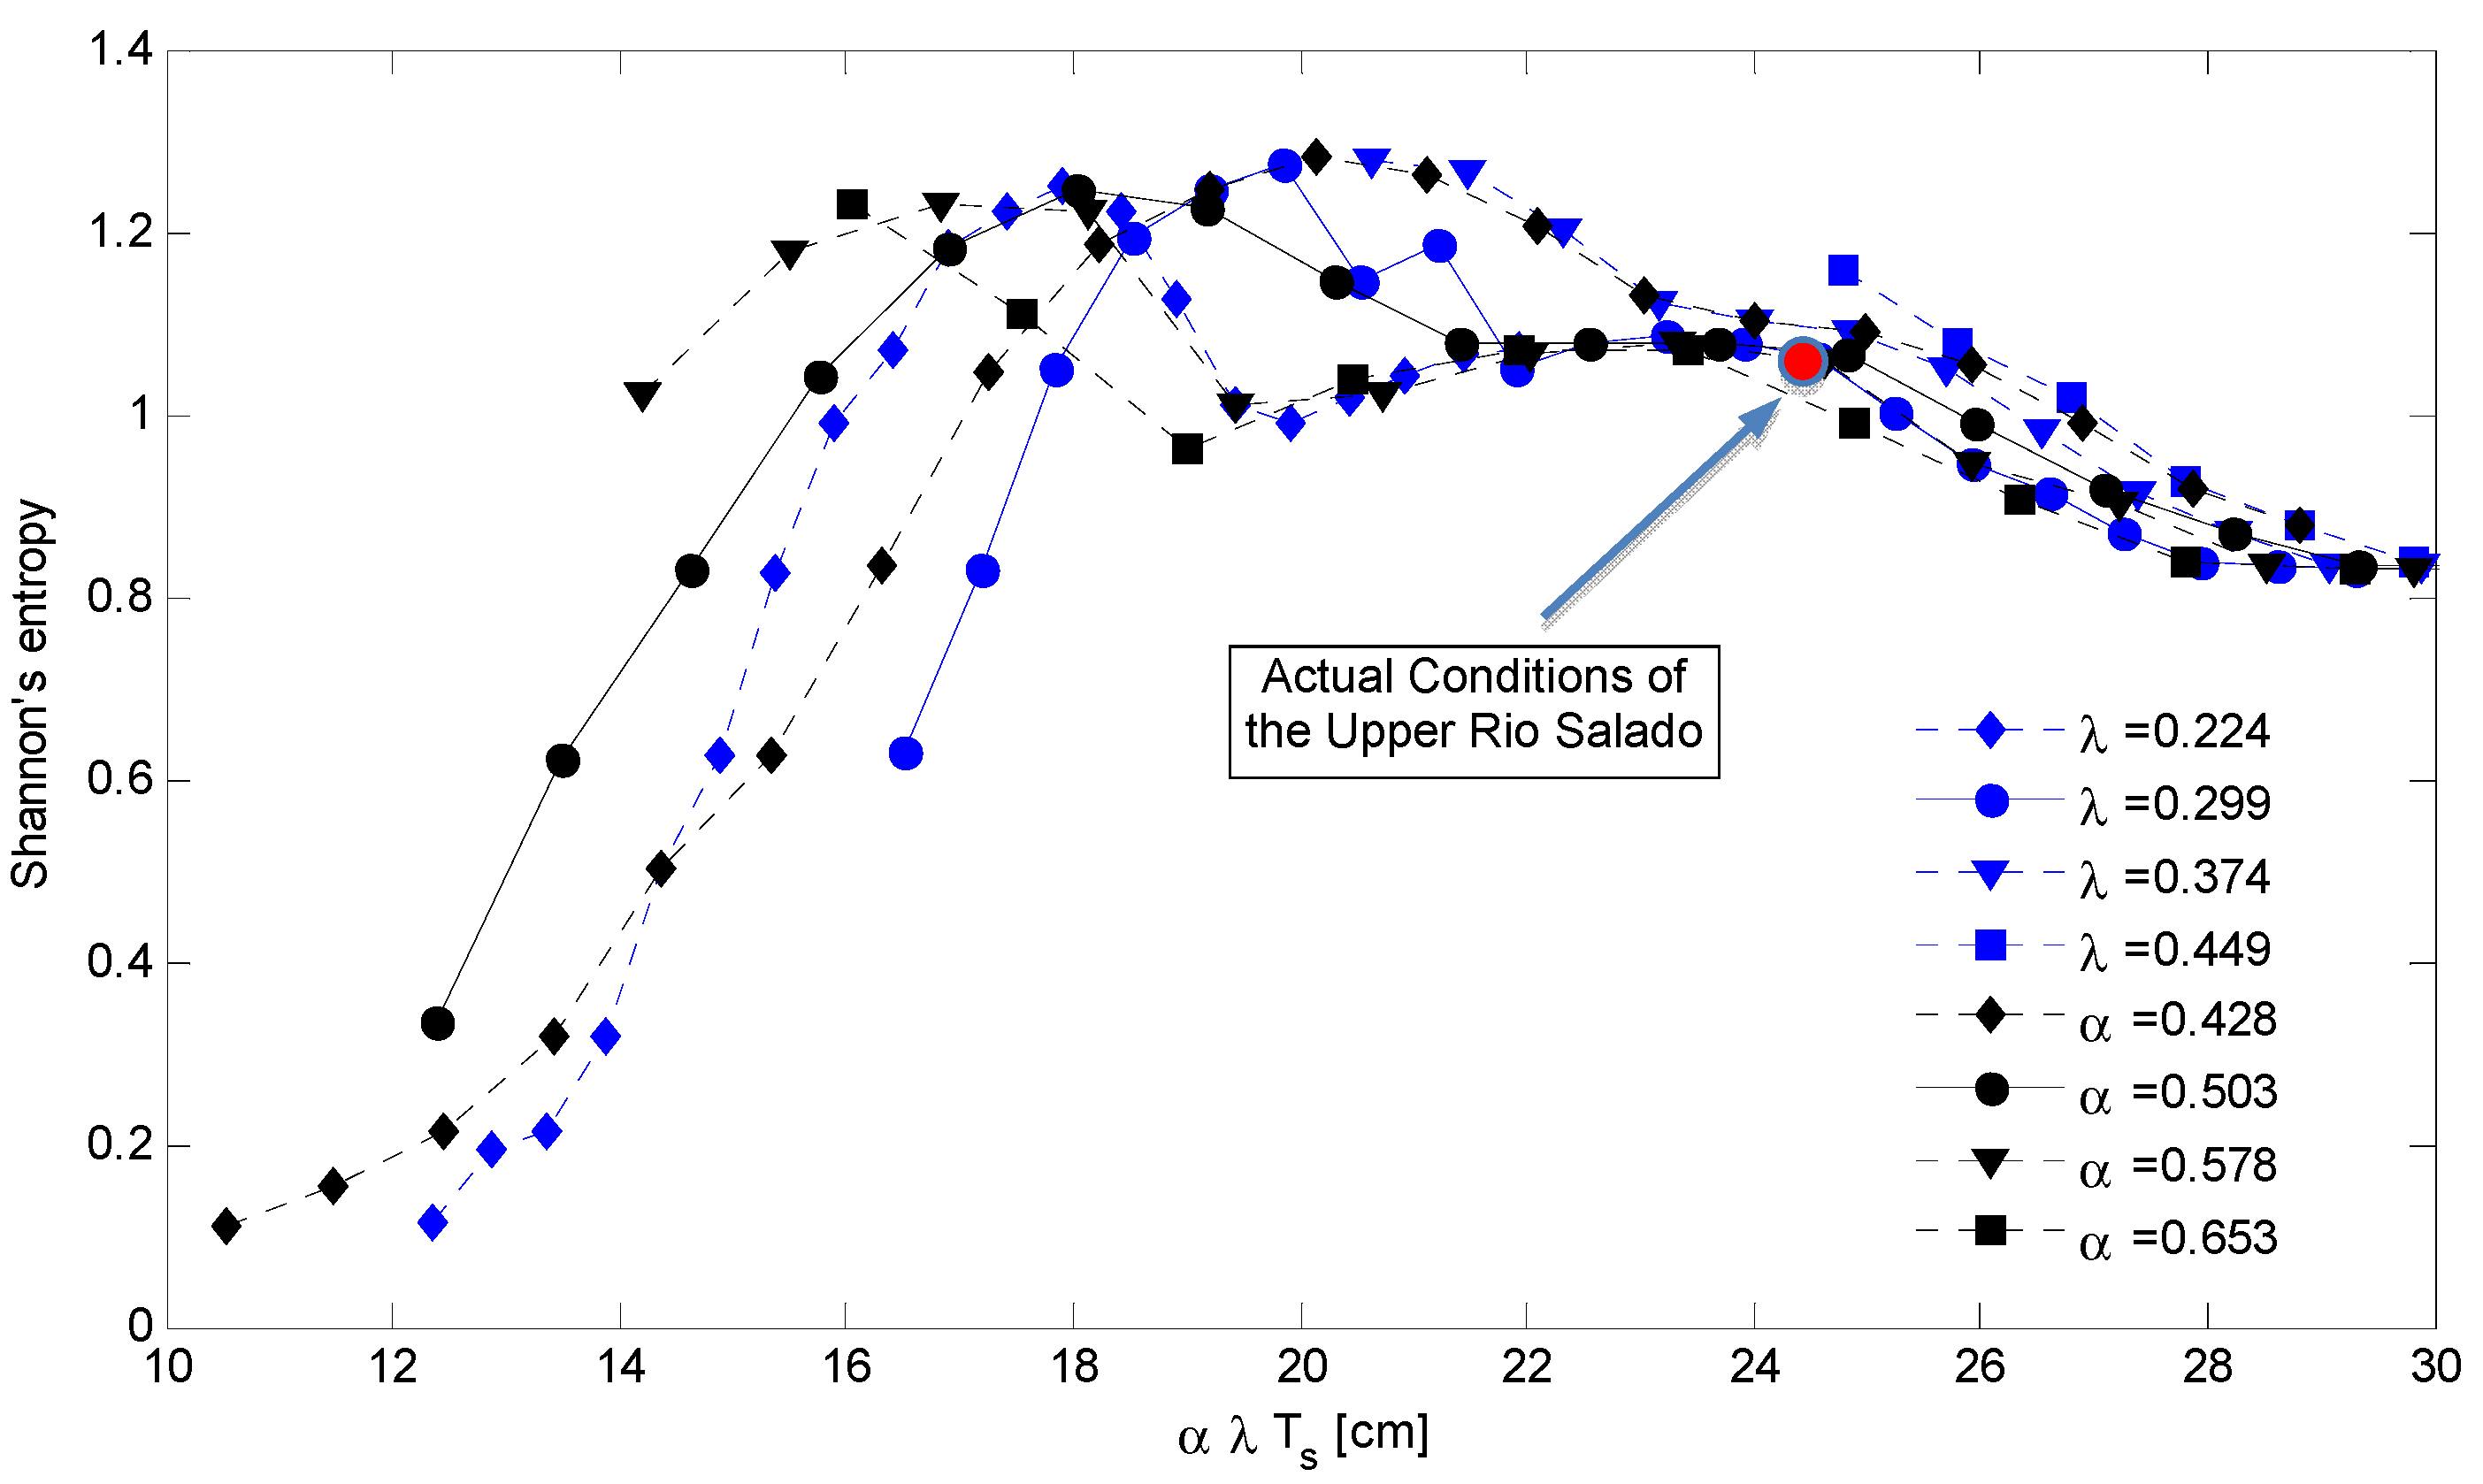
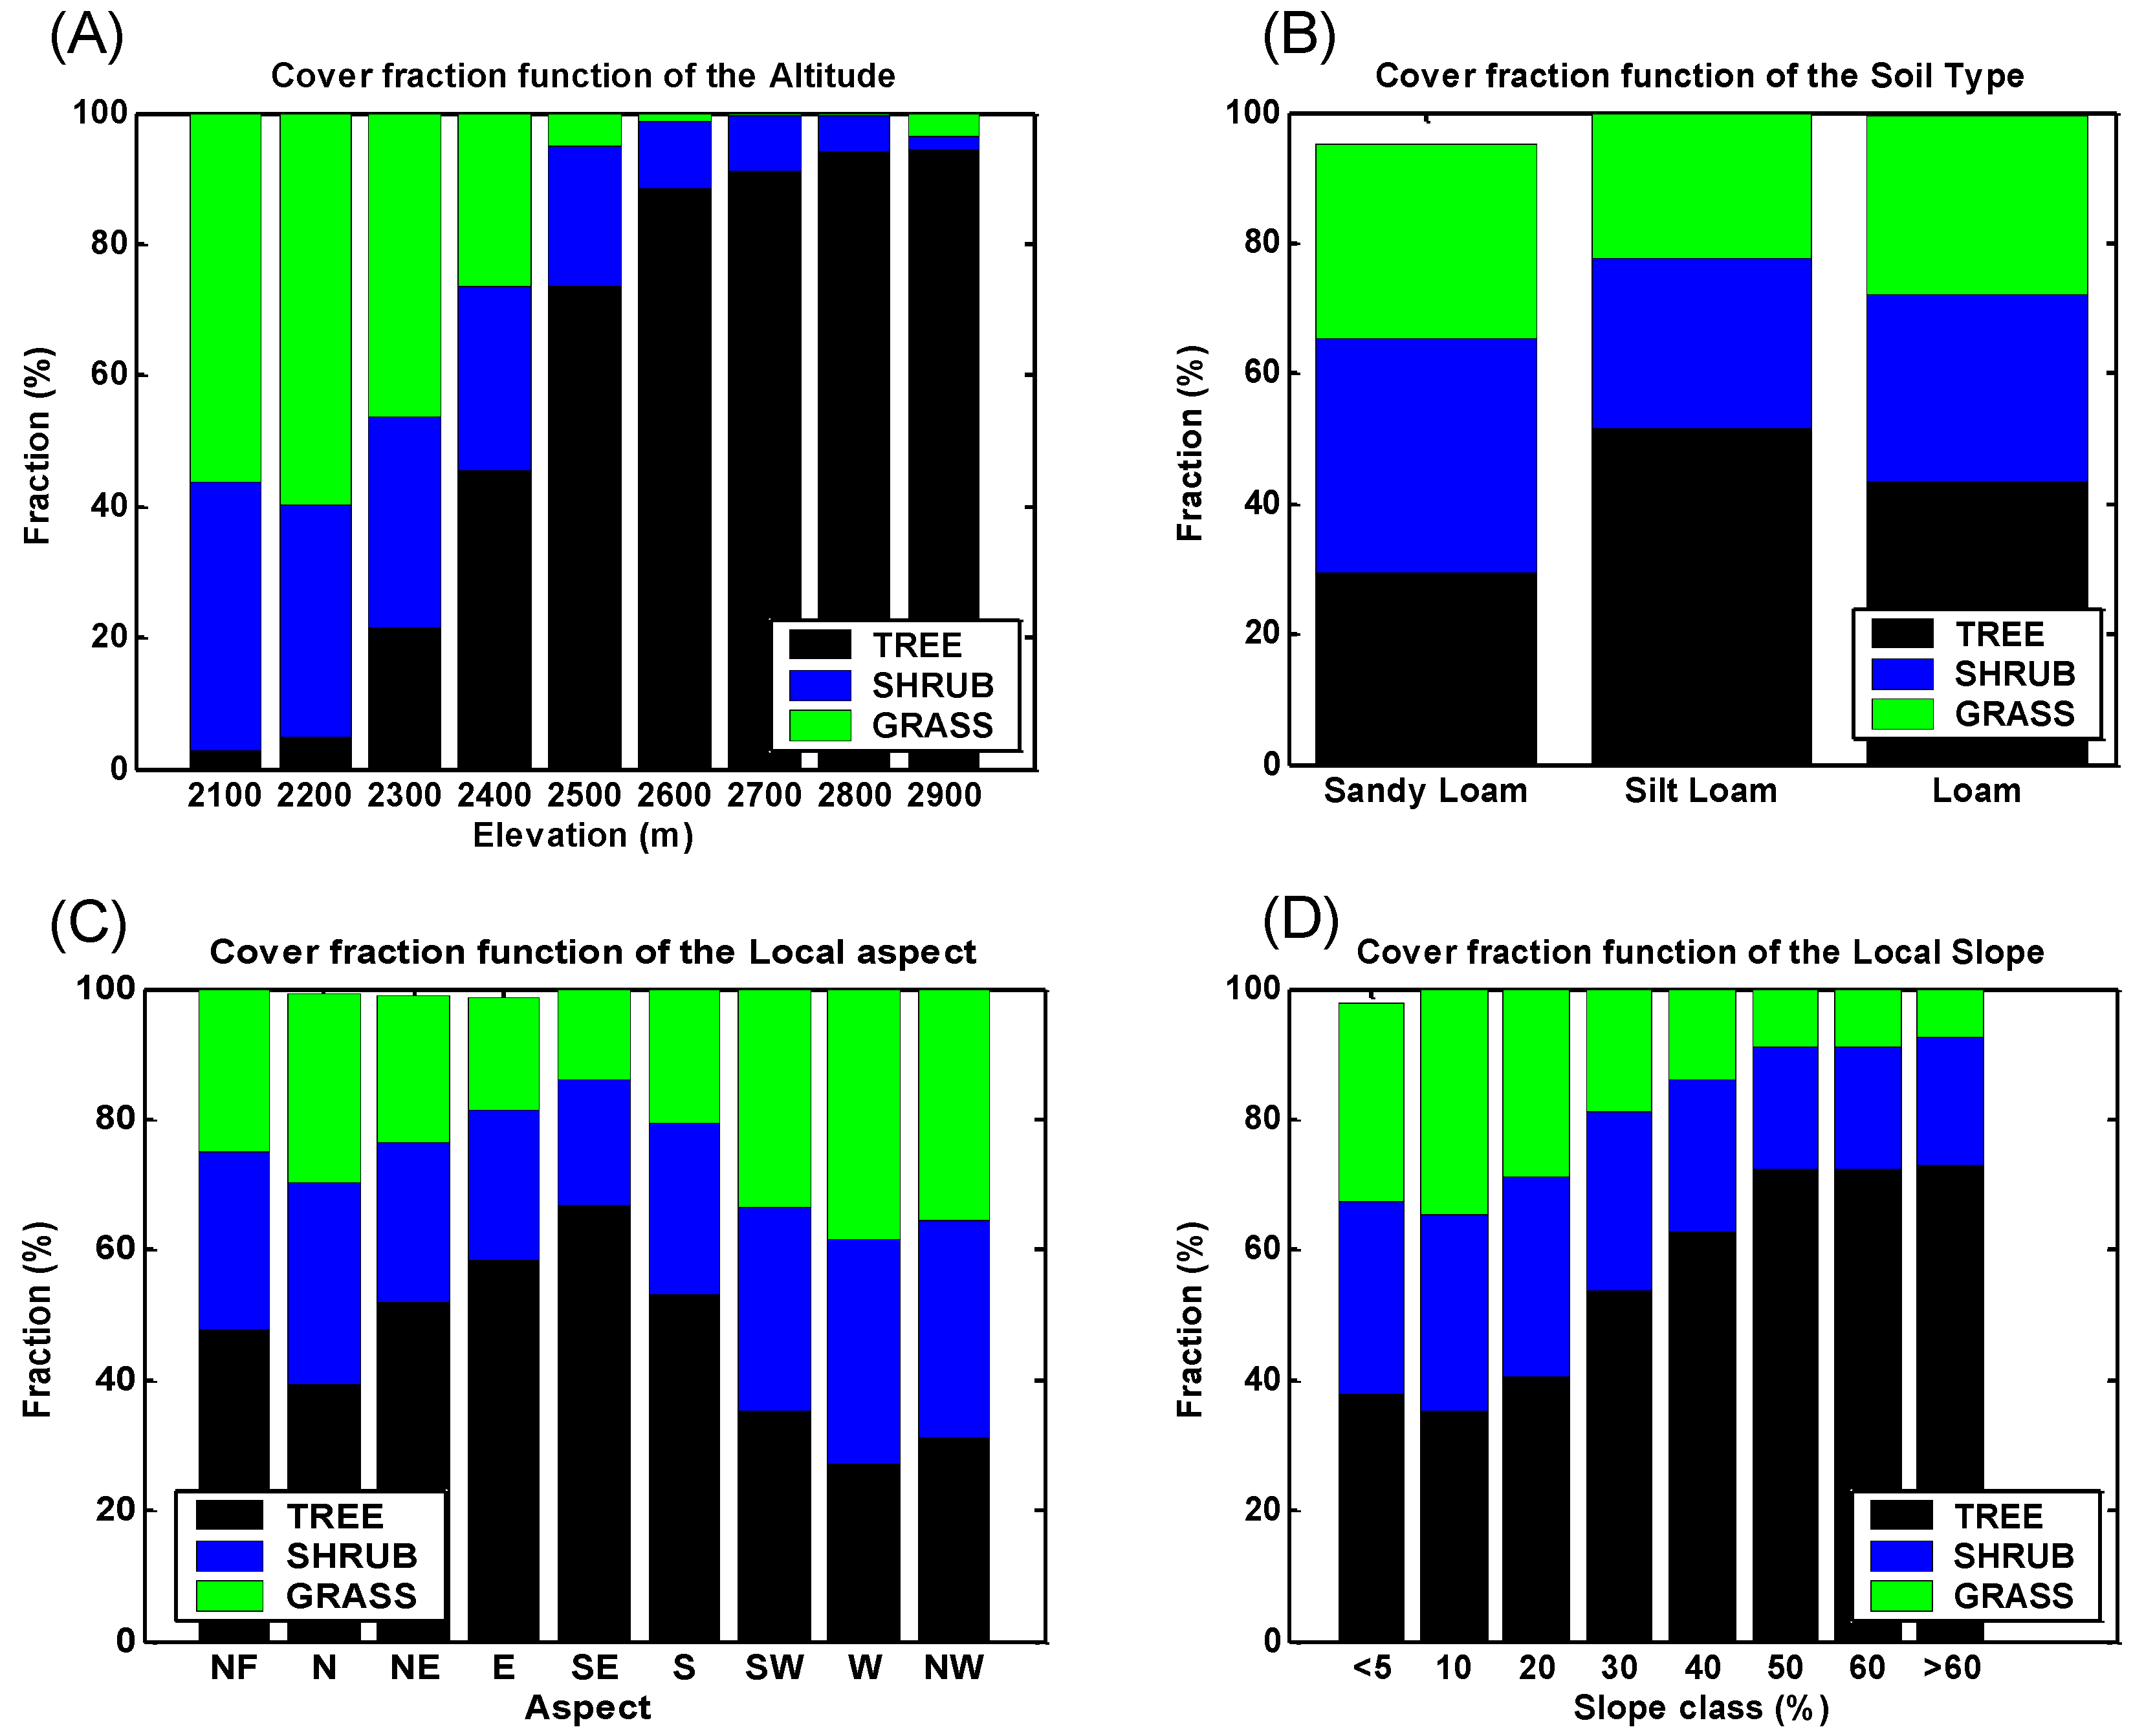
4. Discussion: Impact of Climate on Vegetation Patterns

Using the modeling scheme described in the previous sections, we derived a sequence of vegetation maps associated with different climatic conditions. Simulations have been carried out assuming different combinations of rainfall parameters with the same temperature values observed in the period 1990–2001 during the growing season. In this study, we focused on the impact of rainfall variations instead of modifying the potential evapotranspiration through the mean temperature of the season, mainly because in the present modeling scheme, we can modify the dynamic of the rainfall process changing the rate as well as the mean depth of rainfall events. In contrast, the relative change of temperature will produce an effect similar to the relative change of the total amount of rainfall during the growing season.
Manipulating the reference equations describing the climatic characteristics [Equations (1) and (2)], it is possible to simulate different climatic conditions varying rainfall parameters α and λ. In particular, Equations (1) and (2) have been modified keeping the coefficient of the linear regressions constant and changing the constant terms from 0.6 to 3.45 [for Equation (1)] and from 0 to 0.285 [for Equation (2)]. These changes produce a mean spatial value of the parameter α varying from a minimum value of 0.403 cm to a maximum value of 0.688 cm, while the mean value of the parameter λ varies from 0.196 day−1 to 0.481 day−1. Rainfall parameters have been modified producing 20 equally spaced values within the cited intervals that in total produce 400 climatic scenarios. The parameter space was set around the reference conditions of the Rio Salado Basin, which are described by α = 0.575 cm and λ = 0.284 day−1, moving the space of investigated conditions toward drier conditions, but incorporating a number of cases with a greater amount of water availability.
Consequently, the CA network model produced 400 patterns of steady state vegetation maps (see examples given in Figure 3). Given the range of variability of the rainfall parameters, it was necessary to include an additional option to the model that produces the condition of bare soil when the dynamic water stress experienced by all physiologically different vegetation types is equal to 1. Using this additional hypothesis, the model is able to produce clusters of bare soil in the portion of the basin where no vegetation can survive.
Figure 3. Examples of vegetation maps derived for the Upper Rio Salado basin for three different combinations of rainfall parameters. Maps are obtained using the measured rainfall rate (λ = 0.284 day−1) and changing the parameter α that assumes the following values: (A) 0.474cm; (B) 0.517cm; (C) 0.631cm.
Water 05 00819 g003
In order to study the modifications induced by all these scenarios, we decided to measure the changes brought by imposed climatic changes through landscape indices such as: the composition land cover types (Figure 4) and the Shannon diversity index (Figure 5).
Figure 4. Distribution in percentage of the types of soil cover as a function of the climatic conditions described by rainfall parameters α and λ. Percent cover of (A) bare soil; (B) grass; (C) shrub; and (D) tree.
Water 05 00819 g004
Figure 5. Distribution of the Shannon’s Index computed on the simulated vegetation patterns as a function of the climatic conditions described by the rainfall parameters α and λ.
Water 05 00819 g005
The percentages of each land cover types (tree, shrub, grass, and bare soil) as a function of the different climatic conditions are given in Figure 4. In particular, Figure 4A,D, which describes percentage cover of bare soil and trees, show a complementary behavior with an increase of trees when bare soil declines. The percentage of trees, in fact, increases with the increase of mean rainfall (greater frequency of rainfall λ, and greater mean daily rainfall depth α), up to a condition of stable equilibrium. In contrast, the percentage of bare soil tends to decrease with the increase of total rainfall. Different behavior is observed for shrub and grass that tends to prevail for intermediate values of the climatic conditions (see Figure 4B,C).
A synthesis of the landscape modifications is given in Figure 5 that describes the Shannon’s index for all range of parameters investigated for the Upper Rio Salado. The index shows a rapid and marked decrease with the reduction of both rainfall rate and mean rainfall depth. More humid climatic conditions favor the growth of the index that tends to a maximum and after a certain value it slight decreases up to a condition of equilibrium. It is useful to remind that SHDI increases as the number of different patch types increases and/or the proportional distribution of area among patch types become more equitable.
The surface of Shannon index can be better described by plotting 2D graphs obtained using fixed values of α or λ. In fact, Figure 6 shows the distribution of the index of diversity as a function of the mean rainfall amount during the growing season given by α λ Ts. Such a graph is composed by families of curves characterized by a fixed value of λ (with variable α–blue line) and with a fixed value of α (λ with variable–black line). The Shannon index decreases more rapidly when the rainfall reduction is due to the rainfall depth (λ is constant) and vice versa when the total rainfall reduction is due to the rainfall frequency (α is constant). In this figure, we also included the relative position of the Upper Rio Salado basin (red full circle) that is placed on the upper-right side of the graph (corresponding to a total rainfall during the growing season equal to 241 mm). According to this elaboration the basin is in a stable condition in terms of landscape composition for total rainfall amounts larger than 180 mm, when the total water availability is lower than this value a significant modification of the landscape composition may be observed.
The landscape diversity (described by the Shannon’s Evenness Index that accounts for both abundance and evenness of species) tends to increase non-linearly with changes of climatic conditions from dry to humid, with a sharp increase observed when moving from arid to semiarid conditions. These findings highlight that according to the state of different environments the same rainfall reduction may produce dramatically different effects on vegetation pattern with some environments more exposed of others. Moreover, the impact of climatic changes may also produce different effects depending on the type of change observed in the rainfall dynamics (rate or mean depth).
This behavior seems to be similar to the relationship observed in literature between the number of plant species and climate (e.g., [64]), where one observe that small increase of water availability may significantly increase biodiversity of a dry ecosystem. Of course, this behavior tends to be affected by other factors when water is not a limiting factor.
These findings can be a useful basis for the characterization of landscape diversity in the context of identification and delimitation of protected area as well as for their planning and management. In fact, this analysis highlight that some environment are more exposed than other to climatic changes and according to the physical characteristics of the site, the actual climatic conditions and the predicted changes one may evaluate its vulnerability and plan the extend of the area most exposed to future changes.
Figure 6. Distribution of the Shannon’s Index computed on the simulated vegetation patterns as a function of the mean rainfall depth during the growing season (α λ Ts) of assigned values of the rainfall parameters α and λ. The full red circle describes the relative position of the Rio Salado basin under the actual climatic conditions.
Water 05 00819 g006

5. Conclusions

In the present work, we explored the impact of climate change on the vegetation patterns of semiarid ecosystems. The modeling approach proposed relies on the physically based approach, where a steady state solution of soil moisture is used to drive a cellular automata model applied on a real case study. Analyses show that the spatial distribution of vegetation is mainly controlled by local climate and basin morphology that play a dual role, influencing the soil water balance at the local scale and the interaction between species.
Vegetation maps obtained for different climatic scenarios have been characterized in terms of composition and diversity. In particular, the landscape analyses show that landscape composition changes non-linearly with climate changing from dry to humid evidencing different sensitivities of the vegetation patterns to the climatic conditions.
The main outcomes of the present work can be summarized in the following points: (i) the landscape analyses, based on the modeling applications, show that reduction of landscape diversity (described by the Shannon’s Index) may occur rapidly for small changes in the rainfall characteristics; (ii) these changes are exacerbated when rainfall modifications are due to reduction in the mean rainfall depth; (iii) the impact of climate change on the vegetation pattern depends on the vulnerability of a system with respect to the expected changes. These results are consistent with the analyses carried out by Walther et al. [28] that evidenced how the responses to relatively low average rates of climate change may be significant, raising several concerns about its ecological and socio-economic consequences.
The results of the present study are also confirmed by analyses carried out on basins characterized by different climatic conditions as shown in a similar study by Manfreda [18]. These findings can be a useful basis for the characterization of landscape diversity in the context of identification and delineation of protected areas and their management.

Acknowledgments

The authors are particularly grateful to A. Acampora for his valuable support in the modeling applications.

Conflicts of Interest

The author declares no conflict of interest.

References

  1. Ricard, J.P.; Messier, C. Abundance, growth, and allometry of red raspberry (Rubus idaeus L.) along a natural light gradient in a northern hardwood forest. For. Ecol. Manag. 1996, 81, 153–160. [Google Scholar] [CrossRef]
  2. Martens, S.N.; Breshears, D.D.; Meyer, C.W. Spatial distributions of understory light along the grassland/forest continuum: Effects of cover, height, and spatial pattern of tree canopies. Ecol. Model. 2000, 126, 79–93. [Google Scholar] [CrossRef]
  3. Tilman, D. Secondary succession and the pattern of plant dominance along experimental nitrogen gradients. Ecol. Monogr. 1987, 57, 189–214. [Google Scholar] [CrossRef]
  4. Lejeune, O.; Tlidi, M.; Couteron, P. Localized vegetation patches: A self-organized response to resource scarcity. Phys. Rev. E 2002, 66, 010901(R). [Google Scholar]
  5. Rietkerk, M.; Dekker, S.C.; de Ruiter, P.C.; van de Koppel, J. Self-organized patchiness and catastrophic shifts in ecosystems. Science 2004, 305, 1926–1929. [Google Scholar] [CrossRef]
  6. Klausmeier, A. Regular and irregular patterns in semiarid vegetation. Science 1999, 284, 1826–1828. [Google Scholar] [CrossRef]
  7. Couteron, P.; Lejeune, O. Periodic spotted patterns in semiarid vegetation explained by a propagation-inhibition model. J. Ecol. 2001, 89, 616–628. [Google Scholar] [CrossRef]
  8. Myneni, R.B.; Nemani, R.R.; Running, S.W. Estimation of global leaf area index and absorbed par using radiative transfer models. IEEE Trans. Geosci. Remote Sens. 1997, 35, 1380–1393. [Google Scholar] [CrossRef]
  9. Dunne, J.A.; Harte, J.; Taylor, K.J. Subalpine meadow flowering phenology responses to climate change: Integrating experimental and gradient methods. Ecol. Monogr. 2003, 73, 69–86. [Google Scholar] [CrossRef]
  10. Scheiner, S.M.; Rey Benayas, J.M. Global patterns of plant diversity. Evol. Ecol. 1994, 8, 331–338. [Google Scholar] [CrossRef]
  11. Kramer, P.J.; Boyer, J.S. Water Relations of Plants and Soils; Academic Press: San Diego, CA, USA, 1995. [Google Scholar]
  12. Larcher, W. Physiological Plant Ecology; Springer-Verlag: New York, NY, USA, 1995. [Google Scholar]
  13. Levis, S.; Coe, M.T.; Foley, J.A. Hydrologic budget of a land surface model: A global application. J. Geophys. Res. 1996, 101, 16921–16930. [Google Scholar] [CrossRef]
  14. Baldocchi, D.D.; Xu, L.; Kiang, N. How plant functional-type, weather, seasonal drought, and soil physical properties alter water and energy fluxes of an oak-grass savanna and an annual grassland. Agric. For. Meteorol. 2004, 123, 13–39. [Google Scholar] [CrossRef]
  15. Heimann, M.; Reichstein, M. Terrestrial ecosystem carbon dynamics and climate feedbacks. Nature 2008, 451, 289–292. [Google Scholar] [CrossRef]
  16. D’Odorico, P.; Laio, F.; Ridolfi, L.; Lerdau, M.T. Biodiversity enhancement induced by environmental noise. J. Theor. Biol. 2008, 255, 332–337. [Google Scholar] [CrossRef]
  17. Pignatti, S. Ecologia del Paesaggio [in Italian]; UTET: Torino, Italy, 1994. [Google Scholar]
  18. Manfreda, S. Ecohydrology: A new interdisciplinary approach to investigate on climate-soil-vegetation interactions. Ann. Arid Zone 2009, 48, 219–228. [Google Scholar]
  19. Chahine, M.T. The hydrological cycle and its influence on climate. Nature 1992, 359, 373–380. [Google Scholar] [CrossRef]
  20. Dickinson, R.E.; Kennedy, P. Impacts on regional climate of Amazon deforestation. Geophys. Res. Lett. 1992, 19, 1947–1950. [Google Scholar] [CrossRef]
  21. Lean, J.; Rowntree, P.R. Understanding the sensitivity of a GCM simulation of amazonian deforestation to the specification of vegetation and soil characteristics. J. Climate 1997, 10, 1216–1235. [Google Scholar] [CrossRef]
  22. Turner, M.G. Landscape ecology: The effect of pattern on process. Ann. Rev. Ecol. 1989, 20, 171–197. [Google Scholar]
  23. Levin, S.A. The problem of pattern and scale in ecology. Ecology 1992, 73, 1943–1967. [Google Scholar] [CrossRef]
  24. Trenberth, K.E.; Jones, P.A.; Bojariu, R.; Easterling, D.; Klein Tank, A.; Parker, D.; Rahimzadeh, F.; Renwick, J.A.; Rusticucci, M.; Soden, B.; et al. Observations: Surface and Atmospheric Climate Change. In Climate Change 2007: The Physical Science Basis. Contribution of Working Group I to the Fourth Assessment Report of the Intergovernmental Panel on Climate Ghange; Solomon, S., Qin, D., Manning, M., Chen, Z., Marquis, M., Averyt, K.B., Tignor, M., Miller, H.L., Eds.; Cambridge University Press: Cambridge, UK; New York, NY, USA, 2007. [Google Scholar]
  25. Körner, C.H.; Walther, G.R. Fingerprints of Climate Change—Concluding Remarks. In Fingerprints of Climate Change; Walther, G.R., Burga, C.A., Edwards, P.J., Eds.; Kluwer: New York, NY, USA, 2001; pp. 305–316. [Google Scholar]
  26. Duffy, J.E.; Stachowicz, J.J. Why biodiversity is important to oceanography, potential roles of genetic, species, and trophic diversity in pelagic ecosystem processes. Mar. Ecol. Progr. Ser. 2006, 311, 179–189. [Google Scholar] [CrossRef]
  27. Hughes, L. Biological consequences of global warming: Is the signal already apparent? Trends Ecol. Evol. 2000, 15, 56–61. [Google Scholar] [CrossRef]
  28. Walther, G.-R.; Post, E.; Convey, P.; Menzel, A.; Parmesan, C.; Beebee, T.J.C.; Fromentin, J.-M.; Hoegh-Guldberg, O.; Bairlein, F. Ecological responses to recent climate change. Nature 2002, 416, 389–395. [Google Scholar] [CrossRef]
  29. Maselli, F.; Chiesi, M.; Rodolfi, A.; Maracchi, G. Uso Di Serie Temporali NDVI Per Stimare L'effetto Dei Cambiamenti Climatici Sugli Ecosistemi Forestali [in Italian]. In Clima e Cambiamenti Climatici–Le Attività Di Ricerca Del CNR; Carli, B., Cavarretta, G., Colacino, M., Fuzzi, S., Eds.; Consiglio Nazionale delle Ricerche: Roma, Italy, 2007; pp. 701–704. [Google Scholar]
  30. Menzel, A.; Estrella, N.; Fabian, P. Spatial and temporal variability of the phenological seasons in Germany from 1951 to 1996. Glob. Change Biol. 2001, 7, 657–666. [Google Scholar] [CrossRef]
  31. Studer, S.; Appenzeller, C.; Defila, C. Inter-annual variability and decadal trends in alpine spring phenology: A multivariate analysis approach. Clim. Change 2005, 73, 395–414. [Google Scholar] [CrossRef]
  32. Smith, T.M.; Goodman, P.S. Successional dynamics in an Acacia nilotica-Euclea divinorum savannah in southern Africa. J. Ecol. 1987, 75, 603–610. [Google Scholar] [CrossRef]
  33. Skarpe, C. Spatial patterns and dynamics of woody vegetation in an arid savanna. J. Veg. Sci. 1991, 2, 565–572. [Google Scholar] [CrossRef]
  34. Jeltsch, F.; Moloney, K.; Milton, S.J. Detecting process from snapshot pattern: Lessons from tree spacing in the southern Kalahari. Oikos 1999, 85, 451–466. [Google Scholar] [CrossRef]
  35. Rodrìguez-Iturbe, I.; D’Odorico, P.; Porporato, A.; Ridolfi, L. On the spatial and temporal links between vegetation, climate, and soil moisture. Water Resour. Res. 1999, 35, 3709–3722. [Google Scholar] [CrossRef]
  36. Smit, G.; Rethman, N. The inuence of tree thinning on the soil water in a semi-arid savanna of Southern Africa. J. Arid Environ. 2000, 44, 41–59. [Google Scholar] [CrossRef]
  37. Rodrìguez-Iturbe, I.; Porporato, A. Ecohydrology of Water-Controlled Ecosystems: Soil Moisture and Plant Dynamics; Cambridge University Press: Cambridge, UK, 2005. [Google Scholar]
  38. Eagleson, P.S. Ecological optimality in water-limited natural soil-vegetation systems. 1. Theory and hypothesis. Water Resour. Res. 1982, 18, 325–340. [Google Scholar] [CrossRef]
  39. Eagleson, P.S.; Segarra, R.I. Water-limited equilibrium of savanna vegetation systems. Water Resour. Res. 1985, 21, 1483–1493. [Google Scholar] [CrossRef]
  40. Huang, C.; Marsh, S.E.; McClaran, M.; Archer, S. Postfire stand structure in a semiarid savanna: Cross-scale challenges estimating biomass. Ecol. Appl. 2007, 17, 1899–1910. [Google Scholar] [CrossRef]
  41. Kerkhoff, A.J.; Martens, S.N.; Shore, G.A.; Milne, B.T. Contingent effects of water balance variation on tree cover density in semiarid woodlands. Glob. Ecol. Biogeogr. 2004, 13, 237–246. [Google Scholar] [CrossRef]
  42. Schymanski, S.J.; Sivapalan, M.; Roderick, M.L.; Beringer, J.; Hutley, L.B. An optimality-based model of the coupled soil moisture and root dynamics. Hydrol. Earth Syst. Sci. 2008, 12, 913–932. [Google Scholar] [CrossRef]
  43. Caylor, K.K.; Scanlon, T.M.; Rodrìguez-Iturbge, I. Ecohydrological optimization of pattern and processes in water-limited ecosystems: A tradeoff-based hypothesis. Water Resour. Res. 2009, 45, W08407. [Google Scholar]
  44. Van Wijk, M.T.; Rodriguez-Iturbe, I. Tree-grass competition in space and time: Insights from a simple cellular automata model based on ecohydrological dynamics. Water Resour. Res. 2002, 38, 18-1–18-15. [Google Scholar]
  45. Fernandez-Illescas, C.P.; Rodriguez-Iturbe, I. The impact of interannual rainfall variability on the spatial and temporal patterns of vegetation in a water-limited ecosystem. Adv. Water Resour. 2004, 27, 83–95. [Google Scholar] [CrossRef]
  46. Scanlon, T.M.; Caylor, K.K.; Manfreda, S.; Levin, S.A.; Rodrıguez-Iturbe, I. Dynamic response of grass cover to rainfall variability: Implications the function and persistence of savanna ecosystems. Adv. Water Resour. 2005, 28, 291–302. [Google Scholar] [CrossRef]
  47. Jeltsch, F.; Weber, G.E.; Grimm, V. Ecological buffering mechanisms in savannas: A unifying theory of long-term tree-grass coexistence. Plant. Ecol. 2000, 150, 161–171. [Google Scholar] [CrossRef]
  48. Wooten, J. Local interactions predict large-scale pattern in empirically derived cellular automata. Nature 2001, 413, 841–844. [Google Scholar] [CrossRef]
  49. Caylor, K.K.; Scanlon, T.M.; Rodríguez-Iturbe, I. Feasible optimality of vegetation patterns in river basin. Geophys. Res. Lett. 2004, 31, L13502. [Google Scholar]
  50. Caylor, K.K.; Manfreda, S.; Rodrìguez-Iturbe, I. On the coupled geomorphological and ecohydrological organization of river basins. Adv. Water Resour. 2005, 28, 69–86. [Google Scholar]
  51. Laio, F.; Porporato, A.; Ridolfi, L.; Rodrìguez-Iturbe, I. Plants in water controlled ecosystems: Active role in hydrological processes and response to water stress, II. Probabilistic soil moisture dynamics. Adv. Water Resour. 2001, 24, 707–723. [Google Scholar]
  52. Porporato, A.; Laio, F.; Ridolfi, L.; Rodrìguez-Iturbe, I. Plants in water-controlled ecosystems: Active role in hydrological processes and response to water stress—III. Vegetation water stress. Adv. Water Resour. 2001, 24, 725–744. [Google Scholar]
  53. Milly, P.C.D. An analytical solution of the stochastic storage problem applicable to soil water. Water Resour. Res. 1993, 29, 3755–3758. [Google Scholar]
  54. Neilson, R.P. A model for predicting continental scale vegetation distribution and water balance. Ecol. Appl. 1995, 5, 362–385. [Google Scholar] [CrossRef]
  55. Rodríguez-Iturbe, I. Ecohydrology: A hydrologic perspective of climate-soil-vegetation dynamics. Water Resour. Res. 2000, 36, 3–9. [Google Scholar]
  56. Scholes, R.J.; Archer, S.R. Tree-grass interactions in Savannas. Ann. Rev. Ecol. Syst. 1997, 28, 517–544. [Google Scholar] [CrossRef]
  57. Rodríguez-Iturbe, I.; Isham, V.; Cox, D.R.; Manfreda, S.; Porporato, A. Space-time modeling of soil moisture: Stochastic rainfall forcing with heterogeneous vegetation. Water Resour. Res. 2006, 42, W06D05. [Google Scholar]
  58. Manfreda, S.; McCabe, M.; Wood, E.F.; Fiorentino, M.; Rodríguez-Iturbe, I. Spatial patterns of soil moisture from distributed modeling. Adv. Water Resour. 2007, 30, 2145–2150. [Google Scholar]
  59. Rodríguez-Iturbe, I.; Porporato, A.; Ridolfi, L.; Isham, V.; Cox, D.R. Probabilistic modeling of water balance at a point: The role of climate, soil and vegetation. Proc. R. Soc. A Math. Phys. Eng. Sci. 1999, 455, 3789–3805. [Google Scholar]
  60. Porporato, A.; D’Odorico, P.; Laio, F.; Rodríguez-Iturbe, I. Hydrologic controls on soil carbon and nitrogen cycles. I. Modeling scheme. Adv. Water Resour. 2003, 26, 45–58. [Google Scholar]
  61. Wagner, H.H.; Fortin, M.J. Spatial analysis of landscapes: Concepts and statistics. Ecology 2005, 86, 1975–1987. [Google Scholar]
  62. Cao, Y.; Ou, Y.H.; Xiao, D.; Chen, G. Landscape patterns analysis based on APACK for Ejin natural oasis. J. Nat. Resour. 2004, 19, 776–785. [Google Scholar]
  63. Chen, L.; Liu, Y.; Lv, Y.; Feng, X.; Fu, B. Pattern analysis in landscape ecology: Progress, challenges and outlook. Acta Ecol. Sin. 2008, 28, 5521–5531. [Google Scholar]
  64. Shmida, A.; Burgess, T.L. Plant Growt-Form Strategies and Vegetation Types in Arid Environments. In Plant form and Vegetation Structure; Werger, M.J.A., van der Aart, P.J.M., During, H.J., Verhoeven, J.T.A., Eds.; SBP Academic Publishing: The Hague, The Netherlands, 1988. [Google Scholar]

