Article

Air Masses Origin and Isotopic Tracers: A Study Case of the Oceanic and Mediterranean Rainfall Southwest of France

1
Laboratory of Functional Ecology and Environment (EcoLab), UPS, INPT, University of Toulouse,118 route de Narbonne, Toulouse F-31062, France
2
Laboratory of Functional Ecology and Environment (EcoLab), CNRS, 118 route de Narbonne, Toulouse F-31062, France
*
Author to whom correspondence should be addressed.
Water 2013, 5(2), 617-628; https://doi.org/10.3390/w5020617
Submission received: 18 March 2013 / Revised: 8 May 2013 / Accepted: 8 May 2013 / Published: 17 May 2013
(This article belongs to the Special Issue Environmental Tracers)

Abstract

:
Aquifers recharge mainly by local rainfall, which depend on the air mass humidity and orographic lifting, causing rain. The stable isotopes of the water molecule, i.e., oxygen-18 and deuterium, are useful tracers to determine the water source origin. Moreover, the calculation of the deuterium excess enables one to differentiate between the air masses from the Atlantic Ocean or the Mediterranean Sea. A transect from one coast to the other one and going through the city of Toulouse have been made to sample the groundwater and determine their isotopic characteristic. A monthly rainfall sampling has also been done over one year, close to the city Toulouse, to see how the d-excess values range over the season. The discussion replaces these results in available isotopic data.

1. Introduction

France presents a wide range of coasts and is influenced by both the Atlantic Ocean and the Mediterranean Sea. The morphology of this country, which impacts the rainfall pattern, is complex, with the Massif Central in the center, the Alps to the east and the Pyrenees to the south. The main processes controlling the δ18O and δD isotopic signatures in precipitations were summarized by Rozanski et al. [1]; i.e., the rainfall amount, continental and altitude effects and the origin of air masses. For France, some pioneer works have studied the isotopic pattern of rainfall, such as Celle et al., Celle-Jeanton et al., Ladouche et al. and Millot et al. [2,3,4,5], but still, some areas lack for valuable data, like the Southwest area. It is, therefore, important to constrain the signature of the atmospheric signal in these geographical and geomorphological contexts by means of a rainfall-monitoring network and groundwater measurements.
The Southwest of France presents the characteristics of having two major winds blowing in an opposite direction. For instance, in Toulouse, the northwest wind (280° to 340°), called “Cers”, blows during 43% of the year, bringing the moisture from the Atlantic Ocean, and the southeast wind (120° to 180°), called “Autan”, blows during 29% of the year, bringing the Mediterranean influences. Therefore the airport runways are oriented N-W/S-E, the planes taking them from one end or the other depending on the wind origin.
The Autan wind is a föhn-type wind deriving from the Marin wind from the Mediterranean and blowing over the Languedoc into the Tarn and the Garonne valleys, affecting the Lauragais (the hilly area between Castelnaudary and Toulouse) and the Toulouse area. Channeled and intensified by the narrowing lowlands between the Pyrenees and the south of the Massif Central, it undergoes sudden acceleration between the Corbières and the Montagne Noire (Venturi effect). Gusts can exceed twice the mean speed, possibly enhanced by lee-wave activity.
To understand the Atlantic Ocean and the Mediterranean Sea on the southwest rainfall of France, the present work summarizes over 75 isotopic measurements of shallow groundwater, used as rainfall natural gauges, located between these two coasts. This study is completed by an 18 months’ rainfall survey near Toulouse in view to follow the air masses origin for the rainfall over the season and the influence of the Mediterranean income mainly through the Autan wind.

2. Experimental Section
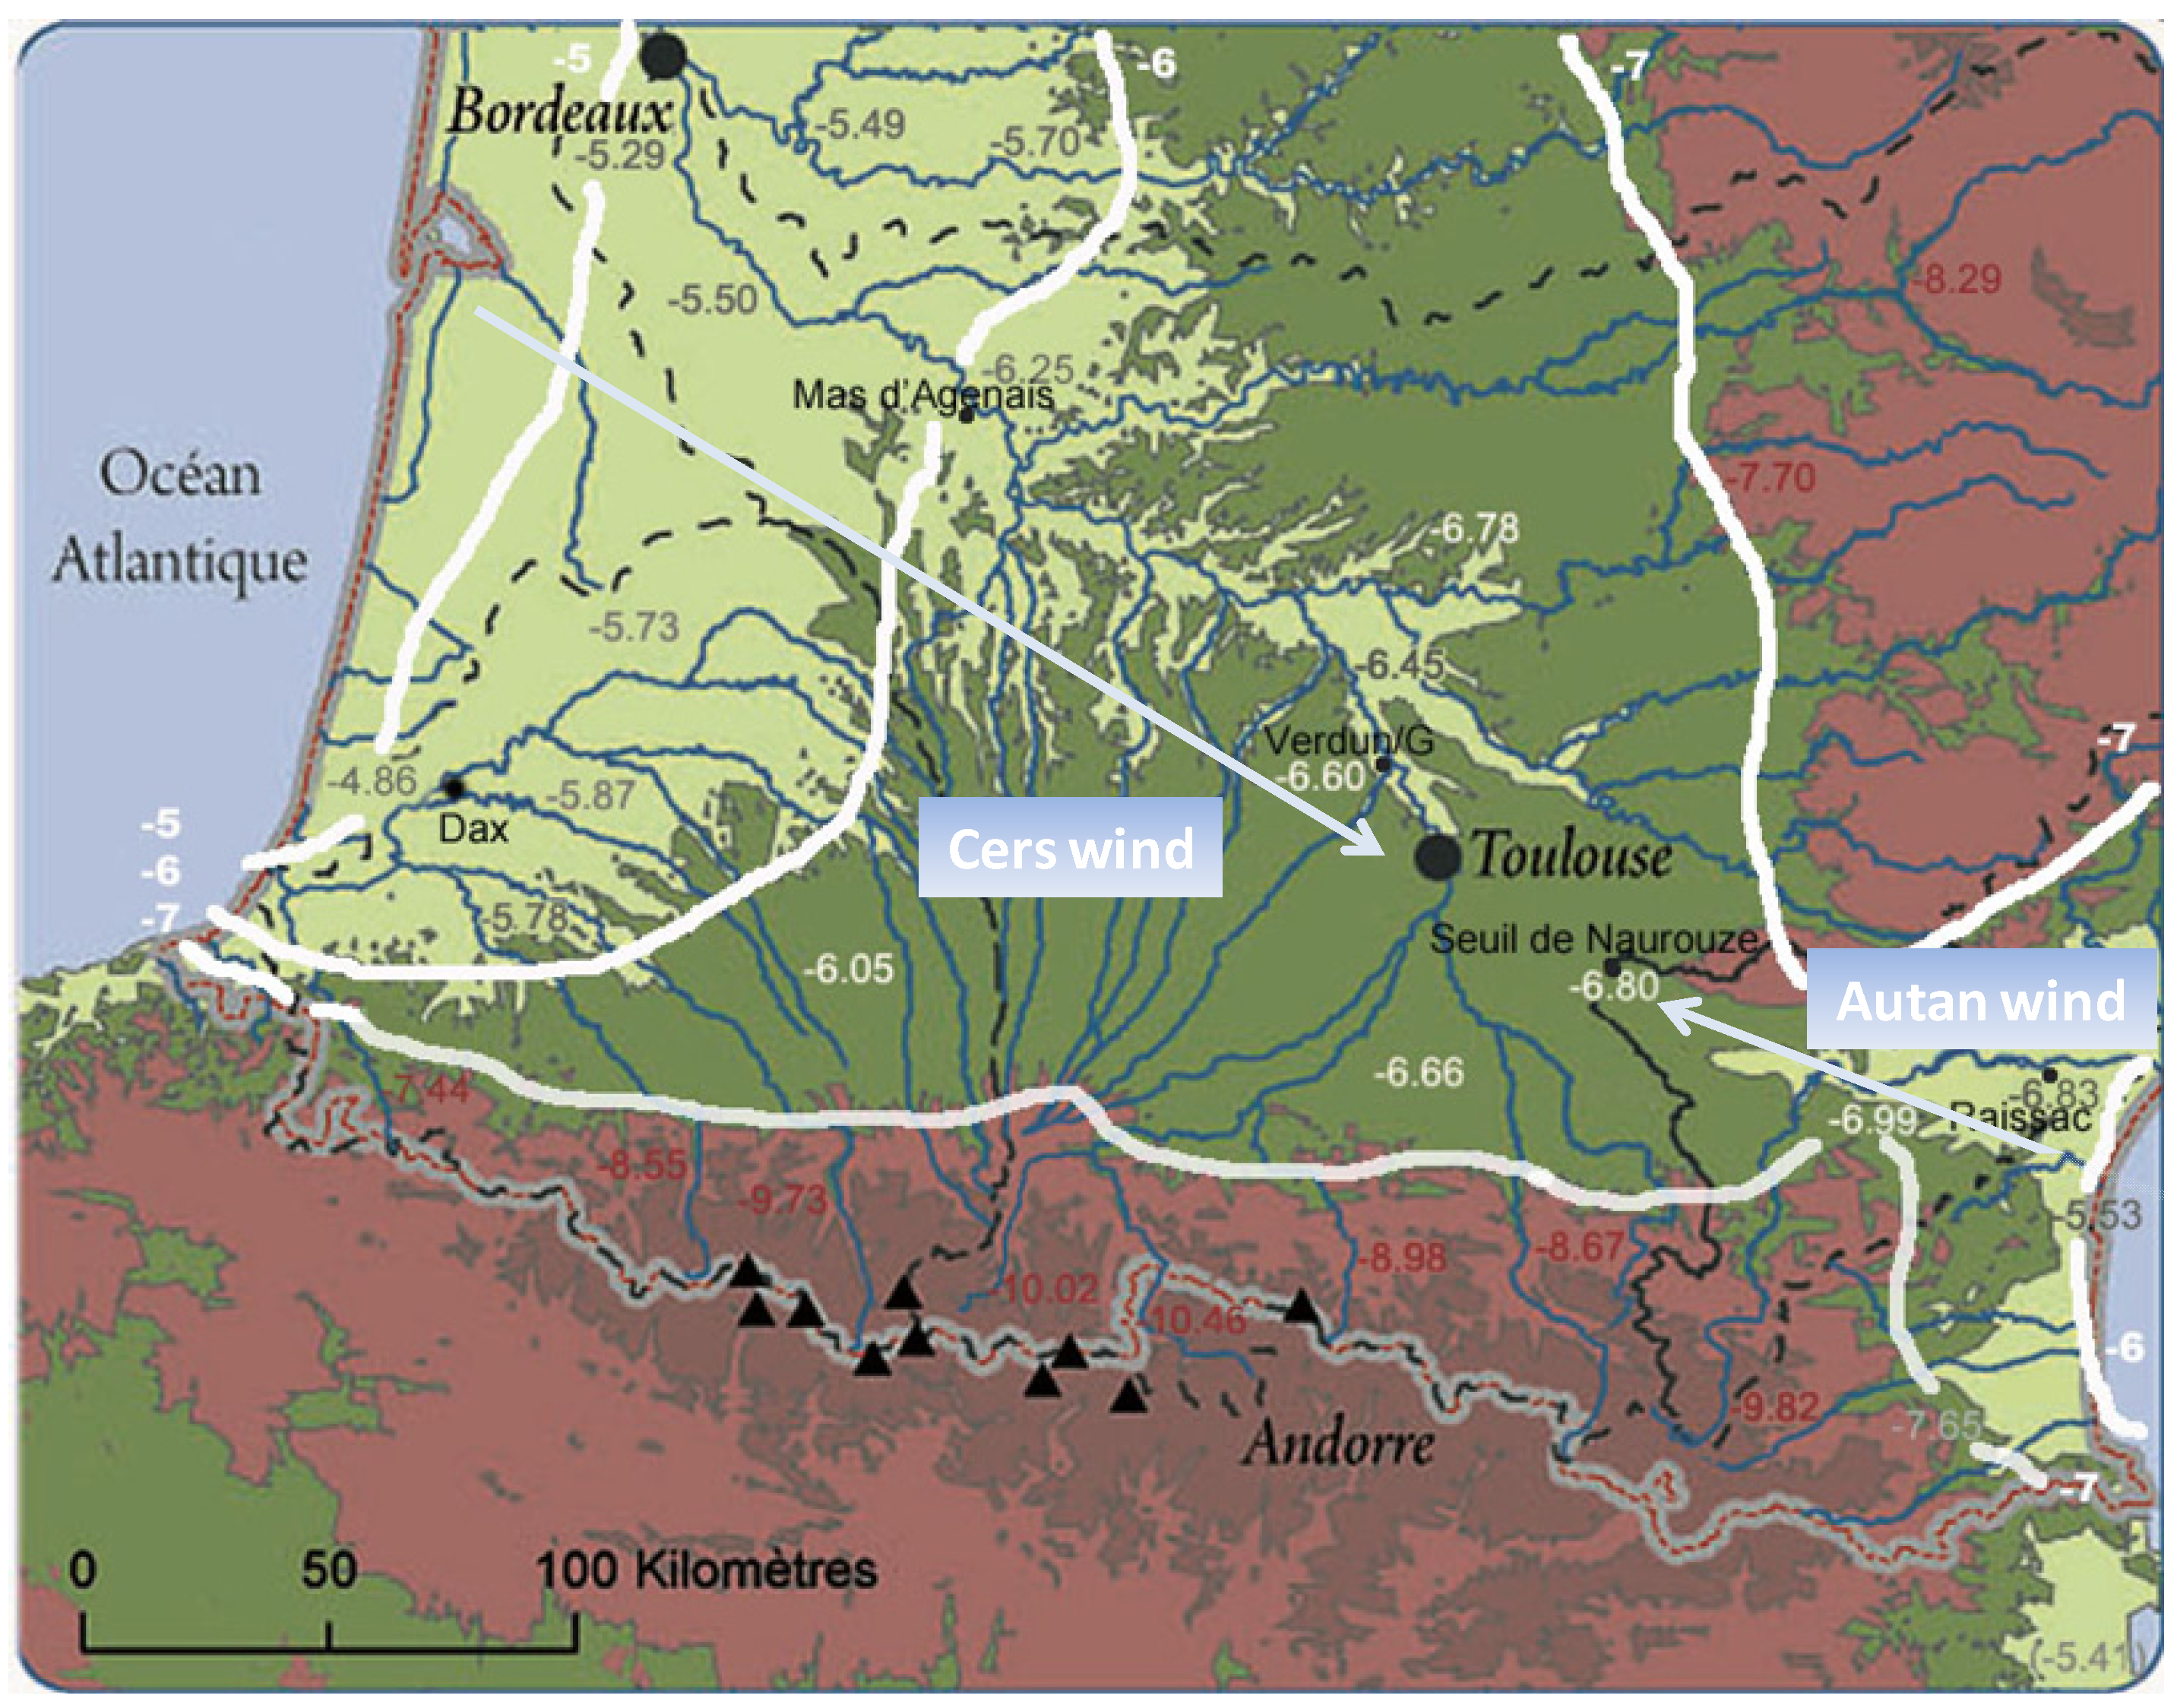
2.1. Study Area

The Southwest of France stretches between the Atlantic and the Mediterranean coast over 350 km; see Figure 1, Figure 5. For the groundwater, the sampling places were taken in alluvial plains, i.e., along the Garonne and Adour valley at the west and along the Aude valley at the east. The connection between the two basins is Seuil de Naurouze (189 m) located 40 km southeast of Toulouse. Farm wells or piezometers, if available, were used for the shallow groundwater sampling. Typical water depth ranges between 2 and 12 m. The longer groundwater survey has been made near Verdun sur Garonne, 35 km downstream (northwest) of Toulouse, in a farm well (depth 2–4 m), one km away from the Garonne River. It is located in the middle of the Garonne Channel and would be classified as mixed bedrock-alluvial stream [6], and the valley contains a classic flight of clay terraces that represent an episodic bedrock valley deepening and punctuated by lateral migration of the deposition of coarse gravels and sands.
Along the west to east transect, the rainfall cumulates at the feet of the Western Pyrenees, with 1156 mm per year in Dax and a little less for Cestas-Pierroton, located north of Bordeaux with 920 mm. After, the rainfall amounts lower along the Garonne Valley with 763 mm in Agen and 660 mm in Toulouse. It increases slowly in the area of Carcasonne 736 mm, due to the proximity of the mountains, before slowing down again in the direction of the Mediterranean Sea: 609 mm in Narbonne, 549 mm in Perpignan and 605 mm in Sète. On the contrary, the evaporation enhance from west to east due to the increasing insulation.
Figure 1. The Southwest of France with the localization of the sample sites with the typical δ18O value of the groundwater (in white) and the upstream basin (in red). The resulting isovalue contour for δ18O = −5‰, −6‰ and −7‰ are given with a white line, and the two dominant wind directions are given by both arrows.
Water 05 00617 g001

2.2. Rainfall Sampling

Close to our isotopic laboratory in Auzeville, 8 km southeast of Toulouse, a rainfall sampling was installed during June 2011. Its consist of a polypropylene funnel (22 cm diameter) covering a 5 L polypropylene jerrycan, containing 300 mL of paraffin oil to avoid any evaporation process. The rainfall aliquots were sampled monthly, between July 2011 and December 2012. The meteorological data used were obtained from the close INRA station (less than 1 km) and compared with the long-term Toulouse airport station, Blagnac, where the record started in 1809, and located northwest, at 18 km. For each monthly sample, 10 mL were used for δ18O and δD determination.

2.3. Groundwater Sampling

The shallow groundwater survey started in 1997 at Monbequi near Verdun sur Garonne in farm wells and piezometers to follow the influence of the Garonne River in this meander area [7,8]. The upper well was chosen as the local ground water reference and samplings were made over 6 years. To get a wider understanding of the alluvial groundwater characteristic, complementary samplings were done along the Garonne Valley between 2004 and 2007, for the Adour Valley between 2005 and 2006 and at the Seuil de Naurouze and Aude Valley in 2010.

2.4. Isotopic Measurements

Glass vial of 10 mL with tight caps were used for water sampling. The vials were kept at stable temperature before the measurement of the δ18O and δD determination on a continuous flow isotope ratio mass spectrometer. Before 2007, the water samples were send to an iso-analytical laboratory in England (ANCA-GSL and GEO 20–20 IRMS, Europa Scientific, Crewe UK). Each water sample was measured in triplicate for each isotope ratio. The overall mean standard deviation (SD) for the δ18O values was around ±0.15‰, and the mean SD for the δ2H values was ±1.7‰. From 2010, the measurements were done on our own isotopic platform, Shiva (Isoprim 100 and Geo-multi-flow, Elementar, Hamburg, Germany). Each water sample was measured in duplicate. The mean standard deviation (SD) for the rainfall measurements was around ±0.29‰ for δ18O, and the overall mean SD was ±2.5‰ for δ2H.
The results are given relative to V-SMOW standards from IAEA. The deuterium excess was calculated using the Global Meteorological Water Line (GMWL), as defined by Craig [9] and completed by Dansgaard [10]:
d-excess = δD – 8 × δ18O
A value of d-excess around 10 or below, i.e., similar to the GMWL, was taken as originating from Atlantic moisture and a value around 14 [2] as moisture with water recycling as one coming from the close West Mediterranean basin.

3. Results and Discussion

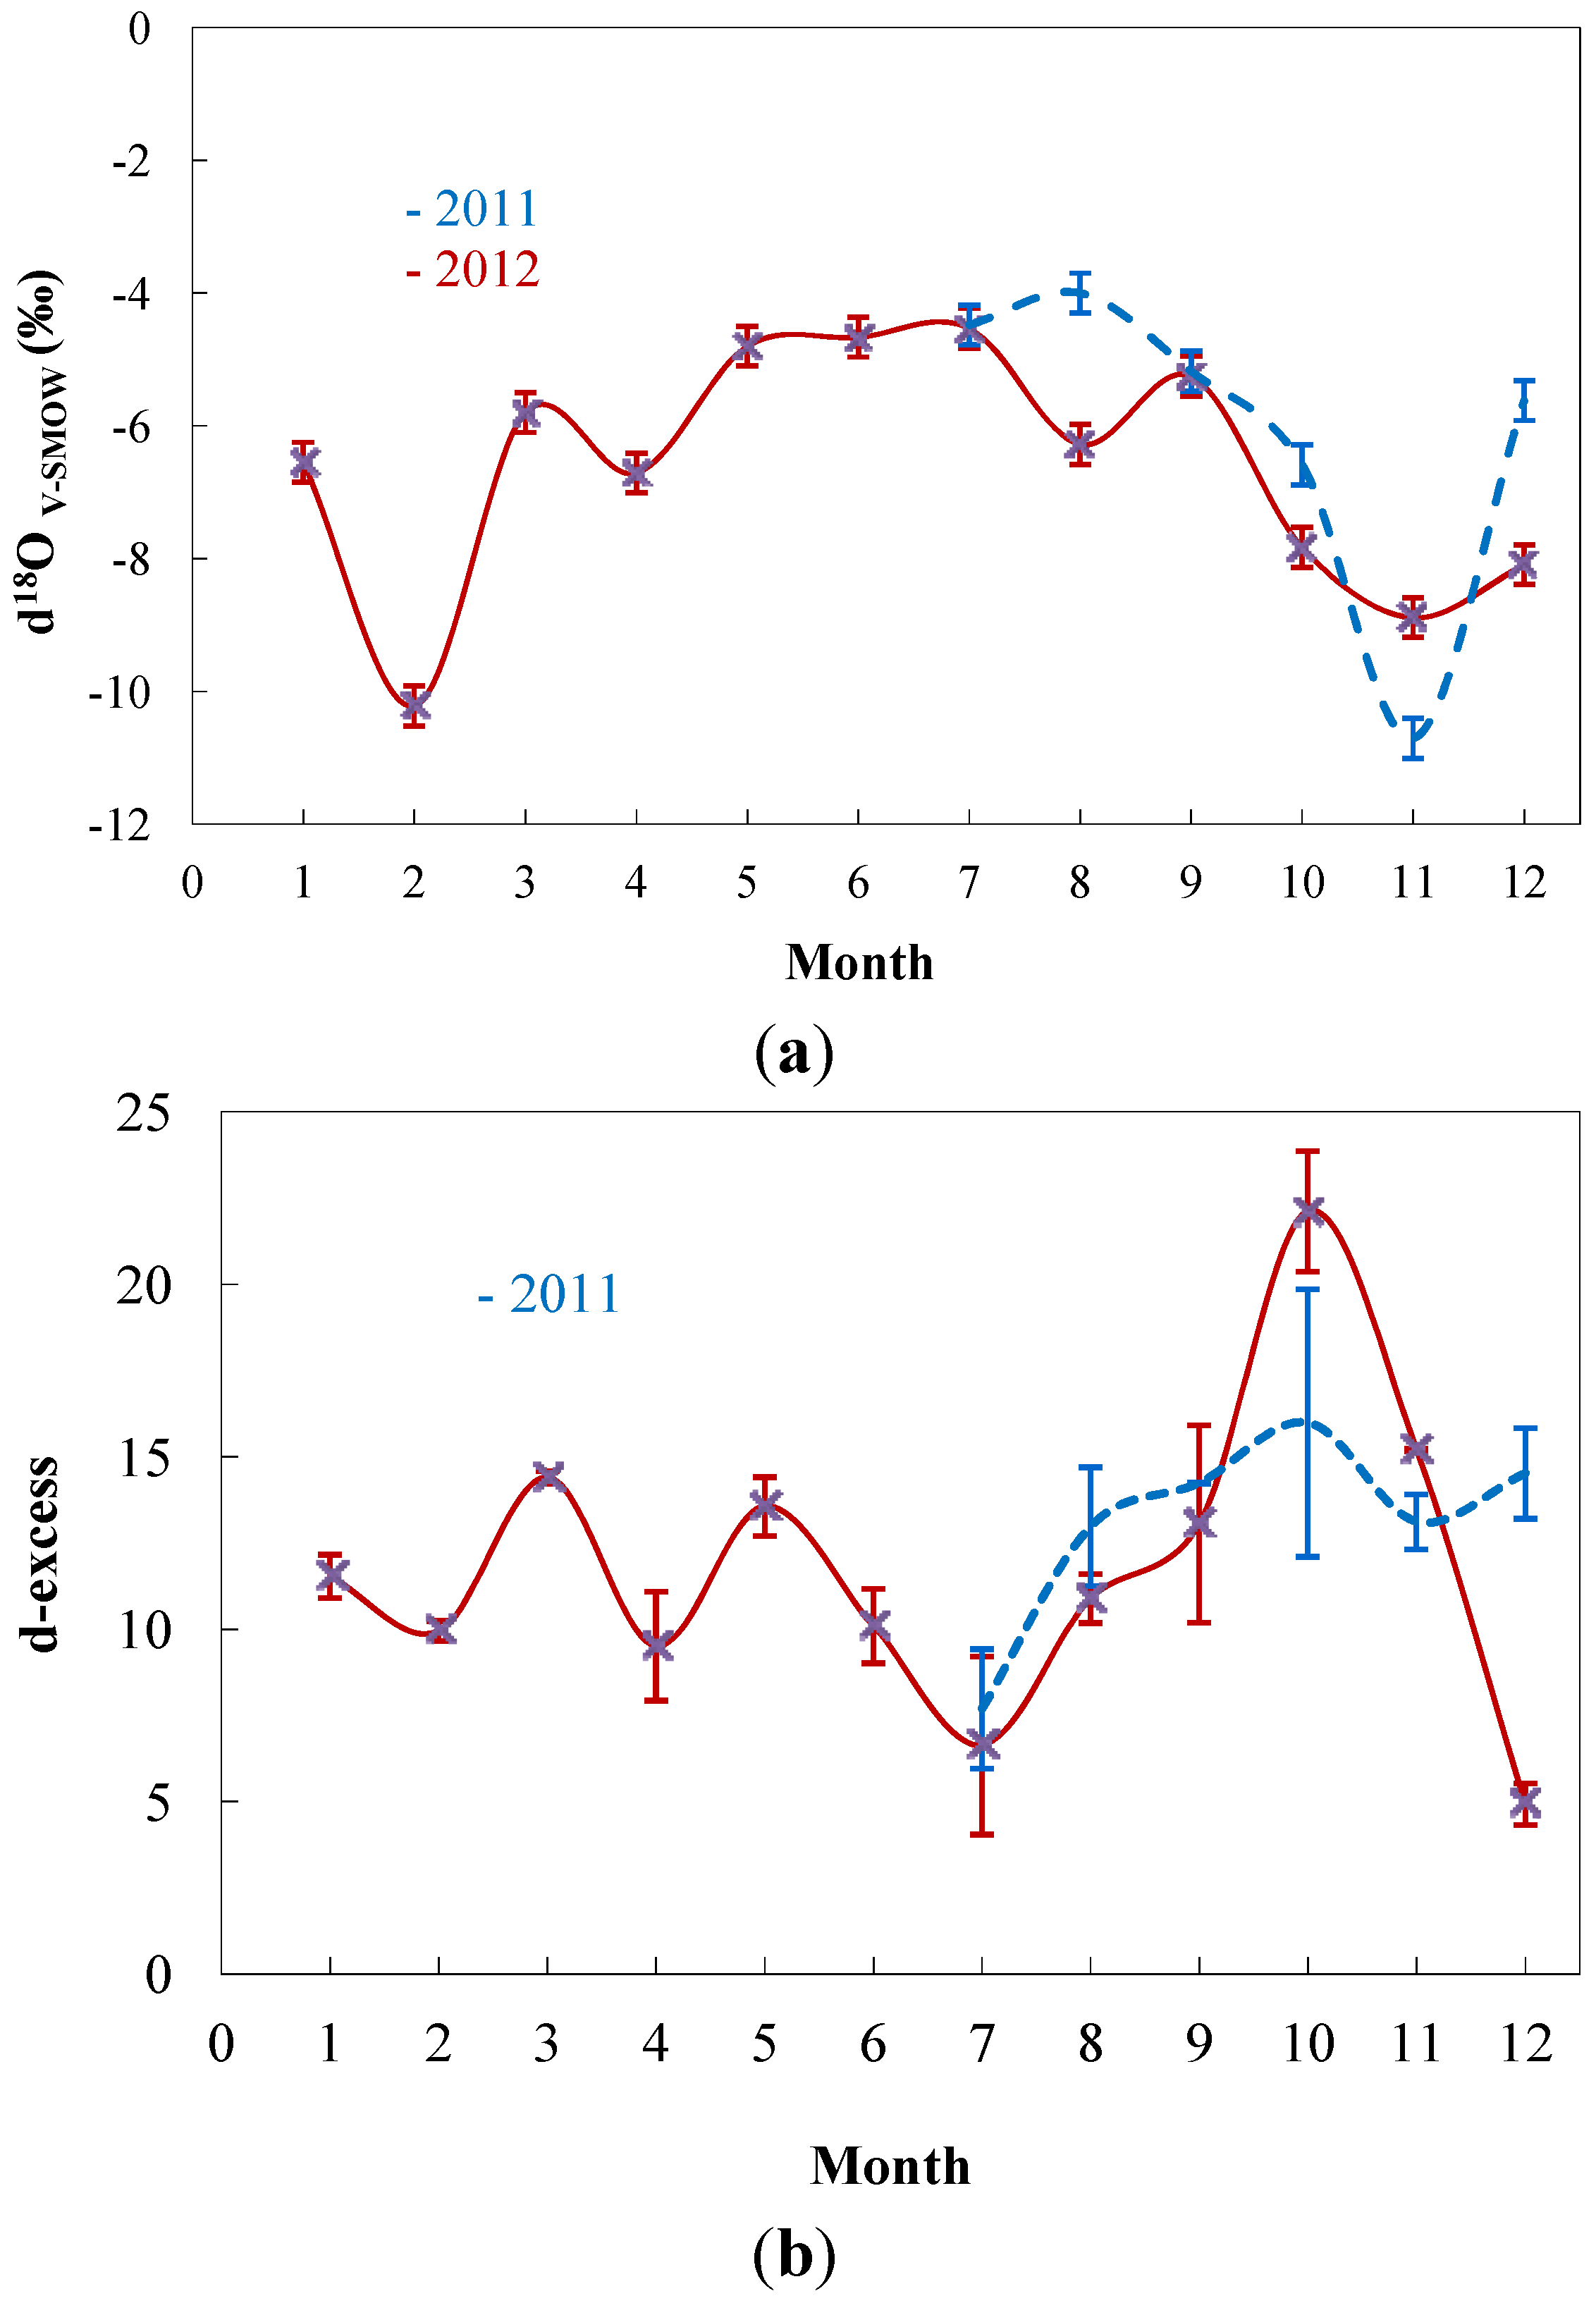
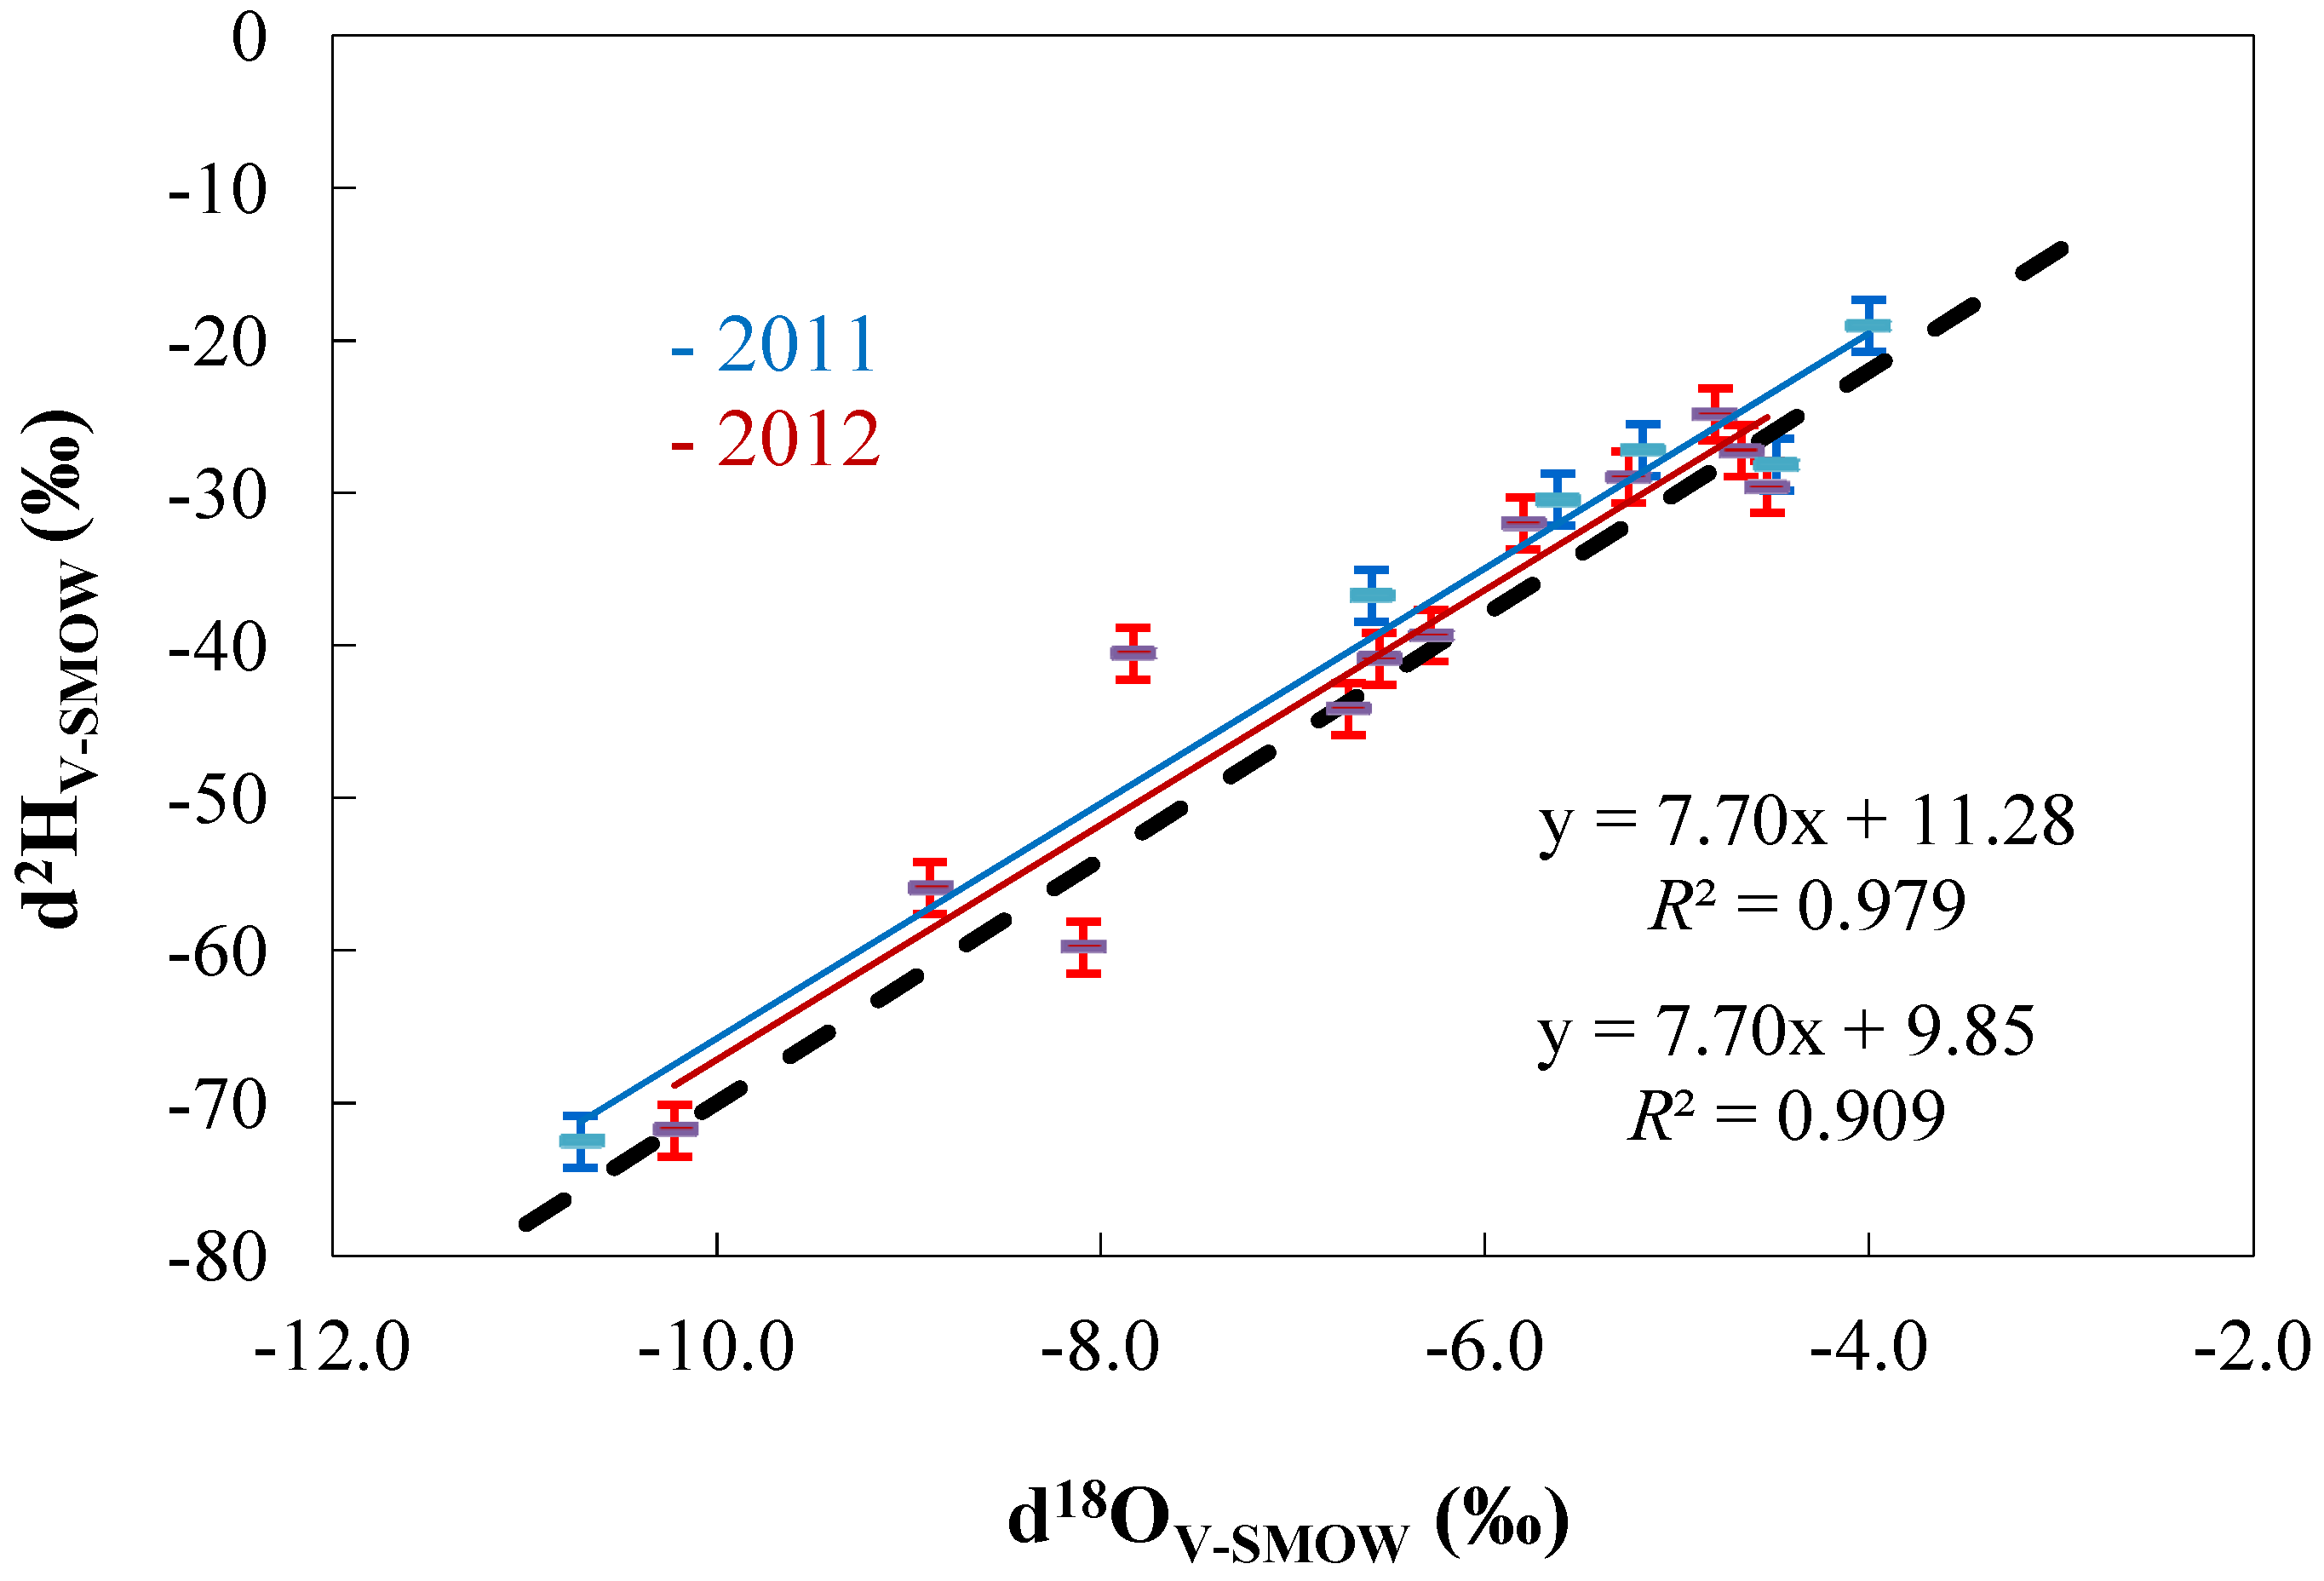
3.1. Rainfall Results

The data were obtained between July 2011 and December 2012. The annual amount of rainfall for 2011 was 538 mm, and for 2012 it was 548 mm in the INRA station and around 20% over the amount values from Blagnac Airport station. These numbers are under the 30 years mean (CLINO period 1961–1990 [11]), 671 ± 121 mm per year monthly, as since 2003, the Toulouse area is in a dry period. The obtained isotopic value for δ18O ranges from −10.7‰ to −4.0‰, showing the continental influence, with a mean monthly temperature ranging from −2.5 °C (February 2012) for the minimum to +30.4 °C (August 2012) for the maximum. Table 1 reports the obtained isotopes values for the monthly rainfall, with the meteorological data from the nearby INRA station.
In Figure 2, both years are plotted along a whole year and present a similar pattern. The δ18O signal presents the more depleted values in winter and the less depleted in summer, following the temperature shift. The negative peak from February 2012 corresponds to a cold period, until −12.5 °C on February 9, with one week of snow. The d-excess displays more erratic variations, perhaps with some evaporative process in summer (July) and a possible Mediterranean influence in October.
Figure 3 gives the representation of δ18O versus δ2H for both years. For 2011, the regression gives in 2011 a slope of 7.70 and a d-excess of 11.28 with R2 = 0.979, and in 2012, the slope is equal to 7.70 and a d-excess of 9.85 with a R2 = 0.909. Both sets are very close with the Global Meteorological Water Line (GMWL) defined by Craig 1961 [9]. The point above the GMWL (δ18O = −7.83‰, d-excess = +22.12) corresponds to a possible Autan wind influence with the incoming of Mediterranean rain. The weighted mean (w-mean) of δ18O or the d-excess can be calculated by summing the monthly amount of rainfall (rainfall amountmonth) relative to the total rainfall for one year and multiplying both monthly isotopic values, according to the following equation:
δ18Ow-mean = Σ i = 1 to 12 δ18Omonth × Rainfall amountmonth ÷ Rainfall amountyear
The obtained value for the 2012 values is δ18Ow-mean = −6.32‰ ± 0.25‰ and a d-excessw-mean = 11.76 ± 0.59.
Table 1. Isotopic results, calculated d-excess and meteorological conditions for the rainfall samples near Toulouse.
Monthδ18Oδ2Hd-excessRainfallMin. TMax. T
(‰)(‰)(mm)(°C)(°C)
July 2011−4.48−28.157.6986.514.925.7
August 2011−4.00−19.0212.9821.516.329.0
September 2011−5.18−27.1814.2473.514.827.2
October 2011−6.59−36.7315.9824.59.621.7
November 2011−10.71−72.5613.1231.09.615.9
December 2011−5.62−30.4514.5153.05.012.1
January 2012−6.55−40.8711.5339.03.810.3
February 2012−10.22−71.819.954.0−2.56.0
March 2012−5.80−32.0014.4022.04.117.5
April 2012−6.71−44.179.5169.07.616.2
May 2012−4.80−24.8413.5675.511.622.2
June 2012−4.67−27.2310.1053.515.026.5
July 2012−4.53−29.616.6358.014.727.5
August 2012−6.28−39.3510.8948.517.530.4
September 2012−5.25−28.9613.0526.013.924.7
October 2012−7.83−40.5322.1253.01120.5
November 2012−8.89−55.9215.2049.56.814
December 2012−8.09−59.804.9350.54.611.6
Figure 2. Monthly variation of (a) δ18O and (b) d-excess with error bars for the rainfall in 2011 (dotted line, no symbol) and 2012 (plain line, cross symbol) near Toulouse.
Water 05 00617 g002
Figure 3. Relationship between the δ18O and δ2H rainfall values for 2011 and 2012 compared to the GMWL line (dotted line).
Water 05 00617 g003

3.2. Groundwater Results

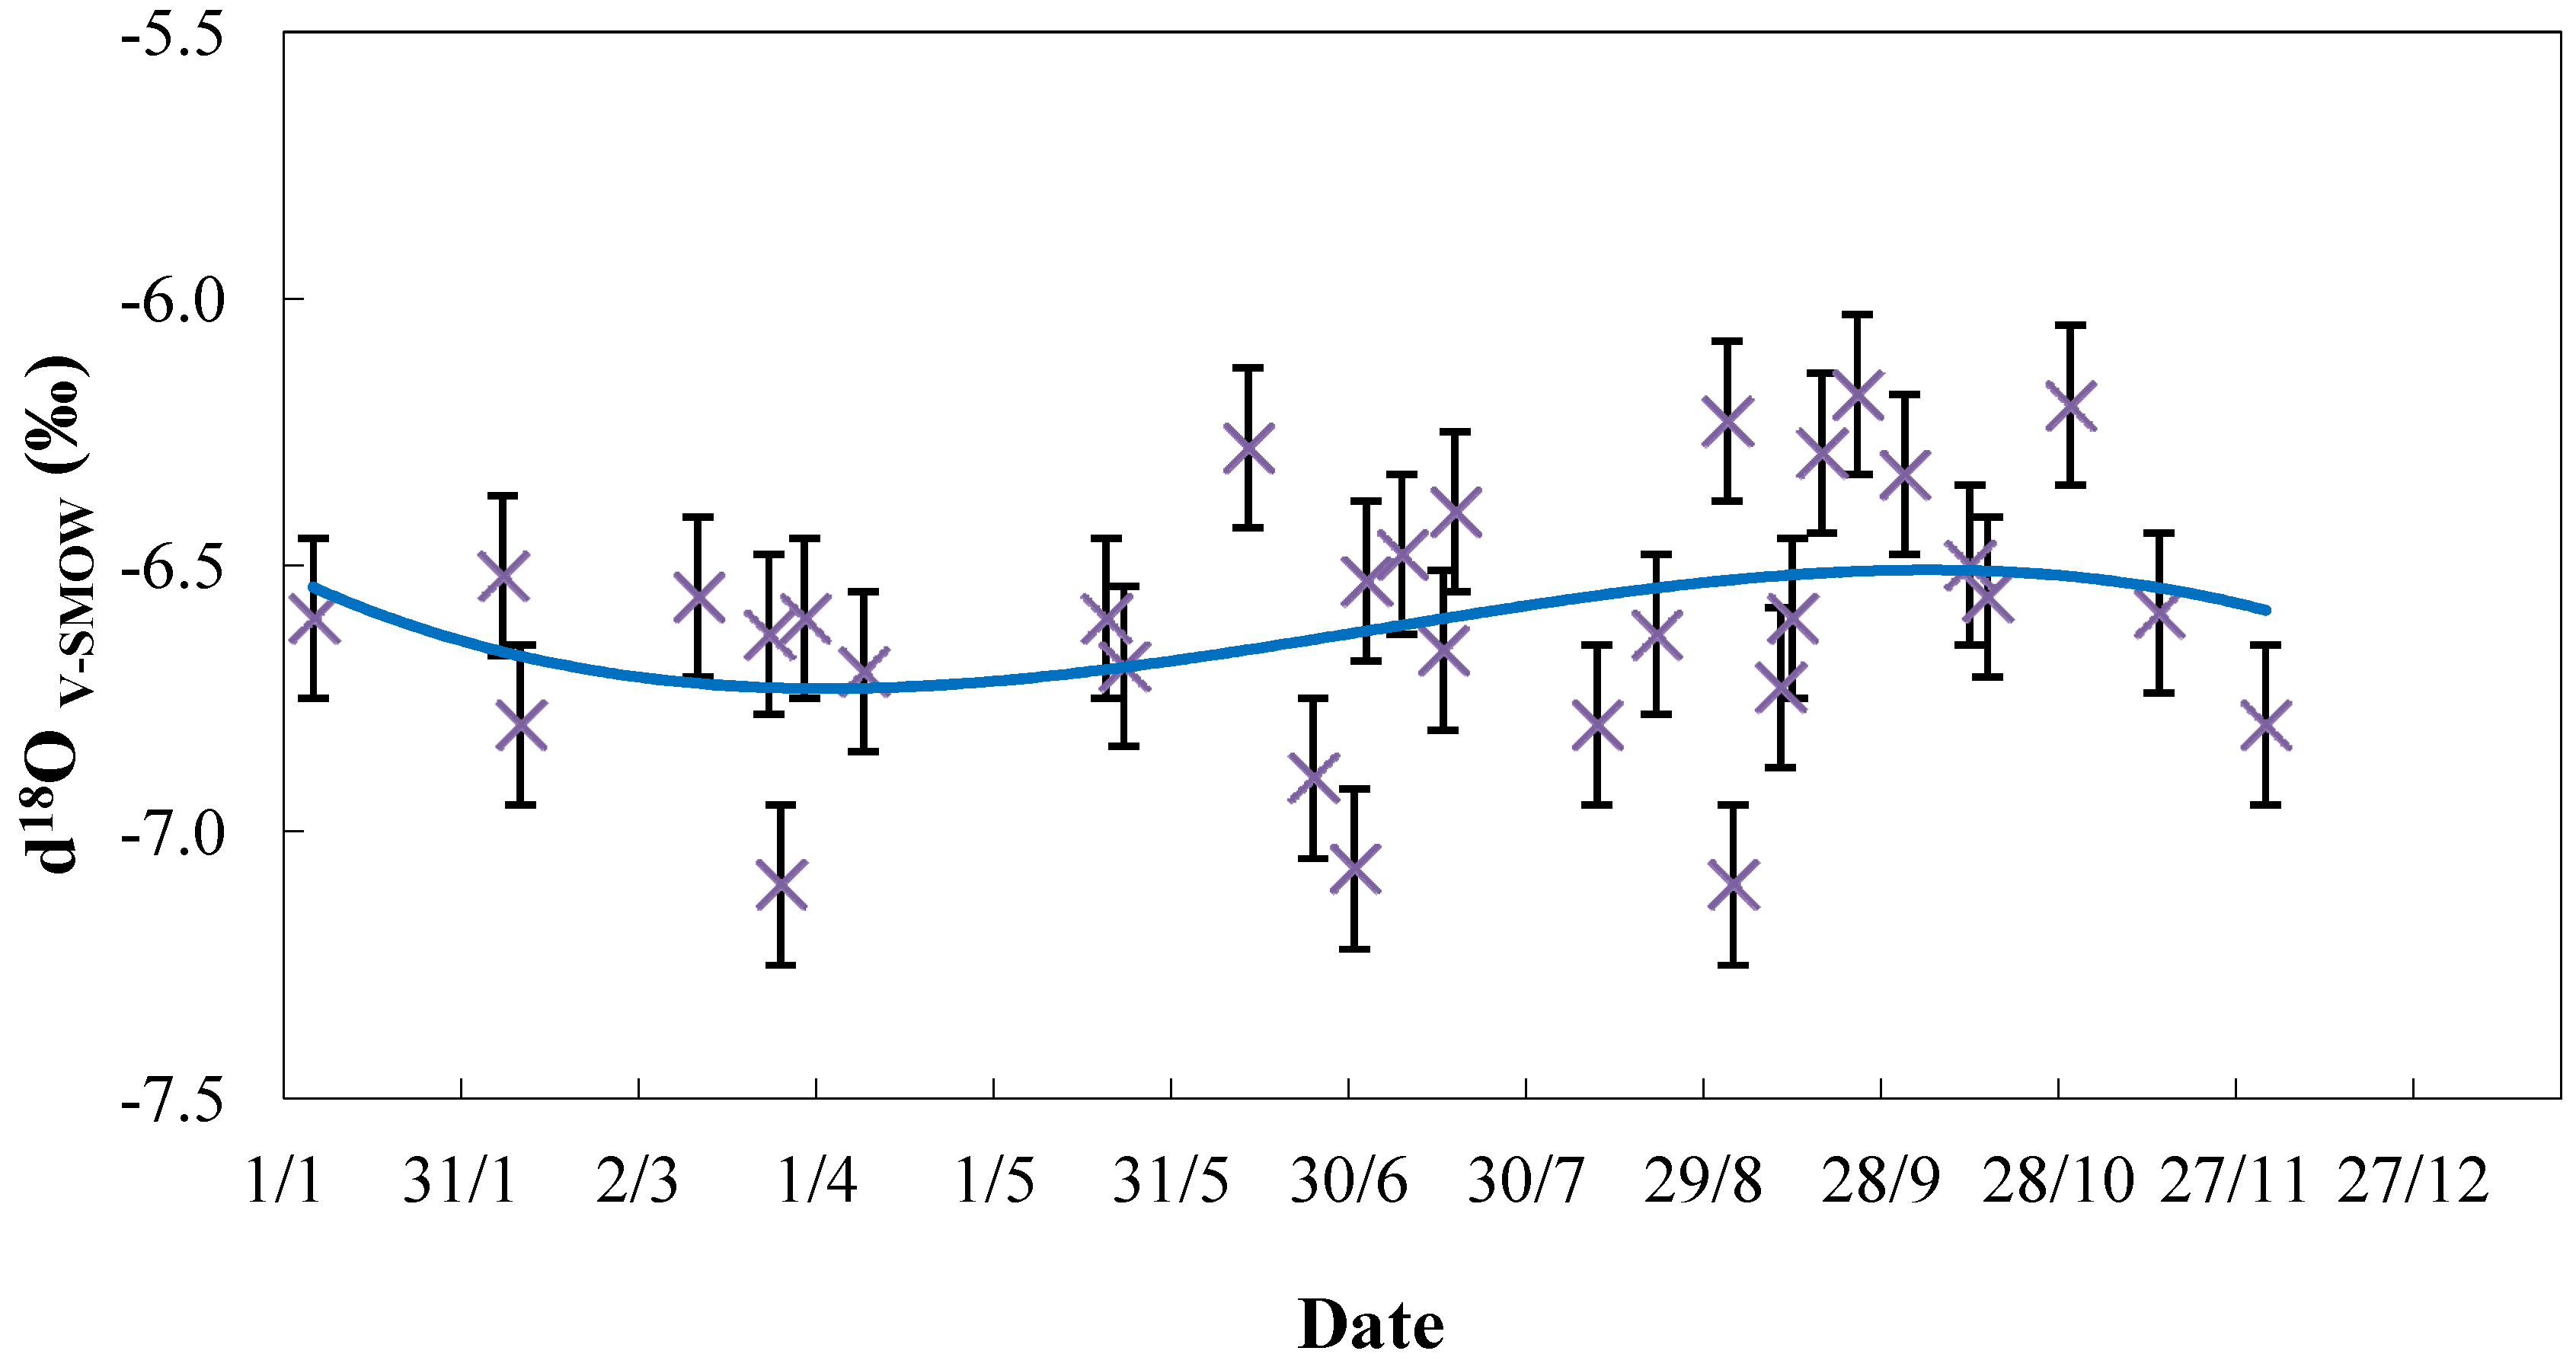
3.2.1. Reference Well

The survey of the reference well for the groundwater over six years (see Figure 4) reveals that the δ18O values range from −6.18‰ to −7.10‰.The overall mean value of δ18O= −6.60‰ ± 0.24‰ (n = 31), whereas the annual mean values range from −6.43‰ to −6.86‰. The seasonal pattern appears very reduced (Δδ18O = 0.2 units) for these 31 samples, with a slight depletion in spring. This dampened isotopic amplitude (AGW) response compared to the rainfall isotopic amplitude (Arainfall) can be used to calculate the mean residence time (tmr) according to the exponential model equation of Stichler and Herrmann [12]:
tmr= 0.5π × (Arainfall2/AGW2 − 1)0.5
This calculation gives a residence time of about five years.
Figure 4. Variation of the δ18O values of the reference groundwater well near Verdun sur Garonne (between 1997 and 2003) over the season. The solid line represents the polynomial regression line.
Water 05 00617 g004

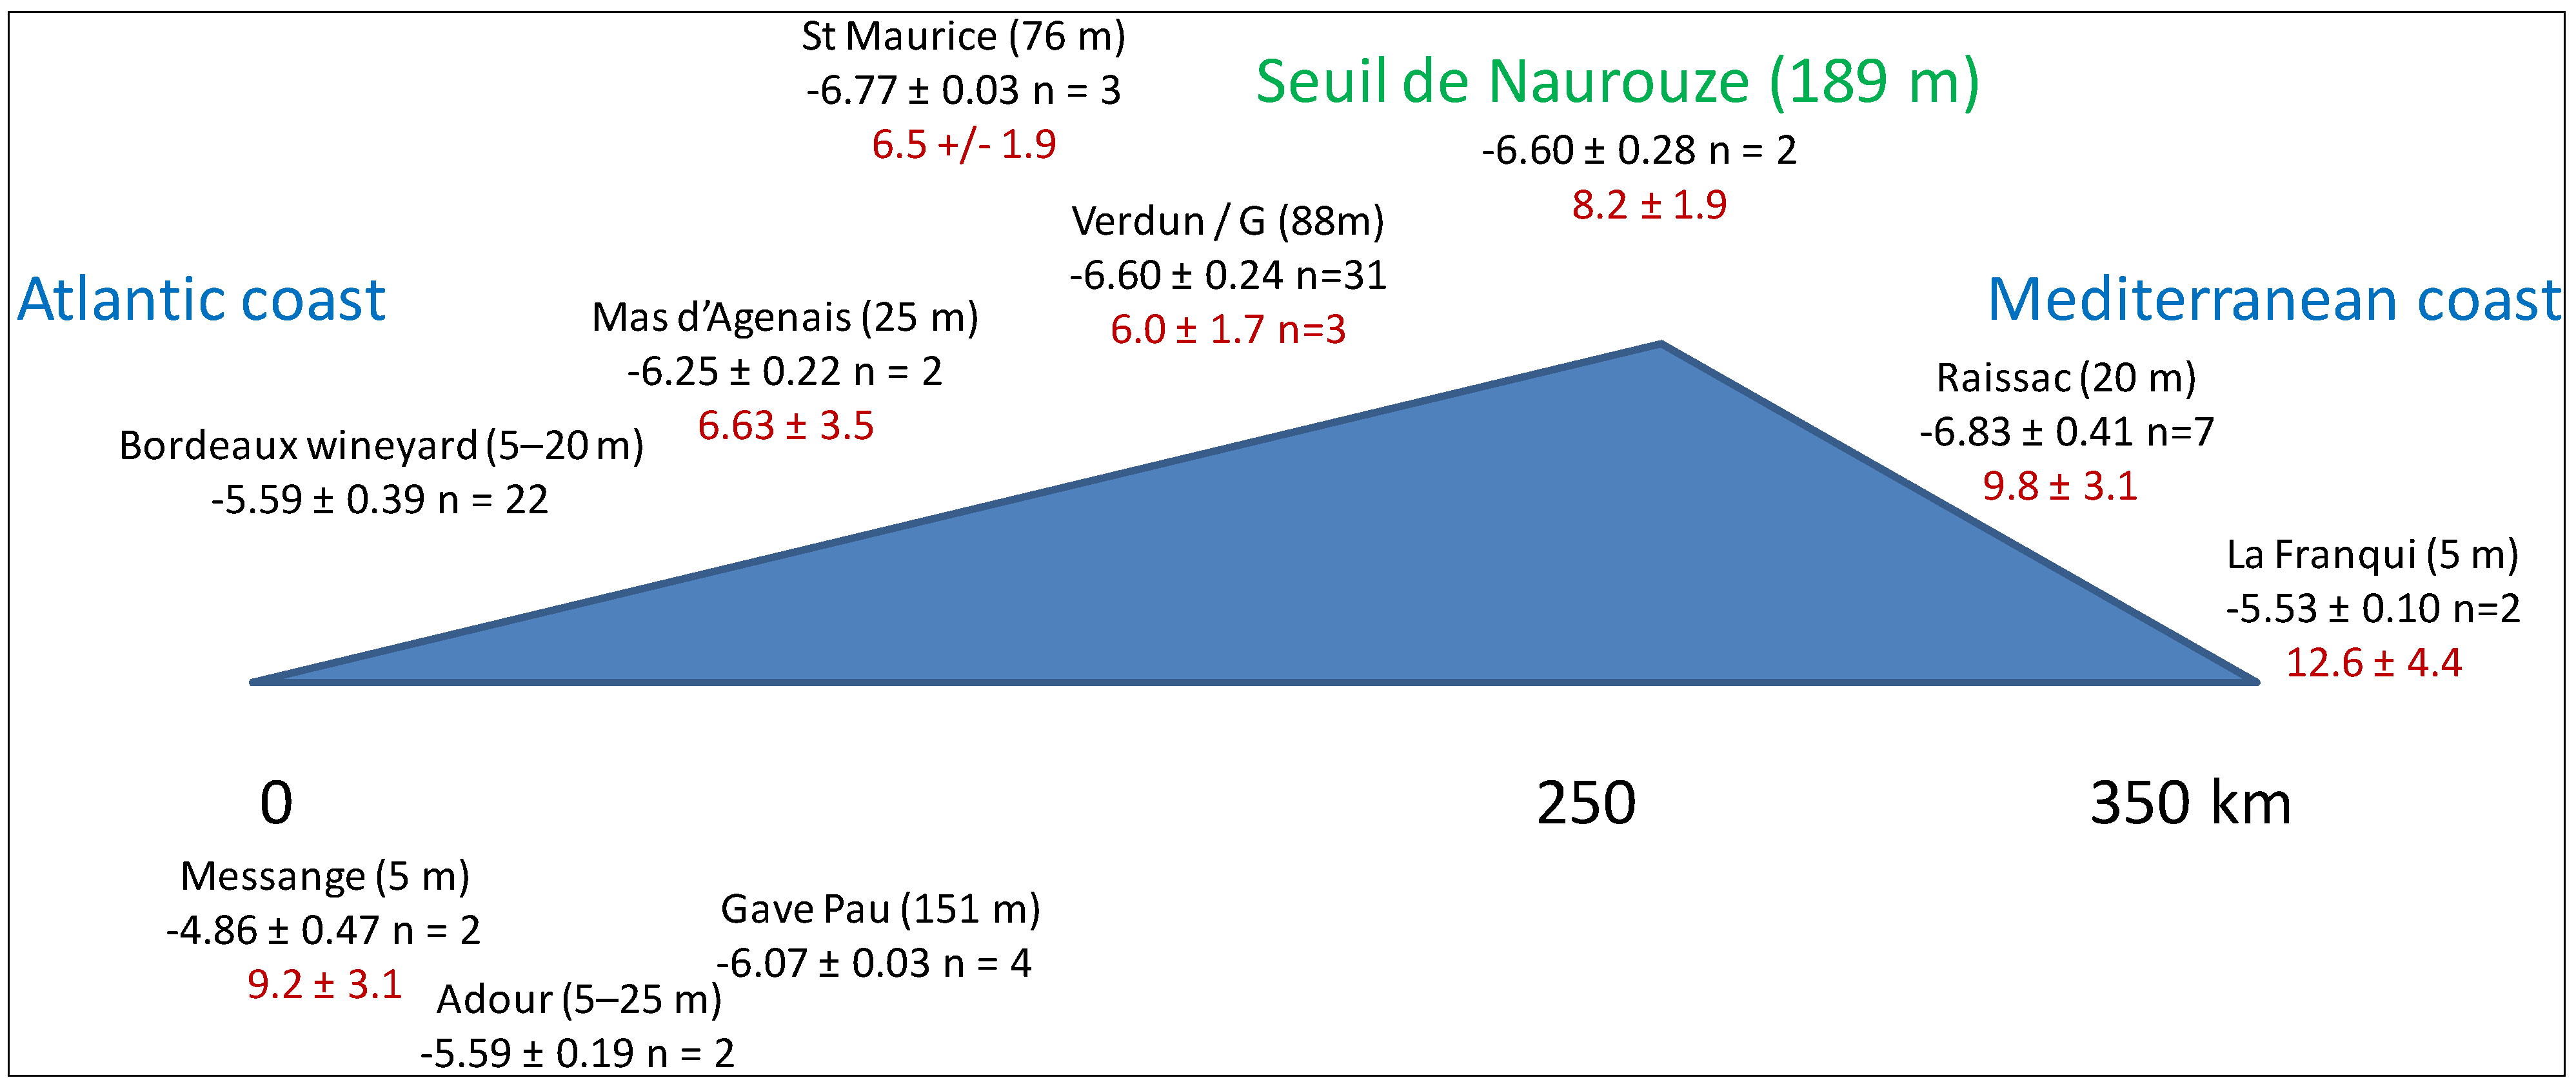
3.2.2. Groundwater between Atlantic and Mediterranean Coasts

The numerous alluvial ground water sample along the Garonne, Adour and Aude Valleys shows that there is a gradient from around δ18O = −5.0‰ close to the Atlantic coast (−4.6‰ in Dax and −5.4‰ in Bordeaux) and slowly becoming more depleted when coming more inland. At Verdun/Garonne, 50 km downstream of Toulouse, and until Seuil de Naurouze, the highest point (189 m) where the water flux divides itself between the Atlantic and the Mediterranean slope, the δ18O reaches −6.6‰. The continental effect continues on the east slope until Raissac, 25 km before the Mediterranean Sea, with a value of δ18O around −6.8‰. Along this sea coast, the isotopic values become less depleted, with δ18O value close to −5.5‰.
On the contrary, the d-excess starts close to 10 (i.e., the value of GMWL) along the Atlantic coast, before dropping inland, until Toulouse, around 6. From Seuil de Naurouze, the d-excess increases from 8.2, to 9.8 in Raissac, before reaching 12.6 at La Franqui. The Mediterranean Sea is a closed system and displays a higher d-excess value, around 14 [2]. The effect of the Mediterranean Sea through the Autan wind affects the d-excess, meaning that the water vapor recycles until Seuil de Naurouze, but the isotopic signal of the of the Continental effect coming from the Atlantic coast stops only a few ten km before reaching the Mediterranean coast, see Figure 5.
Figure 5. Continental gradient from the west Atlantic coast to east Mediterranean coast: mean isotopic values (δ18O, d-excess) for the different alluvial ground water stations along the Garonne, Adour and Aude Valleys. The altitude of the station is given between brackets.
Water 05 00617 g005

3.3. Discussion

Most shallow groundwater is of meteoric, i.e., atmospheric origin. Rainwater directly infiltrates the ground or indirectly via the inflow of surface water or from bank storage in streams [13]. Shallow and locally-derived ground waters are often used to characterize the isotopic content of meteoric waters, due to the conservative nature of the stable isotope composition of water in an aquifer [14].
Unconsolidated sediments, like in a river valley, are excellent and most efficient aquifers. Their porosity and permeability are usually high [13]. We have measured the groundwater velocity in Verdun near our reference well, and the velocity ranges from 2.1 to 3.2 m/day [15]. Such alluvial plains present high precipitation response to rainfall, and the residence time of ground water is short. In general, alluvial shallow groundwaters are known to be two to 50 years old [16]. In our case, with the equation of Stichler [12], we found a resident time of five years for our groundwater reference well.
On the contrary, deeper groundwater in the Adour-Garonne basin is characterized by more depleted values than the actual mean isotopic rainfall, with values ranging from δ18O = −5.6‰ to −10.6‰ [17]. For instance, in the Southwest of France, we found isotopic values ranging from δ18O= −7.2‰ to −7.8‰, (Lambs, unpublished results) for many tens of meters-depth bore wells. Such heterogeneity in the δ18O signature for a Paleocene aquifer reflects a variable recharge, either in space and time. The most depleted values correspond to a water recharged with a colder climate than the present one [17].
From the isotopic results around Toulouse, there is very good agreement between the Verdun groundwater annual average value (δ18Omean = −6.60‰ ± 0.25‰) and the rainfall (δ18Omean = −6.63‰ ± 1.81‰). For the calculated d-excess, there is a small shift with a mean value of d-excessmean = 6.0 ± 1.7 for the groundwater and d-excessmean = 11.8 ± 4.43 for the rainfall. Notice also that the groundwater taken at the Naurouze pass in 2010 gives similar values (δ18O = −6.80‰ ± 0.28‰, d-excess = 8.2 ± 1.9) compared to Verdun groundwater sampled between 1997 and 2003.
On a wider scale, the isotopic fractionation with the altitude is around −0.28 δ18O per mil for 100 m of elevation [2]. Along our transect, as the mean values of the groundwater around Bordeaux are δ18O = −5.6‰, at the highest point, Seuil de Naurouze (189 m), the altitude isotopic should at least be −6.2‰, but as the mean Lauragais hill is around 290 m, a correct value would be −6.5‰. Another way is to calculate the continental effect with the ratio of −3.2 δ18O per mil for 1000 km inland [5]. From the Atlantic coast at the level of Bordeaux until Seuil de Naurouze, there is 330 km, which should give a fractionation of −1.06, i.e., around −6.66‰, which is in better accordance with the measured values. If one calculates the continental fractionation until Raissac, 420 km from the Atlantic coast, the new δ18O would become −6.94‰, a value more depleted than the observed mean value of −6.83‰.
Rainfall coming from the western Mediterranean basin is known to present less depleted δ18O values, but with a higher d-excess value, around +14 [3,18]. Such an influence is seen on groundwater δ18O values of la Franqui and perhaps also in the higher d-excess of the Raissac area. Even in Toulouse, in October 2012, the abnormal d-excess of the rainfall could come from this Mediterranean inflow. In general, the Mediterranean rainfall seems to be located much closer to the coast, a few tens of kilometers wide. Only the black Autan wind, a particular case of the Autan wind blowing northwest, can bring Mediterranean moisture more inland. However, the amount of this East Mediterranean rainfall remains low compared to the West Atlantic rainfall. The Autan wind is a continental high pressure wind bringing heat and dryness and is influenced by the local orography. Even if different meteorological models try to understand this particular wind [19,20,21], it is often not announced in the weather forecast.
Table 2 reports the rainfall isotopic data available in the Global Network of Isotopes in Precipitation (GNIP) database from IAEA [22]. For Toulouse, the data is from the present work (year 2012), as there is no other data on the GNIP database. However, it is possible to get the calculated interpolated data from the area of Toulouse [23], which is δ18O = −6.2‰ ± 0.3‰. This value is a little less than our mean value (δ18Omean = −6.6‰ ± 1.8‰), but equal to our weighted mean: δ18Ow-mean = −6.32‰ ± 0.25‰. For the slope between the δ18O and δD values, only Toulouse presents a value close to the GMWL (respectively, 7.70 and 8.00). All the other places on both coasts display a lower slope, due to a smaller δ18O. It is not necessarily a problem of coastal influence or the evaporation process. In fact, the GMWL as a global line is made of many small local lines with slopes that are often smaller than eight. There is a good correspondence between the calculated δ18O weighted mean of Bordeaux (in fact, Cestas-Pierroton) and our mean groundwater of this area (respectively, −5.69‰ and −5.59‰) and also the calculated δ18O weighted mean of Dax and our mean groundwater of this area (respectively, −4.59‰ and −4.86‰). With these δ18O weighted means, the continental effect from west to east between Bordeaux and Toulouse is around one unit and the latitude effect between Bordeaux and Dax, also one unit of δ18O. One can also notice the equivalent of δ18O weight mean values of Dax and Montpellier (respectively, −4.59‰ and −4.17‰), nearly on the same latitude, but on a different sea coast. The calculated weighted d-excess mean is always high, i.e., between nine and 12, and only in Avignon, it drops at around eight.
The study of the West Mediterranean influence is complex, as it is a transition zone between the cool North Atlantic air masses and the warm and wet air flowing from the Mediterranean basin. The isotopic signal of the air masses from these different origins crossing the Mediterranean may be modified by water vapor produced in the Mediterranean [3]. The d-excess value of the water vapor of the Mediterranean region results from the intensive evaporation near the coast, under conditions of a large humidity deficit [24]. All these particular features from the Mediterranean water vapor reveal the importance of the study to understand the local climate by monitoring numerous and long-term rainfall and groundwater sampling.
Table 2. Comparison of the isotopic features of the GNIP stations and our Toulouse station.
CitySloped-excessR2δ18Ow meand-excesswδ18O rangeRainfallYear
(‰)(‰)(mm)
Dax6.090.320.948−4.59 ± 0.959.71 ± 1.24−6.84–−2.2511561999–2005
Bordeaux6.903.900.925−5.69 ± 0.6510.18 ± 0.32−7.16–−4.339202007–2009
Toulouse7.709.860.909−6.32 ± 0.2511.76 ± 0.59−10.71–−4.005482012
Montpellier6.493.070.825−4.17 ± 0.149.07 ± 2.07−6.65–−1.795951997–1998
Avignon7.192.310.984−5.49 ± 1.207.39 ± 2.95−7.83–−2.236191997–2009

4. Conclusions

The present study is the first one to provided isotopic rainfall data for the Toulouse area in connection with numerous alluvial groundwater sampling over the Southwest of France. These results reveal that this area is influenced by both the Atlantic and the Mediterranean climate, but also, a continental effect is perceptible through the wide isotopic range. The Mediterranean influence is mainly brought by the Autan wind, but the isotopic composition of the groundwater is only influenced closer to a few tens of kilometers from the Mediterranean shore. Only some d-excess higher value can reveal it. More sampling of rainfall at the month scale still needs to be done for this area to better understand this specific climate. Furthermore, sampling of individual special rain events, like after the Autan wind, is now also performed for trying to refine these possible Mediterranean moisture inflows.

Acknowledgments

We would like to thank Florent Barbecot (University of Paris Sud) and Stephan Terzer (IAEA, Vienna) for their advice for the rainfall isotope sampling, Romain Walker (Ecolab) for Figure 1 and Daniel Dalger (Ecolab) for help with the isotopic analysis. For the meteorological data, we are grateful to Pierre Perrin (INRA Auzeville) and Meteofrance (Blagnac airport), and for the two anonymous reviewers for their valuables comments.

References

  1. Rozanski, K.; Araguas-Araguas, L.; Gonfiantini, R. Isotopic patterns in modern global precipitation. In Climate Change in Continental Isotopic Records; Geophysical Monograph Series Volume 78; Swart, P.K., Lohmann, K.C., Mckenzie, J., Savin, S., Eds.; American Geophysical Union: Washington, DC, USA, 1993; pp. 1–36. [Google Scholar]
  2. Celle, H.; Daniel, M.; Mudry, J.; Blavoux, B. Signal pluie et traçage par les isotopes stables en Méditerranée occidentale: Exemple de la région avignonnaise (Sud-Est de la France) [in French]. C. R. d’Acad. Sci. Ser. IIA Earth Planet. Sci. 2000, 331, 647–650. [Google Scholar]
  3. Celle-Jeanton, H.; Travi, Y.; Blavoux, B. Isotopic typology of the precipitation in the Western Mediterranean region at three different time scales. Geophys. Res. Lett. 2001, 28, 1215–1218. [Google Scholar] [CrossRef]
  4. Ladouche, B.; Aquilina, L.; Dörfliger, N. Chemical and isotopic investigation of rainwater in Southern France (1996–2002): Potential use as input signal for karst functioning investigation. J. Hydrol. 2009, 367, 150–164. [Google Scholar] [CrossRef]
  5. Millot, R.; Petelet-Giraud, E.; Guerrot, C.; Négrel, Ph. Multi-isotopic composition (Li, B, D, O) of rainwaters in France: Origin and spatio-temporal characteristization. Appl. Geochem. 2010, 25, 1510–1524. [Google Scholar] [CrossRef]
  6. Howard, A.D.; Dietrich, W.E.; Seidl, M.A. Modeling fluvial erosion on regional to continental scales. J. Geophys. Res. Solid Earth 1994, 99, 13971–13986. [Google Scholar] [CrossRef]
  7. Lambs, L. Correlation of conductivity and stable isotope 18O for the assessment of water origin in river system. Chem. Geol. 2000, 164, 161–170. [Google Scholar] [CrossRef]
  8. Lambs, L. Interactions between groundwater and surface water at river banks and the confluence of rivers. J. Hydrol. 2004, 288, 312–326. [Google Scholar] [CrossRef] [Green Version]
  9. Craig, H. Isotopic variation in meteoric waters. Science 1961, 133, 1702–1703. [Google Scholar]
  10. Dansgaard, W. Stable isotopes in precipitation. Tellus 1964, 16, 436–468. [Google Scholar] [CrossRef]
  11. Word Meteorological Organization (WMO), Climatological Normals (CLINO) for the Period 1961–1990; Secretariat of the Word Meteorological Organization: Geneva, Switzerland, 1996.
  12. Stichler, W.; Herrmann, A. Application of Environmental Isotope Techniques in Water Balance Studies of Small Basins. In New Approaches in Water Balance Computations, Proceedings of the 18th General Assembly of the International Union of Geodesy and Geophysics, Hamburg, Germany, August 1983; IAHS Publication 148: Oxfordshire, UK; pp. 93–112.
  13. Geyh, M. Groundwater. In Environmental Isotopes in the Hydrological Cycle; Mook, W.G., Ed.; International Hydrological Programme: Paris, France; International Atomic Energy Agency: Vienna, Austria, 2000; Volume 4, pp. 1–193. [Google Scholar]
  14. Longinelli, A.; Selmo, E. Isotope geochemistry and the water cycle: A short review with special emphasis on Italy. Mem. Descr. Carta Geol. d’It. 2010, 90, 153–164. [Google Scholar]
  15. Bats-Landalle, G. Analyse Géomorphologique de la Plaine d’Inondation de la Garonne [in French]. Ph.D. Thesis, University of Toulouse, Toulouse, France, September 1998. [Google Scholar]
  16. Weisman, G.S.; Zhang, Y.; LaBolle, E.M.; Fogg, G.E. Dispersion of groundwater age in an alluvial aquifer system. Water Resour. Res. 2002, 38, 1–13. [Google Scholar]
  17. Negrel, Ph.; Petelet-Giraud, E. Isotopes in groundwater: Indicators of climate changes. Trends Anal. Chem. 2011, 30, 1279–1290. [Google Scholar] [CrossRef]
  18. Gat, J.R.; Carmi, I. Effect of Climate Changes on the Precipitation Patterns and Isotopic Composition of Water in a Climatic Transition Zone: Case of the Eastern Mediterranean Sea Area. In The Influence of Climate Change and Climatic Variability on the Hydrologic Regime and Water Resources, Proceedings of the Vancouver Symposium, Vancouver, Canada, 9–22 August 1987; IAHS Publication 168: Oxfordshire, UK; pp. 513–523.
  19. Von der Emde, K.; Bougeault, Ph. High resolution simulation of a flow past the Pyrenees. Meteorol. Atmos. Phys. 1997, 62, 1–8. [Google Scholar] [CrossRef]
  20. Benech, B.; Koffi, E.; Druilhet, A.; Durand, P. Dynamic characteristics of regional flows around the Pyrenees in view of the Pyrex experiment. J. Appl. Meteorol. 1998, 37, 32–51. [Google Scholar] [CrossRef]
  21. Aouzerats, B.; Tulet, P.; Pigean, G.; Masson, V.; Gomes, L. High resolution modeling of aerosol dispersion regimes during the Capitoul field experiment: From regional to local scale interactions. Atmos. Chem. Phys. Discuss. 2010, 10, 29569–29598. [Google Scholar] [CrossRef]
  22. International Atomic Energy Agency Web Page. International Atomic Energy Agency Web Page. Global Network of Isotopes in Precipitation. Available online: http://www-naweb.iaea.org/napc/ih/IHS_resources_gnip.html (accessed on 9 May 2013).
  23. Bowen, G.J. The Online Isotopes in Precipitation Calculator, Version 2.2; Available online: http://www.waterisotopes.org (accessed on 13 May 2013).
  24. Gat, J.R.; Klein, B.; Kushnir, Y.; Roether, W.; Wernli, H.; Yam, R.; Shemesh, A. Isotope composition of air moisture over the Mediterranean Sea: An index of the air-sea interaction pattern. Tellus 2003, 55, 953–965. [Google Scholar]

