<?xml version="1.0" encoding="UTF-8"?>
<!DOCTYPE article PUBLIC "-//NLM//DTD Journal Publishing DTD v2.3 20070202//EN" "journalpublishing.dtd">
<article xmlns:mml="http://www.w3.org/1998/Math/MathML" xmlns:xlink="http://www.w3.org/1999/xlink" xml:lang="en" article-type="research-article">
  <front>
    <journal-meta>
      <journal-id journal-id-type="publisher-id">water</journal-id>
      <journal-title>Water</journal-title>
      <abbrev-journal-title abbrev-type="publisher">Water</abbrev-journal-title>
      <abbrev-journal-title abbrev-type="pubmed">water</abbrev-journal-title>
      <issn pub-type="epub">2073-4441</issn>
      <publisher>
        <publisher-name>MDPI</publisher-name>
      </publisher>
    </journal-meta>
    <article-meta>
      <article-id pub-id-type="doi">10.3390/w4040869</article-id>
      <article-id pub-id-type="publisher-id">water-04-00869</article-id>
      <article-categories>
        <subj-group>
          <subject>Article</subject>
        </subj-group>
      </article-categories>
      <title-group>
        <article-title>A Simple Scheme for Modeling Irrigation Water Requirements at the Regional Scale Applied to an Alpine River Catchment</article-title>
      </title-group>
      <contrib-group>
        <contrib contrib-type="author">
          <name>
            <surname>Smith</surname>
            <given-names>Pascalle C.</given-names>
          </name>
          <xref rid="c1-water-04-00869" ref-type="corresp">*</xref>
        </contrib>
        <contrib contrib-type="author">
          <name>
            <surname>Calanca</surname>
            <given-names>Pierluigi</given-names>
          </name>
        </contrib>
        <contrib contrib-type="author">
          <name>
            <surname>Fuhrer</surname>
            <given-names>Jürg</given-names>
          </name>
        </contrib>
      </contrib-group>
      <aff id="af1-water-04-00869">Air Pollution and Climate Group, Agroscope Research Station, Reckenholzstrasse 191, CH-8046 Zürich, Switzerland; Email: <email>pierluigi.calanca@art.admin.ch</email> (P.C.); <email>juerg.fuhrer@art.admin.ch</email> (J.F.)</aff>
      <author-notes>
        <corresp id="c1-water-04-00869"><label>*</label> Author  to whom correspondence should be addressed; Email: <email>pascalle.smith@art.admin.ch</email>; Tel.: +41-44-377-7516; Fax: +41-44-377-7201.</corresp>
      </author-notes>
      <pub-date pub-type="epub">
        <day>07</day>
        <month>11</month>
        <year>2012</year>
      </pub-date>
      <pub-date pub-type="collection"><month>12</month>
        <year>2012</year>
      </pub-date>
      <volume>4</volume>
      <issue>4</issue>
      <fpage>869</fpage>
      <lpage>886</lpage>
      <history>
        <date date-type="received">
          <day>11</day>
          <month>09</month>
          <year>2012</year>
        </date>
        <date date-type="rev-recd">
          <day>31</day>
          <month>10</month>
          <year>2012</year>
        </date>
        <date date-type="accepted">
          <day>01</day>
          <month>11</month>
          <year>2012</year>
        </date>
      </history>
      <permissions>
        <copyright-statement>©  2012 by the authors; licensee MDPI, Basel, Switzerland.</copyright-statement>
        <copyright-year>2012</copyright-year>
        <license xmlns:xlink="http://www.w3.org/1999/xlink" license-type="open-access" xlink:href="http://creativecommons.org/licenses/by/3.0/">
          <p>This article is an open-access article distributed under the terms and conditions of the Creative Commons Attribution license (http://creativecommons.org/licenses/by/3.0/).</p>
        </license>
      </permissions>
      <abstract>
        <p>This paper presents a simple approach for estimating the spatial and temporal variability of seasonal net irrigation water requirement (IWR) at the catchment scale, based on gridded land use, soil and daily weather data at 500 × 500 m resolution. In this approach, IWR is expressed as a bounded, linear function of the atmospheric water budget, whereby the latter is defined as the difference between seasonal precipitation and reference evapotranspiration. To account for the effects of soil and crop properties on the soil water balance, the coefficients of the linear relation are expressed as a function of the soil water holding capacity and the so-called crop coefficient. The 12 parameters defining the relation were estimated with good coefficients of determination from a systematic analysis of simulations performed at daily time step with a FAO-type point-scale model for five climatically contrasted sites around the River Rhone and for combinations of six crop and ten soil types. The simple scheme was found to reproduce well results obtained with the daily model at six additional verification sites. We applied the simple scheme to the assessment of irrigation requirements in the whole Swiss Rhone catchment. The results suggest seasonal requirements of 32 × 10<sup>6 </sup>m<sup>3</sup> per year on average over 1981–2009, half of which at altitudes above 1500 m. They also disclose a positive trend in the intensity of extreme events over the study period, with an estimated total IWR of 55 × 10<sup>6 </sup>m<sup>3</sup> in 2009, and indicate a 45% increase in water demand of grasslands during the 2003 European heat wave in the driest area of the studied catchment. In view of its simplicity, the approach can be extended to other applications, including assessments of the impacts of climate and land-use change.</p>
      </abstract>
      <kwd-group>
        <kwd>Swiss Rhone catchment</kwd>
        <kwd>agriculture</kwd>
        <kwd>irrigation</kwd>
        <kwd>climate</kwd>
        <kwd>statistical modeling </kwd>
      </kwd-group>
    </article-meta>
  </front>
  <body>
    <sec sec-type="intro">
      <title>1. Introduction</title>
      <p>Water scarcity is considered, along with climate change, as one of the most pressing environmental issues of the 21st century [<xref ref-type="bibr" rid="B1-water-04-00869">1</xref>]. Agriculture is greatly concerned with water shortage, and in areas characterized by arid or semi-arid climates, irrigation is often the only option to secure productivity. Currently, irrigation is practiced on less than one fourth of the cropping area but it supports about 50% of the world food production. About 67% of the global water withdrawal is related to agricultural production, and 87% of the consumptive water is for irrigation purposes [<xref ref-type="bibr" rid="B2-water-04-00869">2</xref>].</p>
      <p>In view of an ever growing world population and projected shifts in precipitation patterns, which are likely to entail an increasing incidence of droughts in continental areas, it is expected that irrigation demand will increase in the future [<xref ref-type="bibr" rid="B3-water-04-00869">3</xref>,<xref ref-type="bibr" rid="B4-water-04-00869">4</xref>]. Clearly, only a judicious choice of irrigation strategies, based on quantitative estimates of the water requirements, will allow sustainable use of water resources. Unfortunately, for many countries and regions of the world, even the extent of today’s irrigated areas and water use is poorly known.</p>
      <p>To fill this gap, various initiatives have been put into action in recent years to estimate irrigation water use with the help of statistical tools and simulation models. Outcomes of these initiatives are e.g., the Global Irrigated Area Map [<xref ref-type="bibr" rid="B5-water-04-00869">5</xref>], the Global Map of Irrigated Areas (GMIA) [<xref ref-type="bibr" rid="B6-water-04-00869">6</xref>], the European Irrigation Map (EIM) [<xref ref-type="bibr" rid="B3-water-04-00869">3</xref>] the global assessment of irrigation requirements [<xref ref-type="bibr" rid="B7-water-04-00869">7</xref>] and the regional assessment of IWR in Europe (IWRE) [<xref ref-type="bibr" rid="B8-water-04-00869">8</xref>]. While these products represent significant advances in the appraisal of water needs at the global or continental scale, their utility for planning purposes and in support of the adaptation process at the local to regional scale is still limited [<xref ref-type="bibr" rid="B3-water-04-00869">3</xref>,<xref ref-type="bibr" rid="B7-water-04-00869">7</xref>,<xref ref-type="bibr" rid="B8-water-04-00869">8</xref>]. This is particularly the case in mountain areas, where due to complex topographic and rainfall patterns, along with a heterogeneous distribution of soils, vegetation types and agricultural practices, better resolved information is required. Complex distributed hydrological models can be used at this scale, although their high data demand is often difficult to meet.</p>
      <p>Given these practical limitations of large-scale and complex hydrological models, the goal of the present work was to develop a simple modeling tool for quantifying the net irrigation water requirement, IWR, at the catchment scale with high spatial resolution. Net IWR is defined as the amount of water needed to reach an optimum or pre-defined level of crop productivity, without considering the efficiency of the water application system [<xref ref-type="bibr" rid="B7-water-04-00869">7</xref>].</p>
      <p>The proposed modeling approach relates seasonal net IWR to an integral measure of the atmospheric water budget, taking into account soil and crop characteristics. For the development, calibration and verification of this relation, an algorithm for computing crop and soil specific irrigation water requirements at the local scale and daily time step was needed. We relied on the methodology of the Food and Agriculture Organization of the United Nations (FAO) [<xref ref-type="bibr" rid="B9-water-04-00869">9</xref>], but simulated dynamically growing season length, leaf area index, and seasonal evolution of the crop coefficient.</p>
      <p>The proposed relation was used to assess IWR in the Swiss part of the Rhone catchment where grassland, cropland, orchards and vineyards dominate the non-forested landscape. The latter is one of the target areas of the EU-FP7 project ACQWA [<xref ref-type="bibr" rid="B10-water-04-00869">10</xref>], which aims at using advanced modeling techniques to quantify the influence of climatic change on the major determinants of the water cycle in mountain regions at various temporal and spatial scales. Similar calculations were performed as part of a virtual water and footprint analysis in the driest mountain catchment of Canada, the Okanagan Basin, where fruit trees and grapevines are cultivated and the total irrigated area is comparable to that of the Swiss Rhone catchment [<xref ref-type="bibr" rid="B11-water-04-00869">11</xref>].</p>
      <p>The present study supplements a recent effort to quantify irrigation water demand in Switzerland on the basis of simulations with a distributed hydrological model [<xref ref-type="bibr" rid="B12-water-04-00869">12</xref>]. In [<xref ref-type="bibr" rid="B12-water-04-00869">12</xref>], the Rhone catchment was identified among six basins as the one exhibiting the largest inter-annual variability of irrigation depth (<italic>i.e.</italic>, irrigation requirement per unit of irrigated area) for cropland, and highest median for both cropland and grassland. In 2006, a survey performed by the Federal Department of Agriculture [<xref ref-type="bibr" rid="B13-water-04-00869">13</xref>] reported that the water used in this region represents the largest fraction of the 144 × 10<sup>6 </sup>m<sup>3 </sup>water used per year in Swiss agriculture, and about half of the country’s 550 km<sup>2</sup> irrigated area.</p>
    </sec>
    <sec>
      <title>2. Study Region</title>
      <sec id="sec2dot1-water-04-00869">
        <title>
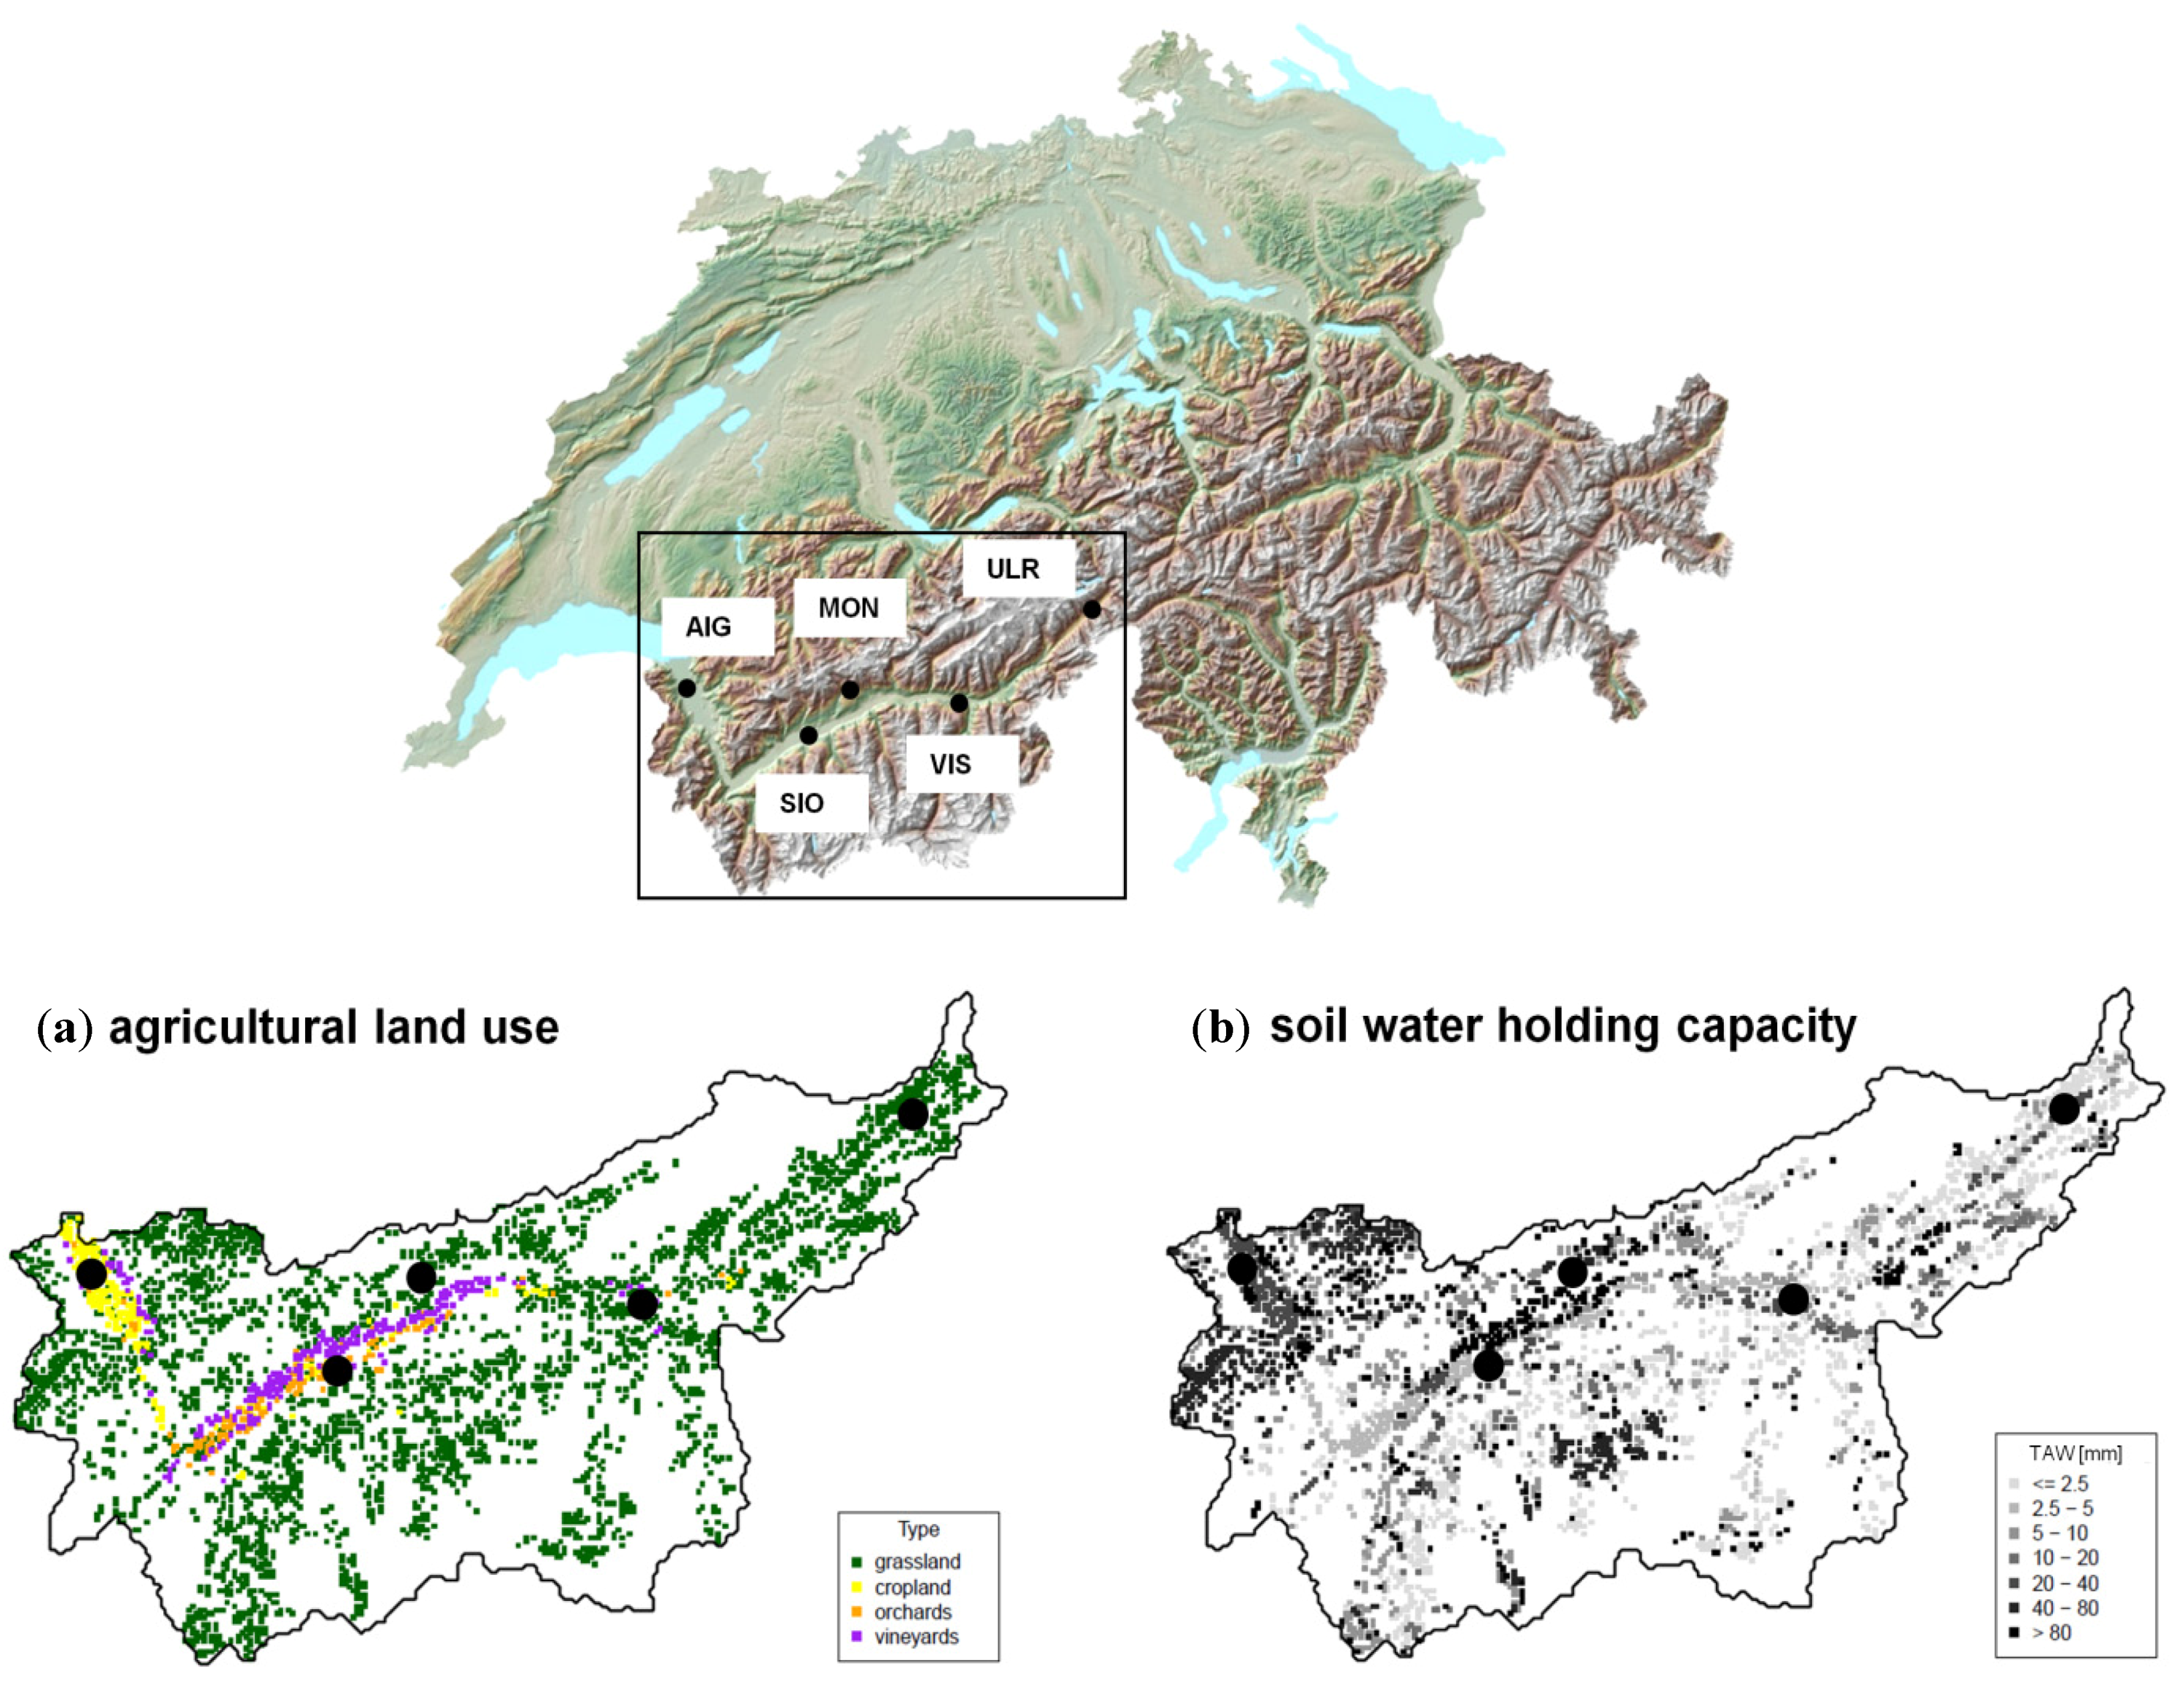
2.1. Characteristics</title>
        <p>River Rhone originates from the Rhone glacier in Switzerland and reaches the Mediterranean Sea in South-eastern France. Of the total discharge of the river Rhone 41% come from the Alps, which is disproportionally high relative to the areal proportion of the Alpine region [<xref ref-type="bibr" rid="B14-water-04-00869">14</xref>]. The upper part of the catchment of the river Rhone, down to the lake of Geneva, is located in Switzerland and covers 5250 km<sup>2</sup> of land. 11.5% of this part of the catchment area are currently glaciated, a proportion expected to reach nearly zero by the end of the century [<xref ref-type="bibr" rid="B15-water-04-00869">15</xref>]. The contribution of glacier storage change to the August runoff over the last century was &gt;40% and nearly 80% in the extreme year 2003 [<xref ref-type="bibr" rid="B15-water-04-00869">15</xref>]. The study region encompasses nearly the whole Canton of Valais (<xref ref-type="fig" rid="water-04-00869-f001">Figure 1</xref>). The topography is very heterogeneous, ranging in elevation from 372 m above sea level (a.s.l.) at the Lake of Geneva to 4634 m a.s.l. at the so-called ‘Dufour-Spitze’. Annual temperature and precipitation exhibit strong vertical gradients as well as variations along the main valley axis. The climate is further characterized by high radiation and low levels of air humidity.</p>
        <p>Compared to the 1000 mm of average annual precipitation recorded on the Swiss Plateau (1961–1990, [<xref ref-type="bibr" rid="B16-water-04-00869">16</xref>]), annual precipitation amounts in the eastern part of the Rhone valley are low, hardly attaining 600 mm (e.g., station Visp, <xref ref-type="fig" rid="water-04-00869-f001">Figure 1</xref>). Of this, only about 250 mm fall between April and September (about 300 mm when considering the period 1981–2009, <xref ref-type="table" rid="water-04-00869-t001">Table 1</xref>) when evaporative demand reaches 10 mm day<sup>−1</sup> during summer. Thus, the climate in the main agricultural area can be considered semi-arid.</p>
        <p>About one fifth of the area (980 km<sup>2</sup>) is used for agriculture (<xref ref-type="fig" rid="water-04-00869-f001">Figure 1</xref>a), with grasslands and pasture representing by far the largest share (833 km<sup>2</sup>) [<xref ref-type="bibr" rid="B17-water-04-00869">17</xref>]. The most important activities from an economic perspective are those related to the cultivation of special crops. Grapevine is grown on the South facing slopes along the Rhone to the East and West of Sion, whereas fruit trees are more protected from frost during critical phases on the North facing slopes and on the flat valley bottom [<xref ref-type="bibr" rid="B18-water-04-00869">18</xref>]. Arable crops, such as maize, benefit from the deeper soils and a less dry climate in the area close the outlet of the catchment. Otherwise, soils are shallow, with a total water holding capacity (TAW) of less than 20 mm (<xref ref-type="fig" rid="water-04-00869-f001">Figure 1</xref>b).</p>
        <fig id="water-04-00869-f001" position="anchor">
          <label>Figure 1</label>
          <caption>
            <p>(<bold>Top</bold>) Map of Switzerland showing the location of the Canton Valais, Rhone catchment and the five sites selected for the modeling tool calibration. Coordinates and acronyms of the latter are given in <xref ref-type="table" rid="water-04-00869-t001">Table 1</xref>; (<bold>Bottom</bold>) (<bold>a</bold>) Agricultural land use type; (<bold>b</bold>) Water holding capacity of the soil (TAW).</p>
          </caption>
          <graphic xmlns:xlink="http://www.w3.org/1999/xlink" xlink:href="water-04-00869-g001.tif"/>
        </fig>
        <table-wrap id="water-04-00869-t001" position="float">
          <object-id pub-id-type="pii">water-04-00869-t001_Table 1</object-id>
          <label>Table 1</label>
          <caption>
            <p>Location, elevation and climate of the five sites selected for the estimation of the daily irrigation requirements over 1981-2009. The sites are: Aigle (AIG), Sion (SIO), Visp (VIS), Montana (MON) and Ulrichen (ULR) (see also <xref ref-type="fig" rid="water-04-00869-f001">Figure 1</xref>).</p>
          </caption>
          <table>
            <thead>
              <tr>
                <th align="center" valign="middle">Site</th>
                <th align="center" valign="middle">Long./Lat.</th>
                <th align="center" valign="middle">Elevation (m a.s.l.)</th>
                <th align="center" valign="middle">April-September air temperature (°C)</th>
                <th align="center" valign="middle">April-September precipitation (mm)</th>
              </tr>
            </thead>
            <tbody>
              <tr>
                <td align="center" valign="middle">AIG</td>
                <td align="center" valign="middle">6.9 E/46.3 N</td>
                <td align="center" valign="middle">382</td>
                <td align="center" valign="middle">14.8</td>
                <td align="center" valign="middle">747</td>
              </tr>
              <tr>
                <td align="center" valign="middle">SIO</td>
                <td align="center" valign="middle">7.3 E/46.2 N</td>
                <td align="center" valign="middle">481</td>
                <td align="center" valign="middle">16.1</td>
                <td align="center" valign="middle">489</td>
              </tr>
              <tr>
                <td align="center" valign="middle">VIS</td>
                <td align="center" valign="middle">7.8 E/46.3 N</td>
                <td align="center" valign="middle">639</td>
                <td align="center" valign="middle">15.4</td>
                <td align="center" valign="middle">314</td>
              </tr>
              <tr>
                <td align="center" valign="middle">MON</td>
                <td align="center" valign="middle">7.5 E/46.3 N</td>
                <td align="center" valign="middle">1431</td>
                <td align="center" valign="middle">10.8</td>
                <td align="center" valign="middle">589</td>
              </tr>
              <tr>
                <td align="center" valign="middle">ULR</td>
                <td align="center" valign="middle">8.3 E/46.5 N</td>
                <td align="center" valign="middle">1395</td>
                <td align="center" valign="middle">10.4</td>
                <td align="center" valign="middle">624</td>
              </tr>
            </tbody>
          </table>
        </table-wrap>
      </sec>
      <sec id="sec2dot2-water-04-00869">
        <title>2.2. Current Irrigation Estimates</title>
        <p>Irrigation channels have been in place since the 13th century, mainly in the area between Sion and Visp, deviating streams to give pastures, fields, vineyards and orchards access to the locally missing water. While snow melt peaks in July, ice melt peaks in August, both contributing to the runoff [<xref ref-type="bibr" rid="B15-water-04-00869">15</xref>]. The total amount of water withdrawn for irrigation has been estimated in [<xref ref-type="bibr" rid="B13-water-04-00869">13</xref>] as 97 × 10<sup>6 </sup>m<sup>3 </sup>yr<sup>−1</sup>, of which 86.5 × 10<sup>6 </sup>m<sup>3 </sup>yr<sup>−1</sup> are supplied to the fields through open channel systems.</p>
        <p>The study area appears as a local irrigation hotspot in the GMIA [<xref ref-type="bibr" rid="B6-water-04-00869">6</xref>], the EIM [<xref ref-type="bibr" rid="B3-water-04-00869">3</xref>], and the IWRE [<xref ref-type="bibr" rid="B8-water-04-00869">8</xref>]. The share of irrigated land as given in the GMIA is 5 to 35% for the area downstream of Sion, with a similar picture emerging from the IEM. IWR amount to 100–250 mm yr<sup>−1</sup> in the IWRE, which compares favorably with the 100 mm yr<sup>−1</sup> irrigation depth estimated by [<xref ref-type="bibr" rid="B12-water-04-00869">12</xref>] for grasslands.</p>
      </sec>
    </sec>
    <sec sec-type="methods">
      <title>3. Methods</title>
      <sec id="sec3dot1-water-04-00869">
        <title>3.1. Overall Approach</title>
        <p>Seasonal IWR at the catchment scale was inferred assuming a linear dependence upon the atmospheric water budget, whereby the latter represents the difference between precipitation and reference evapotranspiration. To establish the functional form of the relation, the following steps were required:</p>
        <list list-type="order">
          <list-item>
            <p>Computing daily irrigation requirements (<italic>IWR<sub>day</sub></italic>) at the point scale for a selection of representative sites (<xref ref-type="sec" rid="sec3dot3-water-04-00869">Section 3.3</xref>). This was done by solving the soil water balance equation for the root zone and assuming that irrigation is required to avoid water stress whenever the actual root zone water depletion exceeds a pre-defined threshold;</p>
          </list-item>
          <list-item>
            <p>Integrating <italic>IWR<sub>day</sub></italic> over the growing season to obtain corresponding seasonal estimates (IWR). The growing season was defined according to the seasonal evolution of the crop coefficient, <italic>K</italic><sub>c</sub>, which was computed as function of the leaf-area index (<xref ref-type="sec" rid="sec3dot4-water-04-00869">Section 3.4</xref>);</p>
          </list-item>
          <list-item>
            <p>3. Linking seasonal IWR to the atmospheric water budget through a statistical analysis of the results obtained in the previous step. It was found that the assumed linear relation could be generalized across soil and crop types provided that its parameters are expressed as a function of the soil water holding capacity and crop coefficient (<xref ref-type="sec" rid="sec3dot4-water-04-00869">Section 3.4</xref>).</p>
          </list-item>
        </list>
      </sec>
      <sec id="sec3dot2-water-04-00869">
        <title>3.2. Weather, Land Use and Soil Data</title>
        <p>The weather data used were the same daily gridded fields for precipitation, air temperature, wind speed, vapor pressure, relative humidity, global radiation and sunshine duration as already employed in [<xref ref-type="bibr" rid="B12-water-04-00869">12</xref>]. They were obtained through spatial interpolation of station data provided by the Swiss Federal Office of Meteorology and Climatology (MeteoSwiss). The interpolation procedure was based on a weighted combination of inverse-distance interpolation and altitude-dependent regression [<xref ref-type="bibr" rid="B19-water-04-00869">19</xref>,<xref ref-type="bibr" rid="B20-water-04-00869">20</xref>]. Before interpolation, precipitation data were error-corrected separately for snow and rain using specific correction factors [<xref ref-type="bibr" rid="B20-water-04-00869">20</xref>].</p>
        <p>Geospatial data used for meta-model application (<italic>i.e.</italic>, upscaling, <xref ref-type="sec" rid="sec4-water-04-00869">Section 4</xref>), including a digital elevation model, a digital land-use map and digital information concerning soil hydraulic characteristics were obtained from various sources identified by [<xref ref-type="bibr" rid="B12-water-04-00869">12</xref>]. The 74 land-use categories originally defined in [<xref ref-type="bibr" rid="B17-water-04-00869">17</xref>] were recombined into four categories (<xref ref-type="fig" rid="water-04-00869-f001">Figure 1</xref>a), the non-agricultural land being ignored given the focus on irrigation. All spatial data were mapped with a 500 m × 500 m grid cell size.</p>
      </sec>
      <sec id="sec3dot3-water-04-00869">
        <title>3.3. Point-Scale Estimation of Daily Irrigation Requirements</title>
        <p>Daily irrigation requirements were estimated as in [<xref ref-type="bibr" rid="B9-water-04-00869">9</xref>] by considering the vertical water balance equation for the root zone. Assuming a single soil layer of constant thickness <italic>Z<sub>r</sub></italic> and total water holding capacity in the root zone <italic>TAW</italic> = (<italic>Ɵ<sub>FC</sub></italic> – <italic>Ɵ<sub>WP</sub></italic>)∙<italic>Z<sub>r</sub></italic>, where <italic>Ɵ<sub>FC</sub></italic> and <italic>Ɵ<sub>WP</sub></italic> are volumetric water contents at field capacity and wilting point, respectively, the water budget equation can be written as:
        <disp-formula id="water-04-00869-i002"><inline-graphic xmlns:xlink="http://www.w3.org/1999/xlink" xlink:href="water-04-00869-i002.tif"/> <label>(1)</label></disp-formula>
        where <italic>D<sub>r</sub></italic> is the actual soil water depletion; <italic>P</italic> the daily precipitation; <italic>RO</italic> the surface runoff; <italic>DP</italic> the deep percolation; <italic>IWR<sub>day</sub></italic> the daily irrigation amount and <italic>ET<sub>a</sub></italic> the actual evapotranspiration. In solving the balance Equation (1), neither rainfall interception, nor lateral water movements, water ponding at the surface, water storage as snow or capillary rise were considered. Infiltration capacity was defined as the difference between soil porosity and actual water content, and all precipitation in excess of the infiltration capacity was removed as surface runoff. Furthermore, all water content in excess of field capacity was removed as deep percolation. Initial soil moisture was set equal to field capacity.</p>
        <p>Following Allen <italic>et al.</italic> [<xref ref-type="bibr" rid="B9-water-04-00869">9</xref>], actual evapotranspiration <italic>ET<sub>a</sub></italic> was computed as:
        <disp-formula id="water-04-00869-i003"><inline-graphic xmlns:xlink="http://www.w3.org/1999/xlink" xlink:href="water-04-00869-i003.tif"/> <label>(2)</label></disp-formula>
        where <italic>ET<sub>0</sub></italic> is the so-called reference evapotranspiration; <italic>K<sub>c</sub></italic> the crop coefficient (which will be further described below); and <italic>K<sub>s</sub></italic> a multiplicative factor accounting for the effects of water stress. According to Allen <italic>et al.</italic> [<xref ref-type="bibr" rid="B9-water-04-00869">9</xref>]; <italic>ET<sub>0</sub></italic> is defined as the evapotranspiration of a well-watered grass surface with an assumed height of 0.12 m, a fixed surface resistance of 70 s m<sup>−1</sup> and an albedo of 0.23. It is computed by means of the Penman-Monteith equation, which reads:
        <disp-formula id="water-04-00869-i004"><inline-graphic xmlns:xlink="http://www.w3.org/1999/xlink" xlink:href="water-04-00869-i004.tif"/> <label>(3)</label></disp-formula>
        where <italic>R<sub>n</sub></italic> is the net radiation; <italic>G</italic> the soil heat flux; <italic>(e<sub>s</sub> − e<sub>a</sub>)</italic> represents the vapor pressure deficit of the air; <italic>ρ<sub>α</sub></italic> is the mean air density at constant pressure; <italic>C<sub>p</sub></italic> is the specific heat of the air; Δ represents the slope of the saturation vapor pressure temperature relationship; <italic>γ</italic> is the psychrometric constant; and <italic>r<sub>s</sub></italic> and <italic>r<sub>a</sub></italic> are the (bulk) surface and aerodynamic resistances. The estimation of <italic>r<sub>a</sub></italic> and <italic>r<sub>s</sub></italic> for use in Equation (3) is detailed in [<xref ref-type="bibr" rid="B9-water-04-00869">9</xref>], while <italic>R<sub>n</sub></italic> was estimated from global radiation using the approach suggested by [<xref ref-type="bibr" rid="B21-water-04-00869">21</xref>], and <italic>G</italic> was set equal to 0.</p>
        <p>In Equation (2), the stress factor <italic>K<sub>s</sub></italic> can be expressed in terms of <italic>D<sub>r</sub></italic> as:
        <disp-formula id="water-04-00869-i005"><inline-graphic xmlns:xlink="http://www.w3.org/1999/xlink" xlink:href="water-04-00869-i005.tif"/> <label>(4)</label></disp-formula>
        where <italic>p</italic> is a crop-specific parameter depending on unstressed crop evapotranspiration <italic>ET<sub>c</sub></italic> = <italic>K<sub>c</sub></italic> ∙ <italic>ET</italic><sub>0</sub>:
        <disp-formula id="water-04-00869-i006"><inline-graphic xmlns:xlink="http://www.w3.org/1999/xlink" xlink:href="water-04-00869-i006.tif"/> <label>(5)</label></disp-formula>
        Where <italic>P</italic><sub>5</sub> is a prescribed value of <italic>p</italic> corresponding to an <italic>ET<sub>c</sub></italic> of 5mm day<sup>−1</sup>. Values of <italic>P</italic><sub>5</sub> for cut and grazed grassland, maize, apple, apricot and grapevine are 0.55, 0.60, 0.55, 0.50, 0.50 and 0.45, respectively.</p>
        <p>Given the daily soil moisture depletion, irrigation was assumed to be necessary whenever <italic>D<sub>r</sub></italic> &gt; <italic>D<sub>r,trig</sub></italic>, where the trigger value <italic>D<sub>r,trig</sub></italic> was assumed to correspond to <italic>K<sub>s</sub></italic> = 0.8. Inserting the latter equality in Equation (4) gives:
        <disp-formula id="water-04-00869-i007"><inline-graphic xmlns:xlink="http://www.w3.org/1999/xlink" xlink:href="water-04-00869-i007.tif"/> <label>(6)</label></disp-formula></p>
        <p>For each irrigation event, the daily irrigation requirement (<italic>IWR<sub>day</sub></italic>) was defined as the amount of water necessary to bring <italic>K<sub>s</sub></italic> back to 1. From Equation (4) this is can be calculated as:
        <disp-formula id="water-04-00869-i008"><inline-graphic xmlns:xlink="http://www.w3.org/1999/xlink" xlink:href="water-04-00869-i008.tif"/> <label>(7)</label></disp-formula></p>
        <p>Simulations of daily irrigation requirements based on Equation (1) through Equation (7) were performed for five sites representing the range of elevation and climate characteristic of the catchment (<xref ref-type="fig" rid="water-04-00869-f001">Figure 1</xref> and <xref ref-type="table" rid="water-04-00869-t001">Table 1</xref>). Daily weather data covering 1981–2009 were extracted for each site from the gridded data described in <xref ref-type="sec" rid="sec3dot2-water-04-00869">Section 3.2</xref>.</p>
        <p>To obtain <italic>IWR<sub>day</sub></italic> for a wide spectrum of soil and crop conditions, the following soil and crop categories were considered:</p>
        <list list-type="bullet">
          <list-item>
            <p>10 values of the total water holding capacity ranging from 5 to 240 mm;</p>
          </list-item>
          <list-item>
            <p>6 crop categories, including cut grasslands and pastures, maize, apple, apricot and vineyards, each of which was defined through different setups of the crop coefficient.</p>
          </list-item>
        </list>
        <p>For orchards (<italic>i.e.</italic>, apple and apricot) and vineyards <italic>K<sub>c</sub></italic> was prescribed identically for each year based on data published in [<xref ref-type="bibr" rid="B22-water-04-00869">22</xref>,<xref ref-type="bibr" rid="B23-water-04-00869">23</xref>], with resulting growing season mean <italic>K<sub>c</sub></italic> of 0.82, 0.51 and 0.36, for apple, apricot and vineyards, respectively. For these crops, we further assumed a fixed growing season length of 183 (apple and apricot) and 216 days (vineyards) (<xref ref-type="table" rid="water-04-00869-t002">Table 2</xref>). A minimum <italic>K<sub>c</sub></italic> of 0.15 was specified outside the growing season, as more than half of the orchards in the study region have a grass cover between rows [<xref ref-type="bibr" rid="B22-water-04-00869">22</xref>].</p>
        <p>For grassland and maize the crop coefficient <italic>K<sub>c</sub></italic> was diagnosed from the daily leaf area index (<italic>LAI</italic>). To this aim specific simulations of crop growth were carried out with the grassland simulator PROGRASS [<xref ref-type="bibr" rid="B24-water-04-00869">24</xref>] and the process-based crop model STICS [<xref ref-type="bibr" rid="B25-water-04-00869">25</xref>]. The identified relation reads:
        <disp-formula id="water-04-00869-i009"><inline-graphic xmlns:xlink="http://www.w3.org/1999/xlink" xlink:href="water-04-00869-i009.tif"/> <label>(8)</label></disp-formula>
        where for maize <italic>LAI</italic> can be expressed as a function of the growing degree days (<italic>GDD</italic>) as:
        <disp-formula id="water-04-00869-i010"><inline-graphic xmlns:xlink="http://www.w3.org/1999/xlink" xlink:href="water-04-00869-i010.tif"/> <label>(9)</label></disp-formula>
        assuming a base temperature of &gt;6°C and setting the harvest date either corresponding to <italic>GDD</italic> = 2000 °C day<sup>−1</sup> or at latest on 1 November. For cut grasslands, we assumed a cutting regime with cuts taking places when <italic>LAI</italic> = 4 m<sup>2 </sup>m<sup>−2</sup>, but not before 1 May and no later than 1 November. Minimum <italic>LAI</italic> was set as <italic>LAI</italic><sub>min</sub> = 0.5 m<sup>2 </sup>m<sup>−2</sup>, and within each growing cycle, the daily increment <italic>∆LAI</italic> was specified as,
        <disp-formula id="water-04-00869-i011"><inline-graphic xmlns:xlink="http://www.w3.org/1999/xlink" xlink:href="water-04-00869-i011.tif"/> <label>(10)</label></disp-formula>
        where <italic>T<sub>a</sub></italic> is daily mean air temperature, <italic>T<sub>B</sub></italic> = 2.5 °C the corresponding base temperature, and initial <italic>LAI</italic> was set to 0.5 m<sup>2</sup> m<sup>−2</sup>. Pastures (grazed grasslands) were modeled in the same way as cut grassland but with a cutting threshold set to <italic>LAI</italic> = 2.5 m<sup>2</sup> m<sup>−2</sup>.</p>
      </sec>
      <sec id="sec3dot4-water-04-00869">
        <title>
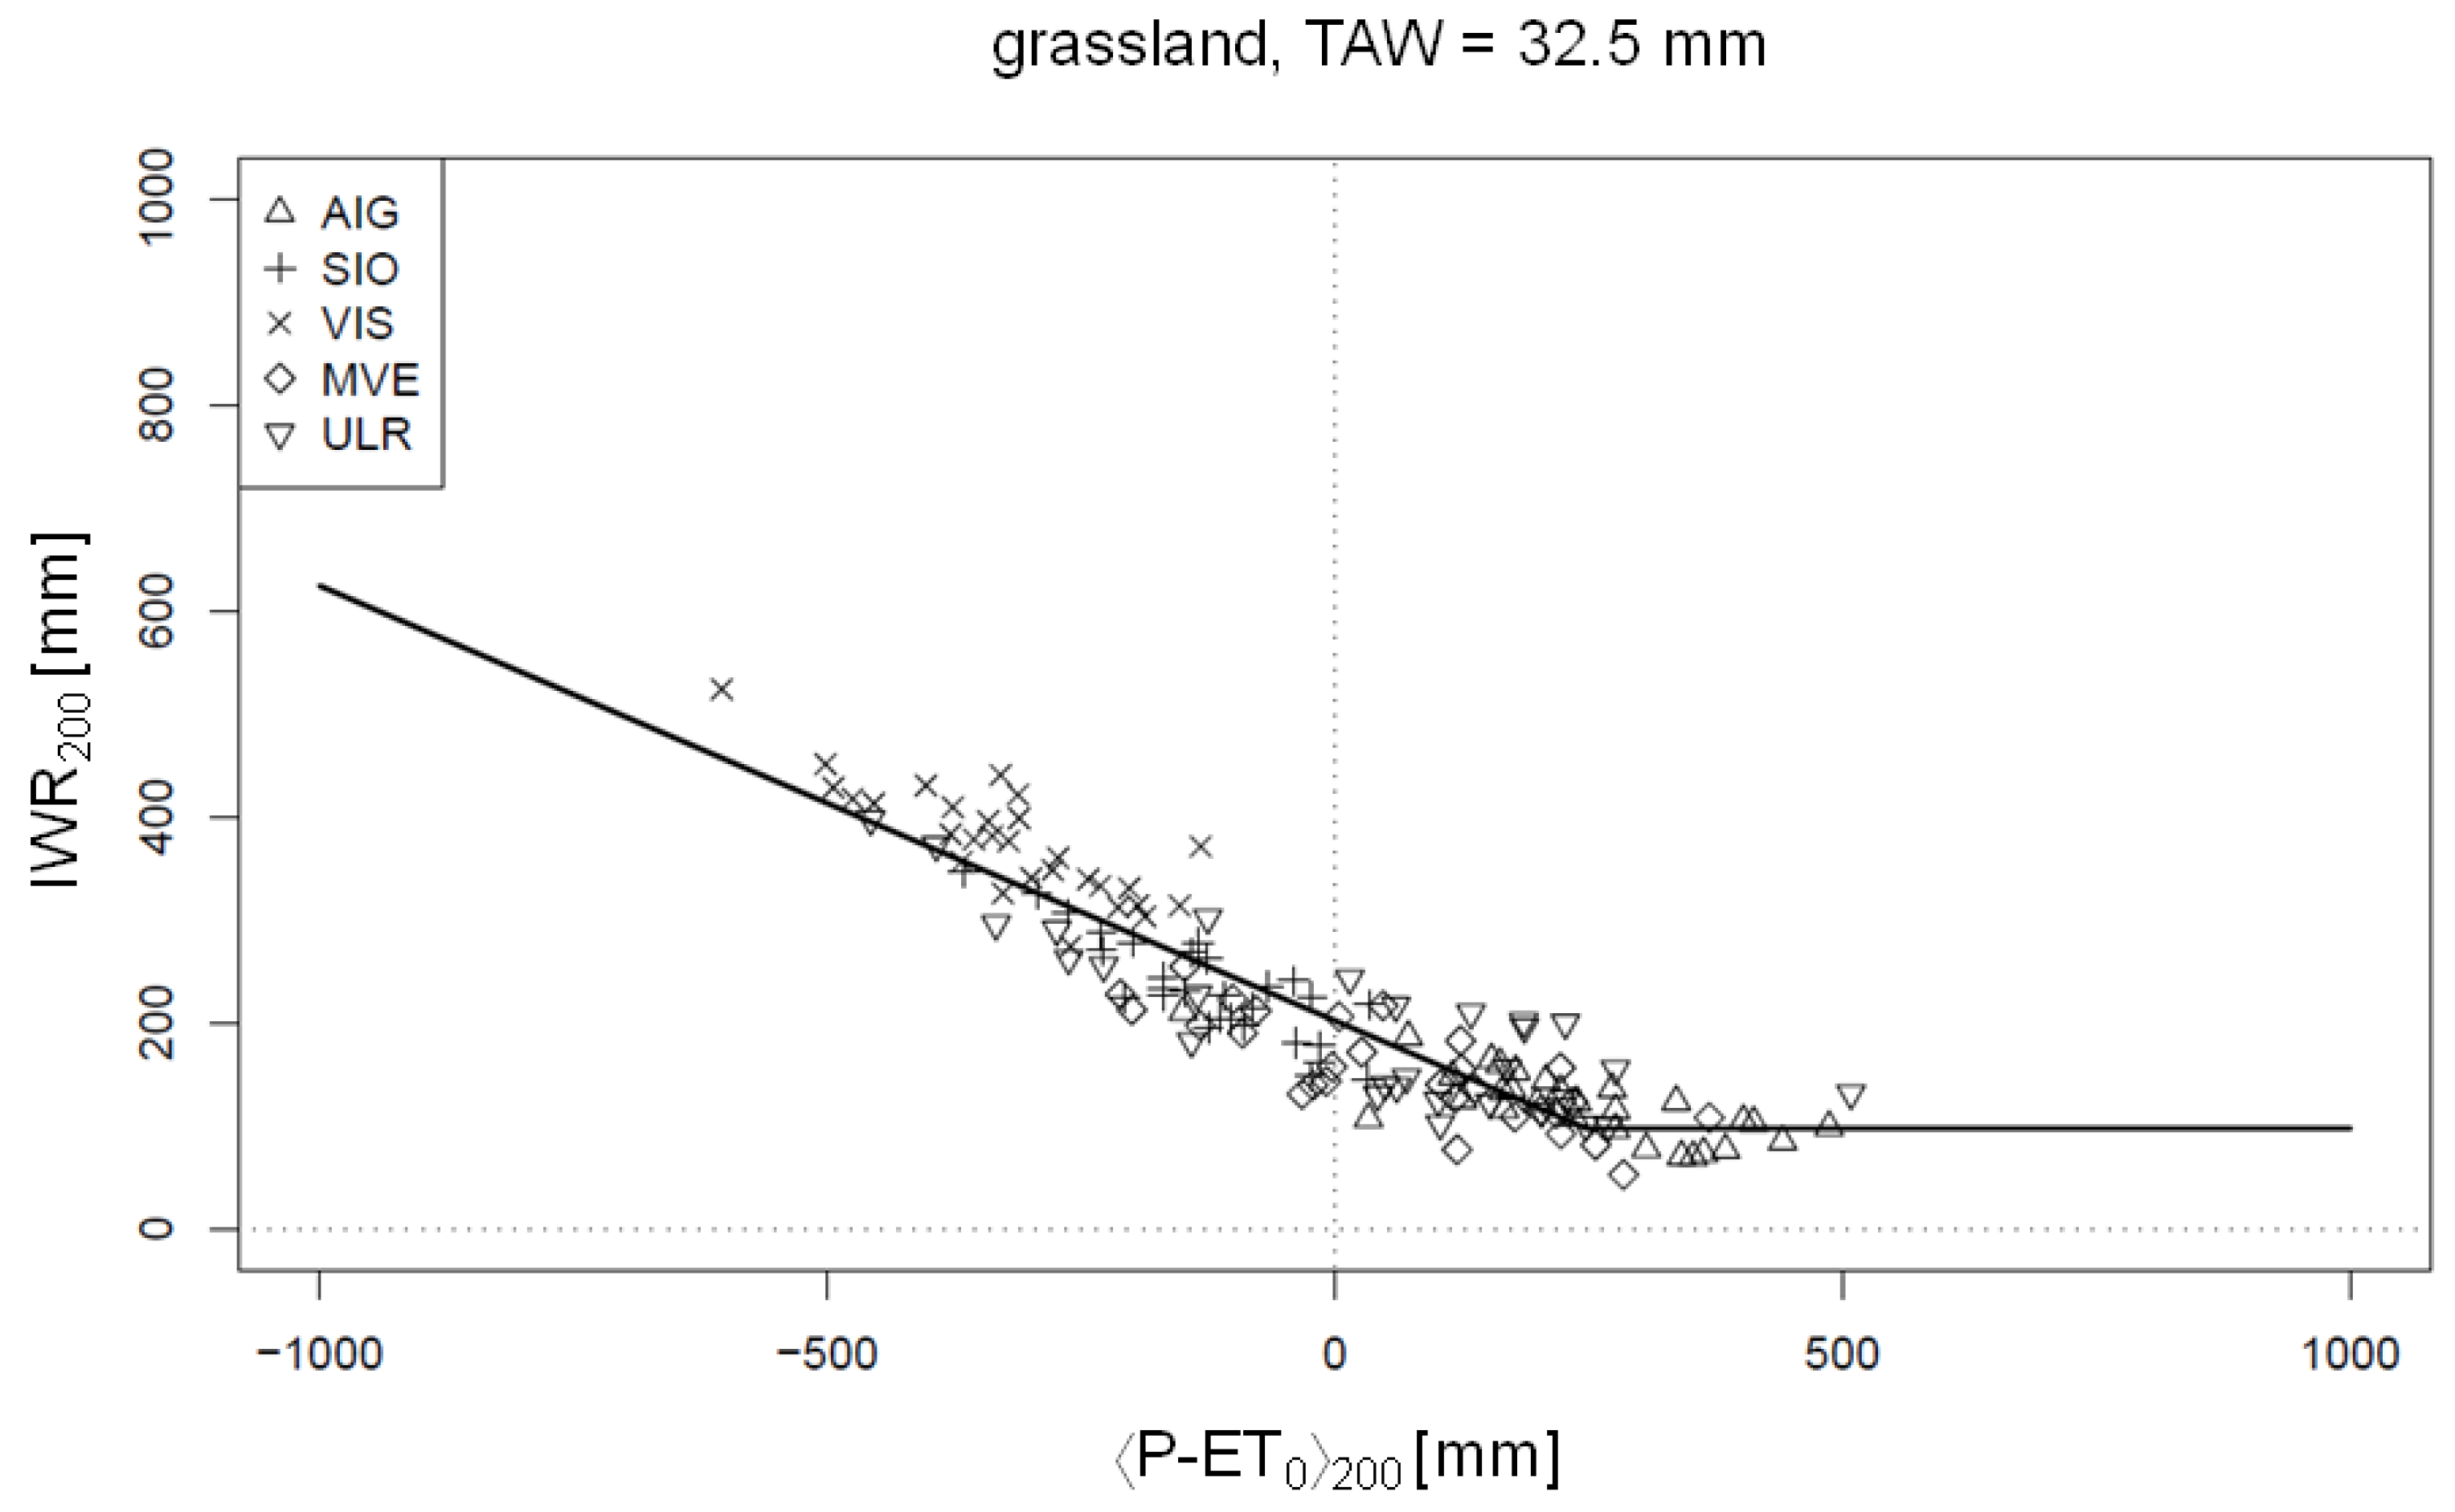
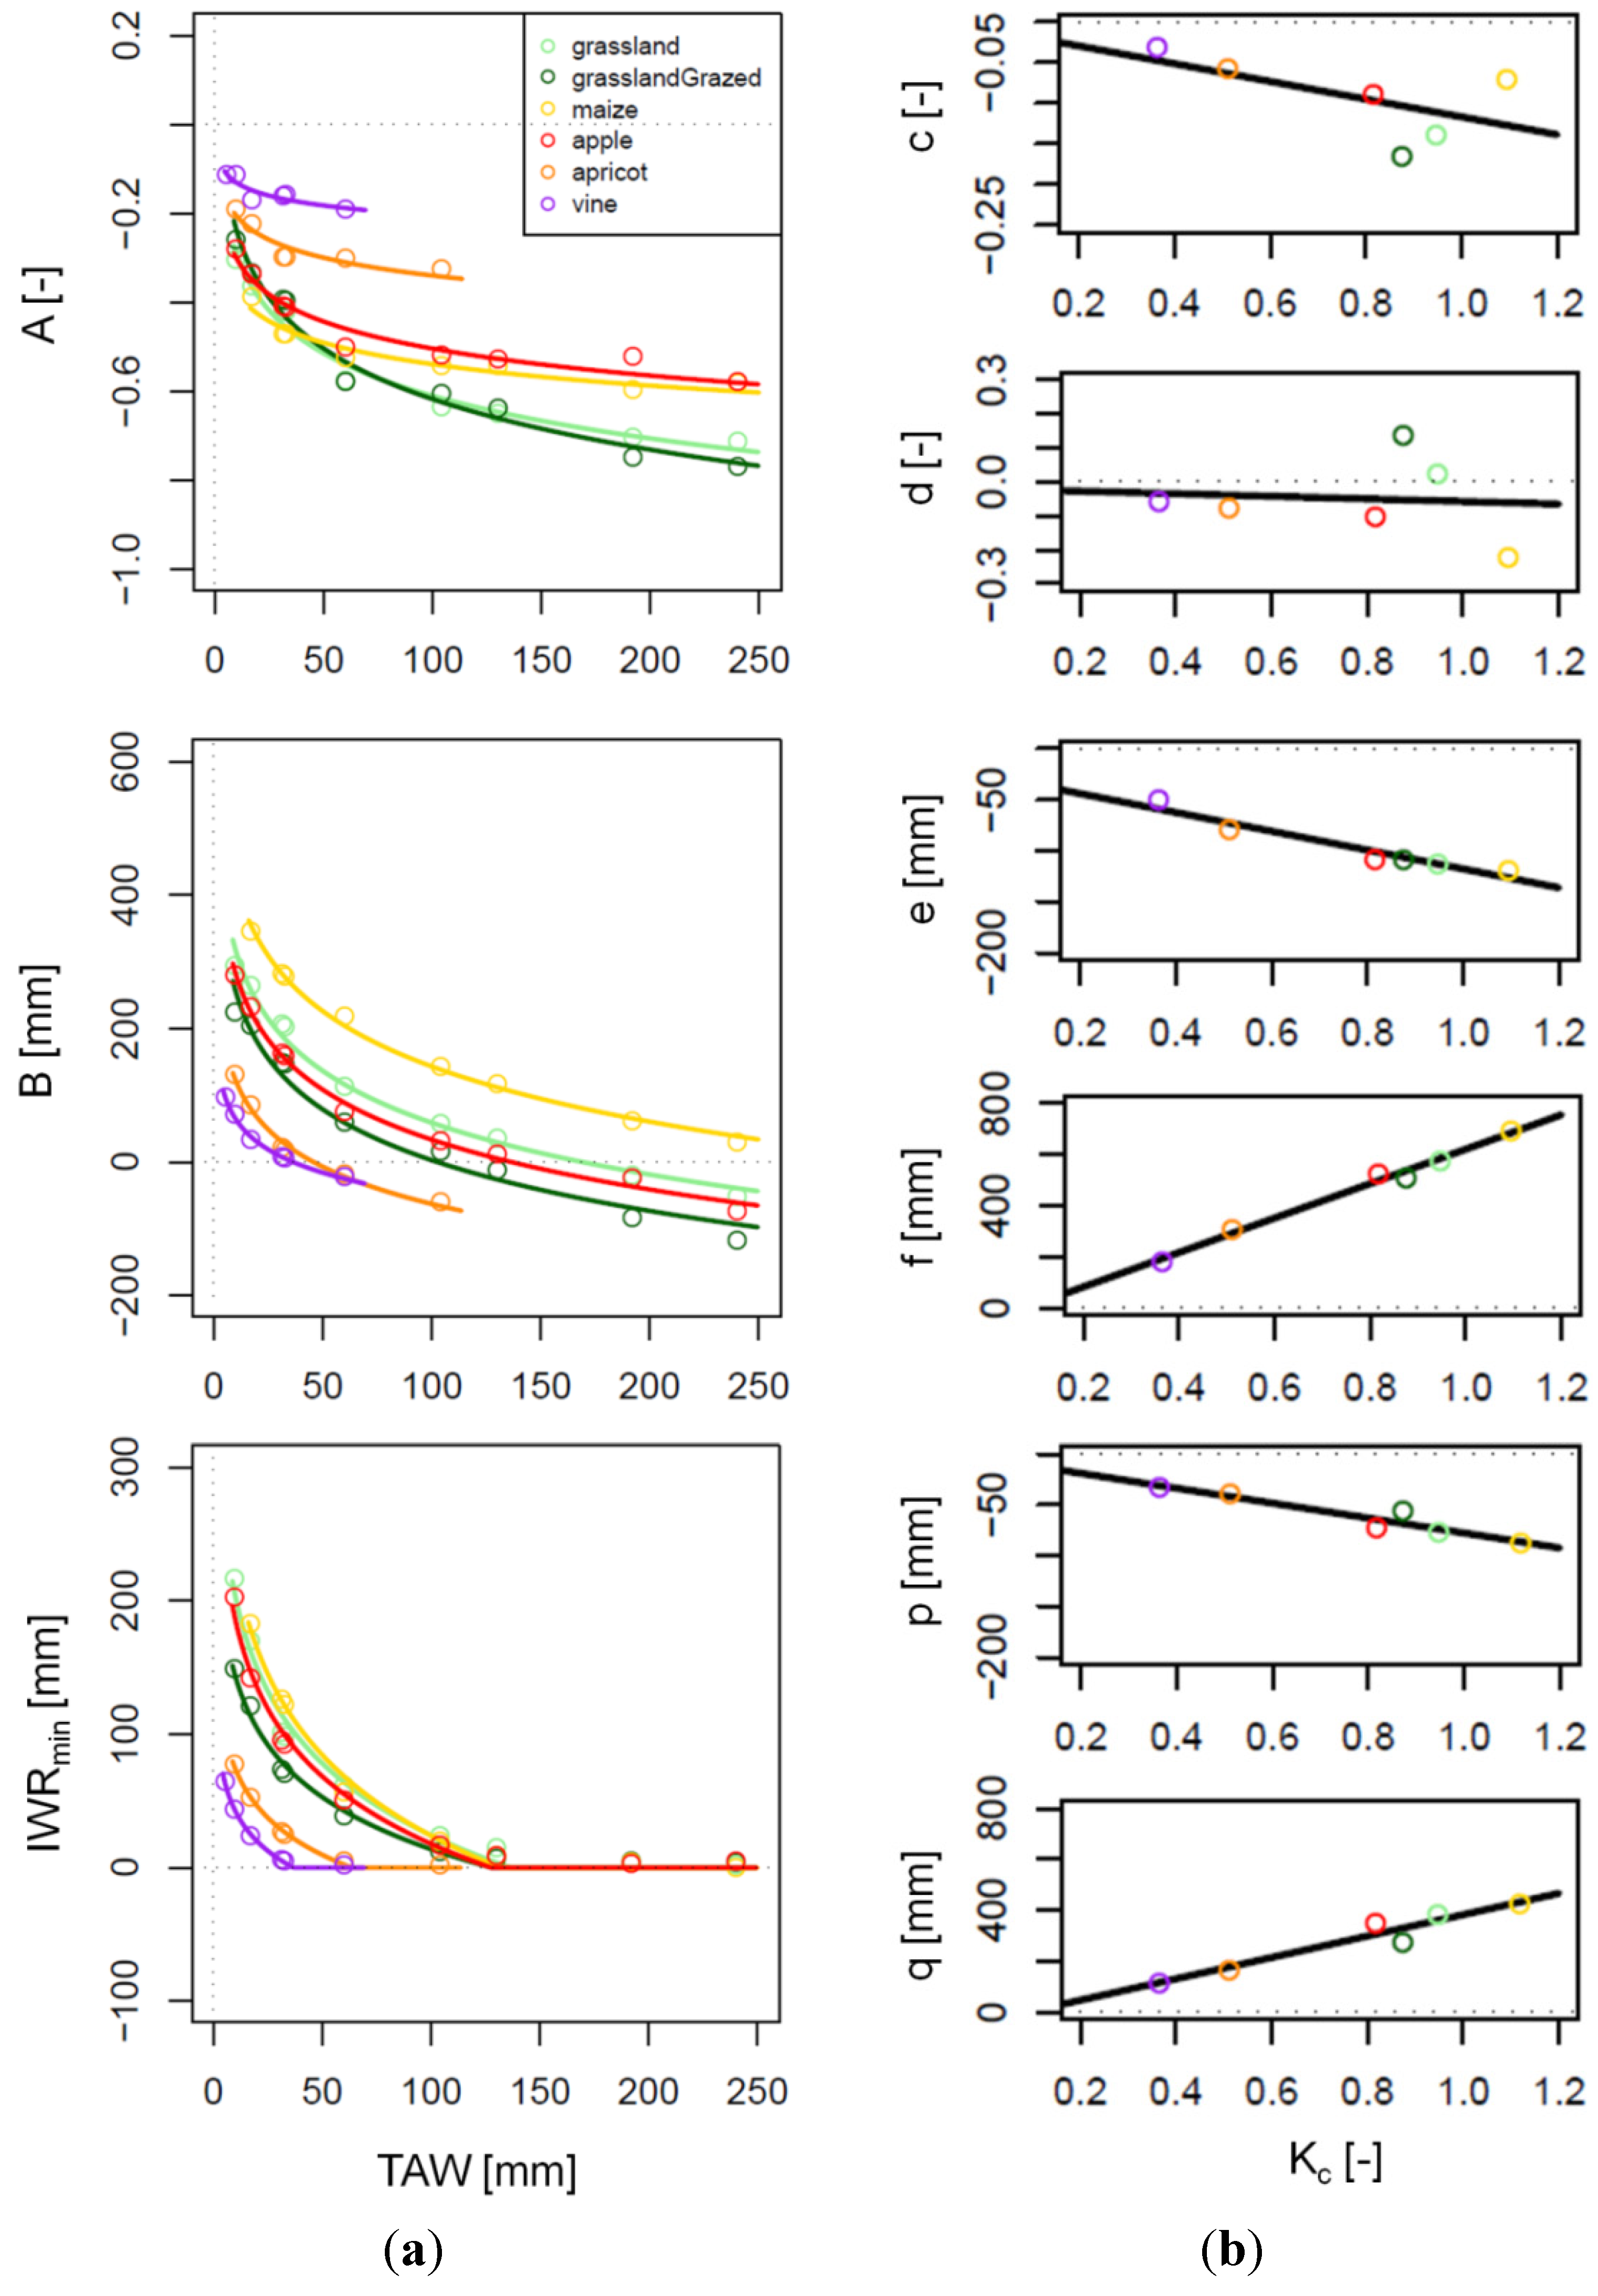
3.4. Seasonal Integration and Modeling of Seasonal Irrigation Requirements</title>
        <p>For all combinations of sites, soil water holding capacities and crops reference values of the seasonal IWR were obtained by integrating the daily irrigation requirements over the relevant growing season. Starting and ending dates of the effective growing season were specified for maize and grassland with respect to <italic>K<sub>c</sub></italic> (<xref ref-type="table" rid="water-04-00869-t002">Table 2</xref>), and computed for each year as the dates of the up- and downcrossing of the threshold corresponding to the arithmetic mean between minimum and maximum <italic>K<sub>c</sub></italic> over the study period. This procedure provides more robust estimates than found e.g., with respect to the exceedance of temperature thresholds.</p>
        <table-wrap id="water-04-00869-t002" position="float">
          <object-id pub-id-type="pii">water-04-00869-t002_Table 2</object-id>
          <label>Table 2</label>
          <caption>
            <p>Crop specific seasonal mean <italic>K<sub>c</sub></italic> and growing season length based on simulations for 1981–2009 at the sites specified in <xref ref-type="table" rid="water-04-00869-t001">Table 1</xref>.</p>
          </caption>
          <table>
            <thead>
              <tr>
                <th align="center" valign="middle">Crop type</th>
                <th align="center" valign="middle">Growing season mean Kc (−)</th>
                <th align="center" valign="middle">Growing season mean length (days)</th>
              </tr>
            </thead>
            <tbody>
              <tr>
                <td align="center" valign="middle">Grassland (cut or grazed)</td>
                <td align="center" valign="middle">0.95 or 0.88</td>
                <td align="center" valign="middle">190 or 208</td>
              </tr>
              <tr>
                <td align="center" valign="middle">Cropland (maize)</td>
                <td align="center" valign="middle">1.09</td>
                <td align="center" valign="middle">122</td>
              </tr>
              <tr>
                <td align="center" valign="middle">Orchards (apple or apricot)</td>
                <td align="center" valign="middle">0.82 or 0.51</td>
                <td align="center" valign="middle">both 183</td>
              </tr>
              <tr>
                <td align="center" valign="middle">Vineyards</td>
                <td align="center" valign="middle">0.36</td>
                <td align="center" valign="middle">216</td>
              </tr>
            </tbody>
          </table>
        </table-wrap>
        <p>Preliminary data examination indicated that for a given soil and crop type seasonal IWR can be expressed as a bounded, linear function of the seasonal integral of the atmospheric water budget (&lt;<italic>P</italic> − <italic>ET<sub>0</sub></italic>&gt;), after scaling IWR estimates as well as &lt;<italic>P</italic> − <italic>ET<sub>0</sub></italic>&gt; to a common growing season length of 200 days. Indicating with <italic>IWR<sub>200</sub></italic> and &lt;<italic>P</italic> − <italic>ET<sub>0</sub></italic>&gt;<italic><sub>200</sub></italic> these scaled values, we have:
        <disp-formula id="water-04-00869-i012"><inline-graphic xmlns:xlink="http://www.w3.org/1999/xlink" xlink:href="water-04-00869-i012.tif"/> <label>(11)</label></disp-formula></p>
        <p>This relation is illustrated in <xref ref-type="fig" rid="water-04-00869-f002">Figure 2</xref> for cut grassland and <italic>TAW</italic> = 32.5 mm.</p>
        <fig id="water-04-00869-f002" position="anchor">
          <label>Figure 2</label>
          <caption>
            <p>Relationship between seasonal <italic>IWR<sub>200</sub></italic> and &lt;<italic>P</italic>−<italic>ET<sub>0</sub></italic>&gt;<italic><sub>200</sub></italic>. The plot is based on 29 years of simulated data for cut grassland with <italic>TAW</italic> = 32.5 mm at the sites given in <xref ref-type="table" rid="water-04-00869-t001">Table 1</xref> and shown in <xref ref-type="fig" rid="water-04-00869-f001">Figure 1</xref>. The line represents Equation (11), with the horizontal branch to the right indicating <italic>IWR<sub>min</sub></italic>. A similar relationship was found for all other combinations of crops and soils.</p>
          </caption>
          <graphic xmlns:xlink="http://www.w3.org/1999/xlink" xlink:href="water-04-00869-g002.tif"/>
        </fig>
        <p>Examination of similar plots for all combinations of crops and soils further suggested that Equation (11) can be generalized provided that <italic>A</italic>, <italic>B</italic> and <italic>IWR<sub>min</sub></italic> are expressed as a function of <italic>TAW</italic> and <italic>K<sub>c</sub></italic>:
        <disp-formula id="water-04-00869-i014"><inline-graphic xmlns:xlink="http://www.w3.org/1999/xlink" xlink:href="water-04-00869-i014.tif"/> <label>(12)</label></disp-formula>
        with:
        <disp-formula id="water-04-00869-i015"><inline-graphic xmlns:xlink="http://www.w3.org/1999/xlink" xlink:href="water-04-00869-i015.tif"/> <label>(13)</label></disp-formula></p>
        <p>The only exceptions we found, for which the model given by Equation (11) with Equations (12,13) failed to provide an adequate description of seasonal IWR, were shallow soils, viz. soils with a total holding capacity of <italic>TAW</italic> &lt; 5 mm for vineyards, <italic>TAW</italic> &lt; 15 mm for maize, and <italic>TAW</italic> &lt; 9 mm for all other crops. Equations (12,13) are illustrated in <xref ref-type="fig" rid="water-04-00869-f003">Figure 3</xref>.</p>
        <fig id="water-04-00869-f003" position="anchor">
          <label>Figure 3</label>
          <caption>
            <p>Modulation of the generic relationship between <italic>IWR<sub>200</sub></italic> and &lt;<italic>P</italic>−<italic>ET<sub>0</sub></italic>&gt;<italic><sub>200</sub></italic> by soil water holding capacity (<bold>a</bold>) <italic>TAW</italic>; and crop type (<bold>b</bold>) <italic>K<sub>c</sub></italic>. The continuous lines represent Equation (12) in the left panel and Equation (13) in the right panel.</p>
          </caption>
          <graphic xmlns:xlink="http://www.w3.org/1999/xlink" xlink:href="water-04-00869-g003.tif"/>
        </fig>
      </sec>
    </sec>
    <sec sec-type="results" id="sec4-water-04-00869">
      <title>4. Results</title>
      <sec id="sec4dot1-water-04-00869">
        <title>
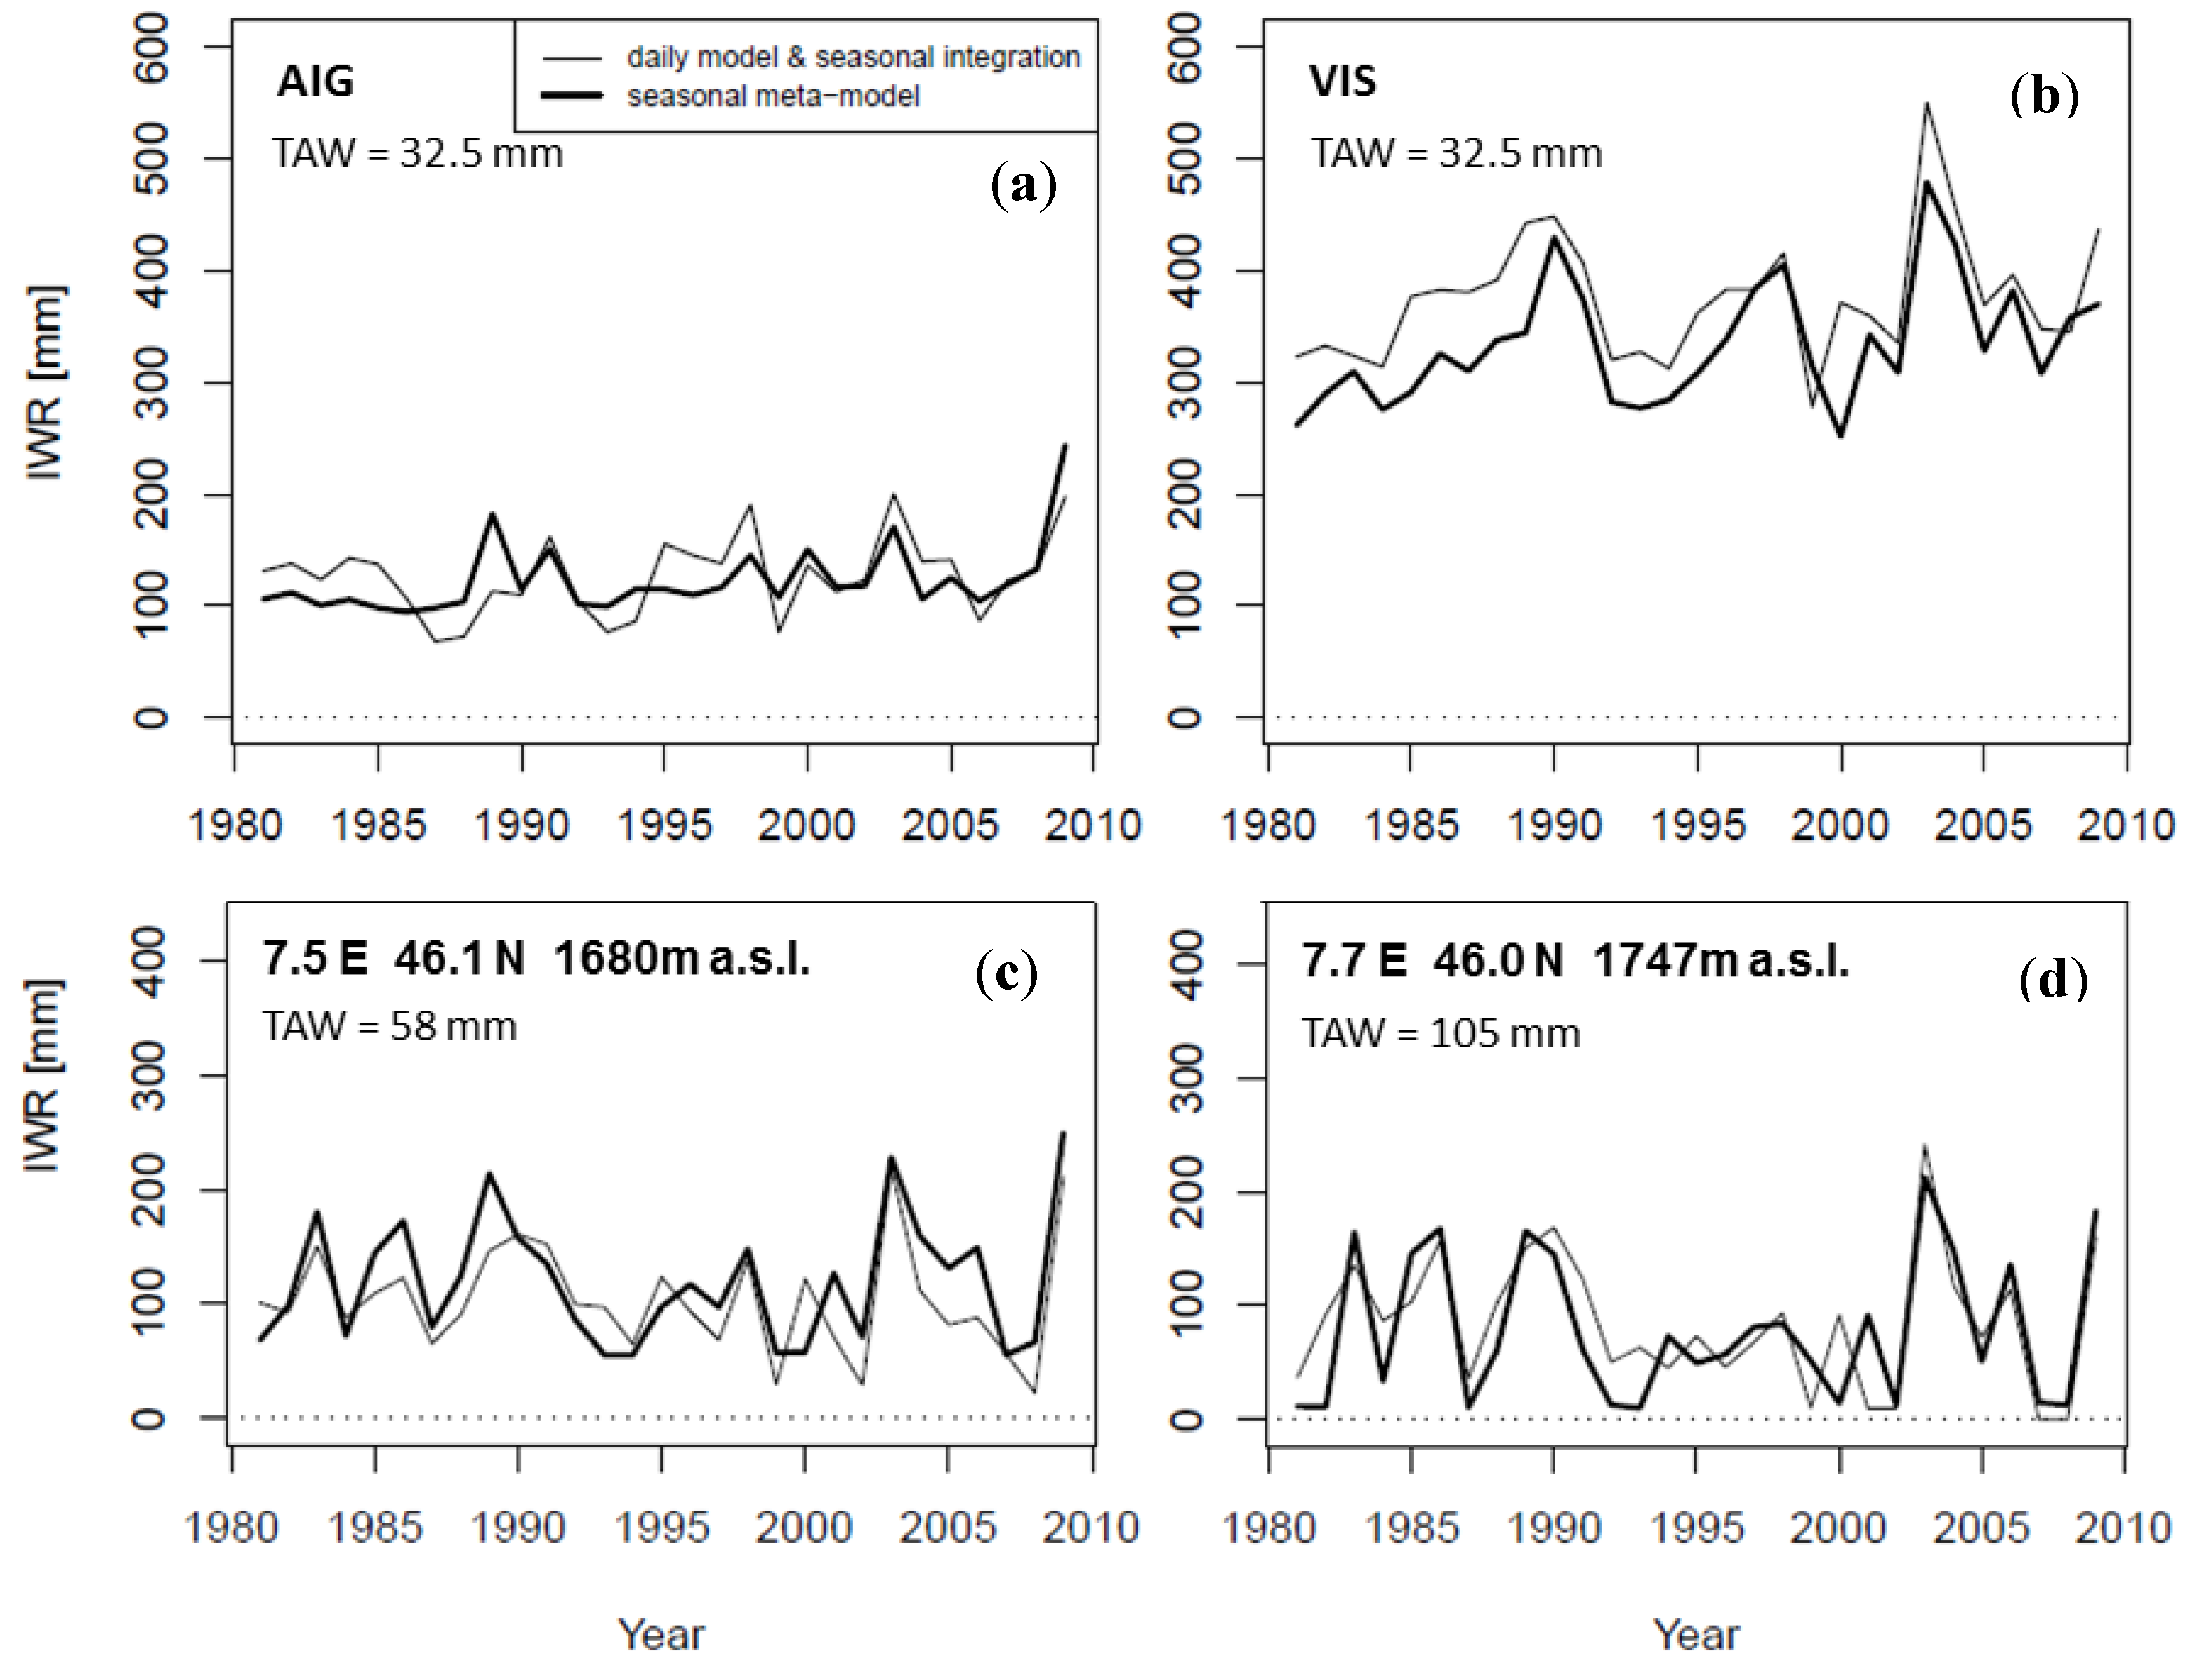
4.1. Model Calibration and Assessment</title>
        <p>The values of the 12 model parameters <italic>g</italic> to <italic>u</italic> were obtained by stepwise fitting Equations (11–13) for all combinations of crop and soil types. Resulting parameter values were: <italic>g</italic> = −0.109; <italic>h</italic> = −0.008; <italic>i</italic> = −0.038; <italic>j</italic> = −0.019; <italic>k</italic> = −92.0 mm; <italic>l</italic> = −25.5 mm; <italic>m</italic> = 676.0 mm, <italic>n</italic> = −54.2 mm; <italic>r</italic> = −73.0 mm; <italic>s</italic> = −4.5 mm; <italic>t</italic> = 420 mm and <italic>u</italic> = −38.2 mm. It should be noted that for each of the three steps involved in fitting Equations (11–13) the coefficient of determination, R<sup>2</sup>, was high, varying between 0.52 and 0.87 for Equation (11) (and equal to 0.84 in the example of <xref ref-type="fig" rid="water-04-00869-f002">Figure 2</xref>), between 0.80 and 1 for Equation (12) and between 0.90 and 0.99 for Equation (13).</p>
        <p>After parameter fitting, we verified Equation (11) through Equation (13) by comparing estimates of the seasonal IWR with more detailed results from the point-scale daily model for six additional sites (one per crop type) representing contrasting climate and soil characteristics. Again, meteorological data needed to evaluate seasonal <italic>P</italic> and <italic>ET</italic><sub>0</sub> were extracted from the gridded data described in <xref ref-type="sec" rid="sec3dot2-water-04-00869">Section 3.2</xref>. Growing season length and seasonal mean of daily <italic>K<sub>c</sub></italic> was computed according to Equations (8–10), and <italic>IWR<sub>200</sub></italic> was eventually rescaled to provide IWR.</p>
        <p>With respect to the model assessment, the overall agreement was very good (not shown), with performance statistics computed over the ensemble of verification runs given as <italic>R</italic><sup>2</sup> = 0.64, root-mean square error <italic>RMSE</italic> = 41 mm and <italic>Bias</italic> = +2 mm.</p>
        <p>Good model performance was also found with respect to year-to-year variations in IWR. As an illustrative example for grasslands, <xref ref-type="fig" rid="water-04-00869-f004">Figure 4</xref> shows a comparison of results obtained from the daily model, on the one hand, and Equations (11–13), on the other hand, at two calibration sites (Aigle humid, and Visp dry) on a shallow soil and two verification sites on deeper soils, located in side Valleys in the South of the Rhone catchment, respectively. </p>
        <fig id="water-04-00869-f004" position="anchor">
          <label>Figure 4</label>
          <caption>
            <p>Time series of seasonal IWR for grassland at Aigle (<bold>a</bold>); Visp (<bold>b</bold>); and two of the verification sites near Evolène (<bold>c</bold>) and Zermatt (<bold>d</bold>). Thin lines represent results obtained with the daily point-scale model, and thick lines display the estimate given by Equations (11–13).</p>
          </caption>
          <graphic xmlns:xlink="http://www.w3.org/1999/xlink" xlink:href="water-04-00869-g004.tif"/>
        </fig>
        <p>As seen in this figure, Equations (11–13) were able not only to correctly reproduce differences between crops, soils and sites, but also to provide reliable estimates of seasonal IWR for extreme years. For Visp, average (1981–2009) IWR obtained from Equations (11–13) was 334 mm, as compared to 375 mm obtained with daily simulations (<xref ref-type="fig" rid="water-04-00869-f004">Figure 4</xref>b), and for 2003 as the year with the highest atmospheric demand, values of IWR at Visp were 479 and 550 mm, respectively, representing relative anomalies of +43% and +46%. Performance statistics relative to the comparison of the two time series at Visp were <italic>R</italic><sup>2</sup> = 0.69, <italic>RMSE</italic> = 12% and <italic>Bias</italic> = −11% relative to the average of 375 mm.</p>
      </sec>
      <sec id="sec4dot2-water-04-00869">
        <title>
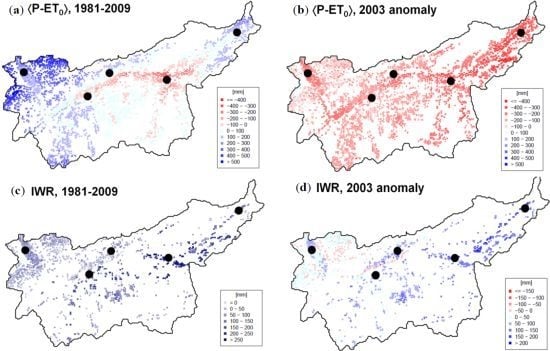
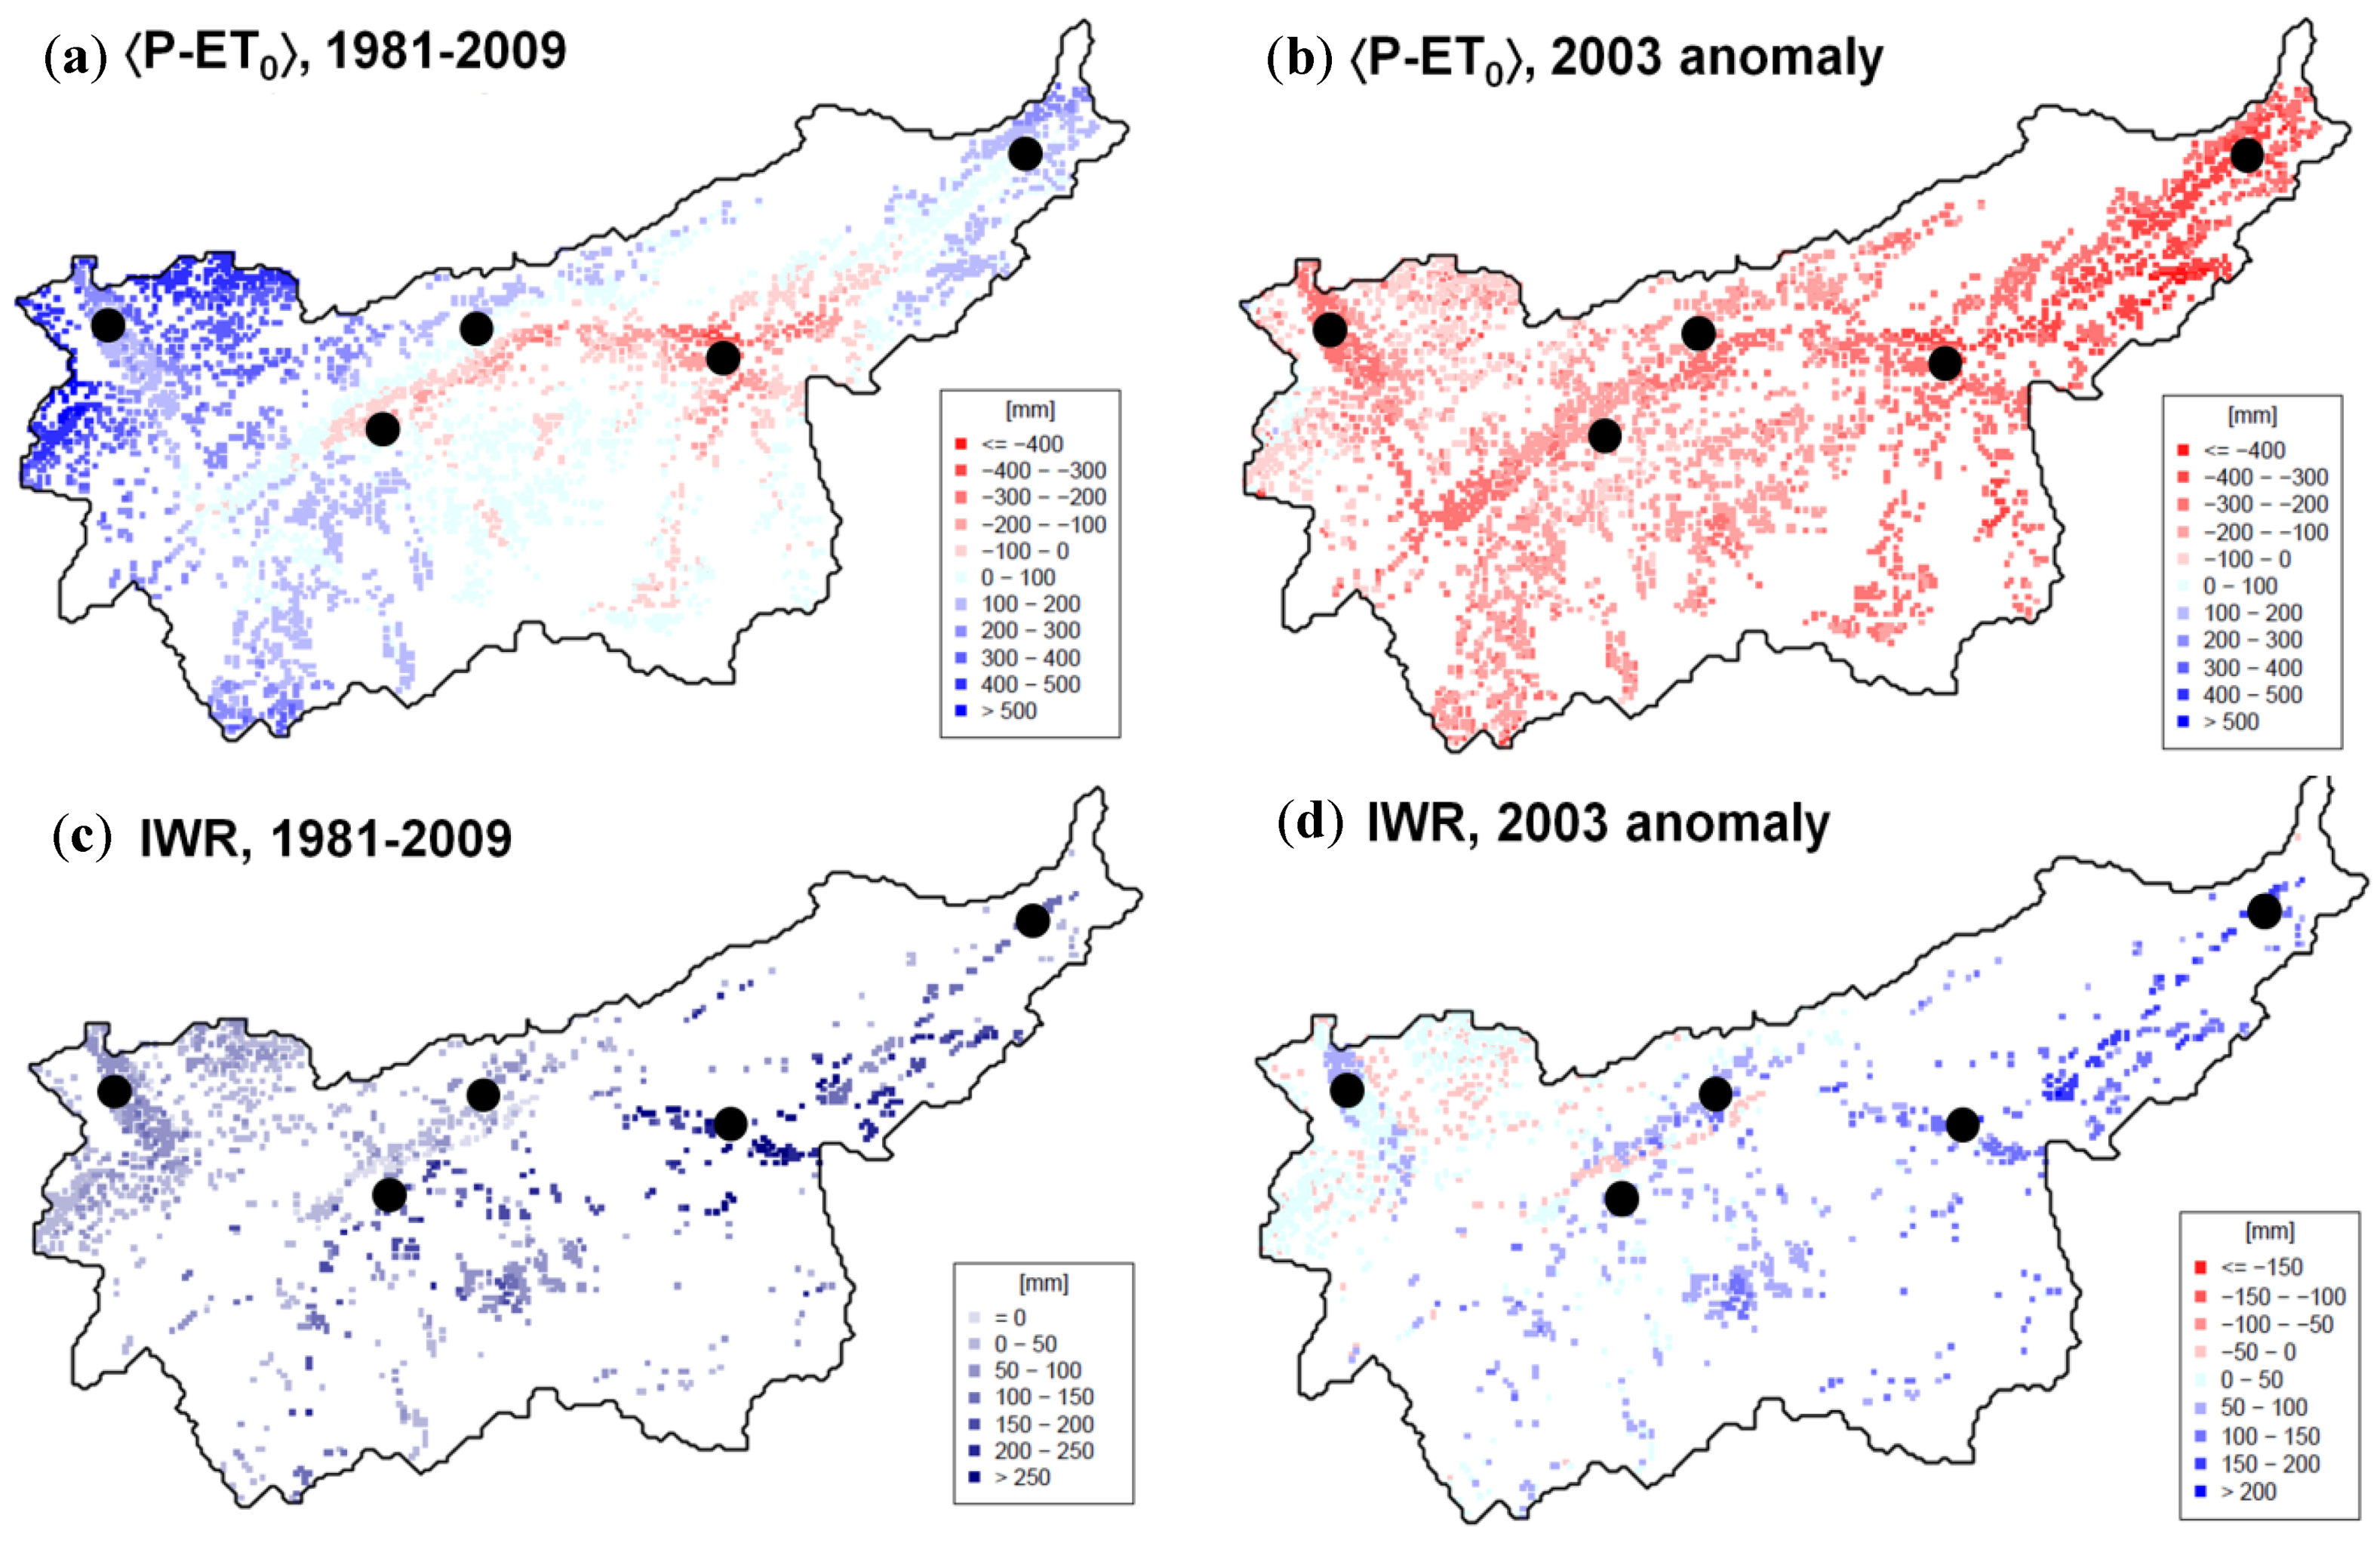
4.2. Spatial Patterns of Mean and Extreme IWR</title>
        <p>For the estimation of IWR from Equation (11) to Equation (13) at the catchment scale, the gridded soil and land use data described in <xref ref-type="sec" rid="sec3dot2-water-04-00869">Section 3.2</xref> were used. Start and end of the growing season and seasonal mean <italic>K<sub>c</sub></italic> were computed using the procedure outlined in <xref ref-type="sec" rid="sec3dot3-water-04-00869">Section 3.3</xref>. </p>
        <p>In <xref ref-type="fig" rid="water-04-00869-f005">Figure 5</xref>, spatial patterns of average IWR for 1981–2009 are plotted along with the spatial distribution of &lt;<italic>P</italic> − <italic>ET<sub>0</sub></italic>&gt; and the corresponding anomalies for 2003. Positive values of the atmospheric water budget were obtained for the uppermost and lowermost parts of the catchment, reaching over 200 mm per season. Negative values were found in the central part between Sion and Visp, as well as in lateral valleys on the south side of the main valley. Negative seasonal atmospheric budgets varied typically from 0 to −200 mm, with a maximum of −400 mm in the surroundings of Visp (<xref ref-type="fig" rid="water-04-00869-f005">Figure 5</xref>a).</p>
        <fig id="water-04-00869-f005" position="anchor">
          <label>Figure 5</label>
          <caption>
            <p>Spatial distribution of (<bold>a</bold>) the average atmospheric water budget &lt;<italic>P</italic>−<italic>ET<sub>0</sub></italic>&gt; for 1981–2009; (<bold>b</bold>) the corresponding anomaly for 2003; (<bold>c</bold>) average seasonal IWR for 1981–2009; and (<bold>d</bold>) the corresponding anomaly for 2003. Points indicate sites described in <xref ref-type="table" rid="water-04-00869-t001">Table 1</xref> and <xref ref-type="fig" rid="water-04-00869-f001">Figure 1</xref>.</p>
          </caption>
          <graphic xmlns:xlink="http://www.w3.org/1999/xlink" xlink:href="water-04-00869-g005.tif"/>
        </fig>
        <p>Seasonal IWR ranged from 0 to 50 mm in the area around Aigle and at higher elevations, and reached more than 250 mm in the Visp region (<xref ref-type="fig" rid="water-04-00869-f005">Figure 5</xref>c). For 59% of the agricultural area, soil water holding capacities were smaller than 5 mm (vineyards), 15 mm (maize) and 9 mm (all other crops). Corresponding grid points were thus excluded from the analysis. The remaining 41% were assumed to represent the area that potentially requires irrigation. This area may include points with IWR of 0 mm depending on climate variability and related crop-specific evaporative demand. </p>
        <p>In 2003, a negative precipitation anomaly was already recorded during winter and spring, and again in July [<xref ref-type="bibr" rid="B10-water-04-00869">10</xref>], resulting in a strong negative anomaly of the seasonal atmospheric water budget throughout the study region (<xref ref-type="fig" rid="water-04-00869-f005">Figure 5</xref>b) with values between −200 and more than −400 mm. Corresponding seasonal IWR exceeded 200 mm upstream and 50–100 mm near the outlet of the catchment, <italic>i.e.</italic>, below Aigle (<xref ref-type="fig" rid="water-04-00869-f005">Figure 5</xref>d).</p>
      </sec>
      <sec id="sec4dot3-water-04-00869">
        <title>
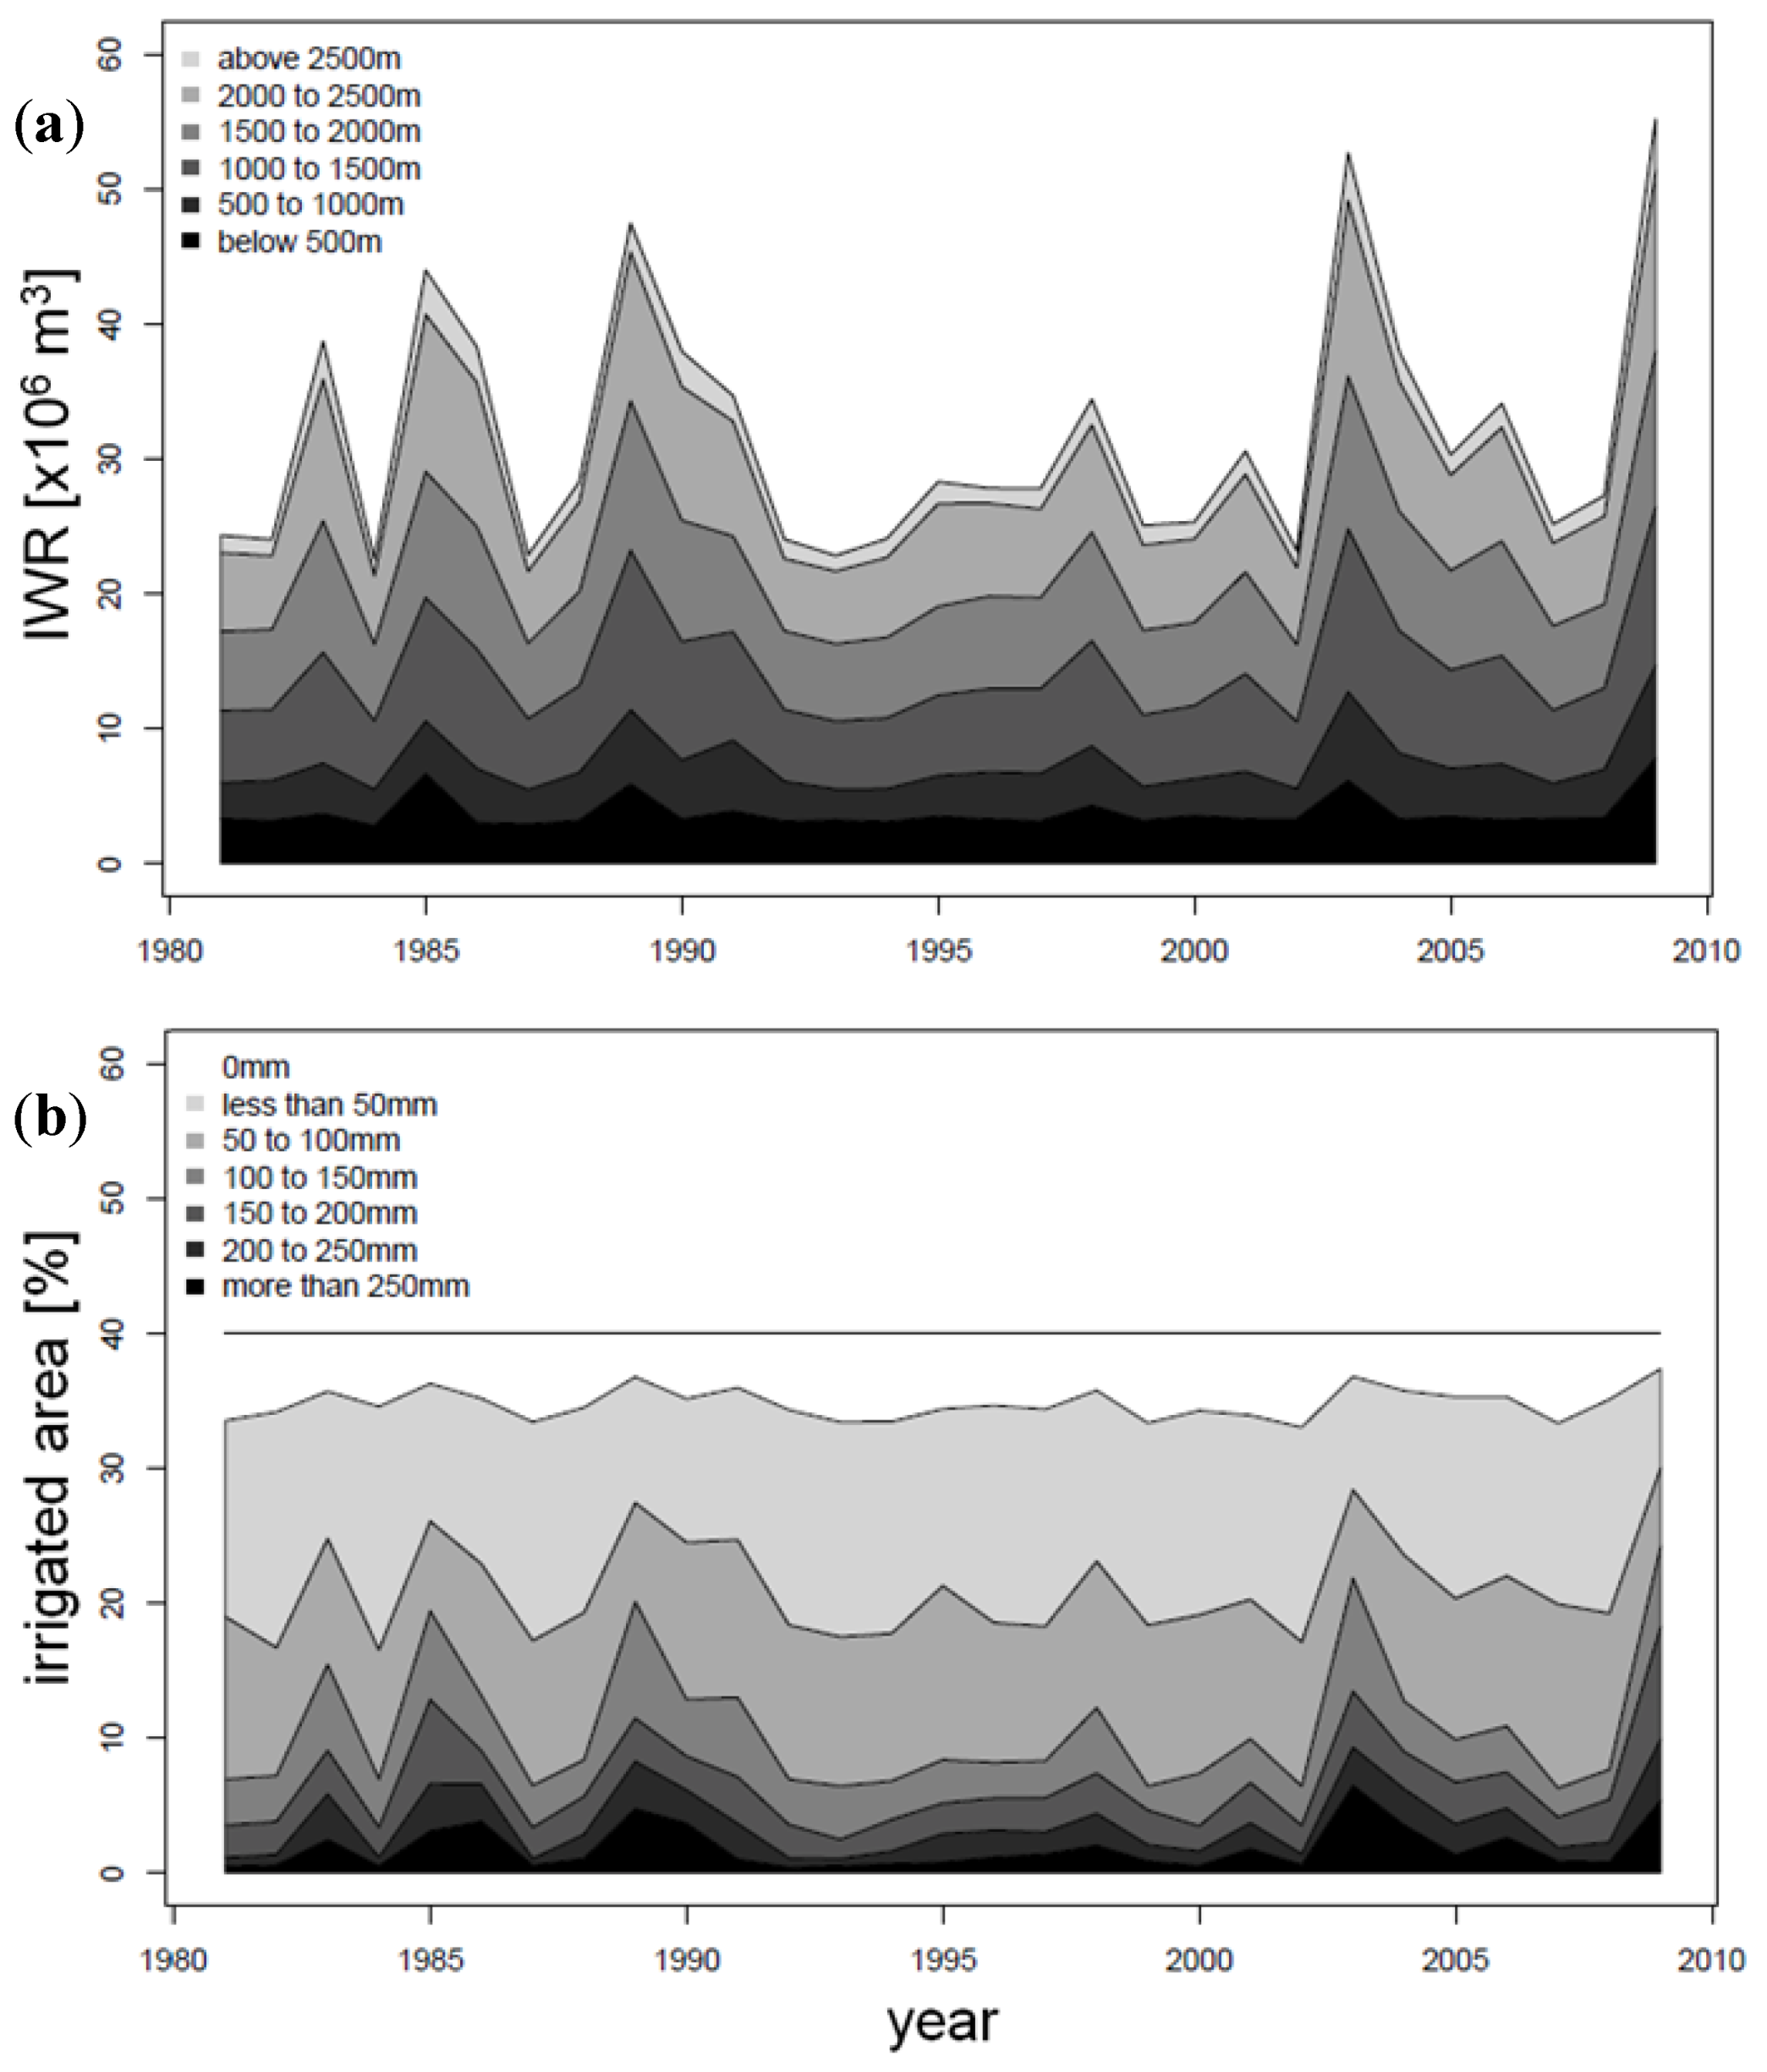
4.3. Time Series of IWR Aggregated over the Catchment</title>
        <p>Aggregated values of IWR across the entire catchment varied between 22 and 55 × 10<sup>6 </sup>m<sup>3</sup>, approximating 32 × 10<sup>6 </sup>m<sup>3</sup> on average for the period 1981–2009 (<xref ref-type="fig" rid="water-04-00869-f006">Figure 6</xref>a). </p>
        <fig id="water-04-00869-f006" position="anchor">
          <label>Figure 6</label>
          <caption>
            <p>Stacked area charts of (<bold>a</bold>) total IWR during 1981–2009 for different elevation ranges; and (<bold>b</bold>) of the percentage of the total agricultural area that required different irrigation intensities. The 41% line indicates the potentially irrigated area.</p>
          </caption>
          <graphic xmlns:xlink="http://www.w3.org/1999/xlink" xlink:href="water-04-00869-g006.tif"/>
        </fig>
        <p>In 8 out of 29 years, IWR was below 25 × 10<sup>6 </sup>m<sup>3</sup>, but exceeded 40 × 10<sup>6 </sup>m<sup>3</sup> in 4 years. IWR was particularly high toward the end of the time period considered, reaching 53 × 10<sup>6 </sup>m<sup>3</sup> in 2003 and 55 × 10<sup>6 </sup>m<sup>3</sup> in 2009. On average, half of total IWR was allocated to areas above 1500 m altitude. The relative anomaly in IWR for 2003 is 65% at catchment scale including the effect of a 6% increase in irrigated area.</p>
        <p>Half of the area that would potentially require irrigation (that is 20% of total agricultural area, <xref ref-type="fig" rid="water-04-00869-f006">Figure 6</xref>b) received less than 50 mm per season and an additional quarter of the area needed between 50 and 100 mm per season. Only an estimated 5% of the total agricultural area appeared to require, on average, more than 200 mm per season, but this fraction doubled in extreme years (1989, 2003 and 2009). </p>
      </sec>
    </sec>
    <sec sec-type="discussion">
      <title>5. Discussion</title>
      <p>A simple modeling scheme is presented for estimating crop and soil specific net seasonal IWR from the atmospheric water budget. The proposed model is able to reproduce results obtained from a more detailed analysis at the daily step. Applied to the Swiss part of the Rhone catchment, the method gives a catchment-scale IWR of 32 × 10<sup>6 </sup>m<sup>3 </sup>yr<sup>−1</sup>. Using a distributed hydrological model, a requirement of 3.6 × 10<sup>6 </sup>m<sup>3 </sup>yr<sup>−1</sup> to 4.2 × 10<sup>6 </sup>m<sup>3 </sup>yr<sup>−1</sup> was calculated in an earlier study for the central part of the basin (1574 km<sup>2</sup>) [<xref ref-type="bibr" rid="B12-water-04-00869">12</xref>]. Extrapolated to the entire catchment this amounts to 10–15 × 10<sup>6 </sup>m<sup>3 </sup>yr<sup>−1</sup>a factor of two less than estimated in our work. While these earlier figures are based on the application of a hydrological model that describes in more detail the vertical water balance and accounts for snow cover, they also reflect the assumption of a static prescription of crop properties. The advance made with the model presented our study is clearly the consideration of seasonal vegetation dynamics. </p>
      <p>The estimate of 97 × 10<sup>6 </sup>m<sup>3 </sup>yr<sup>−1</sup> by the cantonal authorities, based on an analysis of questionnaires distributed to farmers in the study area [<xref ref-type="bibr" rid="B13-water-04-00869">13</xref>], is clearly higher than the estimate produced here. However, the figure represents bulk water abstraction through irrigation channels (ignoring the inefficiency of the channels themselves which account for 90% of the types of access to water), and it thus includes water loss through evaporation, runoff and percolation of the irrigation water applied. In contrast, our estimate is based on the theoretical amount needed to satisfy crop water demand with 100% efficiency. Considering an overall efficiency of &lt;50% in irrigation with open channels [<xref ref-type="bibr" rid="B13-water-04-00869">13</xref>,<xref ref-type="bibr" rid="B26-water-04-00869">26</xref>,<xref ref-type="bibr" rid="B27-water-04-00869">27</xref>,<xref ref-type="bibr" rid="B28-water-04-00869">28</xref>], the aggregated average IWR obtained here is in reasonable agreement with the survey data. On average, in the Okanagan Basin, the driest in Canada, the irrigation water requirement (accounting as in [<xref ref-type="bibr" rid="B13-water-04-00869">13</xref>] for a non 100% efficiency) is higher than in the Rhone catchment, amounting between 100 and 140 × 10<sup>6 </sup>m<sup>3</sup> per year (for a wet and a dry year respectively), for an irrigated area of 200 km<sup>2</sup> [<xref ref-type="bibr" rid="B11-water-04-00869">11</xref>]. Both basins however have in common the dominance of fodder crops in terms of irrigated area and amounts.</p>
      <p>Concerning spatial distribution, we found the highest values of irrigation water requirement in the area upstream of Sion. This is in contrast with the picture delivered by GMIA [<xref ref-type="bibr" rid="B6-water-04-00869">6</xref>] and EIM [<xref ref-type="bibr" rid="B3-water-04-00869">3</xref>], but in agreement with results from [<xref ref-type="bibr" rid="B13-water-04-00869">13</xref>], stressing the importance of studies at the local scale for developing targeted information for planners, authorities and end-users. </p>
      <p>Of the 980 km<sup>2</sup> agricultural area within the basin, about 86% are classified as grasslands. These are meadows and pastures that, unlike cropland and orchards, cover land with less favorable growing conditions across a wide range of elevations. Of the potentially irrigated areas, grasslands represent only 80% because more shallow soils predominantly located at higher elevations were excluded. Of the remaining potentially irrigated grasslands, still 63% are found above 1500 m a.s.l. and thus account for half of the estimated total irrigated area. The proportion is the same in terms of surface area and IWR amounts, which indicates that the overall irrigation depth is similar below and above 1500 m a.s.l. This is surprising as lower irrigation intensity were expected at higher elevations given the more favorable atmospheric water budget. In practice, however, the latter is compensated for by the fact that soils are shallower and is grassland more sensitive to water deficiency than grapevine or maize grown on the deep soils near the outlet of the catchment.</p>
      <p>According to a questionnaire distributed to cantonal administrations [<xref ref-type="bibr" rid="B13-water-04-00869">13</xref>], the Swiss Federal Office of Agriculture estimated that about 30% of the total agricultural land area in the Valais is currently equipped for irrigation. In our analysis the fraction of area potentially requiring irrigation is 40%, and thus higher than the estimate based on the survey. The difference can be explained by the fact that irrigation is not allowed above 1400 m and 1900 m a.s.l. on northern and southern slopes, respectively. </p>
      <p>Looking at anomalies in individual years relative to the estimated average IWR, it is noted that years characterized by extremely dry conditions were not evenly spread over the time period considered. Four of these years appeared between 1982 and 1989, suggesting that extreme years may not be distributed in a completely random way. IWR were higher in 2003 and 2009 than in 1983, 1985, 1986 and 1989. This may indicate a trend towards intensification of extreme years as a consequence of higher temperatures and increased evaporative demand. However, given the large inter-annual variability across the 30-year period considered, no statistically significant trend in catchment-scale IWR could be identified, confirming the findings in [<xref ref-type="bibr" rid="B12-water-04-00869">12</xref>]. A thorough investigation of decadal variations in the precipitation regime is needed to better understand trends in the occurrence of extreme conditions. </p>
      <p>In 2003, a record-breaking heat-wave [<xref ref-type="bibr" rid="B10-water-04-00869">10</xref>,<xref ref-type="bibr" rid="B29-water-04-00869">29</xref>] struck Western Europe and the Alpine region during summer, leading to a severe precipitation anomaly [<xref ref-type="bibr" rid="B14-water-04-00869">14</xref>]. Our estimate of the 2003 anomaly in IWR at catchment scale (65%) was obtained comparing the year 2003 with the 1981–2009 average. In [<xref ref-type="bibr" rid="B4-water-04-00869">4</xref>,<xref ref-type="bibr" rid="B11-water-04-00869">11</xref>], the 2003 anomaly in IWR was computed comparing it to IWR for a relatively wet year, respectively 2002 and 1997. Considering only maize, our estimate of the 2003 anomaly is of 68% in the Rhone catchment. Since 2002 appears to be a year much below average in terms of IWR in the Rhone catchment, the anomaly for maize would be of ~100% if computed comparing 2003 with 2002 as in [<xref ref-type="bibr" rid="B4-water-04-00869">4</xref>], who found a 53% increase in irrigation intensity of maize in France in 2003. In the Okanagan Basin, a 40% greater irrigation water requirement was estimated and fruit trees found to be most sensitive to increasing demand during dry years [<xref ref-type="bibr" rid="B11-water-04-00869">11</xref>]. It is also the case in our results for the Rhone catchment, where the 2003 anomaly is of 86% for apple. </p>
      <p>Although we were able to provide a detailed spatial and temporal picture of IWR in an Alpine river catchment that is within the range of previous estimates [<xref ref-type="bibr" rid="B12-water-04-00869">12</xref>,<xref ref-type="bibr" rid="B13-water-04-00869">13</xref>], our analysis suffers from the various following limitations that need to be addressed in future work. In the first place, we could not provide a direct validation of the simulated water fluxes against measurements of evaporation rates, precipitation and changes in soil water storage at the local scale. This is not only a problem with the present study, but is valid also for the analysis conducted, e.g., in [<xref ref-type="bibr" rid="B12-water-04-00869">12</xref>]. Furthermore, we did not quantify uncertainties in computed IWR in a systematic way. Sources of uncertainty are errors in input data (gridded weather fields, land use and soil maps), assumptions related to the daily point-scale model, irrigation target thresholds, site selection for calibration, and exclusion of surface areas with critically shallow soils. Based on the model verification at six additional sites (<xref ref-type="sec" rid="sec4dot1-water-04-00869">Section 4.1</xref>), the uncertainty associated with the simplifications introduced by Equations (11–13) is estimated to be at least 40% (relative RMSE). However, this figure likely represents a lower estimate of the total uncertainty, as we did not account for issues related to irrigation efficiency, effects of glaciers and snow cover in the seasonal availability of water resources, or effects of the water table fluctuations and the contribution of capillary rise to the water budget of the root zone.</p>
    </sec>
    <sec sec-type="conclusions">
      <title>6. Conclusions</title>
      <p>This paper presents a simple modeling approach for estimating the spatial pattern as well as inter-annual variability of net IWR at the catchment scale. Irrigation requirements are examined in the light of crop water demand, without considering the availability of water for abstraction. The approach accounts for effects of pedo-climatic conditions and crop characteristics, all being particularly heterogeneous in the Swiss Rhone basin.</p>
      <p>The three main findings were that: (i) results are within the range of estimates obtained in the application of a process-based, spatially distributed hydrological model and the evaluation of a field survey, which lends some support to the approach; (ii) half of the total potential IWR was found to originate from elevations above 1500 m, where grasslands dominate the non-forested area; (iii) although grasslands are more sensitive to water deficiency and grow mostly on soils that are more shallow than those used for other crop types in this catchment, the wetter climate found at higher elevations compensates for this effect.</p>
      <p>In spite of its limitations, the proposed modeling approach seems suitable for exploring implications for the regional agricultural water balance of multiple climate and land use change scenarios, or to identify future trends in IWR at catchment scale. Such applications would help to validate the estimated 22% increase in IWR expected by the Valais cantonal authority as a consequence of climate and future management changes [<xref ref-type="bibr" rid="B13-water-04-00869">13</xref>]. Risks from water shortage at the seasonal and local scale are likely to become more important in the future, particularly in view of the drastic decrease in glacier volume and snow cover. This will not only affect agriculture, but other sectors of relevance for the regional economy, including energy production and tourism. By contrasting IWR with the needs from other economic sectors, the proposed methodology can help to identify emerging water conflicts.</p>
    </sec>
  </body>
  <back>
    <ack>
      <title>Acknowledgments</title>
      <p>This work was supported with grants from the EU-FP7 ACQWA Project and Swiss National Science Foundation through the National Centre for Competence in Research (NCCR) Climate, project AGRISK. We thank the Swiss Federal Office of Meteorology and Climatology (MeteoSwiss) for granting access to its database. Gridded meteorological data were kindly provided by K. Jasper. We acknowledge the use of computing facilities at University of Graz.</p>
    </ack>
    <ref-list>
      <title>References</title>
      <ref id="B1-water-04-00869">
        <label>1.</label>
        <citation citation-type="gov">
		<collab>United Nations Environment Programme (UNEP)</collab>
          <source>Global Environmental Outlook 2000</source>
          <publisher-name>Earthscan</publisher-name>
          <publisher-loc>London, UK</publisher-loc>
          <year>1999</year>
        </citation>
      </ref>
      <ref id="B2-water-04-00869">
        <label>2.</label>
        <citation citation-type="book">
          <person-group person-group-type="author">
            <name>
              <surname>Shiklomanov</surname>
              <given-names>I.A.</given-names>
            </name>
          </person-group>
          <article-title>Assessment of water resources and water availability in the world</article-title>
          <source>UN Report: Comprehensive Assessment of the Freshwater Resources of the World</source>
          <publisher-name>Stockholm Environment Institute</publisher-name>
          <publisher-loc>Stockholm, Sweden</publisher-loc>
          <year>1997</year>
        </citation>
      </ref>
      <ref id="B3-water-04-00869">
        <label>3.</label>
        <citation citation-type="journal">
          <person-group person-group-type="author">
            <name>
              <surname>Wriedt</surname>
              <given-names>G.</given-names>
            </name>
            <name>
              <surname>van der Velde</surname>
              <given-names>M.</given-names>
            </name>
            <name>
              <surname>Aloe</surname>
              <given-names>A.</given-names>
            </name>
            <name>
              <surname>Bouraoui</surname>
              <given-names>F.</given-names>
            </name>
          </person-group>
          <article-title>A European irrigation map for spatially distributed agricultural modelling</article-title>
          <source>Agric. Water Manag.</source>
          <year>2009</year>
          <volume>96</volume>
          <fpage>771</fpage>
          <lpage>789</lpage>
          <pub-id pub-id-type="doi">10.1016/j.agwat.2008.10.012</pub-id>
        </citation>
      </ref>
      <ref id="B4-water-04-00869">
        <label>4.</label>
        <citation citation-type="journal">
          <person-group person-group-type="author">
            <name>
              <surname>Van der Velde</surname>
              <given-names>M.</given-names>
            </name>
            <name>
              <surname>Wriedt</surname>
              <given-names>G.</given-names>
            </name>
            <name>
              <surname>Bouraoui</surname>
              <given-names>F.</given-names>
            </name>
          </person-group>
          <article-title>Estimating irrigation use and effects on maize yield during the 2003 heatwave in France</article-title>
          <source>Agric. Ecosyst. Environ.</source>
          <year>2010</year>
          <volume>135</volume>
          <fpage>90</fpage>
          <lpage>97</lpage>
          <pub-id pub-id-type="doi">10.1016/j.agee.2009.08.017</pub-id>
        </citation>
      </ref>
      <ref id="B5-water-04-00869">
        <label>5.</label>
        <citation citation-type="book">
          <person-group person-group-type="author">
            <name>
              <surname>Thenkabail</surname>
              <given-names>P.S.</given-names>
            </name>
            <name>
              <surname>Biradar</surname>
              <given-names>C.M.</given-names>
            </name>
            <name>
              <surname>Turral</surname>
              <given-names>H.</given-names>
            </name>
            <name>
              <surname>Noojipady</surname>
              <given-names>P.</given-names>
            </name>
            <name>
              <surname>Li</surname>
              <given-names>Y.J.</given-names>
            </name>
            <name>
              <surname>Vithanage</surname>
              <given-names>J.</given-names>
            </name>
            <name>
              <surname>Dheeravath</surname>
              <given-names>V.</given-names>
            </name>
            <name>
              <surname>Velpuri</surname>
              <given-names>M.</given-names>
            </name>
            <name>
              <surname>Schull</surname>
              <given-names>M.</given-names>
            </name>
            <name>
              <surname>Cai</surname>
              <given-names>X.L.</given-names>
            </name>
            <name>
              <surname>Dutta</surname>
              <given-names>R.</given-names>
            </name>
          </person-group>
          <source>An Irrigated Area Map of the World (1999) Derived from Remote Sensing; Research Report No. 105</source>
          <publisher-name>International Water Management Institute</publisher-name>
          <publisher-loc>Colombo, Sri Lanka</publisher-loc>
          <year>2006</year>
        </citation>
      </ref>
      <ref id="B6-water-04-00869">
        <label>6.</label>
        <citation citation-type="web">
          <person-group person-group-type="author">
            <name>
              <surname>Siebert</surname>
              <given-names>S.</given-names>
            </name>
          </person-group>
          <source>Global Map of Irrigation Areas Version 4.0.1.</source>
          <publisher-name>Food and Agriculture Organization of the United Nations (FAO)</publisher-name>
          <publisher-loc>Rome, Italy</publisher-loc>
          <year>2007</year>
          <access-date>(accessed on 21 July 2012)</access-date>
          <comment>Available online:<ext-link xmlns:xlink="http://www.w3.org/1999/xlink" xlink:href="http://www.fao.org/nr/water/ aquastat/quickWMS/irrimap.htm" ext-link-type="uri">http://www.fao.org/nr/water/ aquastat/quickWMS/irrimap.htm</ext-link></comment>
        </citation>
      </ref>
      <ref id="B7-water-04-00869">
        <label>7.</label>
        <citation citation-type="journal">
          <person-group person-group-type="author">
            <name>
              <surname>Döll</surname>
              <given-names>P.</given-names>
            </name>
            <name>
              <surname>Siebert</surname>
              <given-names>S.</given-names>
            </name>
          </person-group>
          <article-title>Global modelling of irrigation water requirements</article-title>
          <source>Water Resour. Res.</source>
          <year>2002</year>
          <volume>38</volume>
          <fpage>8:1</fpage>
          <lpage>8:10</lpage>
        </citation>
      </ref>
      <ref id="B8-water-04-00869">
        <label>8.</label>
        <citation citation-type="journal">
          <person-group person-group-type="author">
            <name>
              <surname>Wriedt</surname>
              <given-names>G.</given-names>
            </name>
            <name>
              <surname>van der Velde</surname>
              <given-names>M.</given-names>
            </name>
            <name>
              <surname>Aloe</surname>
              <given-names>A.</given-names>
            </name>
            <name>
              <surname>Bouraoui</surname>
              <given-names>F.</given-names>
            </name>
          </person-group>
          <article-title>Estimating Irrigation water requirements in Europe</article-title>
          <source>J. Hydrol.</source>
          <year>2009</year>
          <volume>373</volume>
          <fpage>527</fpage>
          <lpage>544</lpage>
          <pub-id pub-id-type="doi">10.1016/j.jhydrol.2009.05.018</pub-id>
        </citation>
      </ref>
      <ref id="B9-water-04-00869">
        <label>9.</label>
        <citation citation-type="book">
          <person-group person-group-type="author">
            <name>
              <surname>Allen</surname>
              <given-names>R.G.</given-names>
            </name>
            <name>
              <surname>Pereira</surname>
              <given-names>L.S.</given-names>
            </name>
            <name>
              <surname>Raes</surname>
              <given-names>D.</given-names>
            </name>
            <name>
              <surname>Smith</surname>
              <given-names>M.</given-names>
            </name>
          </person-group>
          <source>Crop Evapotranspiration: Guidelines for Computing Crop Water Requirements; FAO Irrigation and Drainage Paper 56</source>
          <publisher-name>Food and Agriculture Organization of the United Nations (FAO)</publisher-name>
          <publisher-loc>Rome, Italy</publisher-loc>
          <year>1998</year>
        </citation>
      </ref>
      <ref id="B10-water-04-00869">
        <label>10.</label>
        <citation citation-type="web">
          <article-title>ACQWA EU-FP7 Project (Assessing Climate impacts on the Quantity and quality of Water, Seventh Research Framework Programme)</article-title>
          <access-date>(accessed on 1 November 2012)</access-date>
          <comment>Available online:<ext-link xmlns:xlink="http://www.w3.org/1999/xlink" xlink:href="http://www.acqwa.ch" ext-link-type="uri">http://www.acqwa.ch</ext-link></comment>
        </citation>
      </ref>
      <ref id="B11-water-04-00869">
        <label>11.</label>
        <citation citation-type="book">
          <person-group person-group-type="author">
            <name>
              <surname>Schreier</surname>
              <given-names>H.</given-names>
            </name>
            <name>
              <surname>Lavkulich</surname>
              <given-names>L.</given-names>
            </name>
            <name>
              <surname>Brown</surname>
              <given-names>L.</given-names>
            </name>
          </person-group>
          <source>Real and Virtual Water and Water Footprints: A Comparison between the Lower Fraser Valley and the Okanagan Basin</source>
          <publisher-name>Technical Report For Walter and Duncan Gordon Foundation</publisher-name>
          <publisher-loc>Toronto, Canada</publisher-loc>
          <year>2007</year>
        </citation>
      </ref>
      <ref id="B12-water-04-00869">
        <label>12.</label>
        <citation citation-type="journal">
          <person-group person-group-type="author">
            <name>
              <surname>Fuhrer</surname>
              <given-names>J.</given-names>
            </name>
            <name>
              <surname>Jasper</surname>
              <given-names>K.</given-names>
            </name>
          </person-group>
          <article-title>Demand and supply of water for agriculture: Influence of topography and climate in pre-alpine, mesoscale catchments</article-title>
          <source>Nat. Resour.</source>
          <year>2012</year>
          <volume>3</volume>
          <fpage>145</fpage>
          <lpage>155</lpage>
        </citation>
      </ref>
      <ref id="B13-water-04-00869">
        <label>13.</label>
        <citation citation-type="book">
          <person-group person-group-type="author">
            <name>
              <surname>Weber</surname>
              <given-names>M.</given-names>
            </name>
            <name>
              <surname>Schild</surname>
              <given-names>A.</given-names>
            </name>
          </person-group>
          <source>Stand der Bewässerung in der Schweiz (in German); Bericht zur Umfrage 2006-Report</source>
          <publisher-name>Federal Office of Agriculture</publisher-name>
          <publisher-loc>Bern, Switzerland</publisher-loc>
          <year>2007</year>
        </citation>
      </ref>
      <ref id="B14-water-04-00869">
        <label>14.</label>
        <citation citation-type="journal">
          <person-group person-group-type="author">
            <name>
              <surname>Weingartner</surname>
              <given-names>R.</given-names>
            </name>
            <name>
              <surname>Viviroli</surname>
              <given-names>D.</given-names>
            </name>
            <name>
              <surname>Schädler</surname>
              <given-names>B.</given-names>
            </name>
          </person-group>
          <article-title>Water resources in mountain regions: a methodological approach to assess the water balance in a highland-lowland system</article-title>
          <source>Hydrol. Process.</source>
          <year>2007</year>
          <volume>21</volume>
          <fpage>578</fpage>
          <lpage>585</lpage>
          <pub-id pub-id-type="doi">10.1002/hyp.6268</pub-id>
        </citation>
      </ref>
      <ref id="B15-water-04-00869">
        <label>15.</label>
        <citation citation-type="journal">
          <person-group person-group-type="author">
            <name>
              <surname>Huss</surname>
              <given-names>M.</given-names>
            </name>
          </person-group>
          <article-title>Present and future contribution of glacier storage change to runoff from macroscale drainage basins in Europe</article-title>
          <source>Water Resour. Res.</source>
          <year>2011</year>
          <volume>47</volume>
          <fpage>W07511:1</fpage>
          <lpage>W07511:14</lpage>
        </citation>
      </ref>
      <ref id="B16-water-04-00869">
        <label>16.</label>
        <citation citation-type="web">
          <article-title>MeteoSwiss Norm Values</article-title>
          <access-date>(accessed on 21 July 2012)</access-date>
          <comment>Available online:<ext-link xmlns:xlink="http://www.w3.org/1999/xlink" xlink:href="http://www.meteoswiss.admin.ch/web/de/klima/klima_schweiz/tabellen.Par.0011.DownloadFile.ext.tmp/niederschlagssummen.pdf" ext-link-type="uri">http://www.meteoswiss.admin.ch/web/de/klima/klima_schweiz/tabellen.Par.0011.DownloadFile.ext.tmp/niederschlagssummen.pdf</ext-link></comment>
        </citation>
      </ref>
      <ref id="B17-water-04-00869">
        <label>17.</label>
        <citation citation-type="gov">
		<collab>Swiss Federal Statistical Office</collab>
          <source>Bodennutzung im Wandel: Arealstatistik der Schweiz (in German)</source>
          <publisher-name>Swiss Federal Statistical Office</publisher-name>
          <publisher-loc>Neuchâtel, Switzerland</publisher-loc>
          <year>2001</year>
        </citation>
      </ref>
      <ref id="B18-water-04-00869">
        <label>18.</label>
        <citation citation-type="gov">
		<collab>Swiss Federal Statistical Office</collab>
          <source>Digital Map of the Soil Aptitudes</source>
          <publisher-name>Swiss Federal Statistical Office</publisher-name>
          <publisher-loc>Neufchâtel, Switzerland</publisher-loc>
          <year>2004</year>
        </citation>
      </ref>
      <ref id="B19-water-04-00869">
        <label>19.</label>
        <citation citation-type="web">
          <person-group person-group-type="author">
            <name>
              <surname>Schulla</surname>
              <given-names>J.</given-names>
            </name>
          </person-group>
          <article-title>Hydrologische Modellierung von Fluss-gebieten zur Abschätzung der Folgen von Klimaänderungen (in German), 1997; dx.doi.org/10.3929/ethz-a-001763261; ETH E-Collection</article-title>
          <access-date>(accessed on 1 November 2012)</access-date>
          <comment>Available online:<ext-link xmlns:xlink="http://www.w3.org/1999/xlink" xlink:href="http://e-collection.library.ethz.ch/view/eth:40649" ext-link-type="uri">http://e-collection.library.ethz.ch/view/eth:40649</ext-link></comment>
        </citation>
      </ref>
      <ref id="B20-water-04-00869">
        <label>20.</label>
        <citation citation-type="web">
          <person-group person-group-type="author">
            <name>
              <surname>Schulla</surname>
              <given-names>J.</given-names>
            </name>
            <name>
              <surname>Jasper</surname>
              <given-names>K.</given-names>
            </name>
          </person-group>
          <article-title>WASIM-ETH Model Documentation</article-title>
          <access-date>(accessed on 21 July 2012)</access-date>
          <comment>Available online:<ext-link xmlns:xlink="http://www.w3.org/1999/xlink" xlink:href="http://www.wasim.ch/downloads/doku/wasim/interpolation_meteodata_2009_en.pdf" ext-link-type="uri">http://www.wasim.ch/downloads/doku/wasim/interpolation_meteodata_2009_en.pdf</ext-link></comment>
        </citation>
      </ref>
      <ref id="B21-water-04-00869">
        <label>21.</label>
        <citation citation-type="journal">
          <person-group person-group-type="author">
            <name>
              <surname>Davies</surname>
              <given-names>J.A.</given-names>
            </name>
          </person-group>
          <article-title>A note on the relationship between net radiation and solar radiation</article-title>
          <source>Quart. J. R. Meteorol. Soc.</source>
          <year>1967</year>
          <volume>93</volume>
          <fpage>109</fpage>
          <lpage>115</lpage>
          <pub-id pub-id-type="doi">10.1002/qj.49709339511</pub-id>
        </citation>
      </ref>
      <ref id="B22-water-04-00869">
        <label>22.</label>
        <citation citation-type="gov">
		<collab>Office d’arboriculture du Valais</collab>
          <source>Gestion de l’irrigation en Arboriculture-Rapport Annuel 2008 (in French)</source>
          <publisher-name>Département de l’économie et du Territoire, Service Cantonal d’agriculture</publisher-name>
          <publisher-loc>Sion, France</publisher-loc>
          <year>2008</year>
        </citation>
      </ref>
      <ref id="B23-water-04-00869">
        <label>23.</label>
        <citation citation-type="book">
          <person-group person-group-type="author">
            <name>
              <surname>Goodwin</surname>
              <given-names>I.</given-names>
            </name>
          </person-group>
          <source>Irrigation of Vineyards</source>
          <publisher-name>Institute of Sustainable Agriculture</publisher-name>
          <publisher-loc>Victoria, Tatura, Australia</publisher-loc>
          <year>1995</year>
        </citation>
      </ref>
      <ref id="B24-water-04-00869">
        <label>24.</label>
        <citation citation-type="journal">
          <person-group person-group-type="author">
            <name>
              <surname>Lazzarotto</surname>
              <given-names>P.</given-names>
            </name>
            <name>
              <surname>Calanca</surname>
              <given-names>P.</given-names>
            </name>
            <name>
              <surname>Fuhrer</surname>
              <given-names>J.</given-names>
            </name>
          </person-group>
          <article-title>Dynamics of grass-clover mixtures-An analysis of the response to management with the PROductive GRASsland Simulator (PROGRASS)</article-title>
          <source>Ecol. Model.</source>
          <year>2009</year>
          <volume>220</volume>
          <fpage>703</fpage>
          <lpage>724</lpage>
          <pub-id pub-id-type="doi">10.1016/j.ecolmodel.2008.11.023</pub-id>
        </citation>
      </ref>
      <ref id="B25-water-04-00869">
        <label>25.</label>
        <citation citation-type="journal">
          <person-group person-group-type="author">
            <name>
              <surname>Brisson</surname>
              <given-names>N.</given-names>
            </name>
            <name>
              <surname>Ruget</surname>
              <given-names>F.</given-names>
            </name>
            <name>
              <surname>Gate</surname>
              <given-names>P.</given-names>
            </name>
            <name>
              <surname>Lorgeou</surname>
              <given-names>J.</given-names>
            </name>
            <name>
              <surname>Nicoullaud</surname>
              <given-names>B.</given-names>
            </name>
            <name>
              <surname>Tayot</surname>
              <given-names>X.</given-names>
            </name>
            <name>
              <surname>Plenet</surname>
              <given-names>D.</given-names>
            </name>
            <name>
              <surname>Jeuffroy</surname>
              <given-names>M.H.</given-names>
            </name>
            <name>
              <surname>Bouthier</surname>
              <given-names>A.</given-names>
            </name>
            <name>
              <surname>Ripoche</surname>
              <given-names>D.</given-names>
            </name>
          </person-group>
          <article-title>STICS: A generic model for simulating crops and their water and nitrogen balances. II. Model validation for wheat and maize</article-title>
          <source>Agronomie</source>
          <year>2002</year>
          <volume>22</volume>
          <fpage>69</fpage>
          <lpage>92</lpage>
          <pub-id pub-id-type="doi">10.1051/agro:2001005</pub-id>
        </citation>
      </ref>
      <ref id="B26-water-04-00869">
        <label>26.</label>
        <citation citation-type="journal">
          <person-group person-group-type="author">
            <name>
              <surname>Boland</surname>
              <given-names>A.-M.</given-names>
            </name>
            <name>
              <surname>Bewsell</surname>
              <given-names>D.</given-names>
            </name>
            <name>
              <surname>Kaine</surname>
              <given-names>G.</given-names>
            </name>
          </person-group>
          <article-title>Adoption of sustainable irrigation management practices by stone and pome fruit growers in the Goulburn/Murray Valleys, Australia</article-title>
          <source>Irrig. Sci.</source>
          <year>2006</year>
          <volume>24</volume>
          <fpage>137</fpage>
          <lpage>145</lpage>
          <pub-id pub-id-type="doi">10.1007/s00271-005-0017-5</pub-id>
        </citation>
      </ref>
      <ref id="B27-water-04-00869">
        <label>27.</label>
        <citation citation-type="web">
          <person-group person-group-type="author">
            <name>
              <surname>Bravin</surname>
              <given-names>E.</given-names>
            </name>
            <name>
              <surname>Hofmann</surname>
              <given-names>M.D.</given-names>
            </name>
            <name>
              <surname>Monney</surname>
              <given-names>P.</given-names>
            </name>
          </person-group>
          <article-title>Klimaveränderung: Welche Zunahme der Bewässerungskosten in der Apfelproduktion ist tragbar (in German)</article-title>
          <source>Schweiz. Ges. Agrarwirtsch. Agrarsoziol</source>
          <year>2008</year>
          <fpage>133</fpage>
          <lpage>160</lpage>
          <access-date>(accessed on 1 November 2012)</access-date>
          <comment>Available online:<ext-link xmlns:xlink="http://www.w3.org/1999/xlink" xlink:href="www.volkskunde.ch/dms/agrarwirtschaft/Internetseite/Yearbook/Ausgaben/Yearbook-2008/06_Bravin_neu-_4_/Esther-Bravin.pdf" ext-link-type="uri">www.volkskunde.ch/dms/agrarwirtschaft/Internetseite/Yearbook/Ausgaben/Yearbook-2008/06_Bravin_neu-_4_/Esther-Bravin.pdf</ext-link></comment>
        </citation>
      </ref>
      <ref id="B28-water-04-00869">
        <label>28.</label>
        <citation citation-type="journal">
          <person-group person-group-type="author">
            <name>
              <surname>Zurwerra</surname>
              <given-names>R.</given-names>
            </name>
          </person-group>
          <article-title>Die Wiesebbewässerung im Wallis-Zwischen tradition und moderne (in German)</article-title>
          <source>Géomat. Suisse</source>
          <year>2010</year>
          <volume>10</volume>
          <fpage>454</fpage>
          <lpage>457</lpage>
        </citation>
      </ref>
      <ref id="B29-water-04-00869">
        <label>29.</label>
        <citation citation-type="journal">
          <person-group person-group-type="author">
            <name>
              <surname>Schär</surname>
              <given-names>C.</given-names>
            </name>
            <name>
              <surname>Vidale</surname>
              <given-names>P.L.</given-names>
            </name>
            <name>
              <surname>Lüthi</surname>
              <given-names>D.</given-names>
            </name>
            <name>
              <surname>Frei</surname>
              <given-names>C.</given-names>
            </name>
            <name>
              <surname>Häberli</surname>
              <given-names>C.</given-names>
            </name>
            <name>
              <surname>Liniger</surname>
              <given-names>M.A.</given-names>
            </name>
            <name>
              <surname>Appenzeller</surname>
              <given-names>C.</given-names>
            </name>
          </person-group>
          <article-title>The role of increasing temperature variability in European summer heatwaves</article-title>
          <source>Nature</source>
          <year>2004</year>
          <volume>427</volume>
          <fpage>332</fpage>
          <lpage>336</lpage>
        <pub-id pub-id-type="doi">10.1038/nature02300</pub-id><pub-id pub-id-type="pmid">14716318</pub-id></citation>
      </ref>
    </ref-list>
  </back>
</article>
