The CO2 Emission Factor of Water in Japan

ESG Promotion Department, TOTO LTD, 2-1-1, Nakashima, Kokurakita-ku, Kitakyushu 802-8601, Japan
*
Author to whom correspondence should be addressed.
Water 2012, 4(4), 759-769; https://doi.org/10.3390/w4040759
Submission received: 9 August 2012
/
Revised: 23 September 2012
/
Accepted: 24 September 2012
/
Published: 28 September 2012
(This article belongs to the Special Issue Sustainable Wastewater Treatment and Pollution Control)
Abstract
:From the viewpoint of combating global warming in Japan, measures to reduce emissions from the activities involved in daily life have been accelerated in concurrence with the efforts made in the industrial sector to save energy. As one such measure, the reduction of energy consumption in waterworks and sewer systems by reducing the volume of water used in the housing sector is gaining attention; measures for the conversion of water saving into CO2 reduction credit in the domestic credit system are also being examined. To address the credit development for CO2 reduction by water saving, it was necessary to determine the CO2 emission factor for water. Hence, we calculated the CO2 emission factor of water use in Japan and determined the value to be 0.376 kg CO2/m3 which applied the generating end electricity value. In addition, since electricity contributes to 90% of the energy consumption of the waterworks and sewer systems of Japan and since the emission factor for electricity changes with the power source composition ratio, the CO2 emission factor for water also needs to be updated to match the emission factor for electricity. We therefore developed a calculation equation for updating this emission factor.
1. Introduction
With the first commitment period of the Kyoto Protocol (2012) coming to an end, the United Nations Framework Convention on Climate Change will enter a new stage. Japan has accepted the responsibility to reduce greenhouse gases (GHGs [1], hereafter referred to as CO2 to represent all the gases) by 6% compared to the value in 1990 during the first commitment period of the Kyoto Protocol. However, Japan was compelled to change its energy policy in the aftermath of the earthquake disaster and the subsequent accident at the nuclear power plant. Japan then declared its inability to participate in the second commitment period of the Kyoto Protocol. As regards progress in the plan to address the objectives of the Kyoto Protocol, the Ministry of the Environment reported that although the targets had been met up to 2010, emission in the housing sector increased dramatically while the emission in the industrial sector decreased compared to the 1990 value, which is the base year for the Kyoto Protocol. The emission increased by 34.8% in the housing sector in the fiscal year (FY) 2010, and the efforts to reduce CO2 emission from households may determine the progress that Japan can achieve with regard to the plan against the background of the resumed operation of thermal power plants after the earthquake disaster.
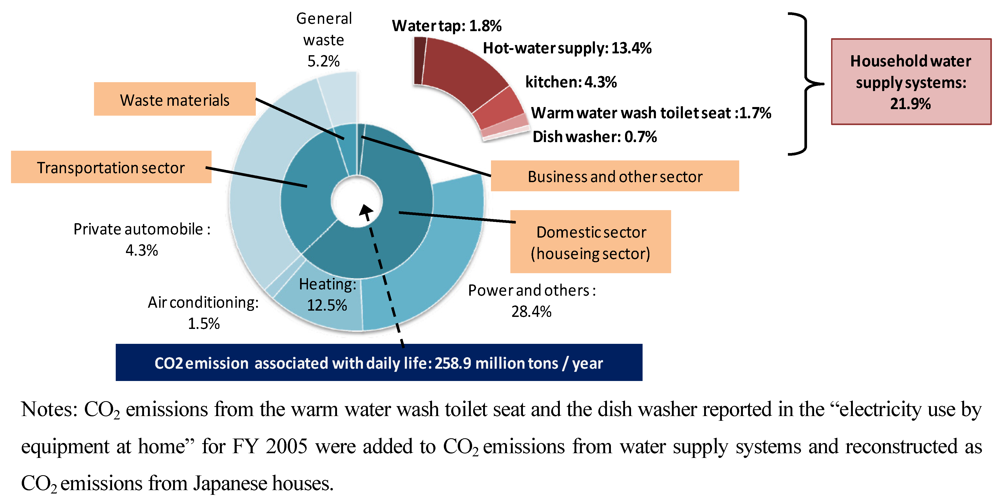
The breakdown of CO2 emission from households in Japan is shown in Figure 1. The main sources of emission are automobiles, household electric appliances, and residential plumbing equipment. The Eco-Car Tax Reduction was started in FY 2009, and a subsidy called the Eco-Point system to help retrofit the appliances with more efficient them in FY 2010; both policies aim to promote the replacement of less efficient products with the latest high-energy-efficiency them and thus realize a reduction in CO2 emission from automobiles and household electric appliances.
Figure 1.
Breakdown of CO2 emission from Japanese houses.

In recent years, researches associated water use and CO2 emissions have been performed globally [2,3,4]. In Japan, research relating water-saving performance of bathroom fixtures such as toilets and showers with CO2 reduction has also progressed, and the fact that the widespread use of water-saving fixtures can be effective in CO2 reduction has been recognized [5,6]. Housing-Eco-Point subsidies have since been introduced to promote the replacement of traditional toilets with water-saving ones since January 2011.
CO2 reduction by the widespread use of energy-saving household electric appliances and water-saving equipment is also being considered for inclusion in the Domestic Clean Development Mechanism (CDM) and Bilateral Offset Credit Mechanism, which some of the methods adopted to realize the Government of Japan’s objective of CO2 emission reduction [7,8].
Carbon credits are calculated by measuring the reduction in the energy consumption or the amount of water saved by replacing conventional equipment with energy-saving or water-saving products, and multiplying this value with the CO2 emission factor to convert the values into the amount of CO2. The latest value of the CO2 emission factor for electricity is announced every year by the Federation of Electric Power Companies Japan, and this value is utilized widely for calculating carbon credit conversion factors, CO2 emission reports from the industries in the Keidanren Voluntary Action Plan on the Environment, etc.
The only known value of the CO2 emission factor for water is 0.59 kg CO2/m3, which was mentioned in the Environment Agency of Japan Household Keeping Book in 1996 [9]; it was derived from the energy consumption of waterworks and sewer systems. It was later updated as a value only for the waterworks, and has not been updated since. Considering that electricity contributes over 90% of the energy required for the operating of waterworks and sewer systems and that the CO2 emission factor for electricity changes annually depending on the composition ratio of the type of power-generation processes, such as nuclear and thermal power generations, the CO2 emission factor derived from energy consumption should also be reexamined every year [10].
We therefore examined the CO2 emission factor for water—in order to include it in the method for realizing carbon credits—by converting the volume of water saved into a reduction in CO2 emission.
2. Analysis
The operation data for each treatment facility with boundary areas, as shown in Figure 2, are declared annually for the waterworks and sewer systems in Japan as Waterworks Statistics [11] and Sewerage Statistics [12]. Using these statistical values, we analyzed the energy consumption per cube meter treatment (described as energy consumption rate below) of water treatment in each waterworks and sewer system from FY 1990 to 2008.
Figure 2.
Calculation boundary for CO2 emission factor of water.

For electricity, the energy consumption can be converted into CO2 emission by using the CO2 emission factor per unit energy consumption. Along similar lines, we examined whether it was possible to introduce a CO2 emission factor for unit volume of water used. That is, we examined whether energy consumption and water treatment volume were proportional in waterworks and sewer systems.
3. Results and Discussion
3.1. Waterworks System
The rate of increase in water supply coverage in Japan shows a monotonous increase by 2.8% from 94.7% in 1990 to 97.5% in 2008; its population increased by 3.4% from 123.53 million to 127.78 million in 2006, but stopped increasing thereafter. In spite of the factors that may cause an increase in water consumption, the amount of water supply (effective water volume) increased from 14.7 billion m3/year in 1990 to quickly peak at 15.5 billion m3/year in 1998, and thereafter. It has shown a decreasing trend owing to the widespread use of water-saving systems, etc. These changes in water supply are shown in Figure 3 along with the changes in the overall energy consumption of the entire waterworks systems in Japan.
Figure 3.
Generated fresh water volumes and electricity consumptions for all water works in Japan.

We analyzed these values to check whether the amount of fresh water generated and energy consumption were proportional. For energy consumption of whole waterworks, systems mainly consist of electricity (energy consumption ratio of electricity and fuel was 95:5). Fuel was thought to be used for drying and incineration of the sludge produced from water purification processes. Since the sludge treatment occurred with every purification method, the electricity and fuel use ratios in each processing method were regarded as the same. In addition, fuel consumption data of each facility was not reported. Therefore, analysis of the energy of the waterworks system in this research was only conducted as concerns electricity.
The breakdown of electricity consumption during the process is shown in Figure 4; Figure 5 shows the breakdown of the adopted water treatment processes by facility; and the breakdown of electricity consumption rate by facility and by treatment facility scale (treated water volume) is shown in Figure 6. Contrary to the expectation that the electricity consumption rate for treatment would vary dramatically among different water treatment methods, ranging from disinfection only to membrane filtration, we could not find any correlation between the electricity consumption rate of the facility and the treatment method, treated water volume, etc. in the same fiscal year data.
Figure 4.
Breakdown of energy consumption for waterworks in Japan.

Figure 5.
Adoption ratio of treatment processes for waterworks in Japan.
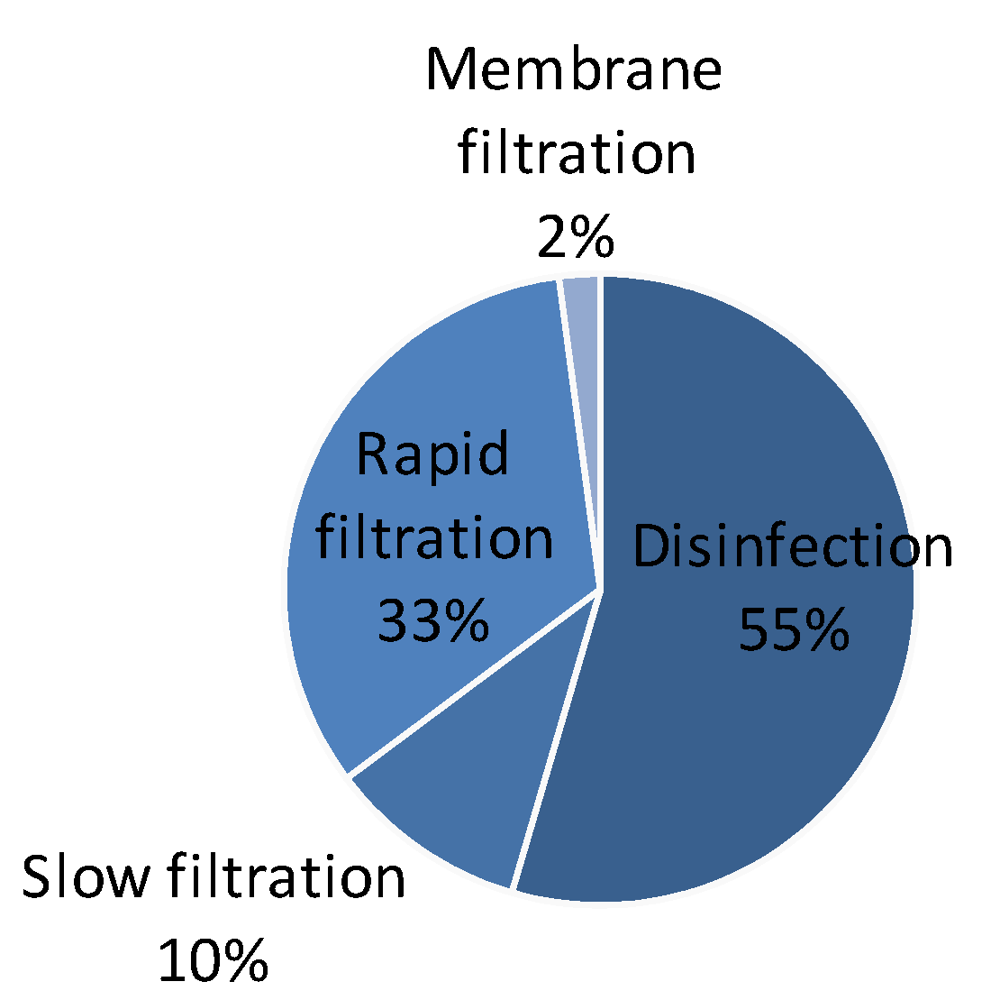
Figure 6.
Relationship between energy consumption rates and treated water volumes of waterworks facilities in Japan.
Figure 6.
Relationship between energy consumption rates and treated water volumes of waterworks facilities in Japan.

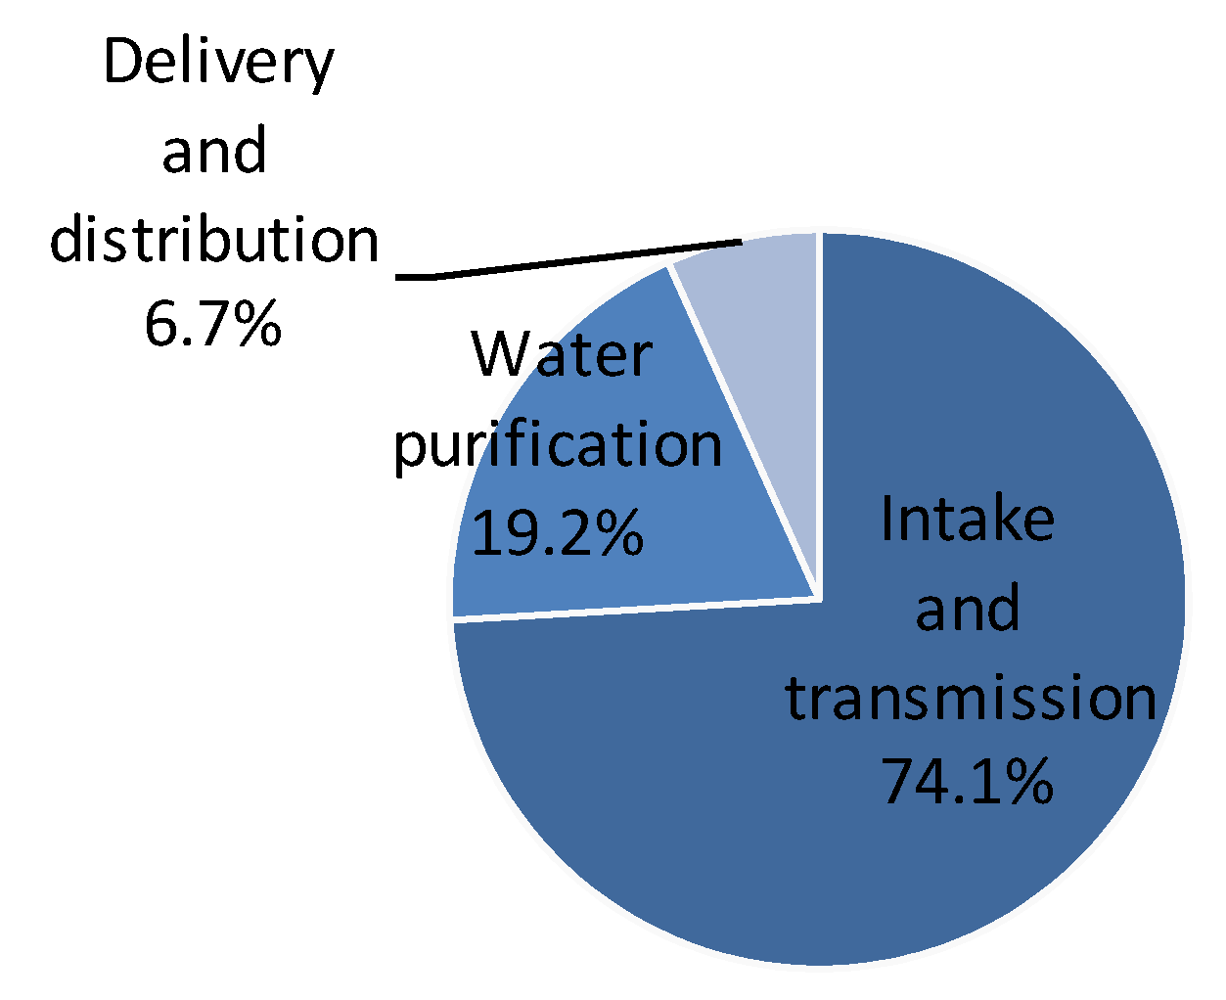
This was because of the fact that the overall electricity consumption at each facility was dominated by pumping and feeding processes, as described as intake, transmission delivery and distribution in Figure 4, as 81%, and that the electricity consumption of these pumping and feeding processes varied with the facility characteristics, such as water distribution. We thus studied the relationship between the average treatment consumption rate for all facilities in a fiscal year and the water treatment volume in order to compare the consumption rates for identical facility characteristics. The results are presented in Figure 7.
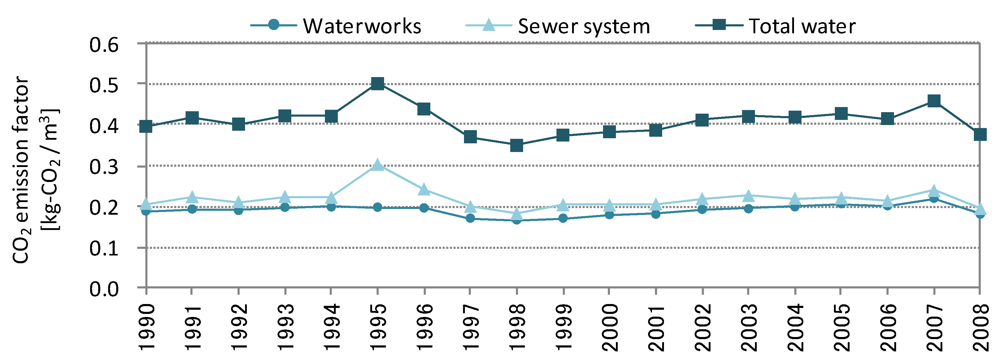
The results show that the water volume and the electricity consumption of the system are proportional to each other. As the pumping energy, which is attributed to 81% of the electricity consumption of the waterworks system, is proportional to the volume of water, by analogy the electricity consumed in the water purification processes can be considered to be proportional to the volume of water; thus, it is possible to determine a CO2 emission factor for water in waterworks systems on the basis of the volume of water. The CO2 emission factors for water are shown in Figure 8. For calculation, the emission factor of electricity was adopted as the average value for all power sources in Japan at the generating end and fuel consumption was taken into consideration.
Figure 7.
Relationship between electricity consumption and treated water volume for waterworks.
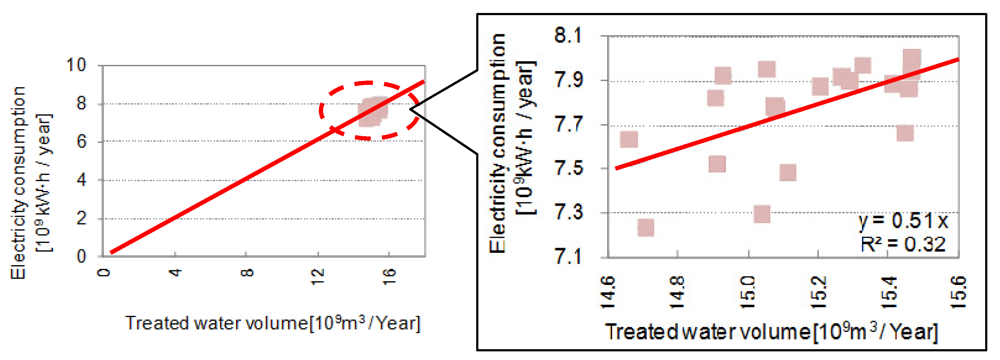
Figure 8.
CO2 emission factor of water in Japan incorporating the generating end electricity factor.
Figure 8.
CO2 emission factor of water in Japan incorporating the generating end electricity factor.

3.2. Sewer System
In the sewer system, fuel consumption occupied a bigger ratio than a waterworks, at 10%. The electricity and fuel consumption data for all facilities was released by the Sewerage Statistics. The energy consumption, which added electricity and fuel together, was then studied for the sewer system.
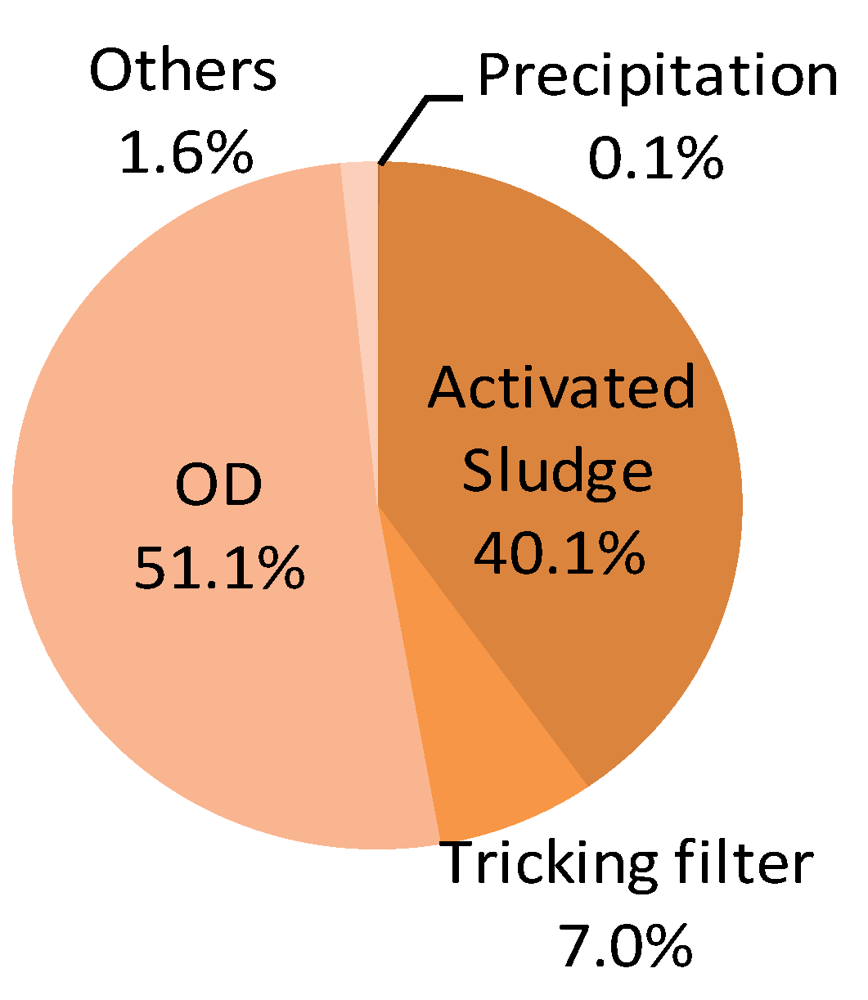
The breakdown of energy consumption of the sewer systems and that for the treatment processes adopted by the facility is shown in Figure 9 and Figure 10, respectively. The processes can be largely classified into water feeding process, conversion of biochemical oxygen demand (BOD) into sludge and water purification, and the concentration and disposal of the converted sludge. Although the energy consumption during the water feeding process, which contributes to 21% of the total energy consumption, is assumed to be proportional to the volume of water, we expected that the energy consumption during purification and sludge treatment would depend on both the amount of BOD (pollution load) and the volume of water.
Figure 9.
Energy consumption ratio of sewer systems in Japan.
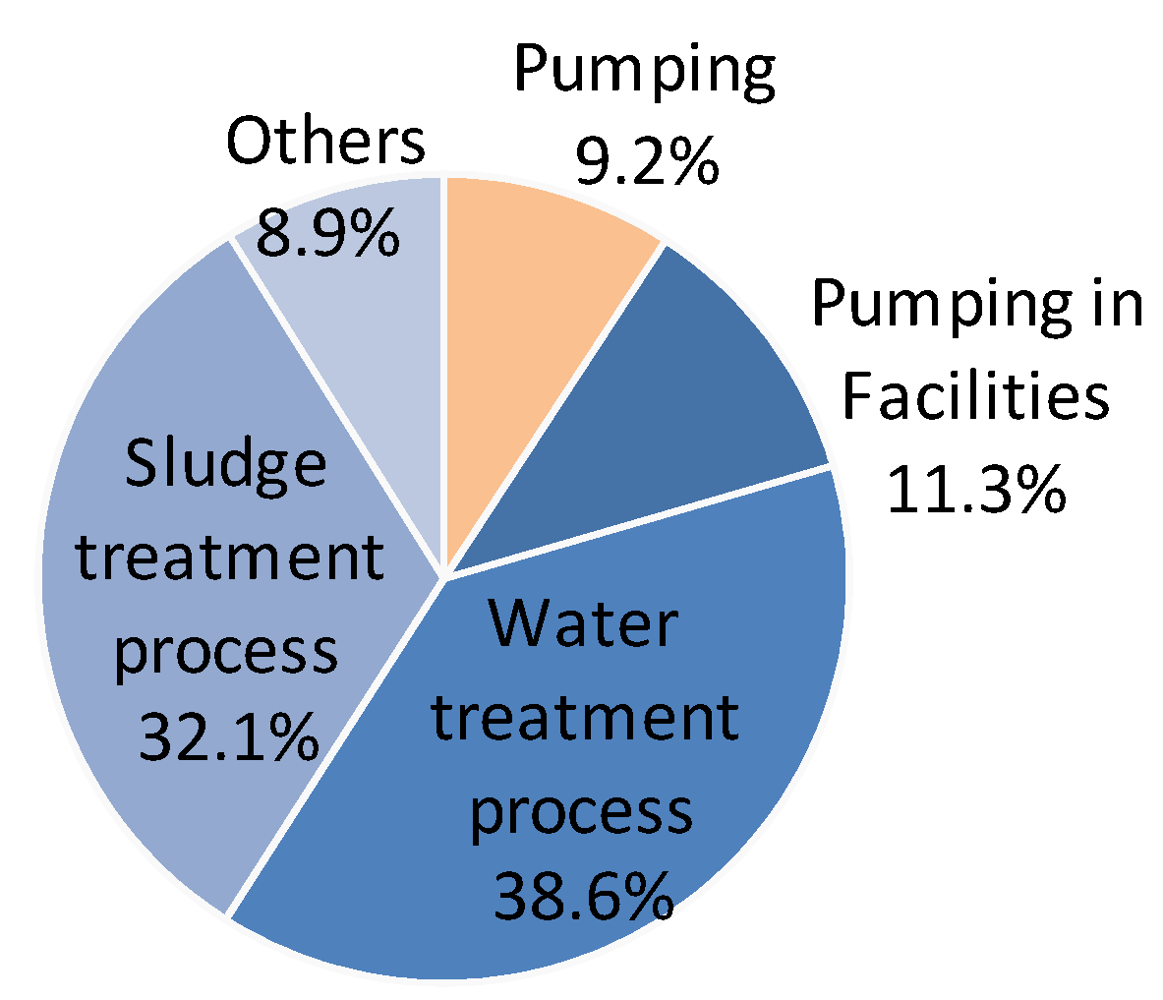
Figure 10.
Adoption ratio of treatment processes in sewer systems in Japan.
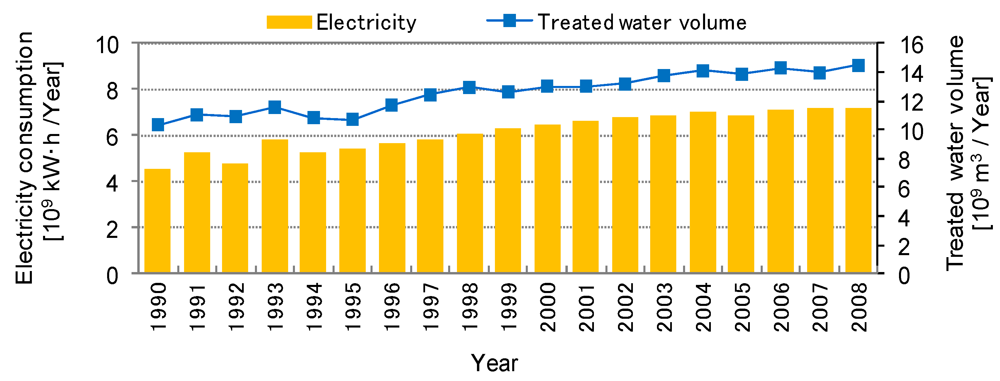
Since the amount of pollution load generated by households does not change even when water saving measures are adopted for residential systems, we used the operation data to analyze the factors that may affect energy consumption of the sewerage treatment systems when water-saving measures are popularized. The changes in the volume of water treated and in energy consumption of the sewer systems in Japan are presented in Figure 11. Owing to the increase in the coverage of the sewerage system, the water treatment volume increased by 40% since 1990. The relationship between energy consumption and water treatment volume, as observed from the data shown in Figure 11, is plotted in Figure 12. While energy consumption was proportional to the volume of water for all systems, the total pollution load also increased in proportion to the volume of water. We therefore analyzed this in detail.
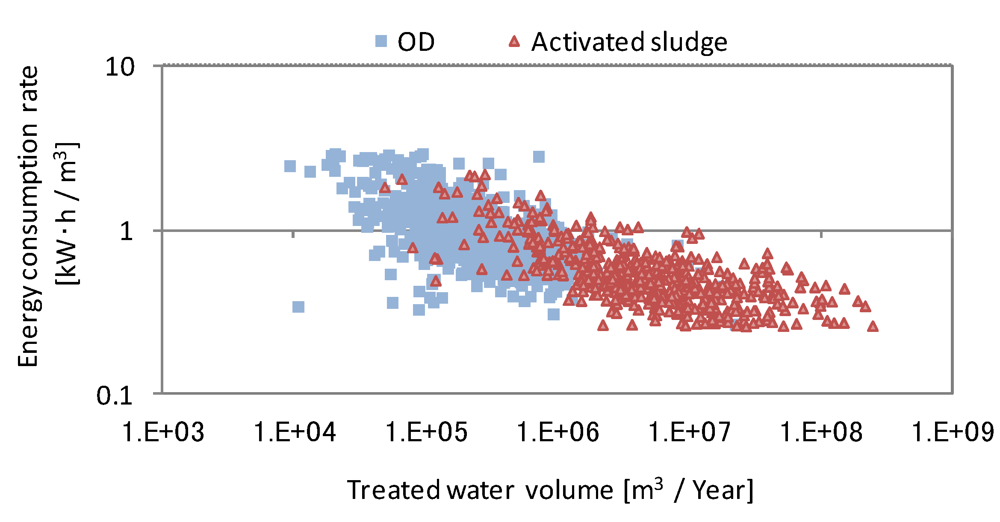
We analyzed the effect of the treated water volume of the facilities on the energy consumption rate based on the data from FY 2008. The results are presented in Figure 13; the energy consumption rate clearly varies depending on the treated water volume in sewer systems. To homogenize the effects of the treated water volume, we extracted data on facilities with treatment capacities of 100 to 500 km3/year and studied the relationship between the influent BOD concentration and energy consumption. While the influent BOD concentration into sewerage treatment facilities varied from about 90 to 380 kg/m3 depending on the facility, there was no correlation between the influent BOD concentration and energy consumption.
Figure 11.
Treated wastewater volumes and electricity consumptions for all sewer systems in Japan.

Figure 12.
Relationship between energy consumption and treated wastewater volume for sewer systems.
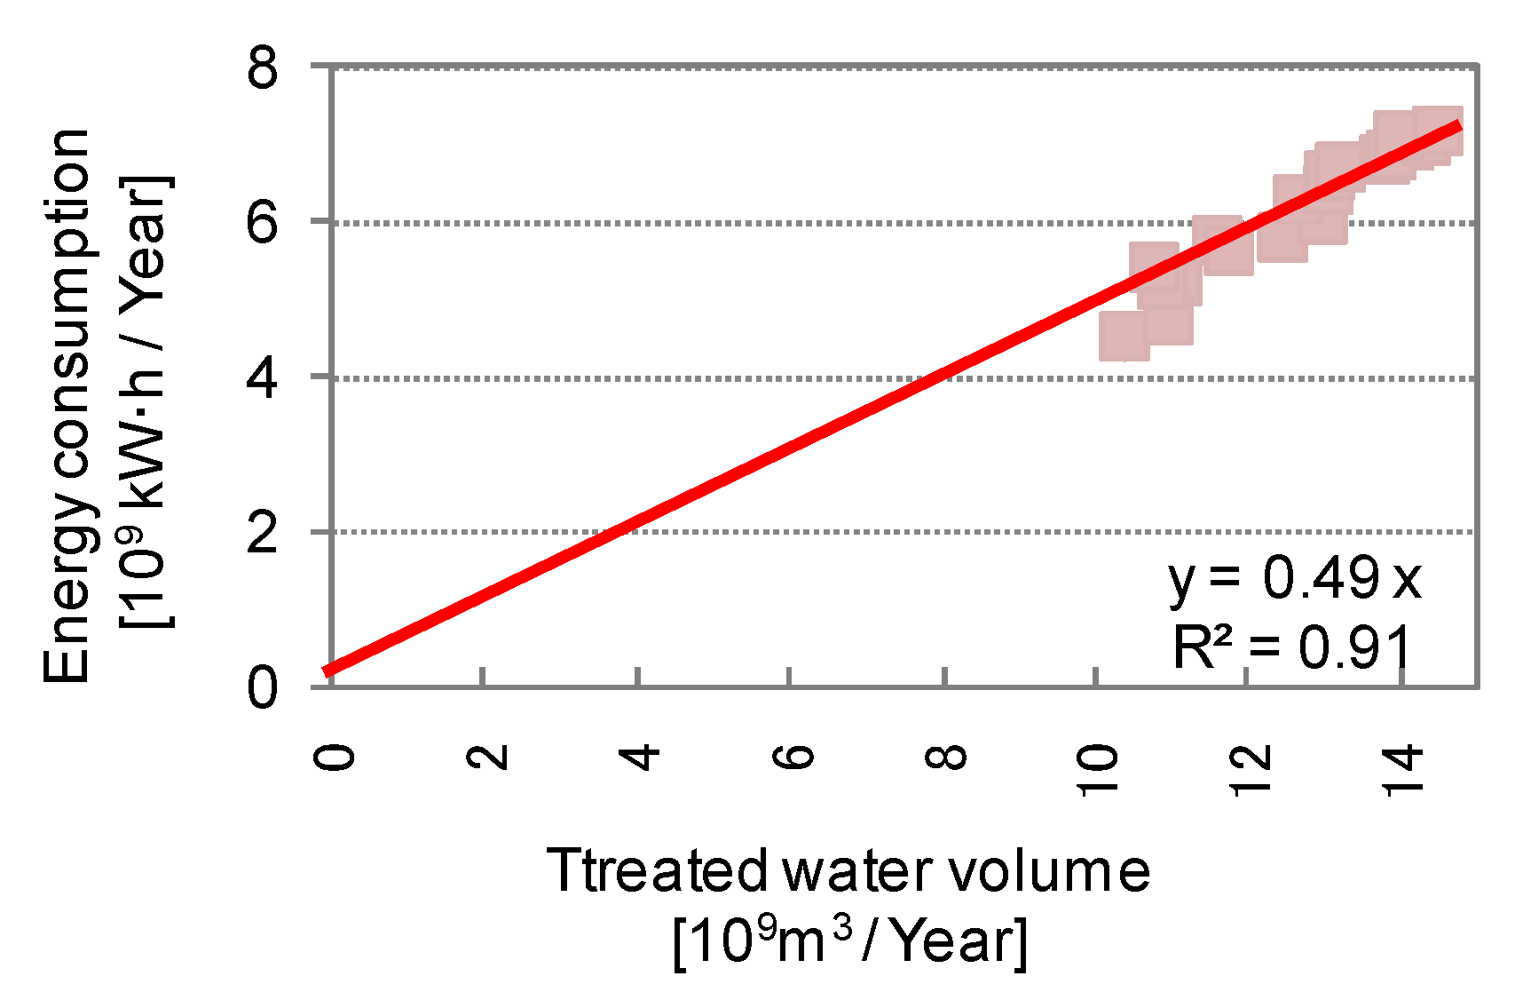
Figure 13.
Relationship between energy consumption rates and treated wastewater volumes for sewer systems in Japan.
Figure 13.
Relationship between energy consumption rates and treated wastewater volumes for sewer systems in Japan.

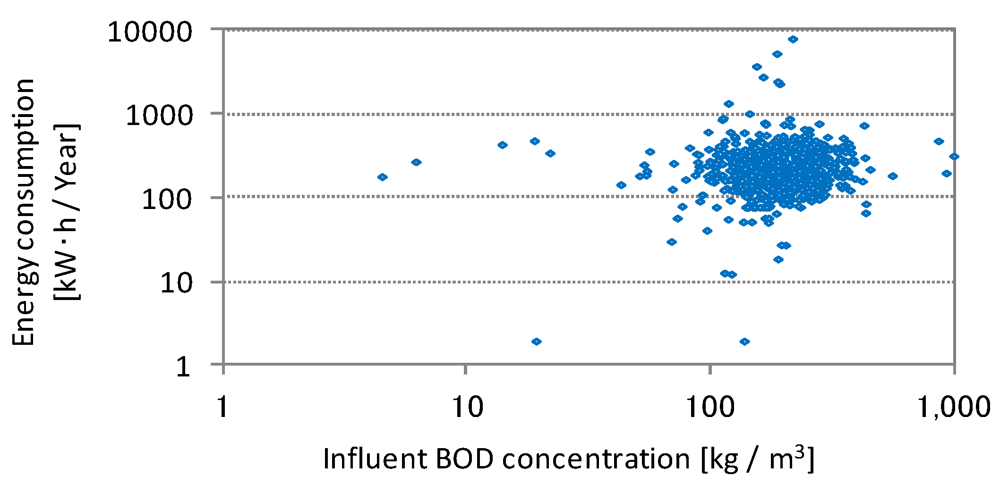
We found that energy consumption converged to a certain value (Figure 14). Thus, we concluded that the energy consumption of each facility can be considered to depend largely on the volume of water treated and that there is little effect of the changes in influent BOD concentration on the energy consumption.
On the basis of the above results, we surmised that the energy consumption of sewer systems is also proportional to the volume of water in the range of volume changes that can be expected to result from the adoption of water-saving measures, etc. in the future. The changes in the CO2 emission factor for the sewer systems are shown in Figure 8. For this calculation, electricity and fuel consumption was taken into consideration.
The changes in influent sewage volume and BOD concentration fluctuate dramatically with time. On the other hand, the volume of processed water released from the system is controlled so that the effluent regulations including a BOD of less than 20 kg/m3 are ensured. Thus, the sewer systems can be considered highly stable against external disturbances in water volume, pollution load, etc. Although we assume that the effects of an increase in pollution load resulting from water-saving measures are not noticeable because of the highly stable nature of the system, we await the results of future studies to identify the detailed mechanism explaining the stability of the system to changes in pollution load.
Figure 14.
Relationship between energy consumptions and influent BOD concentrations for sewerage treatment facilities.
Figure 14.
Relationship between energy consumptions and influent BOD concentrations for sewerage treatment facilities.

3.3. CO2 Emission Factor for Water
We found that energy consumption was proportional to the volume of water treated in both waterworks and sewer systems; the latest CO2 emission factors for water are shown in Table 1. For the calculation, the emission factor of electricity was adopted as the average value for all power sources in Japan at the both receiving and generating ends by assuming its application in CDM and Bilateral Offset Credit Mechanism. The calculated energy consumption rate value was about the same value as foreign countries values, such as Taiwan of 0.78 kWh/m3 [13], UK of 0.98 kWh/m3 [14] and China of 1.37 kWh/m3 [15]. Detailed analysis will be conducted by future research.

| Treatment process | Energy consumption rate (kWh/m3) | CO2 emission factor of water (kg CO2/m3) | |
|---|---|---|---|
| Calculated with generating end electricity (0.335 kg CO2/kW∙h) | Calculated with receiving end electricity (0.373 kg CO2/kW∙h) | ||
| Waterworks system | 0.499 | 0.181 | 0.201 |
| Sewer system | 0.512 | 0.195 | 0.214 |
| Total | 1.012 | 0.376 | 0.415 |
In the future, it will be possible to update the CO2 emission factor for water using Equation (1) and the latest values from Waterworks Statistics, Sewerage Statistics, and CO2 emission factor for electricity, which are updated annually.
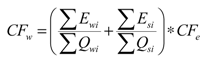
where CFw is CO2 emission factor for water (kg CO2/m3); CFe is CO2 emission factor for electricity (kg CO2/kWh); Ewi is energy consumption by waterworks system (kW·h/year); Esi is energy consumption by sewer system (kW∙h/year); Qwi is volume of fresh water generation by waterworks (m3/year); Qsi is volume of water treated by sewer system (m3/year).
In structures such as apartment buildings and office buildings, water supplied from the waterworks is first accumulated in water tanks and then distributed to each residential unit or equipment by using pumps. Since the energy consumption for pumping in buildings could not be standardized, it is not included in the range of calculation in this study. Further study along these lines will be necessary in the future.
4. Conclusions
Conventionally in Japan, studies on future prediction of CO2 reduction effect by widespread use of water-saving equipment was implemented on the basis of the CO2 emission factor for water (0.59 kg CO2/m3), as announced by the Environment Agency of Japan. However, no reports on points such as the basis of calculation were published, making it difficult to verify the data, including whether there was a proportional relationship to the volume of water.
In this study, we confirmed that it was possible to determine a CO2 emission factor for water as a value proportional to the volume of water. We successfully established a procedure to update the latest value, making possible the development of a methodology for the conversion the water saving volume directly into CO2 reduction and thus, into carbon credit.
With regard to the developing countries in Asia, measures to conserve water resources and remedial measures for global warming are urgent issues because of rapid urbanization. The widespread use of water saving fittings is a solution for these issues. In addition, the realization of a carbon credit by water saving can become a means to tell society the co-benefit of it intelligibly. Therefore, there are high expectations on the realization of carbon credits through water saving measures, as evident from the joint implementation of a study by Japan and China to evaluate the potentials of the Bilateral Offset Credit System. This result of research expects to lead to realization of the carbon credits by water saving globally.
References
- The Greenhouse Gas Inventory Office of Japan—The GHGs Emissions Data of Japan (1990–2010). Available online: http://www-gio.nies.go.jp/aboutghg/nir/nir-j.html (accessed on 28 June 2012).
- Kenwey, S.J.; Priestly, A.; Cook, S.; Inman, M.; Gregory, A.; Hall, M. Energy Use in the Provision and Consumption of Urban Water in Australia and New Zealand; Water Services Association of Australia (WSAA): Sydney, Australia, 2008. Available online: http://www.csiro.au/files/files/pntk.pdf (accessed on 28 June 2012).
- Hackett, M.J.; Gray, N.F. Carbon dioxide emission savings potential of household water use reduction in the UK. J. Sustain. Dev. 2009, 2, 36–43. [Google Scholar]
- Walker, G. Water and energy use efficiency are increasingly linked. Energy World 2009, 369, 18–19. [Google Scholar]
- Yasutoshi, S.; Kanako, T. The economic and environmental impact of remodeling in the case of a water-saving toilet bowl (in Japanese). J. Soc. Heat. Air-Cond. Sanit. Eng. Jpn. 2009, 152, 9–14. [Google Scholar]
- Yasutoshi, S.; Kanako, T.; Kiyoshi, N. Prediction of CO2 emission associated with residential plumbing equipment (in Japanese). J. Soc. Heat. Air-Cond. Sanit. Eng. Jpn. 2010, 163, 11–18. [Google Scholar]
- Domestic Clean Development Mechanism (in Japanese). Available online: http://jcdm.jp/process/methodology.html (accessed on 24 September 2012).
- New Mechanism Information Platform (in Japanese). Available online: http://www.mmechanisms.org/initiatives/index.html (accessed on 24 September 2012).
- The Environment Agency of Japan, Environmental Household keeping Book (in Japanese); The Environment Agency of Japan: Tokyo, Japan, 1996.
- Keidanren (Japan Business Federation). Voluntary Action Plan on the Environment, the Electricity Emission Factor in Global Warming Countermeasure (in Japanese); Japan Business Federation: Tokyo, Japan, 2012. Available online: http://www.keidanren.or.jp/japanese/policy/2011/113/honbun.pdf (accessed on 24 September 2012).
- Japan Water Works Association, Waterworks Statistics 1990–2008 (in Japanese); Japan Water Works Association: Tokyo, Japan; pp. 1990–2008.
- Japan Sewage Works Association, Sewerage Statistics 1990–2008 (in Japanese); Japan Sewage Works Association: Tokyo, Japan; pp. 1990–2008.
- Cheng, C.L.; Liao, W.J.; Liu, Y.C.; Tseng, Y.C.; Chen, H.J. Evaluation of CO2 emission for saving water strategies. In Proceedings of 38th International Symposium of CIB W062 on Water Supply and Drainage for Buildings, Edinburgh, UK, 27–30 August 2012.
- Thames Water. Corporate Responsibility Report 2009/10. Available online: http://www.thameswater.co.uk/cr/ (accessed on 24 September 2012).
- Toyosada, K.; Shimizu, Y.; Dejima, S.; Yoshitaka, M.; Sakaue, K. Evaluation of the potential of CO2 emission reduction achieved by using water-efficient housing equipment in Dalian, China. In Proceedings of 38th International Symposium of CIB W062 on Water Supply and Drainage for Buildings, Edinburgh, UK, 27–30 August 2012.
© 2012 by the authors; licensee MDPI, Basel, Switzerland. This article is an open-access article distributed under the terms and conditions of the Creative Commons Attribution license (http://creativecommons.org/licenses/by/3.0/).
Share and Cite
MDPI and ACS Style
Shimizu, Y.; Dejima, S.; Toyosada, K. The CO2 Emission Factor of Water in Japan. Water 2012, 4, 759-769. https://doi.org/10.3390/w4040759
AMA Style
Shimizu Y, Dejima S, Toyosada K. The CO2 Emission Factor of Water in Japan. Water. 2012; 4(4):759-769. https://doi.org/10.3390/w4040759
Chicago/Turabian StyleShimizu, Yasutoshi, Satoshi Dejima, and Kanako Toyosada. 2012. "The CO2 Emission Factor of Water in Japan" Water 4, no. 4: 759-769. https://doi.org/10.3390/w4040759