Chemical Quality Status of Rivers for the Water Framework Directive: A Case Study of Toxic Metals in North West England

Abstract
:1. Introduction
2. Materials and Methods
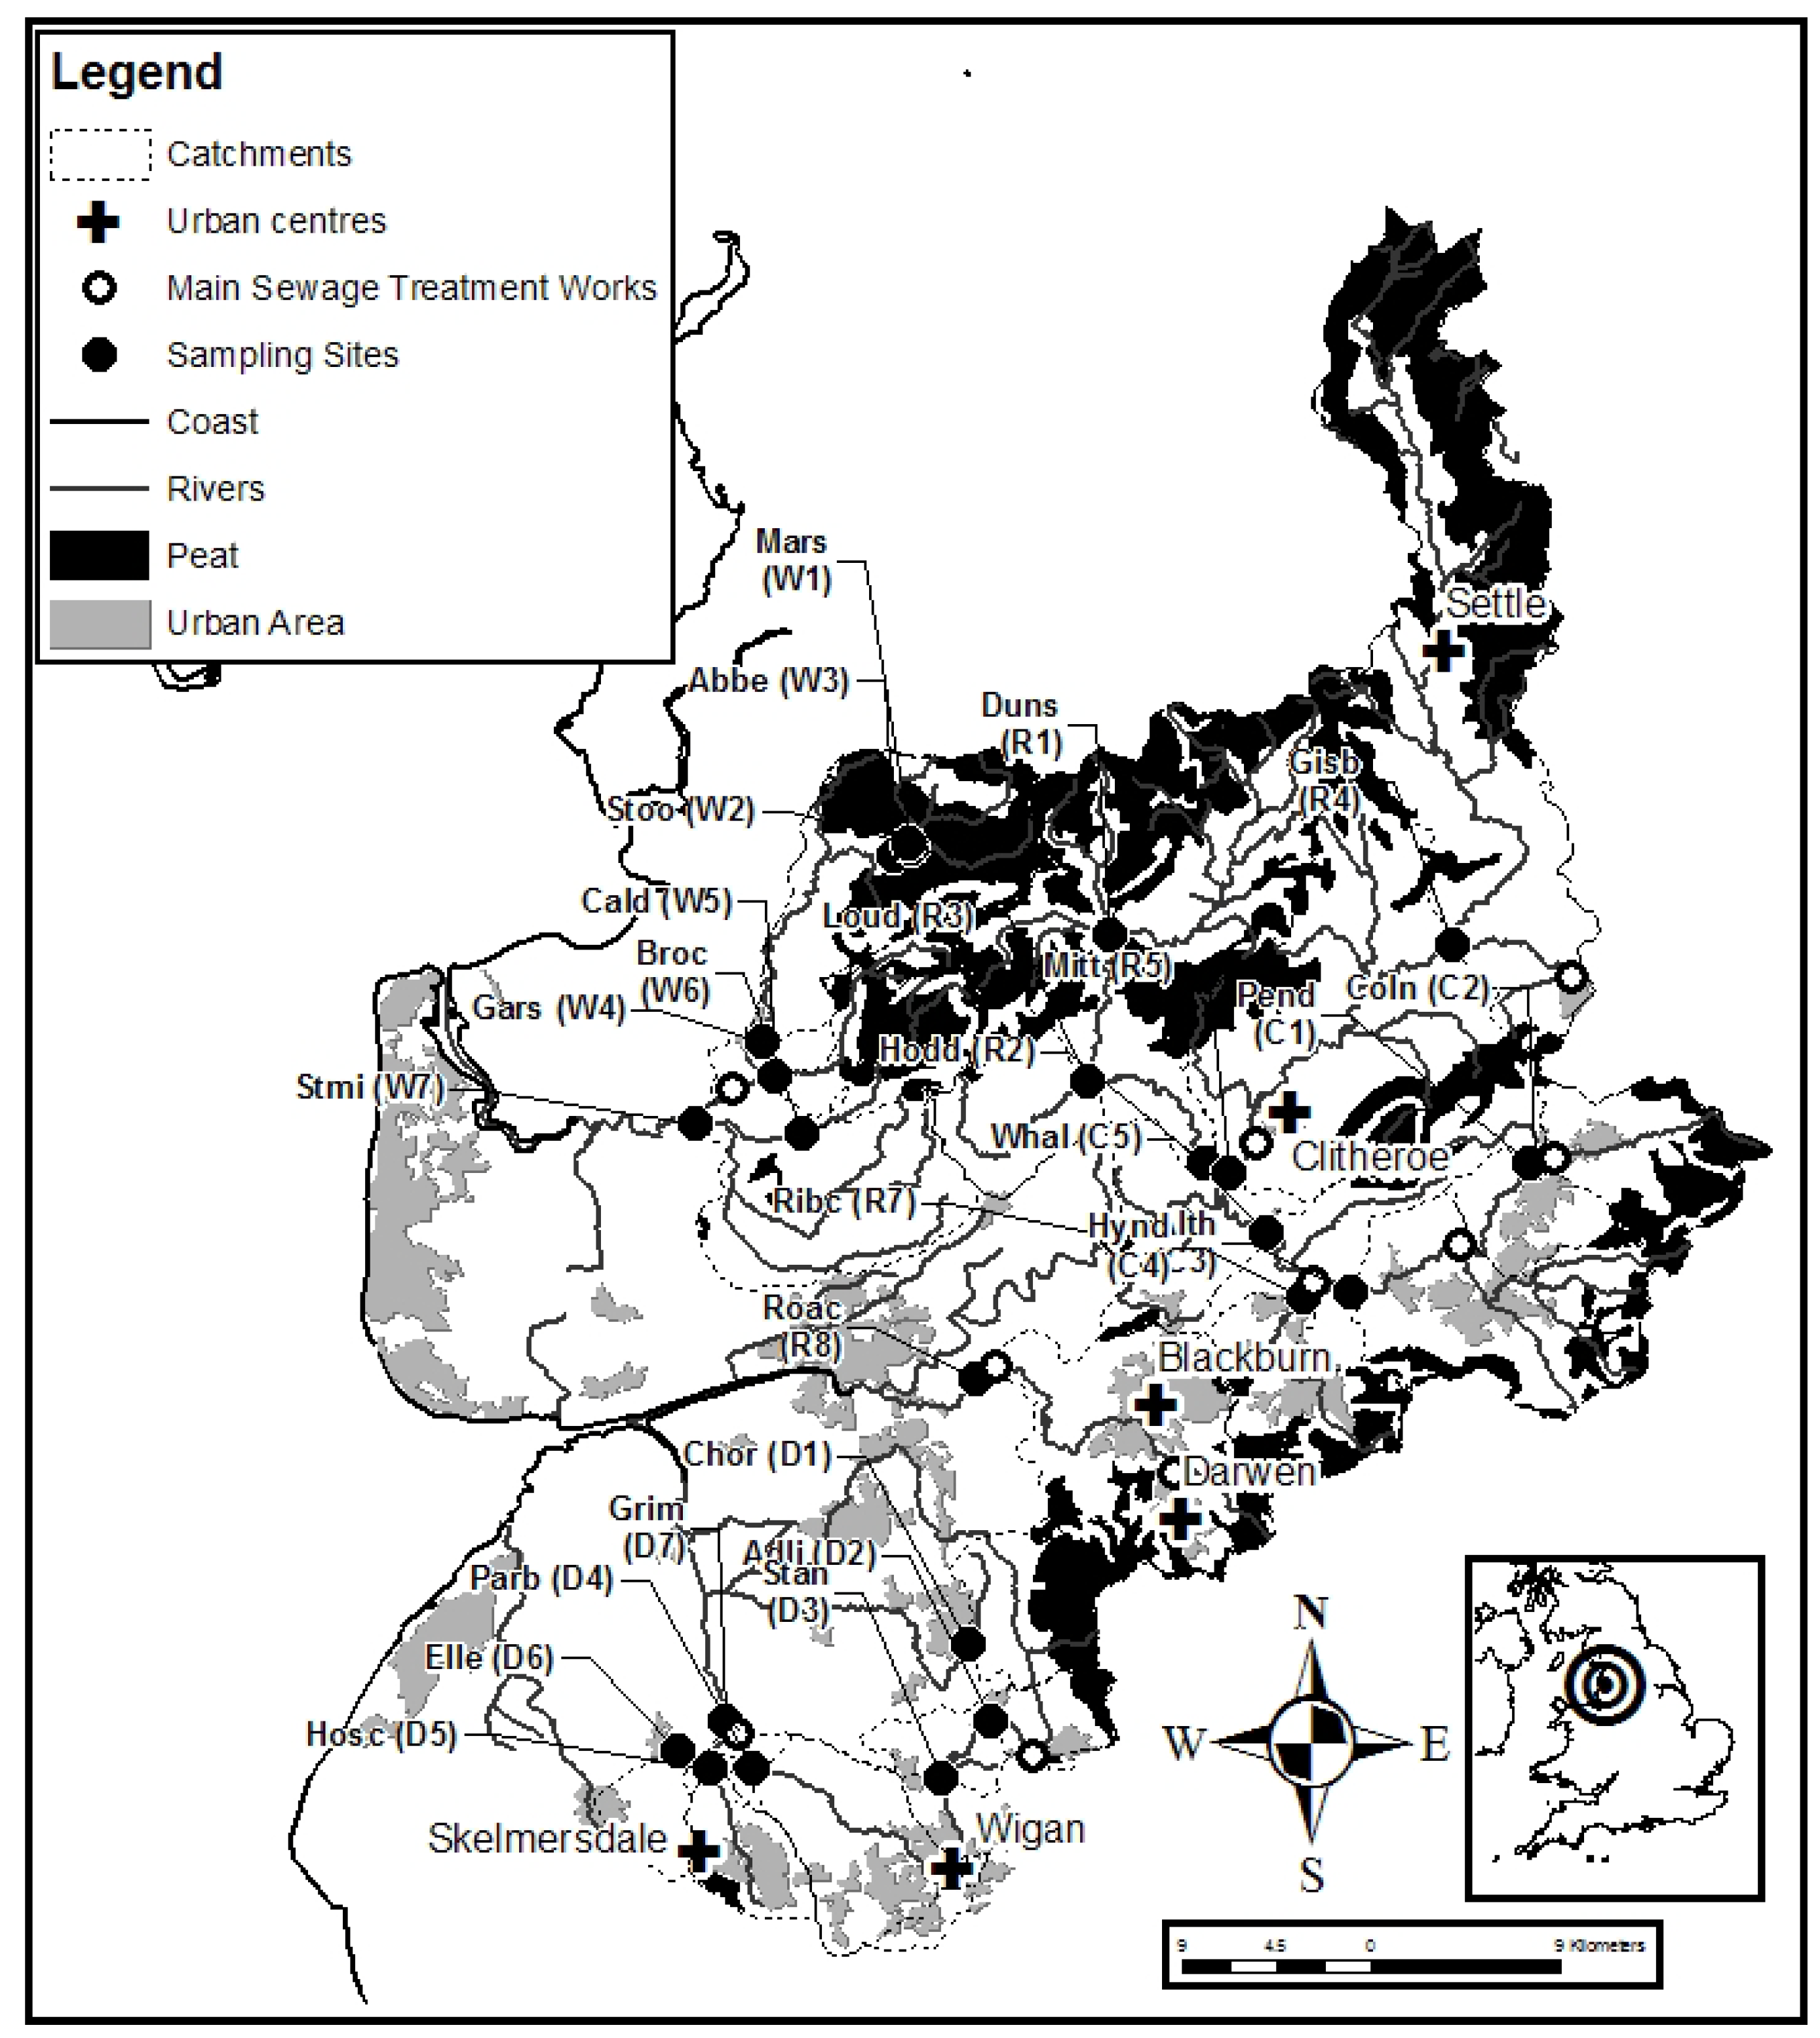
2.1. Site Characteristics

| River | No. | Site_name | O S Grid ref | Dissolved B | TSS | DOC |
|---|---|---|---|---|---|---|
| River Calder basin | ||||||
| Pendle Water | C1 | Barrowford | SD859392 | 16.4 | 4.3 | 7.0 |
| Colne Water | C2 | Barrowford | SD862392 | 49.8 | 10.8 | 7.8 |
| Calder | C3 | Altham Bridge | SD774330 | 47.1 | 10.8 | 7.2 |
| Hyndburn Brook | C4 | Hyndburn | SD752328 | 67.2 | 13.2 | 7.4 |
| Calder | C5 | Whalley | SD733359 | 53.3 | 9.9 | 7.9 |
| River Douglas basin | ||||||
| Yarrow | D1 | Chorley | SD591161 | 25.1 | 10.1 | 7.7 |
| Douglas | D2 | Adlington | SD602125 | 34.3 | 9.5 | 6.1 |
| Douglas | D3 | Standish | SD579100 | 43.4 | 10 | 7.3 |
| Douglas | D4 | Parbold | SD489103 | 84.1 | 11.4 | 7.0 |
| Tawd | D5 | Hoscar | SD469104 | 73.5 | 11.7 | 9.9 |
| Eller Brook | D6 | Briars Lane | SD454112 | 53.5 | 15.9 | 12.2 |
| Douglas | D7 | Wanes Blades Br. | SD476126 | 94.8 | 14.6 | 10.6 |
| River Ribble basin | ||||||
| Dunsop | R1 | Dunsop | SD659501 | 8.7 | 2.9 | 5.2 |
| Loud | R2 | Mytham Bridge | SD649430 | 19.2 | 13.4 | 8.9 |
| Hodder | R3 | Lower Hodder | SD704392 | 12.4 | 4.3 | 7.5 |
| Ribble | R4 | Gisburn | SD822496 | 17.1 | 4.8 | 8.6 |
| Ribble | R5 | Great Mitton | SD716387 | 17.8 | 5.4 | 8.8 |
| Calder | R6 | Whalley | SD733359 | 53.3 | 9.9 | 7.9 |
| Ribble | R7 | Ribchester | SD662366 | 26.6 | 5.8 | 8.2 |
| Darwen | R8 | Roach Bridge | SD595288 | 71.3 | 11.4 | 10.4 |
| River Wyre basin | ||||||
| Marshaw Wyre | W1 | Marshaw Bridge | SD565542 | 9.1 | 4.2 | 7.5 |
| Tarnbrook Wyre | W2 | Stoops Bridge | SD562544 | 9.1 | 6.3 | 7.6 |
| Wyre | W3 | Abbeystead | SD555538 | 9.1 | 7.1 | 7.9 |
| Wyre | W4 | Garstang Bridge | SD495445 | 12.7 | 5.6 | 9.1 |
| Calder | W5 | Calderbridge | SD499433 | 15.5 | 5.7 | 9.0 |
| Brock | W6 | Bilsborough | SD511406 | 16.1 | 4.2 | 9.4 |
| Wyre | W7 | St Michaels | SD462411 | 18.3 | 8.7 | 10.3 |
2.2. Sampling and Methodology
2.3. Statistics, Spatial Analysis and Load Estimates
2.4. Supplementary Information
3. Results
| River | Min | Max | Mean | Median | FWM | LF | HF | a | b | AAP |
|---|---|---|---|---|---|---|---|---|---|---|
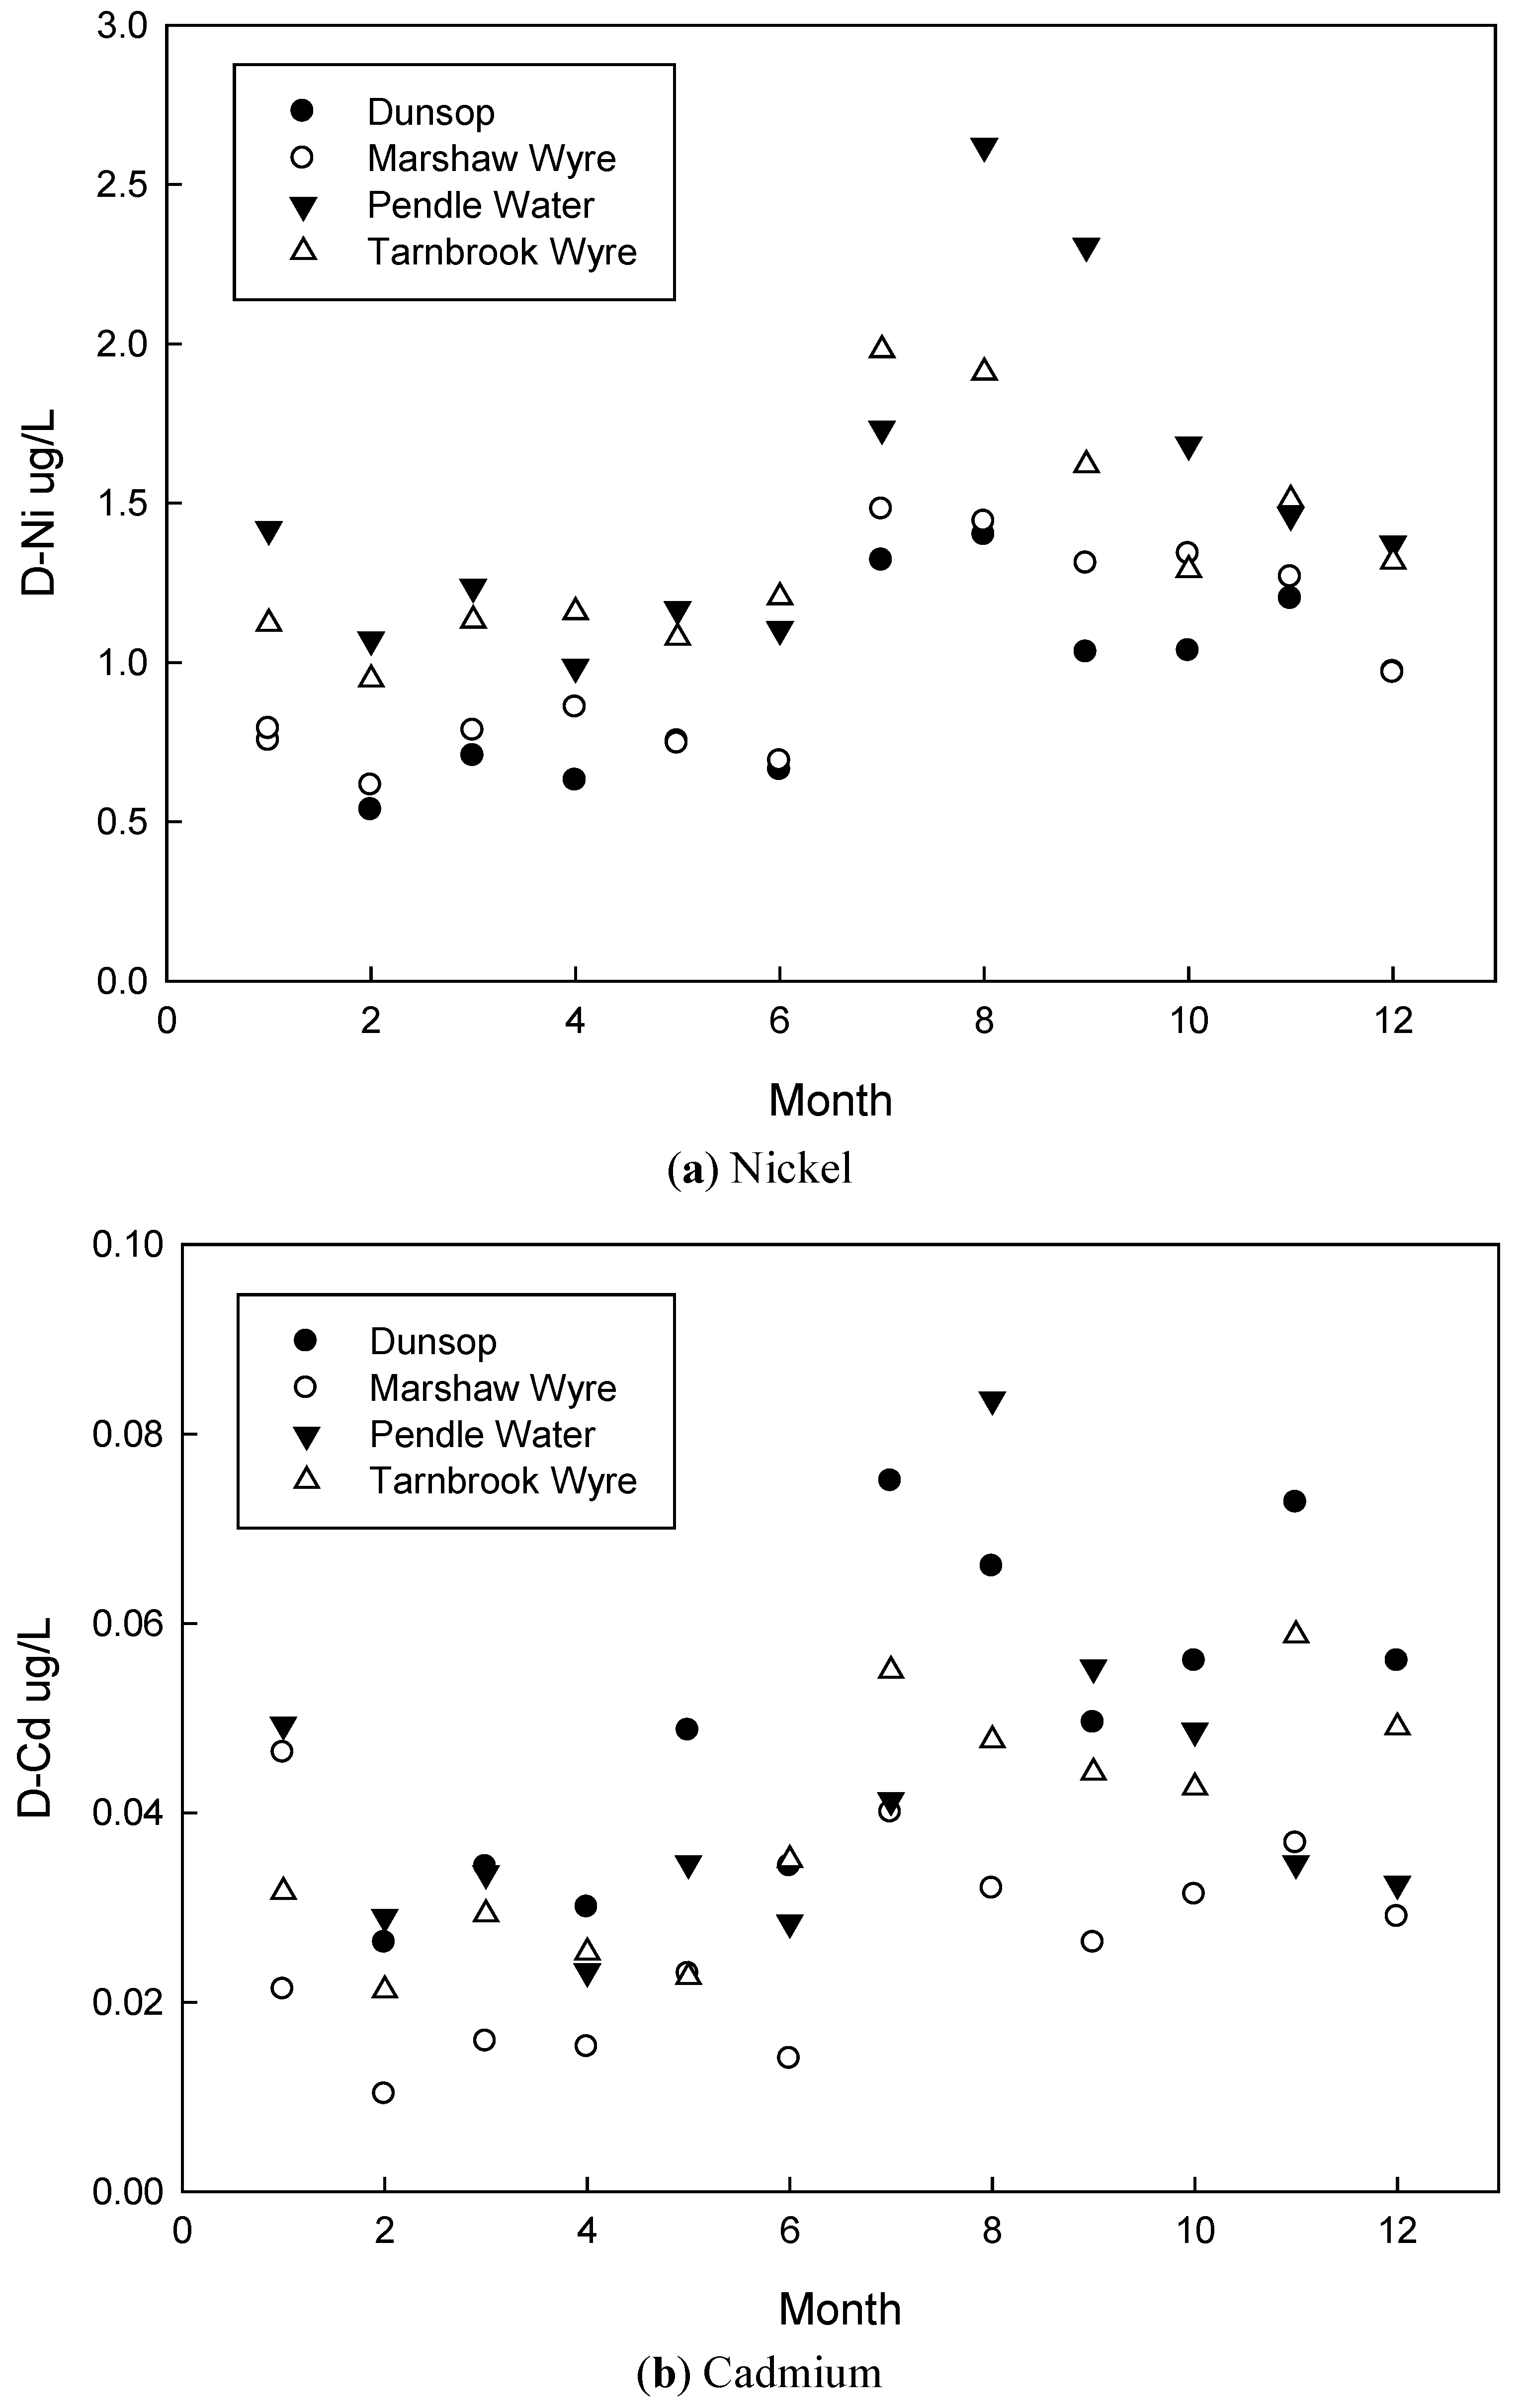
| Nickel | ||||||||||
| Calder | 0.34 | 6.12 | 2.03 | 1.91 | 2.01 | 2.69 | 1.82 | 1.98 | 2.08 | 0.17 |
| Douglas | 0.22 | 4.65 | 1.52 | 1.51 | 1.55 | 1.54 | 1.70 | 1.56 | 1.48 | 0.18 |
| Ribble | 0.00 | 6.28 | 1.45 | 1.34 | 1.48 | 1.68 | 1.47 | 1.42 | 1.50 | 0.12 |
| Wyre | 0.22 | 6.34 | 1.40 | 1.31 | 1.58 | 0.86 | 1.57 | 1.12 | 1.73 | 0.41 |
| Cadmium | ||||||||||
| Calder | 0.009 | 0.151 | 0.036 | 0.033 | 0.044 | 0.027 | 0.051 | 0.034 | 0.040 | 0.023 |
| Douglas | 0.004 | 0.254 | 0.021 | 0.018 | 0.023 | 0.017 | 0.028 | 0.022 | 0.020 | 0.018 |
| Ribble | 0.008 | 0.209 | 0.035 | 0.031 | 0.044 | 0.028 | 0.053 | 0.032 | 0.040 | 0.017 |
| Wyre | 0.005 | 0.128 | 0.029 | 0.027 | 0.038 | 0.017 | 0.047 | 0.022 | 0.038 | 0.008 |
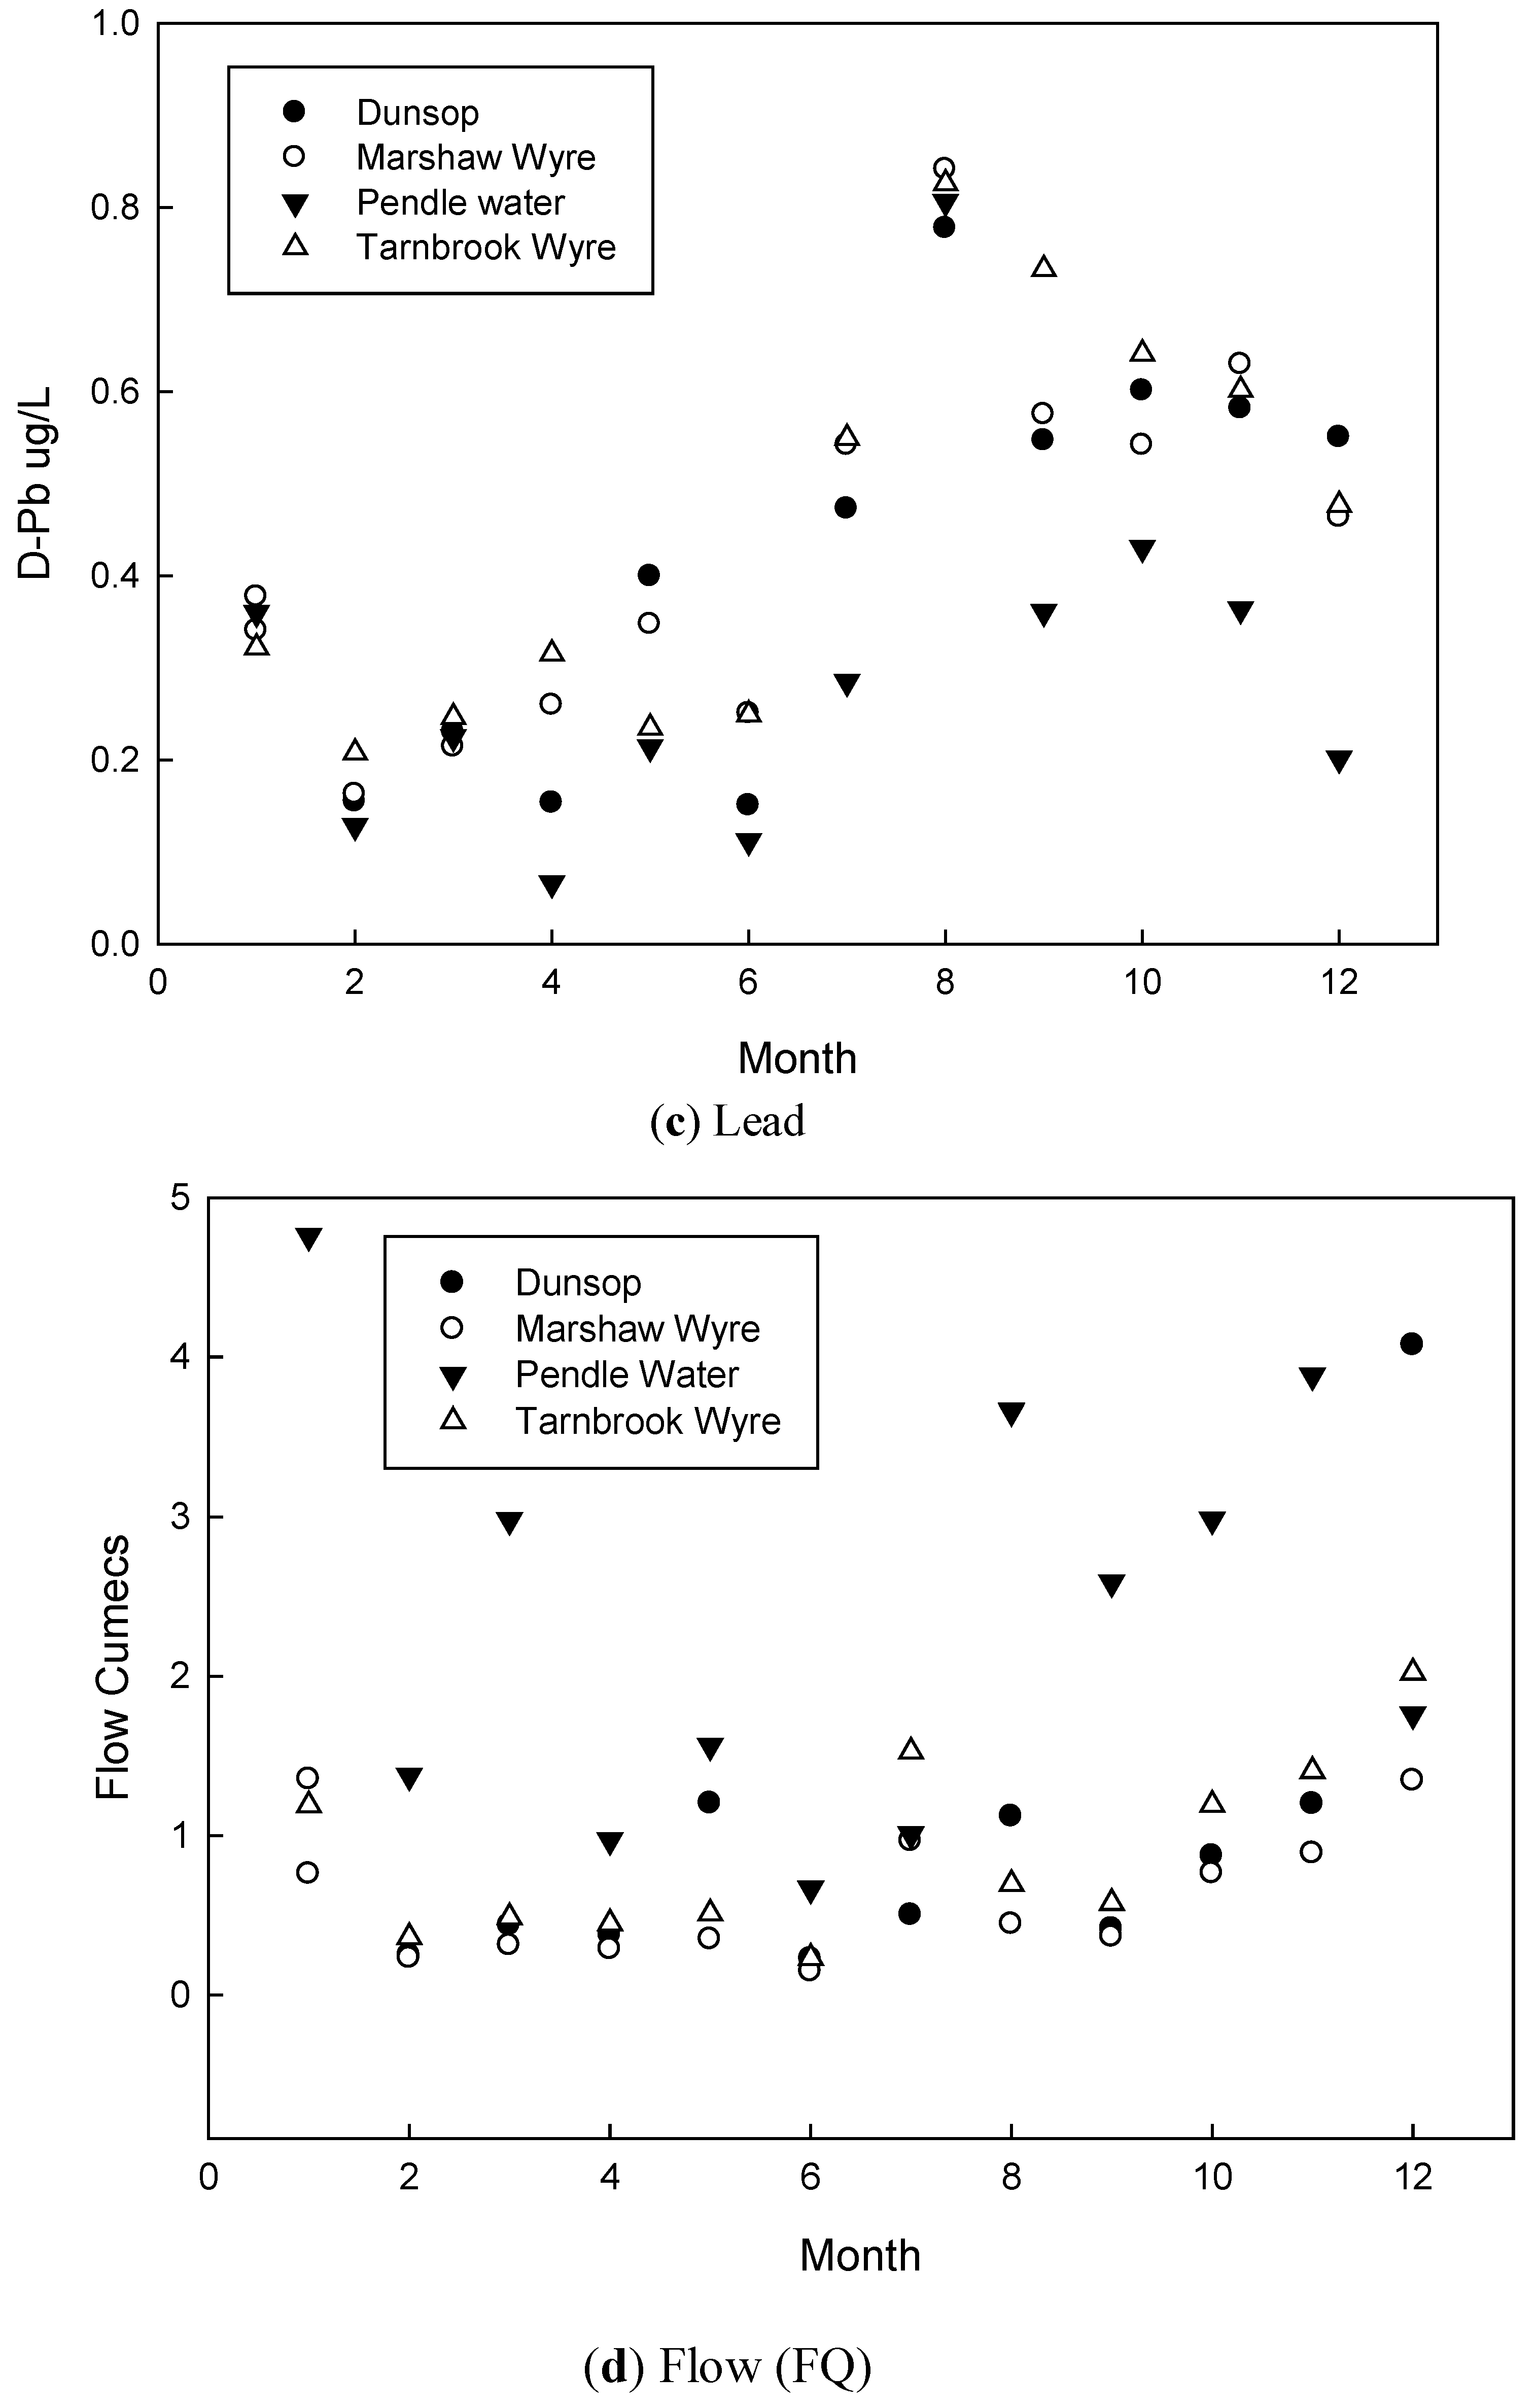
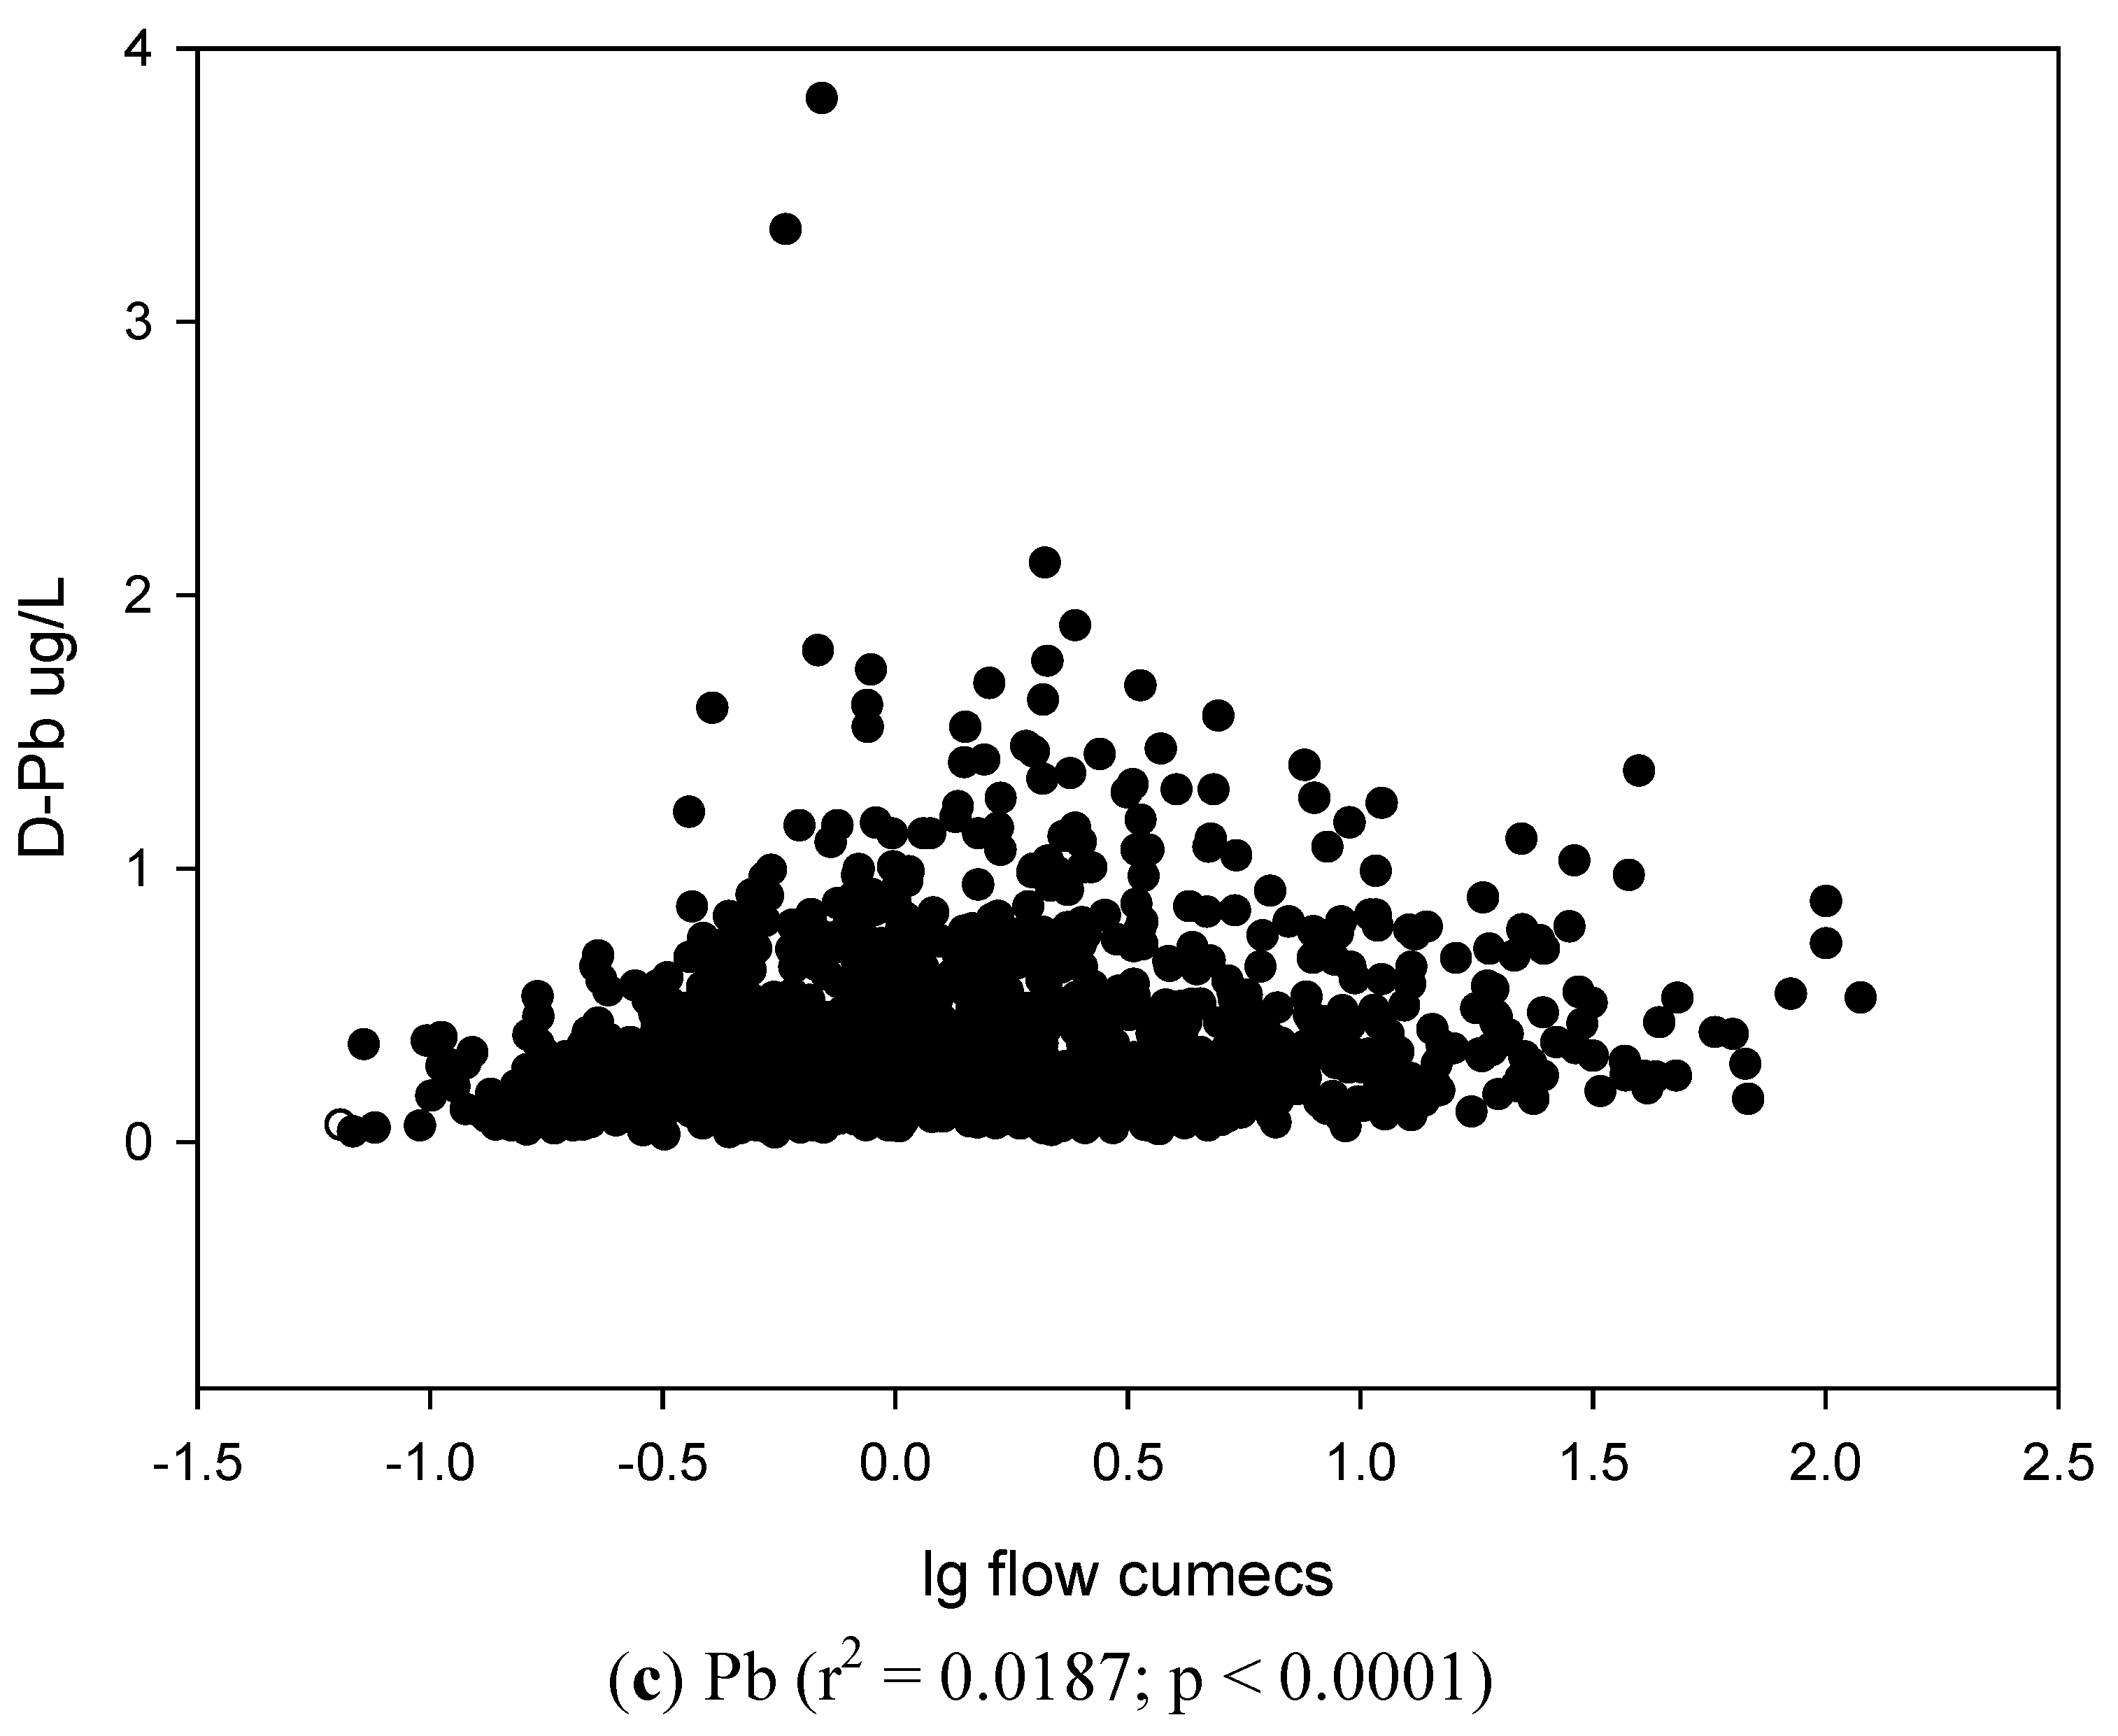
| Lead | ||||||||||
| Calder | 0.02 | 1.75 | 0.28 | 0.17 | 0.43 | 0.15 | 0.70 | 0.29 | 0.40 | 0.62 |
| Douglas | 0.04 | 3.81 | 0.48 | 0.40 | 0.58 | 0.34 | 0.82 | 0.36 | 0.53 | 1.25 |
| Ribble | 0.03 | 1.88 | 0.35 | 0.24 | 0.53 | 0.14 | 0.73 | 0.25 | 0.48 | 0.38 |
| Wyre | 0.03 | 1.37 | 0.42 | 0.33 | 0.58 | 0.27 | 0.79 | 0.27 | 0.58 | 0.24 |

| Site | Diss-B | DOC | pH | FQ | D-Cd | D-Pb |
|---|---|---|---|---|---|---|
| Diss-Ni | ||||||
| Dunsop (R1) | −0.217 | 0.863 | −0.687 | 0.303 | 0.931 | 0.880 |
| Marshaw Wyre (W1) | −0.184 | 0.914 | −0.642 | 0.397 | 0.860 | 0.855 |
| Pendle Water (C1) | −0.021 | 0.782 | −0.471 | 0.531 | 0.882 | 0.877 |
| Tarnbrook Wyre (W2) | −0.094 | 0.799 | −0.549 | 0.230 | 0.724 | 0.812 |
| Douglas @ Waynes (D7) | 0.295 | 0.323 | −0.093 | −0.087 | 0.272 | −0.068 |
| Darwen (R8) | 0.606 | 0.154 | −0.198 | −0.428 | 0.273 | −0.026 |
| Hyndburn Brook (C4) | −0.539 | 0.434 | −0.519 | 0.637 | 0.276 | 0.679 |
| Calder @ Whalley (C5) | 0.666 | −0.158 | 0.304 | −0.293 | −0.115 | −0.022 |
| Diss-Cd | D-Ni | D-Pb | ||||
| Dunsop (R1) | 0.296 | 0.018 | 0.317 | −0.224 | 0.931 | 0.842 |
| Marshaw Wyre (W1) | −0.334 | 0.846 | −0.838 | 0.672 | 0.860 | 0.883 |
| Pendle Water (C1) | −0.208 | 0.786 | 0.483 | 0.703 | 0.882 | 0.940 |
| Tarnbrook Wyre (W2) | −0.390 | 0.724 | −0.848 | 0.620 | 0.724 | 0.736 |
| Douglas @ Waynes (D7) | −0.300 | 0.500 | −0.283 | 0.302 | 0.272 | 0.250 |
| Darwen (R8) | −0.014 | 0.187 | −0.176 | −0.044 | 0.273 | 0.554 |
| Hyndburn Brook (C4) | 0.214 | 0.110 | −0.285 | 0.243 | 0.276 | 0.235 |
| Calder @ Whalley (C5) | −0.294 | 0.161 | −0.126 | 0.348 | −0.115 | 0.477 |
| Diss-Pb | D-Ni | D-Pb | ||||
| Dunsop (R1) | −0.314 | 0.915 | −0.757 | 0.479 | 0.880 | 0.842 |
| Marshaw Wyre (W1) | 0.683 | −0.458 | 0.696 | −0.560 | 0.855 | 0.883 |
| Pendle Water (C1) | 0.634 | −0.288 | 0.255 | −0.614 | 0.877 | 0.940 |
| Tarnbrook Wyre (W2) | −0.213 | 0.926 | −0.644 | 0.375 | 0.812 | 0.736 |
| Douglas @ Waynes (D7) | −0.179 | −0.146 | −0.342 | 0.748 | −0.068 | 0.250 |
| Darwen (R8) | −0.446 | 0.026 | −0.208 | 0.435 | −0.026 | 0.554 |
| Hyndburn Brook (C4) | −0.567 | 0.475 | −0.529 | 0.709 | 0.679 | 0.235 |
| Calder @ Whalley (C5) | −0.470 | 0.239 | −0.365 | 0.716 | −0.022 | 0.477 |
| Ribble estuary | Wyre estuary | |
|---|---|---|
| D-Ni | 550 | 420 |
| D-Cd | 16 | 9 |
| D-Pb | 240 | 205 |
| AAP-Ni | 120 | 93 |
| AAP-Cd | 12 | 6 |
| AAP-Pb | 450 | 120 |
4. Discussion
4.1. Quality Status of Trace Metals in North West England Rivers

4.2. Pollution Inputs to Rivers
5. Conclusions
References and Notes
- Cruz, J.V.; Pacheco, D.; Coutinho, R.; Cymbron, R.; Mendes, S.; Antunes, P.; Fonteila, J.; Freire, P. Chemical monitoring of river water bodies in an EU outmost region: examples from the Azores archipelago (Portugal). J. Environ. Monit. 2010, 12, 2216–2225. [Google Scholar] [CrossRef] [PubMed]
- The European Parliament and the Council of the European Union. EU Directive 2008/105/EC of the European Parliament and of the Council of 16 December 2008 on environmental quality standards in the field of water policy, amending and subsequently repealing Council Directives 82/176/EEC, 83/513/EEC, 84/156/EEC, 84/491/EEC, 86/280/EEC and amending Directive 2000/60/EC of the European Parliament and of the Council. Off. J. European Union 2008, 348, 84–97. [Google Scholar]
- Editorial: The European Water Framework directive beyond 2010: Let actions speak louder than words. J. Environ. Monit. 2010, 12, 2204–2206.
- Water UK Response to the Environment Agency consultation on Pollution Reduction Plans. March 2009. Available online: http://www.water.org.uk/home/policy/statements-and-responses/ea-consultation-on-pollu/water-uk-response-to--the-ea-consultation-on-pollution-reduction-programme-14-april-09.pdf (accessed on 15 December 2010).
- Neal, C.; Williams, R.J.; Bowes, M.J.; Harrass, M.C.; Neal, M.; Rowland, P.; Wickham, H.; Thacker, S.; Harman, S.; Vincent, C.; et al. Decreasing boron concentrations in UK rivers: Insight into reductions in detergent formulations since the 1990s and within-catchment storage issues. Sci. Tot. Environ. 2010, 408, 1315–1330. [Google Scholar] [CrossRef]
- Environment Agency. Water for life and livelihoods: River Basin Management Plan North West River Basin District 2009. Available online: http://publications.environment-agency.gov (accessed on 15 December 2010).
- Rothwell, J.J.; Dise, N.B.; Taylor, K.G.; Allott, T.E.H.; Scholefield, P; Davies, H.; Neal, C. A spatial and seasonal assessment of river water chemistry across North West England. Sci. Total Environ. 2010, 408, 841–855. [Google Scholar]
- Water UK website. Available online: http://www.water.org.uk/ (accessed on 15 December 2010).
- Rothwell, J.J.; Evans, M.G.; Daniels, S.A.; Allot, T.E.H. Peat soils as a source of lead contamination to upland fluvial systems. Environ. Pollut. 2008, 153, 582–589. [Google Scholar] [CrossRef] [PubMed]
- NAEI website. Available online: http://www.naei.org.uk/ (accessed on 16 December 2010).
- Mayes, W.M.; Johnston, D.; Potter, H.A.B.; Jarvis, A.P. A national strategy for identification, prioritisation and management of pollution from abandoned non-coal mine sites in England and Wales. I. Methodology development and initial results. Sci. Total Environ. 2009, 407, 5435–5447. [Google Scholar] [CrossRef] [PubMed]
- Mayes, W.M,; Potter, H.A.B.; Jarvis, A.P. Inventory of aquatic contaminant flux arising from historical metal mining in England and Wales. Sci. Total Environ. 2010, 408, 3576–3583. [Google Scholar] [CrossRef] [PubMed]
- Neal, C.; Robson, A.J. A summary of river water quality data collected within the Land Ocean Interaction Study: Core data for eastern UK rivers draining to the North Sea. Sci. Total Environ. 2000, 251/252, 585–666. [Google Scholar] [CrossRef] [PubMed]
- Neal, C.; Whitehead, P.G.; Jeffery, H.; Neal, M. The water quality of the River Carron, west Cornwall, November 1992 to March 1994: The impacts of Wheal Jane discharges. Sci. Total Environ. 2005, 338, 23–39. [Google Scholar] [CrossRef]
- Thornton, G.J.P; Walsh, R.P.D. Heavy metals in the waters of the Nant-y-Fendrod: Change in pollution levels and dynamics associated with the redevelopment of the Lower Swansea Valley, South Wales, UK. Sci. Total Environ. 2001, 278, 45–55. [Google Scholar] [CrossRef] [PubMed]
- Rowland, A.P.; Neal, C.; Scholefield, P.; Halford, A.P.; Vincent, C.D.; Hockenhull, K. Mercury in rivers in NW England: From rural headwaters to the heartlands of the historic industrial base. J. Environ. Monit. 2010, 12, 2299–2306. [Google Scholar] [PubMed]
- Neal, C.; Rowland, P.; Scholefield, P.; Vincent, C.; Woods, C.; Sleep, D. The Ribble/Wyre Observatory: major, minor and trace elements in rural headwaters to the industrial heartlands of the NW England historic industrial base. Sci. Total Environ. 2011, 409, 1516–1529. [Google Scholar] [CrossRef]
- Morrison, M.A.; Benoit, G. Filtration artefacts caused by overloading membrane filters. Environ. Sci. Tech. 2001, 35, 3774–3779. [Google Scholar] [CrossRef]
- Contado, C.; Blo, G.; Conato, C.; Dondi, F.; Beckett, R. Experimental approaches for size-based speciation in rivers. J. Environ. Monit. 2003, 5, 845–851. [Google Scholar] [CrossRef] [PubMed]
- Littlewood, I.G. Estimating contaminant loads in rivers: A review-IH Report 117; Institute. Hydrology, Maclean Building, Crowmarsh Gifford: Wallingford, Oxfordshire, UK, 1992; p. 17. [Google Scholar]
- Ferguson, R.J. River loads underestimated by rating curves. Water Resour. Res. 1985, 22, 74–76. [Google Scholar] [CrossRef]
- Neal, C.; Smith, C.J.; Jeffery, H.A.; Jarvie, H.P.; Robson, A.J. Trace element concentrations in the major rivers entering the Humber estuary, NE England. J. Hydrol. 1996, 182, 37–64. [Google Scholar] [CrossRef]
- Dennis, I.A,; Coulthard, T.J.; Brewer, P; Macklin, M.G. The role of floodplains in attenuating contaminated sediment fluxes in formerly mined drainage basins. Earth Surf. Processes Landforms 2009, 34, 453–466. [Google Scholar] [CrossRef]
- Jarvie, H.P.; Oguchib, T.; Neal, C. Pollution regimes and variability in river water quality across the Humber catchment: Interrogation and mapping of an extensive and highly heterogeneous spatial dataset. Sci. Total Environ. 2000, 251/252, 27–43. [Google Scholar] [CrossRef] [PubMed]
- Nicholson, F.A.; Smith, S.R.; Alloway, B.J.; Carlton-Smith, C.; Chambers, C.J. An inventory of heavy metal inputs to agricultural soils in England and Wales. Sci. Total Environ. 2003, 311, 205–219. [Google Scholar] [CrossRef]
- Ashworth, D.J.; Alloway, B.J. Soil mobility of sewage sludge-derived dissolved organic matter, copper, nickel and zinc. Environ. Pollut. 2004, 127, 137–144. [Google Scholar] [CrossRef] [PubMed]
- Rothwell, J.J.; Evans, M.G.; Daniels, S.A.; Allot, T.E.H. Baseflow and stormflow metal concentrations in streams draining contaminated peat moorlands in the Peak District National Park (UK). J. Hydrol. 2007, 341, 90–104. [Google Scholar] [CrossRef]
- Shi, Z.; Allen, H.E.; Di Toro, D,.M.; Lee, S.-Z.; Meza, D.M.F.; Lofts, S. Predicting cadmium adsorption on soils using WHAM VI. J. Chemosphere 2007, 69, 605–612. [Google Scholar] [CrossRef] [Green Version]
- Neal, C.; Williams, R.J.; Bowes, M.J.; Harrass, M.C.; Neal, M.; Rowland, P.; Wickham, H.; Thacker, S.; Harman, S.; Vincent, C.; Jarvie, H.P. Decreasing boron concentrations in rivers: Insights into reductions in detergent formulations since the 1990’s and within-catchment storage issues. Sci. Total Environ. 2010, 408, 1374–1385. [Google Scholar] [CrossRef] [PubMed]
- Gault, A.G.; Polya, D.A.; Lythgoe, P.R. Environ. Geochem. Health 2003, 25, 77–85. [CrossRef] [PubMed]
© 2011 by the authors; licensee MDPI, Basel, Switzerland. This article is an open access article distributed under the terms and conditions of the Creative Commons Attribution license (http://creativecommons.org/licenses/by/3.0/).
Share and Cite
Rowland, P.; Neal, C.; Sleep, D.; Vincent, C.; Scholefield, P. Chemical Quality Status of Rivers for the Water Framework Directive: A Case Study of Toxic Metals in North West England. Water 2011, 3, 649-666. https://doi.org/10.3390/w3020650
Rowland P, Neal C, Sleep D, Vincent C, Scholefield P. Chemical Quality Status of Rivers for the Water Framework Directive: A Case Study of Toxic Metals in North West England. Water. 2011; 3(2):649-666. https://doi.org/10.3390/w3020650
Chicago/Turabian StyleRowland, Phil, Colin Neal, Darren Sleep, Colin Vincent, and Paul Scholefield. 2011. "Chemical Quality Status of Rivers for the Water Framework Directive: A Case Study of Toxic Metals in North West England" Water 3, no. 2: 649-666. https://doi.org/10.3390/w3020650