
Treatment of Pickle Wastewater under Varying Salinity Conditions within the Sequencing Batch Biofilm Reactor System
1
College of Architecture and Environment, Sichuan University, Chengdu 610065, China
2
Sichuan Academy of Eco-Environmental Science, Chengdu 610041, China
*
Author to whom correspondence should be addressed.
Water 2024, 16(9), 1312; https://doi.org/10.3390/w16091312
Submission received: 21 March 2024
/
Revised: 24 April 2024
/
Accepted: 27 April 2024
/
Published: 6 May 2024
(This article belongs to the Section Wastewater Treatment and Reuse)
Abstract
:Pickle wastewater is a highly saline organic effluent that poses a significant ecological risk. In this study, a sequencing batch biofilm reactor (SBBR) was used to treat such wastewater, and a denitrification system capable of simultaneously removing high levels of nitrogen and organic matter was successfully established. Through salinity incremental increase, the system operated stably, and the removal rates of COD, TN, and NH4+-N could be maintained at about 96%, 93%, and 99% under the salinity of 3.0%. The effect of salinity on the structure and function of microbial communities in the reactor was investigated by high-throughput sequencing. The results showed that increasing salinity could reduce the diversity, change the structure, and reduce the functionality of the microbial community. Under high-salt conditions (salt content of 3.0%), salt-tolerant microorganisms such as Actinobacteriota became dominant populations. As salinity increased, NOB (nitrite oxidizing bacteria) was strongly inhibited, and its abundance decreased rapidly until it disappeared. Partial nitrification–denitrification (PND) gradually became the main denitrification pathway. In conclusion, this experiment not only shows that SBBR treatment of pickle wastewater has strong feasibility, but also provides a theoretical research basis for the engineering treatment of pickle wastewater.
1. Introduction
With the continuous development of the rural economy, Sichuan pickled vegetables have emerged as a significant industry, witnessing an annual increase in production. However, ensuring standard discharge of large quantities of high-salt pickled vegetable wastewater has become a primary concern for promoting green development within this sector. The salt content in pickled vegetable wastewater typically ranges from 1% to 15% (10,000~150,000 mg/L Cl−). Challenges are posed by its characteristics such as high water volume, concentrated inorganic salts, substantial organic matter content, and elevated ammonia nitrogen levels. Discharging this untreated wastewater into the environment can lead to severe soil and water contamination with detrimental effects on plant germination and growth, ultimately causing damage to the ecosystem [1].
Biological and physicochemical treatment techniques are two of the most popular approaches for treating high-salt wastewater [2]. However, physicochemical techniques have several drawbacks, including long start-up time, high energy input, high investment costs, show less efficiency to treat hypersaline or highly saline wastewater, and the potential for secondary pollution [3,4]. In contrast, biological treatment has become the most important method due to its superior treatment effects, lower investment costs, and greater environmental friendliness [5,6]. Biological treatment techniques like sequencing batch reactor (SBR), up-flow anaerobic sludge blanket (UASB) reactor, membrane bioreactor (MBR), anaerobic membrane bioreactor (AnMBR), constructed wetlands (CWs), etc. have been used to treat different types of high-salt wastewater [1,7,8]. Some studies indicate that microorganisms in bioreactors can experience osmotic shock, leading to dehydration and even cell lysis and death due to the effect of osmotic pressure when the salinity of the wastewater is higher than 1% [9]. Consequently, enhancing the tolerance of microorganisms to a high-salt environment is a current research hot-spot in the biological treatment of high-salt wastewater.
The sequencing batch biofilm reactor (SBBR) is a type of biotreatment technology that combines the advantages of both activated sludge and biofilm methods. It has the advantages of small footprint, flexible operation, high biomass concentration, and strong shock load resistance, and can remove organic matter, nitrogen, phosphorus, and other substances [10,11]. The SBBR process was improved on the basis of SBR and follows the SBR process operation. Each operation cycle includes five stages: influent, reaction, sedimentation, effluent, and idling. Different fixed fillers, fluidized fillers or microporous membranes were selected according to different water quality, which was superior to the traditional activated sludge method in terms of microbial environment and activity [12]. SBBR is a promising system for treating high-salt wastewater, which has good resistance to a high-salt environment [13]. The research showed that the dissolved oxygen gradually decreases from the surface to the interior of the biofilm, providing a suitable anaerobic environment for direct denitrification [14].
How to remove nitrogen compounds and organic matter under high-salt conditions is the technology core for treating high-salt pickled wastewater. Partial nitrification–denitrification (PND) is a low-cost denitrification technology. The main feature of the PND process is the enrichment of ammonium oxidation bacteria (AOB) and the suppression of the activity of nitrite oxidizing bacteria (NOB) [15], which allows the nitrification process to control the conversion of NH4+-N to NO2−-N stage and the conversion of NO2−-N to N2 by denitrification. Compared with conventional nitrification–denitrification, PND can shorten the denitrification step from nitrate to nitrite, saving 25% of aeration and 40% of electron donors [16]. Therefore, this process has the advantages of low operational energy consumption, short operation time, small footprint, and low residual sludge production. Currently, there are fewer studies on the treatment efficacy of a single SBBR reactor for treating high-salt pickle wastewater and its denitrification process.
This study established a denitrification system for organic wastewater of high salinity based on partial nitrification–denitrification in a single SBBR reactor. During the experimental process, the performance of the reactor was evaluated through COD removal efficiency and ammonia nitrogen removal efficiency. At the same time, the impact of salinity on the microbial diversity in the reactor and the denitrification pathways were analyzed using PCR technology. The aim of this study is to provide a more convenient and effective method for the actual treatment of high salinity wastewater from the production of pickled vegetables.
2. Materials and Methods
2.1. Experimental Facility
The experimental facility consisted of a cylindrical SBBR made of organic glass, with dimensions of 120 × 600 mm (D × H) and a total effective volume of 6 L. The reactor was filled with polyethylene K1 filler encapsulated by biofilm, and the filling ratio of the bioreactor was set to 40% (v/v). A small aeration plate was installed at the bottom of the reactor to mix the liquid. Additionally, the reactor was supplied with dissolved oxygen by an air pump. The air flow rate was adjusted by using a glass rotameter to control the dissolved oxygen concentration in the reactor, and carriers in oxic zone were well fluidized. Heating wire and thermostats were used to control the reactor temperature. Inlet and outlet water were controlled by peristaltic pumps to adjust the flow rate. The SBBR system was operated in a sequencing batch mode with the following phases: inlet water, reaction, settling, drainage, and idle. The SBBR experimental setup schematic is included in the Supplementary Materials (Figure S1).
2.2. Inoculated Sludge and Experimental Wastewater
The SBBR system was initially inoculated with activated sludge taken from the aeration tank of a wastewater treatment plant (Hangkonggang wastewater treatment plant, Shuangliu, Chengdu, China) with a mixed liquor suspended solids (MLSS) of 3500 mg/L. The experimental wastewater was artificially synthesized to simulate the actual wastewater. The influent water quality was configured based on the comprehensive wastewater quality of a pickled vegetable enterprise in Pengzhou, Sichuan Province. The wastewater quality indexes were as follows: COD 1400~1600 mg/L; NH4+-N 65~85 mg/L; TN 65~85 mg/L; TP 15~20 mg/L. The carbon source, nitrogen, and phosphorus source in the synthetic wastewater were provided by anhydrous glucose (C6H12O6), ammonium chloride (NH4Cl), and potassium dihydrogen phosphate (KH2PO4), respectively. The influent pH was adjusted by adding 1 g/L NaHCO3, and the influent water pH was 7 ± 0.5. In addition to this, 1 mL of nutrient solution was added to each liter of simulated wastewater to provide trace elements for microbial growth. A nutrient solution ingredient list is provided in the Supplemental Materials (Table S1).
2.3. Experimental Operation Strategy
The reactor temperature was 25 °C, dissolved oxygen (DO) was 4 ± 0.2 mg/L, hydraulic retention time (HRT) was 21 h, and the sludge retention time (SRT) was 18~21 d. The system was operated for a 12.0 h cycle, consisting of 0.2 h influent phase, 11.0 h of reaction phase, 0.5 h of settling phase, 0.1 h of effluent phase, and 0.2 h of idle phase. The operation of each cycle was fully automatic through the control of a timing switch. During the experimental stage, which lasted for 53 days, the reactor was in the salt adjustment phase. The same operational conditions as in the pre-experimental stage were maintained. The salt concentration of the influent was gradually increased from 0% to 3% in increments of 0.5% (5000 mg/L NaCl) per step. The experiment included seven salinity stages (0%, 0.5%, 1.0%, 1.5%, 2.0%, 2.5%, and 3.0%) as the salinity was raised from 0% to 3.0%. Except for the 0% salinity stage, which ran for 5 days, the running time of the other salinity stages was 8 days. During this phase, COD, TN, NH4+-N, NO3−-N, and NO2−-N were determined in the influent and effluent to evaluate the treatment performance of the SBBR system. Additionally, samples were taken at the end of the last cycle of each salt concentration to investigate the nitrogen transformation pathways at different salt concentrations.
2.4. Analytical Methods
The testing parameters in this study included the concentration of COD, TN, NH4+-N, NO3−-N, and NO2−-N. The concentration of COD was determined by the dichromate oxidation method HJ 828-2017 [17], using mercuric sulfate as a masking agent to mask Cl−1. The determination of TN was performed by the alkaline potassium persulfate digestion UV spectrophotometric method [18]. The determination of NH4+-N was conducted using the Nessler reagent spectrophotometric method [19]. The determination of NO3−-N was performed by spectrophotometric method with phenol disulfonic acid [20]. The determination of NO2−-N was conducted using the spectrophotometric method with 1-naphthylethylenediamine dihydrochloride [21]. Some standard curves are provided in the Supplementary Materials (Figures S2–S5).
2.5. Microbial Community Structure Analysis
In order to comprehensively analyze the changes in microbial communities under different salinity gradients, different salinity levels and four sludge samples were collected: no salinity (0%), low salinity (1.0%), medium salinity (2.0%), and high salinity (3.0%), and were subjected to high-throughput sequencing. The genomic DNA was extracted using the protocol and the DNA concentrations were determined by Majorbio (Shanghai, China). The sludge samples were stored at −40 °C and sent to Majorbio Bio-Pham Technology for microbial sequencing after collection. The samples were subjected to DNA extraction under the conditions of 1% agarose gel electrophoresis, 5 V/cm voltage, and 20 min time. An independent PCR amplification of the V4 region of the 16S rRNA gene was performed using the forward primer 338F (5′-ACTCCTACGGGAGGCAGCA-3′) and reverse primer 806R (5′-GGACTACHVGGGTWTCTAAT-3′). PCR consisted of an initial denaturation cycle of 3 min at 95 °C, followed by 27 cycles of denaturation at 95 °C for 30 s, annealing at 55 °C for 30 s, and extension at 72 °C for 45 s, and a final extension at 72 °C for 10 min. The products were detected by 2% agarose gel electrophoresis [22].
3. Results and Discussion
3.1. Effect of Salinity Enhancement on System Effluent Quality
The COD removal efficiency of the SBBR system under different salinity conditions is shown in Figure 1a. During the first 5 days of reactor operation, the average COD removal rate at 0% salinity was about 95.5%. With the first increase in salinity, the removal rate quickly dropped to 85.1%. The sudden increase in salinity could inhibit microbial activity and reduce the microbial decomposition rate of organic matter [23], leading to a decrease in the system’s COD removal efficiency. A previous study had demonstrated that microbial communities were tolerant to salinity with a stepwise increase in salinity concentration, and an adaptation to elevated salinity enhanced the pollutants removal efficiency [24]. Luo et al. [25] also showed that domestication at high salinity could lead to the succession of the salt-tolerant microbial community, resulting in a gradual recovery of system performance. After four days of adaptation, dominant bacteria gradually appeared, and the salt tolerance of microorganisms was enhanced. The microbial system inside the reactor became stable, and the COD removal efficiency gradually increased, reaching 92.7% on the 13th day. The trend of COD removal rate in the subsequent salinity stages showed a rapid decline followed by a slow recovery, but the amplitude of the decline became smaller and the level after recovery gradually increased. The maximum COD removal at 3.0% salinity stage reached 97.22% higher than the maximum COD removal at 0% salinity (96.46%). This was because during the gradient increase in salinity, the sludge inside the reactor was acclimated, and the content of salt-tolerant microbial communities increased, thereby having a good organic matter removal ability under high-salt conditions [26]. Under salinity levels of 0% to 3%, the SBBR system had good organic matter removal efficiency, and the final COD removal rates reached 95.5%, 92.7%, 94.7%, 94.8%, 93.9%, 94.5%, and 96.0% for salinities of 0%, 0.5%, 1.0%, 1.5%, 2.0%, 2.5%, and 3.0%, respectively. Therefore, salinity below 3.0% had little effect on the system’s ability to remove COD, which was consistent with the results of Daying Chen et al. [8], who found through their results that organic matter removal was not significantly affected by the high salinity.
The denitrification performance of the SBBR system is shown in Figure 1b,c. In the initial stage of the experiment, when the salinity was 0%, both the TN removal efficiency (Figure 1b) and the NH4+-N removal rate (Figure 1c) remained stable at 95.4% and 97.7%, respectively. At the beginning of the salinity change, the TN removal rate and NH4+-N removal rate changed rapidly to 83.9% and 90.2%. This change was due to the same reason as the decrease in the COD removal rate, both because the microorganisms in the sludge had difficulty adapting to the sudden change in salinity and resulted in the decrease in microbial activity, and the removal rate showed a sudden decrease. Under the conditions of 1.0~2.0% salinity, the salinity had no significant influence on denitrification. The TN and NH4+-N removal rates remained at a high level, indicating that nitrification and denitrification could be carried out simultaneously in the single-stage reactor [27]. When the salinity was increased to 2.5% and 3.0%, the TN removal rate decreased rapidly to a minimum of 83.0% and 87.8%, respectively. Then rebounded to 88.2% and 91.7%, respectively, while the NH4+-N removal rate remained stable. When the salinity was lower than 2.5%, the NO2−-N in the effluent remained at a low level, with an average concentration of less than 1mg/L and the NO3−-N concentration was also at a low level. Since the biofilm had anoxic and aerobic zones, nitrification and denitrification could be carried out simultaneously [28]. Denitrifying bacteria could adapt to the external salinity changes by regulating their own osmotic pressure under low salinity conditions. After the salinity was increased to 2.5%, the NO2−-N in the effluent gradually began to accumulate. When the salinity was increased to 3%, the NO2−-N in the effluent increased to 3.25 mg/L.
In summary, the system had good denitrification performance, and even if the salinity was increased to 3.0%. The acclimated microorganisms could overcome the adverse effects of salt and achieve 93.2% and 99.0% for TN and NH4+-N removal, with only 5.3 mg/L of TN and less than 1.0 mg/L of NH4+-N in the effluent. Compared with the COD removal efficiency (Figure 1a), the effect of salinity on denitrification was lower, which was different from the results of Lu et al. [29]. Throughout the experiment, the system achieved good treatment performance in the aerobic single-stage reactor.
3.2. Analysis of the Impact of System Cyclic Denitrification Performance
Figure 2 depicts how the nitrogen compounds in the system changed during a reactor cycle. With the change in salinity, the time required for the NH4+-N concentration in the reactor to drop to an ultra-low level was 7 h, 7 h, 3 h, 3 h, 5 h, 6 h, and 8 h, respectively. When the influent had a salinity of 1~2%, the NH4+-N removal rate was faster. This was due to low concentrations of inorganic salts playing a promoting role in the growth process of microorganisms by maintaining membrane balance and regulating osmotic pressure [2], thereby accelerating the denitrification process in the reactor.
When the influent salinity was 0%, both NO3−-N and NO2−-N maintained a relatively low level throughout the entire degradation process. When the salinity of the influent began to increase, NO3−-N gradually appeared to accumulate. The maximum accumulation of NO3−-N in each stage was 1.26 mg/L, 2.56 mg/L, 3.95 mg/L, 5.45 mg/L, 5.17 mg/L, and 2.62 mg/L, respectively, when the salinity increased from 0.5% to 3% in 6 stages. At 25 °C and 0.5% salinity, the reactor AOB content inside the reactor was greater than NOB, thus leading to a greater accumulation of NO2−-N than NO3−-N [30]. With the increase in the reactor operation time, NOB gradually increased and the NO2−-N content in the effluent was extremely low. When the influent salinity increased to 2.5% and 3%, NO2−-N began to accumulate gradually, with the maximum accumulation values of 6.61 mg/L and 4.89 mg/L, respectively. When the effluent NO3−-N started to decrease, this indicated that the denitrification pathway of the system might have been changed. Studies had shown that after the salinity above 2%, the inhibition of NOB was stronger than that of AOB, leading to the accumulation of nitrite [31,32]. Therefore, when the salinity was 3%, partial nitrification–denitrification might have occurred in the system.
3.3. Microbial Community Analysis
The experimental stages were divided into four representative stages: no salinity (S0), low salinity (S1), medium salinity (S2), and high salinity (S3). High-throughput sequencing and community structure analysis were conducted on samples taken from the sludge and biofilm in the system at each stage.
3.3.1. Microbial Diversity Analysis
The microbial diversity index could also be used to analyze changes in microbial diversity, as shown in Table 1. The high-throughput sequence numbers for samples S0, S1, S2, and S3 were 327,372, 74,459, 77,792, and 30,825, respectively, with coverages of 0.99964, 0.99589, 0.997185, and 0.99708, respectively. The coverages for all four samples were close to 1, indicating that the sequencing depth was sufficient. In addition, when combined with the rarefaction curves (Figure 3a), it could be seen that the three curves for S1, S2, and S3 had already flattened out at a sequence count of 10,000, indicating that the sampling depth also met the analysis requirements, and that the given data were sufficient to cover all species. As shown in the Venn diagram (Figure 3b), samples S0, S1, S2, and S3 shared only 135 OTUs (operational taxonomic units), and the unique OTUs for each sample decreased with the increase in salinity. The four samples unique OTUs were 512, 21, 18, and 2, respectively, indicating that salinity could significantly reduce species diversity, and S0 had the highest species diversity.
The richness and diversity of microbial communities were indicated by Sobs, Chao, ACE, Shannon, and Simpson parameters (Table 1). From Table 1, it could be seen that the values of the Sobs, Chao, and ACE parameters for samples S0, S1, S2, and S3 decreased in order, with these three parameters generally representing the species richness of the samples. A higher index value indicated higher richness, so it is clear that high salinity reduced species richness. The Shannon and Simpson parameters are commonly used to characterize species diversity in bacterial communities, with the Shannon index increasing and the Simpson index decreasing with increasing diversity. It could be observed that the Simpson index increased with increasing salinity and the Shannon index decreased, indicating that species diversity was also affected by high salinity, with higher salinity leading to decreased species diversity and a reduced ability of the system to withstand impact loads.
In conclusion, high salinity not only reduced the abundance of microbial communities, but also decreased their diversity, making the ecological environment in the reactor less stable and the system less able to resist shock loading.
3.3.2. Microbial Structure Analysis at Phylum and Genus Level
From the perspective of species composition at the phylum level, there were significant differences in species composition among the four samples, with more than 43 phyla detected in all samples (Figure 4). Studies have shown that the types of microbial phyla decrease with increasing salinity due to the effect of salinity on cell osmotic pressure, indicating that salinity has a significant impact on microbial structure [25,33]. With increasing salinity, the dominant phyla with a relative abundance of over 1% gradually transitioned from 10 phyla including Proteobacteria (25.88%), Chloroflexi (21.58%), Actinobacteriota (12.89%), Bacteroidota (12.27%), Patescibacteria (7.27%), Planctomycetota (4.68%), Firmicutes (4.39%), Acidobacteriota (3.21%), Myxococcota (1.78%), and Verrucomicrobiota (1.08%) to five phyla including Actinobacteriota (66.29%), Bacteroidota (15.22%), Proteobacteria (12.29%), Patescibacteria (1.95%), and Planctomycetota (1.52%).
According to the results, it could be seen that Actinobacteriota, Proteobacteria, Chloroflexi, and Bacteroidota exhibited different salt tolerance, which were generally detected as the dominant groups of bacteria prevalent in denitrification processes [34,35]. Under high salinity conditions, Actinobacteriota became the dominant phylum, which was able to degrade organic matter under aerobic conditions. Although the relative abundance of the original dominant phylum Proteobacteria had decreased, it still remained at a high level. Both of these phyla are common in wastewater treatment systems and playe an important role in pollutant removal [36,37]. With the increase in the salinity, the abundance of Bacteroidota increased from 12.27% to 15.22%, indicating good salt tolerance. Bacteroidota are important denitrifying bacteria that mainly breaks down macromolecular organic matter and is often detected in anaerobic and anoxic environments [38,39]. Chloroflexi was less salinity tolerant, as its relative abundance decreased sharply from 21.58% to 0.82% with increasing salinity. The relative abundance of Planctomycetota, Firmicutes, Acidobacteriota, and Verrucomicrobiota, all decreased with increasing salinity, which were reported to play important roles in heterotrophic metabolism [40]. Patescibacteria, which is considered to be closely related to denitrification in wastewater treatment systems [41], exhibited different salt tolerance and was suitable for growth in medium and low salinity conditions.
In terms of genus level (Figure 5), unclassified_f_Dermatophilaceae was assigned to the Dermatophilaceae family, which is a Gram-positive bacterial genus isolated from low-phosphorus activated sludge [42], with a relative abundance of only 0.027% when no salt was added. With the increase in salinity, its relative abundance eventually rose to 62.48%, becoming the dominant genus. This was similar to the results obtained by Zhao et al. [43] in an SBR reactor, where the high abundance of this genus might play an important role in system tolerance to high salinity. Unclassified_Flavobacteriales is commonly found in marine ecosystems [33] and continues to accumulate as salinity increases, becoming the second most dominant genus in S3. Saccharimonadales (including norank_f_norank_o_Saccharimonadales and unclassified_o_Saccharimonadales) was one of the main genera responsible for denitrification in S0 [44]. With the increase in salinity, its relative abundance gradually decreased from the initial 5.53% to 1.84%, but it still played an important role in denitrification and nitrogen removal. Meanwhile, the second largest genus detected in S3, Defluviimonas, is a moderately halophilic denitrifying bacterium [45], commonly found in various salt-containing wastewater treatment systems, with relative abundances of 0.25%, 7.32%, 9.20%, and 3.97% in the S0 to S3 samples, respectively. This indicated that Defluviimonas could better and more quickly adapt to the high salinity of 3.0% in the system and played an important role as the denitrifying genus with the highest relative abundance in S3. Generally, Nitrosomonas and Nitrospira were the most common AOB and NOB [46]. In low-salinity wastewater treatment systems, the relative abundances of AOB and NOB detected in the S0 samples of this system were 0.19% and 0.44%. However, when the salinity was increased to 3.0%, the relative abundance of Nitrosomonas rapidly decreased to 0.02% and Nitrospira was no longer able to be detected, which confirmed the view that salinity was more effective in inhibiting NOB than AOB. In addition, no other microorganisms with ammonia oxidation function were detected in the S3 sample, indicating that most of the nitrogen in the system was removed through heterotrophic assimilation rather than ammonia oxidation. Furthermore, Denitromonas is a typical heterotrophic denitrifying bacterium and a common dominant genus in systems with high salinity or sulfate concentration [47], playing an important role in organic matter degradation and denitrification. Moreover, the relative abundance of the dominant genus Halomonas with function of aerobic denitrification increased from 0.02% to 0.19% with the increase in salinity. The typical halophilic genus Halomonas has denitrification characteristics and some species in Halomonas has the function of heterotrophic nitrification–aerobic denitrification [48]. The relative abundance of other typical heterotrophic denitrifying genera, such as Vitellibacter and Marinicella, also increased significantly. The relative abundances of other denitrifying genera, such as Dokdonella, Ferruginibacter, Terrimonas, Flavobacterium, Zoogloea, and Thauera, gradually decreased with the increase in salinity, and most of them could not be detected in S3. The relative abundance of bacteria associated with nitrogen removal in the sample at the genus level is shown in Table 2.
3.3.3. FAPROTAX Functional Predictive Analysis
FAPROTAX is a database based on literature-representative cultures that maps bacteria or archaea to metabolic or other ecologically relevant functions (such as nitrification and denitrification). The database contains information on over 4600 species and over 7600 functional predictions and is suitable for functional predictions of biogeochemical cycling of major elements in environmental samples [49]. The functions of FAPROTAX are mainly concentrated on biogeochemistry in oceans and lakes, particularly sulfur, nitrogen, hydrogen, and carbon cycling. Therefore, many studies used FAPROTAX for functional annotation of bacteria and archaea in various ecosystems, analyzing the potential functions and mechanisms of microbial communities [50].
The results of FAPROTAX functional prediction analysis are shown in Figure 6. From the color changes in the functional prediction map, it was found that salinity could significantly affect the number of microbial communities, reducing the number of functional bacterial communities. A total of 63 bacterial functional classifications such as chemoheterotrophy, aerobic chemoheterotrophy, animal parasites or symbionts, and nitrate reduction were involved in bacterial communities of different salinities. The microbial community functions of the top five in S0, S1, S2, and S3 samples were also counted, as shown in Table 3. The relative abundance of chemoheterotrophy and aerobic chemoheterotrophy occupied the top two positions in all four samples, and the relative abundance was above 25% except for the S0 sample where the aerobic chemoheterotrophy was 18.11%. This was the same as the conclusion obtained in the previous paper, where the increase in the salinity may change the degradation process of organic matter, but it will not have a significant effect on the COD removal capacity of the system. In addition, the increase in feedwater salinity also had a positive effect on COD removal, with the sum of chemo- and anabolic heterotrophy gradually increasing from 43.99% in S0 to 60.84% in S3. The abundance of nitrate reduction in the four samples was 2.77%, 10.79%, 9.15%, and 7.29%, respectively, while the abundance of genes related to nitrate respiration and nitrogen respiration increased from 2.69% and 2.69% in S0 with the highest salinity. The abundance of genes related to nitrate respiration increased from 2.69% in S0 to 10.78% with increasing salinity, and finally stabilized to 6.76% at 3% salinity, indicating that the microbial N conversion capacity was promoted at less than 2% and somewhat inhibited at higher than 2%. Furthermore, a decrease in human pathogens, all from 5.77% to 3.23%, was observed in the context of a significant decrease in the microbial population of the samples, indicating a decrease in the pathogenicity of the sludge in the reactor.
In conclusion, the abundance of functional genes involved in organic matter degradation gradually increased with increasing salinity. The abundance of functional genes involved in nitrogen metabolism first increased and then decreased with increasing feedwater salinity. This result indicates that the organic matter degrading bacteria in the high salinity SBBR system were gradually enriched, while the nitrogen metabolizing bacteria got promoted in salinity below 2% salinity and inhibited vice versa.
3.4. Effects of Salinity on Nitrogen Removal Pathways
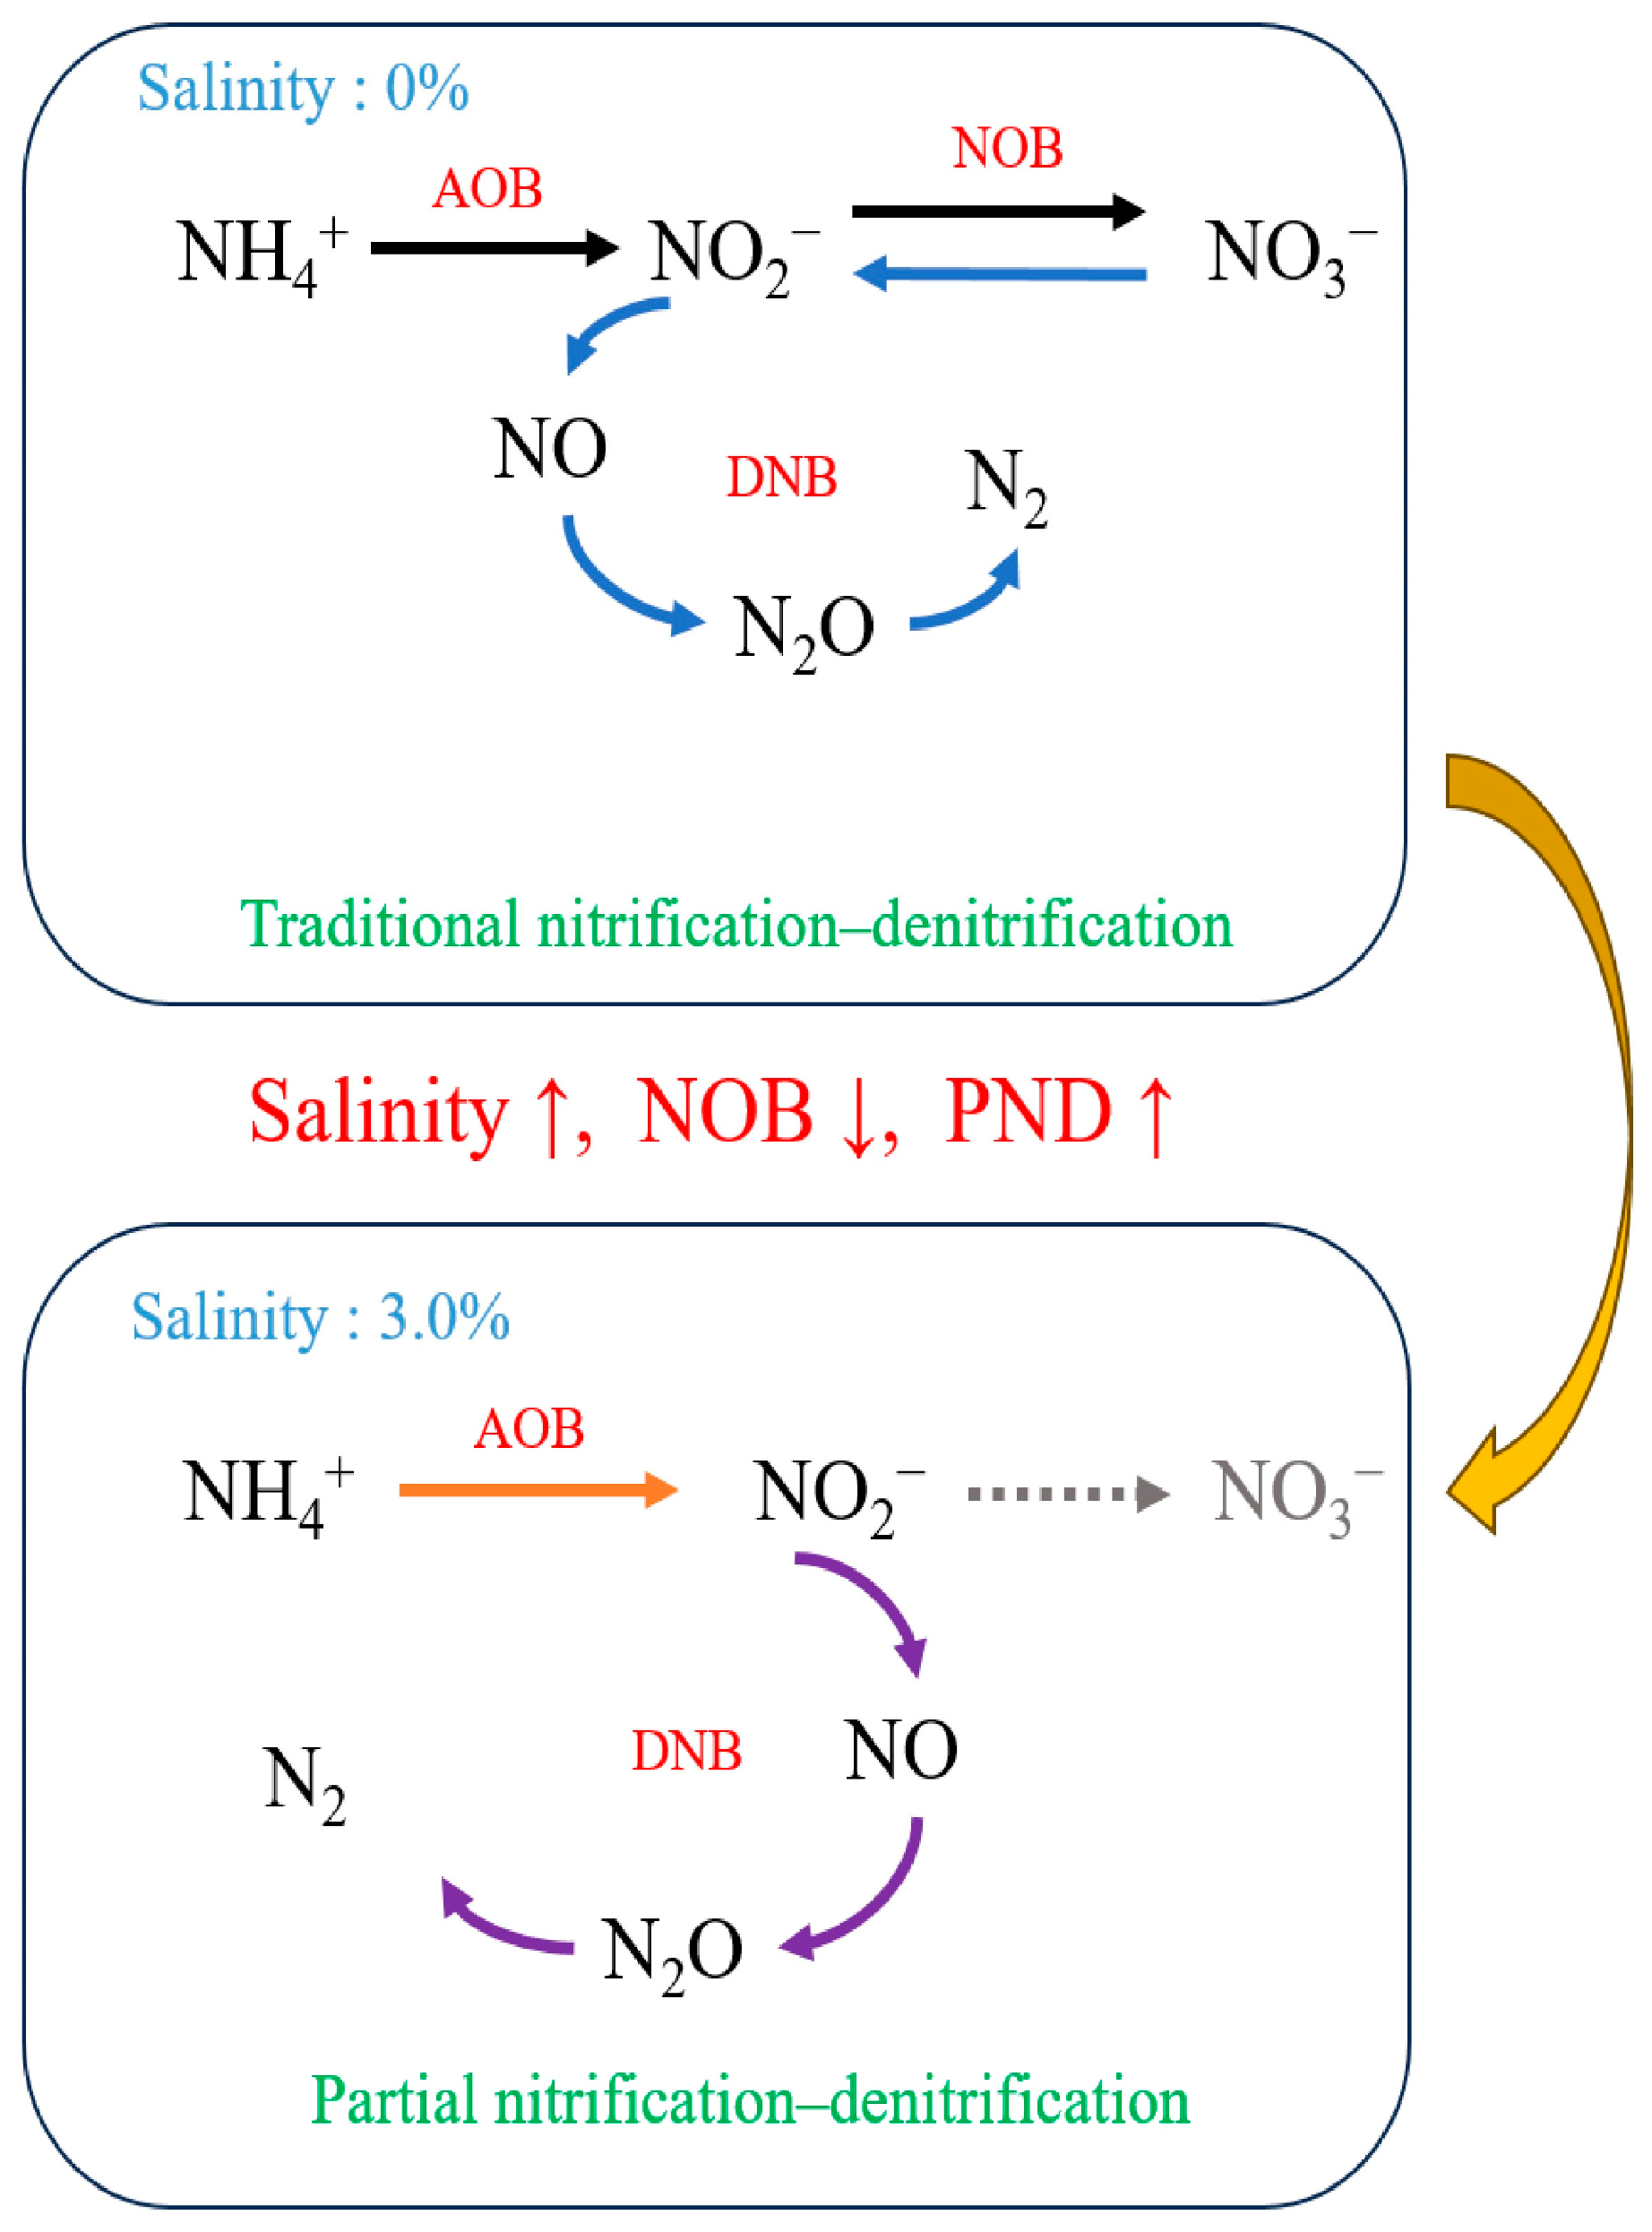
With the increase in salinity, the SBBR system might experience temporary fluctuations in treatment efficiency. But, in general, the salinity increase had a small effect on the treatment effect of the system. During the whole operation period, the average removal rates of COD, TN, and NH4+-N were 92.20%, 91.12%, and 97.47%. The system had efficient nitrification and denitrification. The concentration of NO2−-N in effluent was related to nitrification and denitrification processes. During the nitrification process, the NOB (NO2−-N to NO3−-N) grew twice as fast as the AOB (NH4+-N to NO2−-N) [51]. During denitrification, microorganisms reduced NO2−-N to gaseous nitrogen compounds at a higher rate than NO3−-N [52]. Therefore, the change of effluent NO2−-N concentration from low to high with the change of salinity reflected the gradual transformation of the system nitrogen removal path.
When the salinity was 0%, AOB, NOB, and DNB could be detected in the system, indicating that traditional nitrification and denitrification were the main nitrogen removal pathways in the SBBR system. However, as salinity increased, both AOB and NOB growth were inhibited, with NOB being more strongly affected. At a salinity of 3.0%, the relative abundance of AOB and DNB decreased but remained detectable; however, due to inhibition, the relative abundance of NOB decreased to zero. Consequently, at this point, there was a shift from traditional nitrification and denitrification to short-range nitrification and denitrification for nitrogen removal in the system. The change in the nitrogen removal pathway of the system is shown in Figure 7.
4. Conclusions
In this study, the effect of salinity enhancement on SBBR treatment of high-salt pickle wastewater was analyzed by upgrading the salt concentration in the wastewater in a gradient. The main conclusions of this paper are as follows:
(1) Through acclimation to salinity, stable operation of the SBBR system was achieved at a salinity level of 3.0%, with removal efficiencies for COD, TN, and NH4+-N reaching approximately 96%, 93%, and 99%, respectively. Although high salinity can impact reactor performance, it can be mitigated through acclimation, with a greater influence observed on COD removal compared to denitrification efficiency.
(2) Salinity exerts a significant impact on microbial diversity, system functionality, and system stability. As salinity increases (from 0% to 3.0%), the microbial diversity of SBBR experiences a notable decrease, accompanied by alterations in the microbial community structure within the system. It is evident that increasing salinity strongly inhibits NOB while gradually promoting PND as the primary denitrification pathway.
(3) Salinity plays a crucial role in shaping microbial functions, whereby an increase in salinity leads to gradual enrichment of functional genes associated with organic matter degradation. Conversely, there exists an initial increase followed by subsequent decline in functional genes related to nitrogen metabolism when feedwater salinity rises. The high salinity SBBR system demonstrates progressive enrichment of organic matter-degrading bacteria, whereas nitrogen metabolizing bacteria are promoted at salinities below 2% but are inhibited beyond this threshold.
Supplementary Materials
The following supporting information can be downloaded at: https://www.mdpi.com/article/10.3390/w16091312/s1, Figure S1: Experiment equipment; Figure S2: Standard curve for TN; Figure S3: Standard curve for NH4+-N; Figure S4: Standard curve for NO2−-N; Figure S5: Standard curve for NO3−-N; Table S1: Trace element nutrient solution.
Author Contributions
Conceptualization, H.G.; Methodology, N.S., H.G., T.Y., Y.G. and P.Y.; Formal analysis, N.S. and T.Y.; Writing—original draft, N.S.; Writing—review & editing, L.X. and P.Y.; Funding acquisition, L.X. All authors have read and agreed to the published version of the manuscript.
Funding
The research was supported by Science & Technology Department of Sichuan Province Regional Innovation Project (2022FYQ0036).
Data Availability Statement
Data are contained within the article.
Conflicts of Interest
The authors declare no conflict of interest.
References
- Liang, Y.; Zhu, H.; Banuelos, G.; Yan, B.; Zhou, Q.; Yu, X.; Cheng, X. Constructed wetlands for saline wastewater treatment: A review. Ecol. Eng. 2017, 98, 275–285. [Google Scholar] [CrossRef]
- He, H.; Chen, Y.; Li, X.; Cheng, Y.; Yang, C.; Zeng, G. Influence of salinity on microorganisms in activated sludge processes: A review. Int. Biodeterior. Biodegrad. 2017, 119, 520–527. [Google Scholar] [CrossRef]
- Liang, Y.; Zhu, H.; Banuelos, G.; Yan, B.; Shutes, B.; Cheng, X.; Chen, X. Removal of nutrients in saline wastewater using constructed wetlands: Plant species, influent loads and salinity levels as influencing factors. Chemosphere 2017, 187, 52–61. [Google Scholar] [CrossRef] [PubMed]
- Mirbolooki, H.; Amirnezhad, R.; Pendashteh, A.R. Treatment of high saline textile wastewater by activated sludge microorganisms. J. Appl. Res. Technol. 2017, 15, 167–172. [Google Scholar] [CrossRef]
- Ahmadi, M.; Jorfi, S.; Kujlu, R.; Ghafari, S.; Soltani, R.D.C.; Haghighifard, N.J. A novel salt-tolerant bacterial consortium for biodegradation of saline and recalcitrant petrochemical wastewater. J. Environ. Manag. 2017, 191, 198–208. [Google Scholar] [CrossRef] [PubMed]
- Saidulu, D.; Gupta, B.; Gupta, A.K.; Ghosal, P.S. A review on occurrences, eco-toxic effects, and remediation of emerging contaminants from wastewater: Special emphasis on biological treatment based hybrid systems. J. Environ. Chem. Eng. 2021, 9, 105282. [Google Scholar] [CrossRef]
- Sierra, J.D.M.; Oosterkamp, M.J.; Wang, W.; Spanjers, H.; van Lier, J.B. Comparative performance of upflow anaerobic sludge blanket reactor and anaerobic membrane bioreactor treating phenolic wastewater: Overcoming high salinity. Chem. Eng. J. 2019, 366, 480–490. [Google Scholar] [CrossRef]
- Chen, D.; Wang, Z.; Zhang, M.; Wang, X.; Lu, S. Effect of increasing salinity and low C/N ratio on the performance and microbial community of a sequencing batch reactor. Environ. Technol. 2021, 42, 1213–1224. [Google Scholar] [CrossRef] [PubMed]
- Khatibi, S.M.H.; Vahed, F.Z.; Sharifi, S.; Ardalan, M.; Shoja, M.M.; Vahed, S.Z. Osmolytes resist against harsh osmolarity: Something old something new. Biochimie 2019, 158, 156–164. [Google Scholar] [CrossRef]
- Zhang, Z.Y.; Zhou, J.T.; Wang, J.; Guo, H.Y.; Tong, J.A. Integration of nitrification and denitrifying dephosphatation in airlift loop sequencing batch biofilm reactor. Process Biochem. 2006, 41, 599–608. [Google Scholar] [CrossRef]
- Chao, C.; Zhao, Y.; Jayant, K.; Ji, M.; Wang, Z.; Li, X. Simultaneous removal of COD, nitrogen and phosphorus and the tridimensional microbial response in a sequencing batch biofilm reactor: With varying C/N/P ratios. Biochem. Eng. J. 2020, 154, 107215. [Google Scholar] [CrossRef]
- Jagaba, A.H.; Kutty, S.R.M.; Noor, A.; Birniwa, A.H.; Affam, A.C.; Lawal, I.M.; Kankia, M.U.; Kilaco, A.U. A systematic literature review of biocarriers: Central elements for biofilm formation, organic and nutrients removal in sequencing batch biofilm reactor. J. Water Process Eng. 2021, 42, 102178. [Google Scholar] [CrossRef]
- Wang, J.; Zhou, J.; Wang, Y.; Wen, Y.; He, L.; He, Q. Efficient nitrogen removal in a modified sequencing batch biofilm reactor treating hypersaline mustard tuber wastewater: The potential multiple pathways and key microorganisms. Water Res. 2020, 177, 115734. [Google Scholar] [CrossRef] [PubMed]
- Fu, B.; Liao, X.; Ding, L.; Ren, H. Characterization of microbial community in an aerobic moving bed biofilm reactor applied for simultaneous nitrification and denitrification. World J. Microbiol. Biotechnol. 2010, 26, 1981–1990. [Google Scholar] [CrossRef]
- Chen, W.; Dai, X.; Cao, D.; Wang, S.; Hu, X.; Liu, W.; Yang, D. Performance and microbial ecology of a nitritation sequencing batch reactor treating high-strength ammonia wastewater. Sci. Rep. 2016, 6, 35693. [Google Scholar] [CrossRef] [PubMed]
- Wang, J.; Li, L.; Liu, Y.; Li, W. A review of partial nitrification in biological nitrogen removal processes: From development to application. Biodegradation 2021, 32, 229–249. [Google Scholar] [CrossRef] [PubMed]
- HJ 828-2017; Water Quality-Determination of the Chemical Oxygen Demand-Dichromatemethod. 2017. Available online: https://www.chinesestandard.net/PDF.aspx/HJ828-2017 (accessed on 24 April 2024).
- HJ 636-2012; Water Quality-Determination of Total Nitrogen-Alkaline Potassium Persulfate Digestion UV Spectrophotometric Method. Available online: https://www.chinesestandard.net/PDF.aspx/HJ636-2012 (accessed on 24 April 2024).
- HJ 535-2009; Water Quality―Determination of Ammonia Nitrogen―Nessler’s Reagent Spectrophotometry. 2009. Available online: https://www.chinesestandard.net/PDF.aspx/HJ535-2009 (accessed on 24 April 2024).
- GB 7480-87; Water Quality-Determination of Nitrate-Spectrophotometric Method with Phenol Disulfonic Acid, China. 1987. Available online: https://english.mee.gov.cn/Resources/standards/water_environment/method_standard2/200807/t20080710_125451.shtml (accessed on 24 April 2024).
- GB 7493-87; Water Quality-Determination of Nitrogen (Nitrite)-Spectrophotometric Method. 1987. Available online: https://english.mee.gov.cn/Resources/standards/water_environment/method_standard2/200807/t20080710_125478.shtml (accessed on 24 April 2024).
- Zhang, X.; Medrano, R.F.; Wang, M.; Beauchemin, K.A.; Ma, Z.; Wang, R.; Wen, J.; Bernard, L.A.; Tan, Z. Effects of urea plus nitrate pretreated rice straw and corn oil supplementation on fiber digestibility, nitrogen balance, rumen fermentation, microbiota and methane emissions in goats. J. Anim. Sci. Biotechnol. 2019, 10, 6. [Google Scholar] [CrossRef] [PubMed]
- Huang, Z.; Wang, Y.; Jiang, L.; Xu, B.; Wang, Y.; Zhao, H.; Zhou, W. Mechanism and performance of a self-flocculating marine bacterium in saline wastewater treatment. Chem. Eng. J. 2018, 334, 732–740. [Google Scholar] [CrossRef]
- Sierra, J.D.M.; Oosterkamp, M.J.; Wang, W.; Spanjers, H.; van Lier, J.B. Impact of long-term salinity exposure in anaerobic membrane bioreactors treating phenolic wastewater: Performance robustness and endured microbial community. Water Res. 2018, 141, 172–184. [Google Scholar] [CrossRef]
- Luo, W.; Phan, H.V.; Hai, F.I.; Price, W.E.; Guo, W.; Ngo, H.H.; Yamamoto, K.; Nghiem, L.D. Effects of salinity build-up on the performance and bacterial community structure of a membrane bioreactor. Bioresour. Technol. 2016, 200, 305–310. [Google Scholar] [CrossRef]
- Chen, H.; Wang, Y.; Chen, Z.; Wu, Z.; Chu, X.; Qing, S.; Xu, L.; Yang, K.; Meng, Q.; Cheng, H.; et al. Effects of salinity on anoxic-oxic system performance, microbial community dynamics and co-occurrence network during treating wastewater. Chem. Eng. J. 2023, 461, 141969. [Google Scholar] [CrossRef]
- Chen, J.; Han, Y.; Wang, Y.; Gong, B.; Zhou, J.; Qing, X. Start-up and microbial communities of a simultaneous nitrogen removal system for high salinity and high nitrogen organic wastewater via heterotrophic nitrification. Bioresour. Technol. 2016, 216, 196–202. [Google Scholar] [CrossRef] [PubMed]
- Choi, H.-J.; Lee, S.-M.; Choi, C.-H.; Kwon, M.-C.; Lee, H.-Y. Influence of the wastewater composition on denitrification and biological p-removal in the S-DN-P-process (b) Effect of acetate. J. Hazard. Mater. 2008, 158, 151–156. [Google Scholar] [CrossRef] [PubMed]
- Lu, J.; Yan, X.; Ma, Y.-f.; Tian, C.-x.; Ding, J.-c. Impact of salinity on treatment of saline wastewater by sequencing batch biofilm reactor process. J. Cent. S. Univ. 2014, 21, 1989–1994. [Google Scholar] [CrossRef]
- Guo, J.; Peng, Y.; Huang, H.; Wang, S.; Ge, S.; Zhang, J.; Wang, Z. Short- and long-term effects of temperature on partial nitrification in a sequencing batch reactor treating domestic wastewater. J. Hazard. Mater. 2010, 179, 471–479. [Google Scholar] [CrossRef] [PubMed]
- She, Z.; Zhao, L.; Zhang, X.; Jin, C.; Guo, L.; Yang, S.; Zhao, Y.; Gao, M. Partial nitrification and denitrification in a sequencing batch reactor treating high-salinity wastewater. Chem. Eng. J. 2016, 288, 207–215. [Google Scholar] [CrossRef]
- Aslan, S.; Simsek, E. Influence of salinity on partial nitrification in a submerged biofilter. Bioresour. Technol. 2012, 118, 24–29. [Google Scholar] [CrossRef] [PubMed]
- Zhang, L.; Gao, G.; Tang, X.; Shao, K.; Bayartu, S.; Dai, J. Bacterial community changes along a salinity gradient in a Chinese wetland. Can. J. Microbiol. 2013, 59, 611–619. [Google Scholar] [CrossRef]
- Chu, G.; Yu, D.; Wang, X.; Wang, Q.; He, T.; Zhao, J. Comparison of nitrite accumulation performance and microbial community structure in endogenous partial denitrification process with acetate and glucose served as carbon source. Bioresour. Technol. 2021, 320, 124405. [Google Scholar] [CrossRef]
- Zhang, M.; Gao, J.; Fan, Y.; Liu, Q.; Zhu, C.; Ge, L.; He, C.; Wu, J. Comparisons of nitrite accumulation, microbial behavior and nitrification kinetic in continuous stirred tank (ST) and plug flow (PF) moving bed biofilm reactors. Chemosphere 2021, 278, 130410. [Google Scholar] [CrossRef]
- Shukla, R.; Ahammad, S.Z. Performance evaluation and microbial community structure of a modified trickling filter and conventional activated sludge process in treating urban sewage. Sci. Total Environ. 2022, 853, 158331. [Google Scholar] [CrossRef] [PubMed]
- Fang, H.; Cai, L.; Yu, Y.; Zhang, T. Metagenomic analysis reveals the prevalence of biodegradation genes for organic pollutants in activated sludge. Bioresour. Technol. 2013, 129, 209–218. [Google Scholar] [CrossRef] [PubMed]
- Tang, B.; Chen, Q.; Bin, L.; Huang, S.; Zhang, W.; Fu, F.; Li, P. Insight into the microbial community and its succession of a coupling anaerobic-aerobic biofilm on semi-suspended bio-carriers. Bioresour. Technol. 2018, 247, 591–598. [Google Scholar] [CrossRef] [PubMed]
- Li, L.; Dong, Y.; Qian, G.; Hu, X.; Ye, L. Performance and microbial community analysis of bio-electrocoagulation on simultaneous nitrification and denitrification in submerged membrane bioreactor at limited dissolved oxygen. Bioresour. Technol. 2018, 258, 168–176. [Google Scholar] [CrossRef] [PubMed]
- He, Q.; Song, Q.; Zhang, S.; Zhang, W.; Wang, H. Simultaneous nitrification, denitrification and phosphorus removal in an aerobic granular sequencing batch reactor with mixed carbon sources: Reactor performance, extracellular polymeric substances and microbial successions. Chem. Eng. J. 2018, 331, 841–849. [Google Scholar] [CrossRef]
- Fujii, N.; Kuroda, K.; Narihiro, T.; Aoi, Y.; Ozaki, N.; Ohashi, A.; Kindaichi, T. Metabolic Potential of the Superphylum Patescibacteria Reconstructed from Activated Sludge Samples from a Municipal Wastewater Treatment Plant. Microbes Environ. 2022, 37, ME22012. [Google Scholar] [CrossRef] [PubMed]
- Liu, W.T.; Hanada, S.; Marsh, T.L.; Kamagata, Y.; Nakamura, K. Kineosphaera limosa gen. nov., sp nov., a novel Gram-positive polyhydroxyalkanoate-accumulating coccus isolated from activat sludge. Int. J. Syst. Evol. Microbiol. 2002, 52, 1845–1849. [Google Scholar] [CrossRef] [PubMed]
- Zhao, Y.; Park, H.-D.; Park, J.-H.; Zhang, F.; Chen, C.; Li, X.; Zhao, D.; Zhao, F. Effect of different salinity adaptation on the performance and microbial community in a sequencing batch reactor. Bioresour. Technol. 2016, 216, 808–816. [Google Scholar] [CrossRef] [PubMed]
- Zhang, L.; Hao, S.; Wang, Y.; Lan, S.; Dou, Q.; Peng, Y. Rapid start-up strategy of partial denitrification and microbially driven mechanism of nitrite accumulation mediated by dissolved organic matter. Bioresour. Technol. 2021, 340, 125663. [Google Scholar] [CrossRef]
- Liu, Y.; Lai, Q.; Wang, W.; Shao, Z. Defluviimonas nitratireducens sp nov., isolated from surface seawater. Int. J. Syst. Evol. Microbiol. 2017, 67, 2752–2757. [Google Scholar] [CrossRef]
- Ye, L.; Shao, M.-F.; Zhang, T.; Tong, A.H.Y.; Lok, S. Analysis of the bacterial community in a laboratory-scale nitrification reactor and a wastewater treatment plant by 454-pyrosequencing. Water Res. 2011, 45, 4390–4398. [Google Scholar] [CrossRef] [PubMed]
- Gao, X.-Y.; Xu, Y.; Liu, Y.; Liu, Y.; Liu, Z.-P. Bacterial diversity, community structure and function associated with biofilm development in a biological aerated filter in a recirculating marine aquaculture system. Mar. Biodivers. 2012, 42, 1–11. [Google Scholar] [CrossRef]
- Guo, Y.; Zhou, X.; Li, Y.; Li, K.; Wang, C.; Liu, J.; Yan, D.; Liu, Y.; Yang, D.; Xing, J. Heterotrophic nitrification and aerobic denitrification by a novel Halomonas campisalis. Biotechnol. Lett. 2013, 35, 2045–2049. [Google Scholar] [CrossRef]
- Louca, S.; Parfrey, L.W.; Doebeli, M. Decoupling function and taxonomy in the global ocean microbiome. Science 2016, 353, 1272–1277. [Google Scholar] [CrossRef] [PubMed]
- Xu, Z.; Ma, Y.; Zhang, L.; Han, Y.; Yuan, J.; Li, G.; Luo, W. Relating bacterial dynamics and functions to gaseous emissions during composting of kitchen and garden wastes. Sci. Total Environ. 2021, 767, 144210. [Google Scholar] [CrossRef] [PubMed]
- Zhang, M.; Wang, Z.-J.; Huang, J.-C.; Sun, S.; Cui, X.; Zhou, W.; He, S. Salinity-driven nitrogen removal and its quantitative molecular mechanisms in artificial tidal wetlands. Water Res. 2021, 202, 117446. [Google Scholar] [CrossRef]
- Chyan, J.M.; Huang, S.C.; Lin, C.J. Impacts of salinity on degradation of pollutions in hybrid constructed wetlands. Int. Biodeterior. Biodegrad. 2017, 124, 176–187. [Google Scholar] [CrossRef]
Figure 1.
Effect of SBBR treatment under different salinity conditions: (a) COD removal efficiency; (b) TN removal efficiency; (c) NH4+-N, NO2−-N, NO3−-N removal efficiency.
Figure 1.
Effect of SBBR treatment under different salinity conditions: (a) COD removal efficiency; (b) TN removal efficiency; (c) NH4+-N, NO2−-N, NO3−-N removal efficiency.

Figure 2.
Periodic nitrogen removal by SBBR under different salinity conditions: (a) TN; (b) NH4+-N; (c) NO3−-N; (d) NO2−-N.
Figure 2.
Periodic nitrogen removal by SBBR under different salinity conditions: (a) TN; (b) NH4+-N; (c) NO3−-N; (d) NO2−-N.
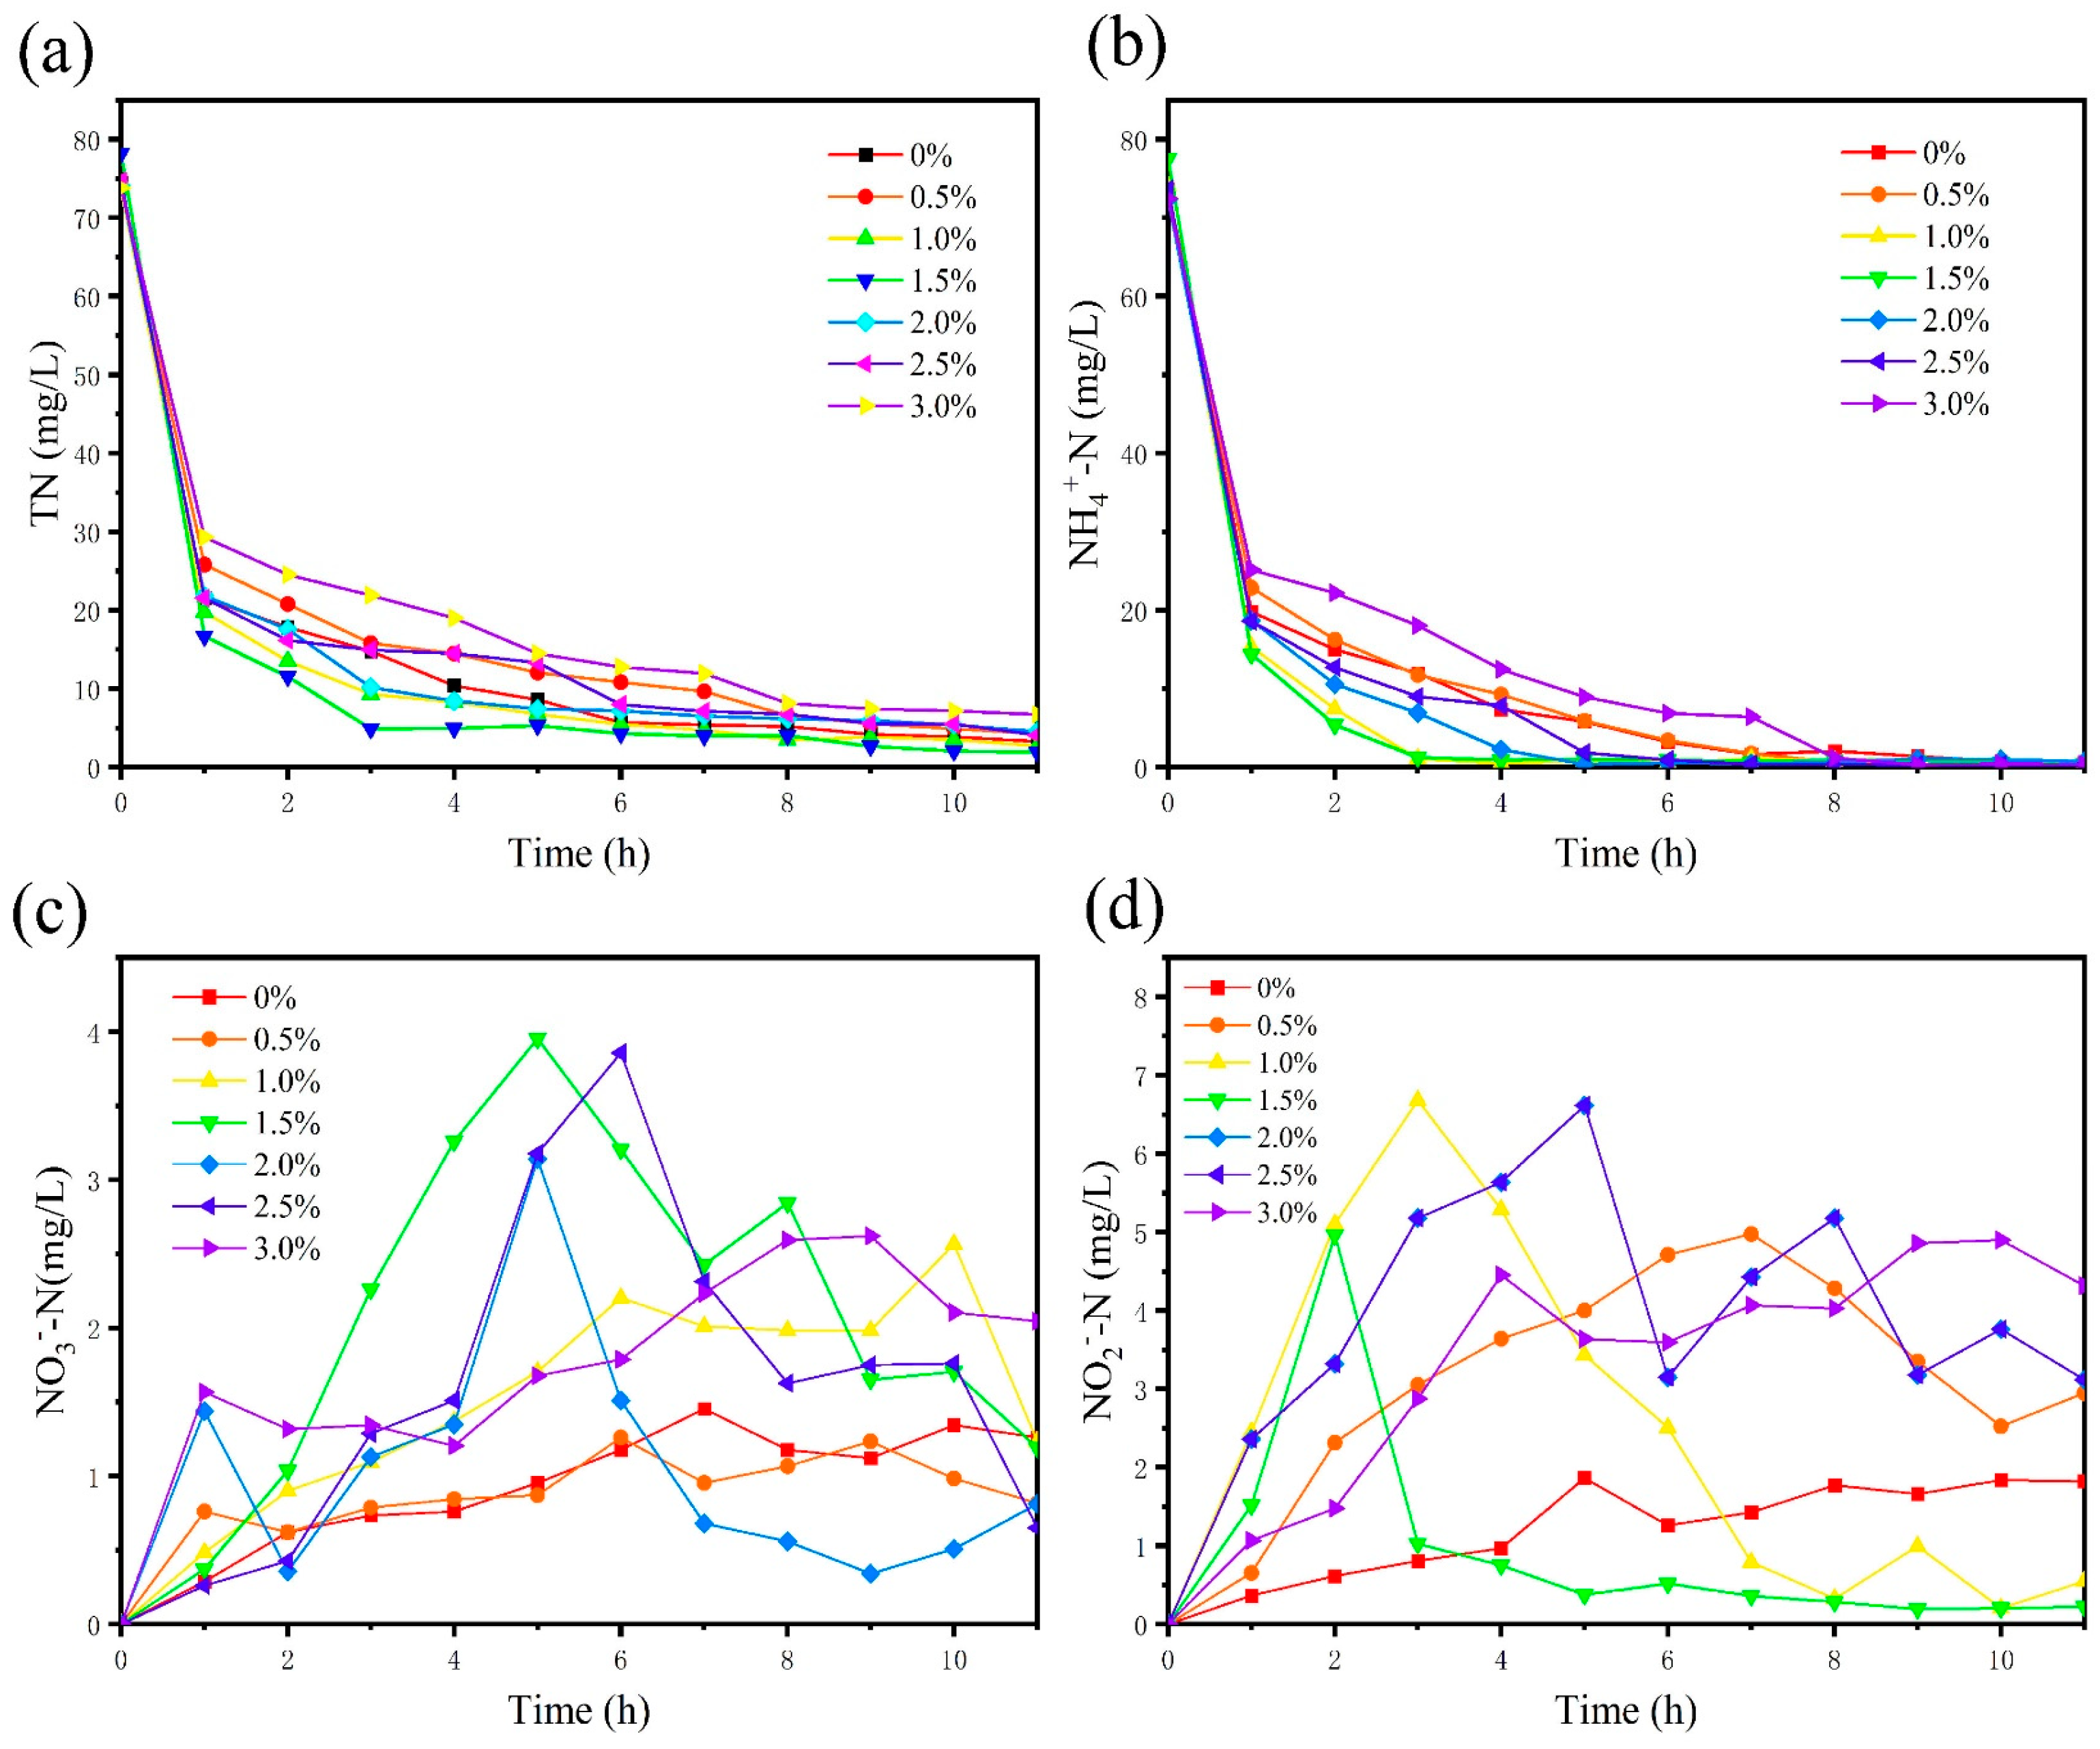
Figure 3.
OTUs based biodiversity of different samples: (a) rarefaction curves; (b) Venn diagram.

Figure 4.
Microbial population structure on the phylum level.
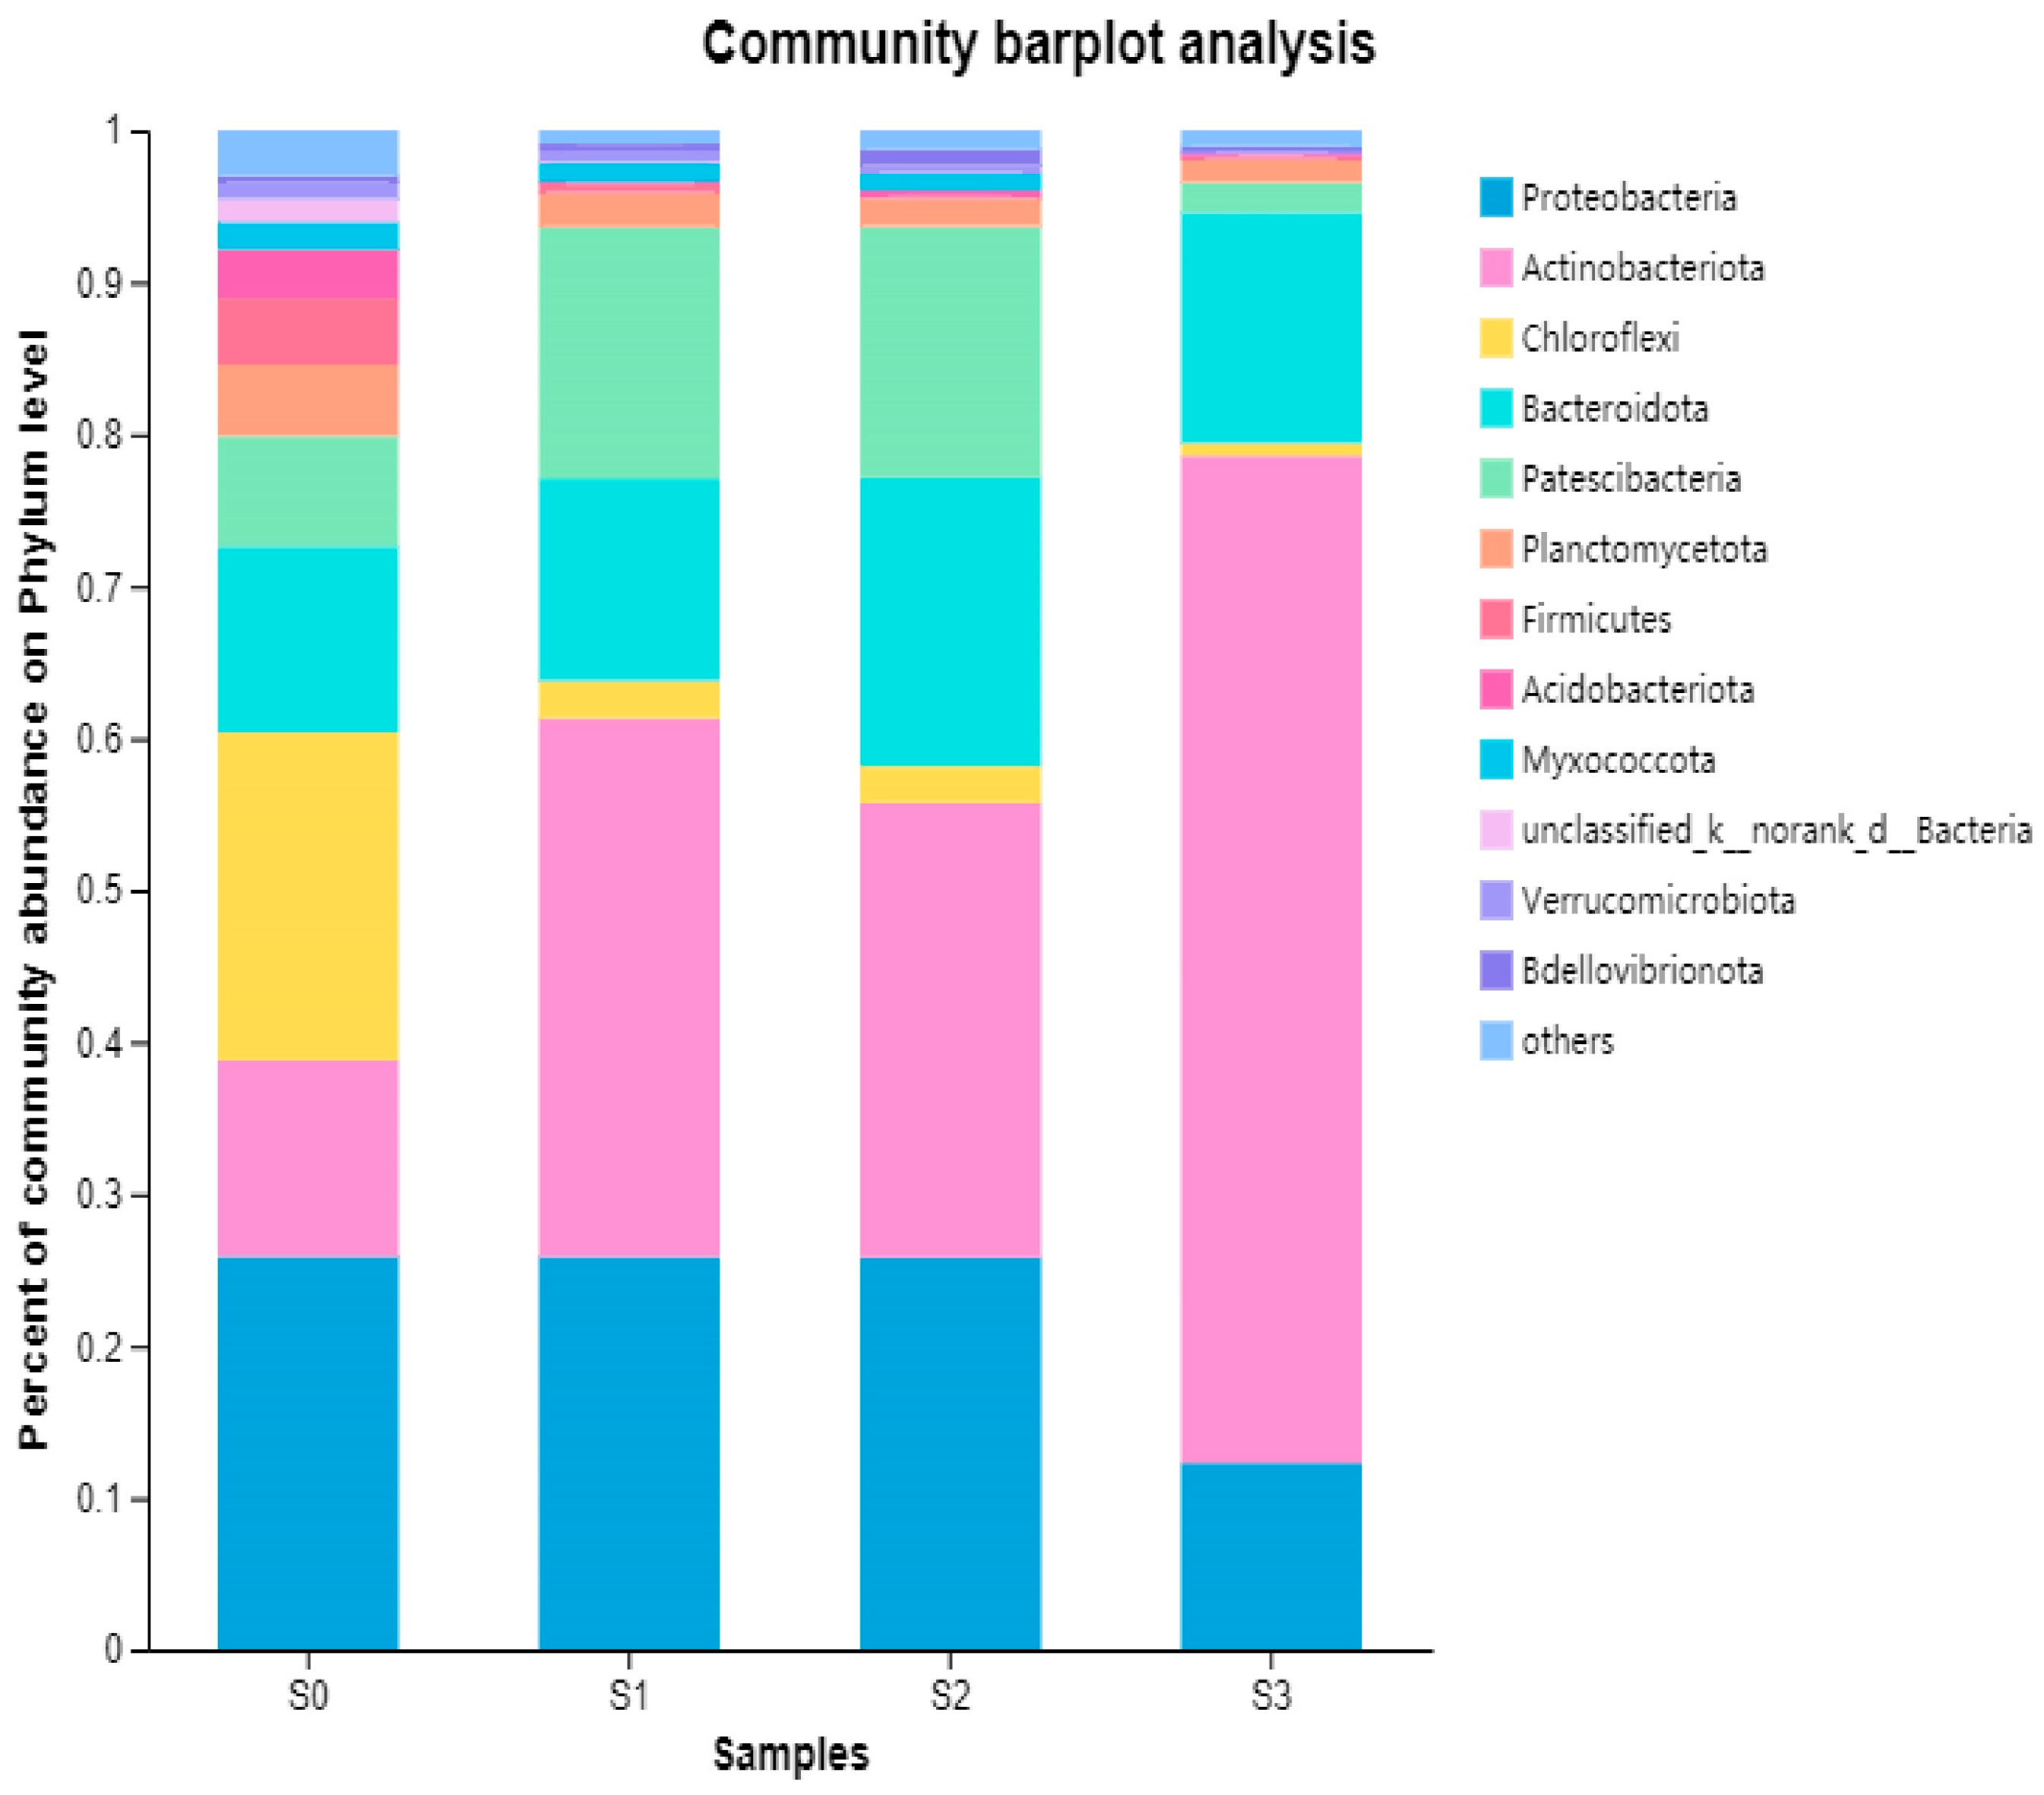
Figure 5.
Microbial population structure at the genus level.

Figure 6.
Circos of metabolic phenotypes/functions of bacteria.
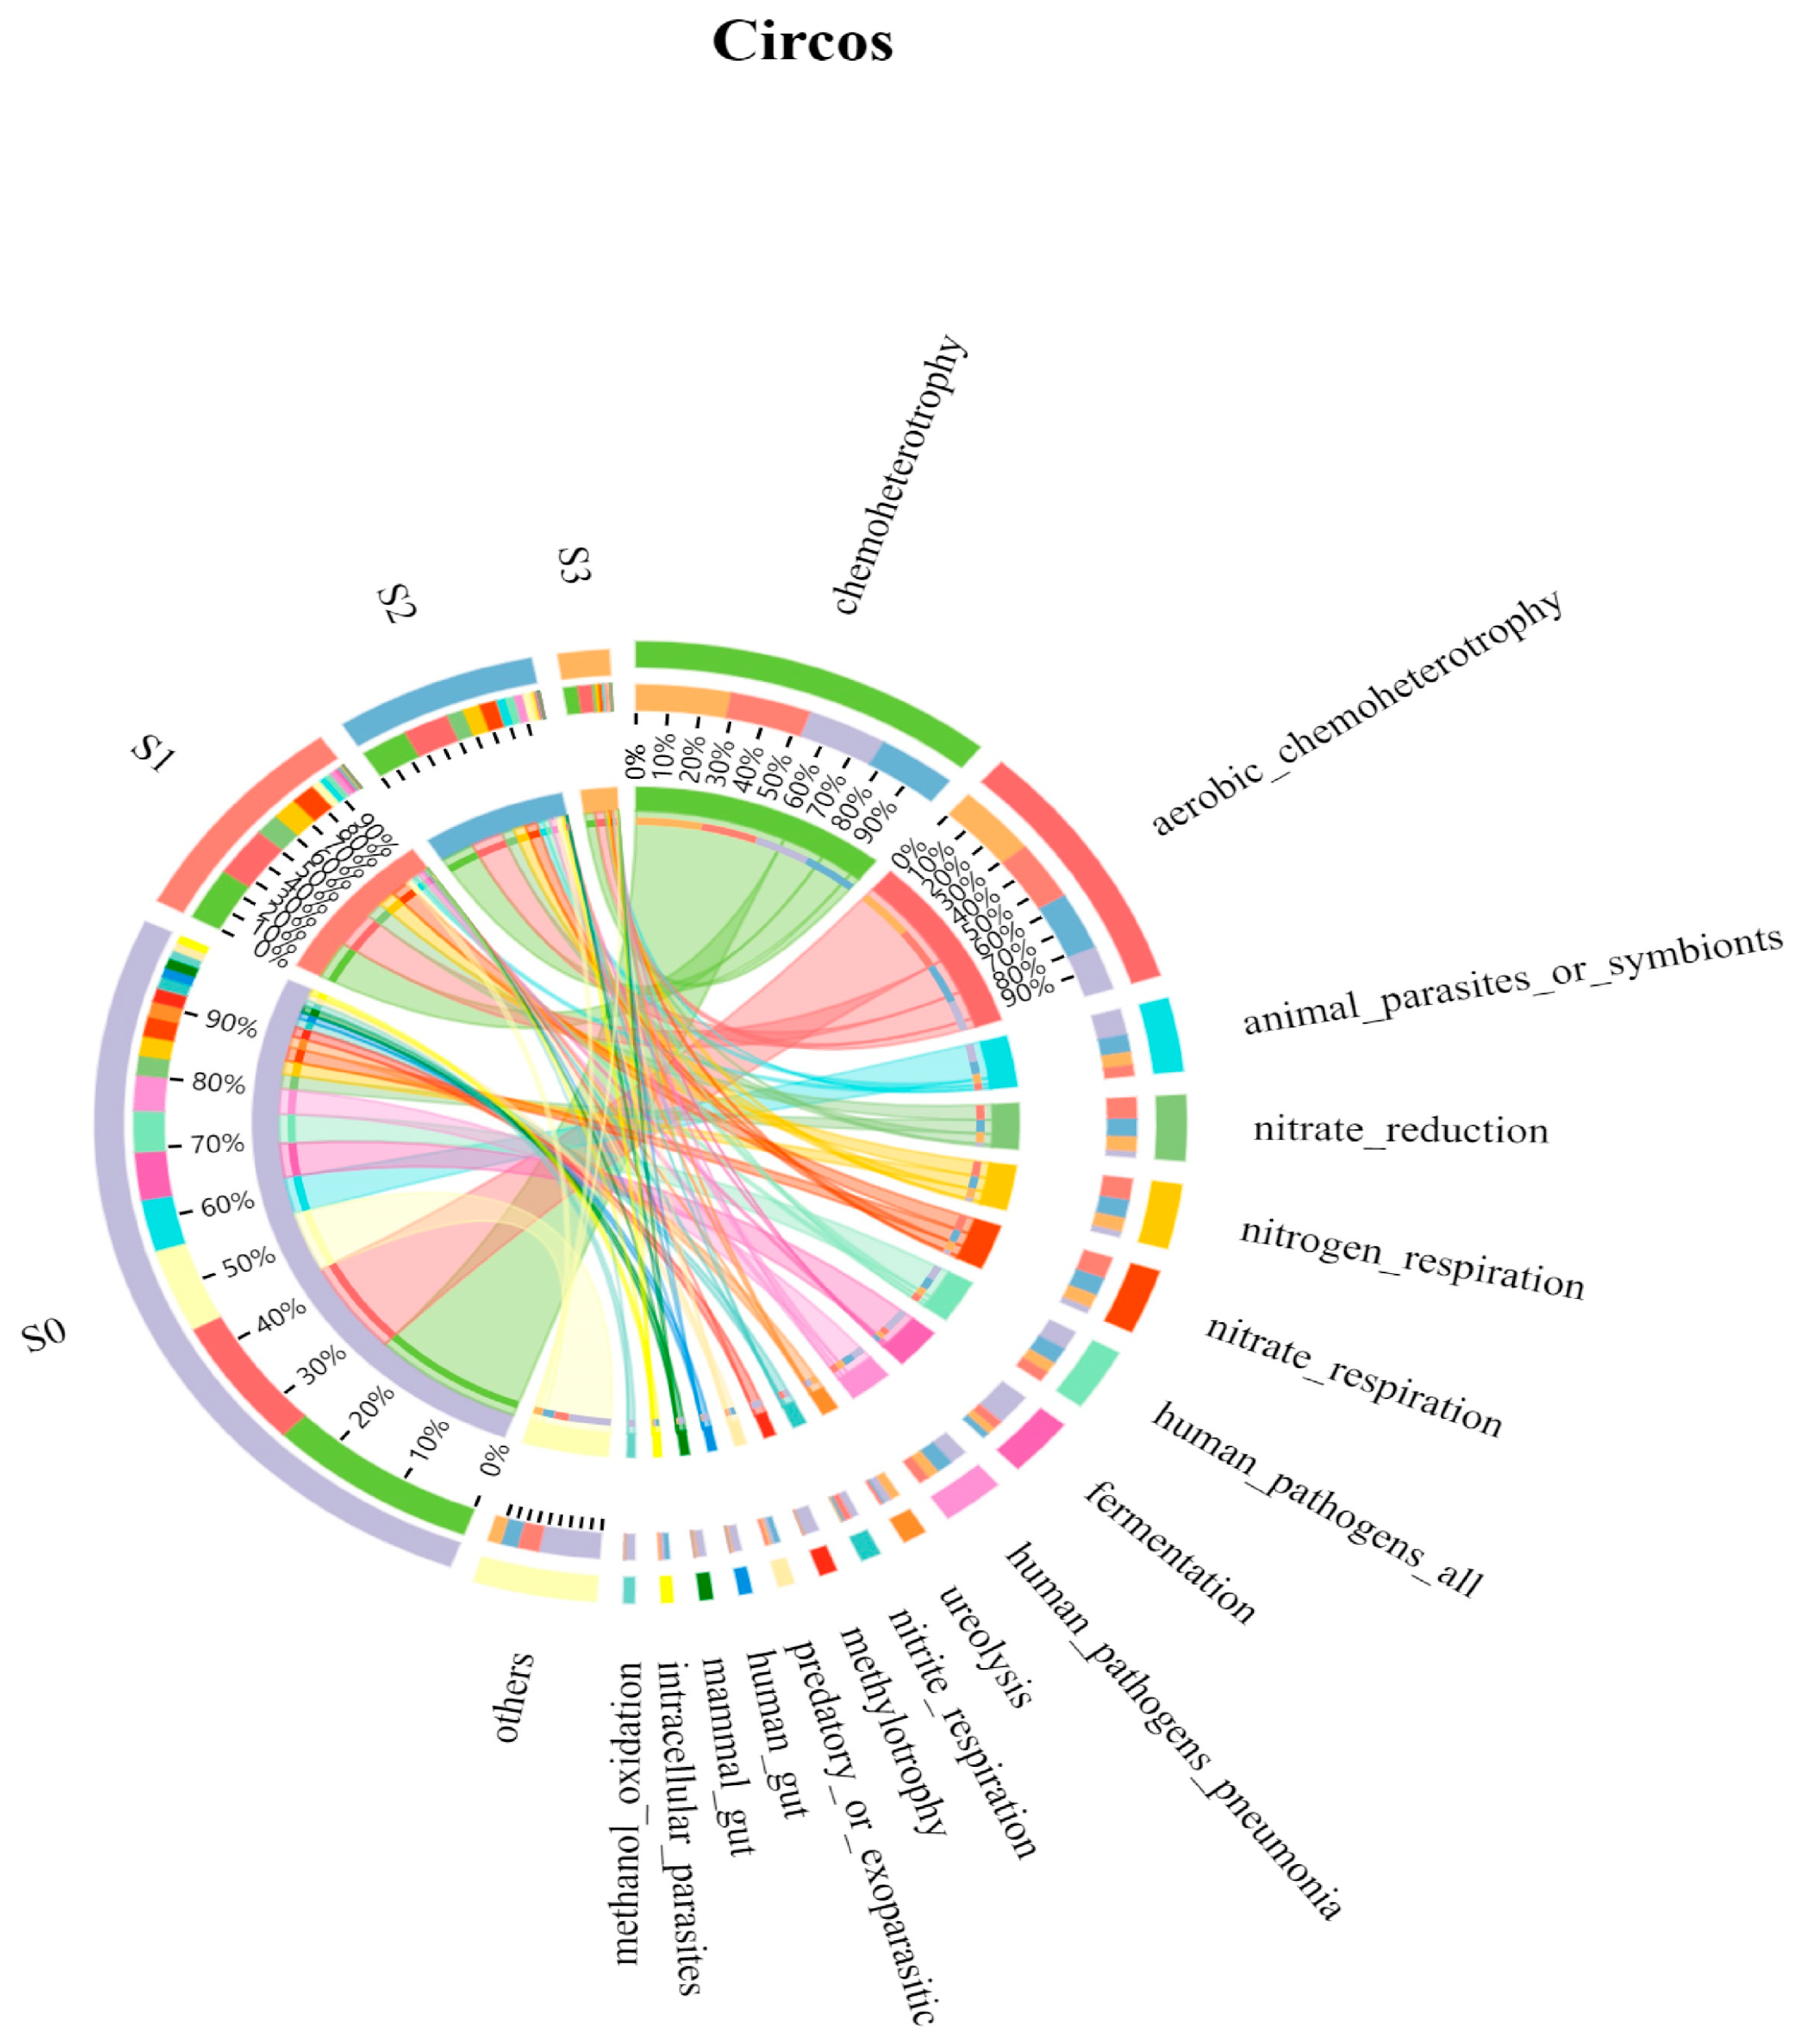
Figure 7.
Nitrogen removal path change diagram.

Table 1.
Microbial diversity statistics table. (S0, samples with 0% salinity; S1, samples with salinity below 1.0%; S2, samples with salinity below 2.0%; S3, samples with salinity below 3.0%).
Table 1.
Microbial diversity statistics table. (S0, samples with 0% salinity; S1, samples with salinity below 1.0%; S2, samples with salinity below 2.0%; S3, samples with salinity below 3.0%).
| Sample | Sobs | Sequences | Shannon | Simpson | ACE | Chao | Coverage |
|---|---|---|---|---|---|---|---|
| S0 | 3446 | 327,372 | 6.238043 | 0.005425 | 3489.067393 | 3460.145492 | 0.99964 |
| S1 | 985 | 74,459 | 3.87143 | 0.062969 | 1328.840345 | 1325.620438 | 0.99589 |
| S2 | 779 | 77,792 | 3.840726 | 0.063959 | 1005.733817 | 1027.65625 | 0.997185 |
| S3 | 288 | 30,825 | 2.098761 | 0.396125 | 395.226902 | 383.357143 | 0.99708 |
Table 2.
Relative abundance of bacteria associated with nitrogen removal in the sample at the genus level.
Table 2.
Relative abundance of bacteria associated with nitrogen removal in the sample at the genus level.
| Name | S0 (%) | S1 (%) | S2 (%) | S3 (%) |
|---|---|---|---|---|
| Nitrosomonas | 0.19 | 0.05 | 0.06 | 0.02 |
| Nitrospira | 0.44 | 0.01 | 0.01 | 0.00 |
| Defluviimonas | 0.25 | 7.32 | 9.20 | 3.97 |
| Thauera | 0.56 | 0.95 | 0.36 | 0.01 |
| Zoogloea | 0.46 | 0.00 | 0.00 | 0.00 |
| Denitromonas | 0.02 | 1.45 | 2.25 | 1.17 |
| Saccharimonadales | 4.87 | 8.77 | 7.76 | 1.84 |
| Flavobacterium | 0.70 | 4.70 | 2.14 | 0.02 |
| Terrimonas | 0.99 | 0.20 | 0.05 | 0.00 |
| Ferruginibacter | 0.54 | 0.00 | 0.00 | 0.00 |
| Dokdonella | 1.49 | 0.06 | 0.07 | 0.02 |
| Pseudomonas | 0.02 | 0.01 | 0.01 | 0.00 |
| Marinicella | 0.00 | 0.00 | 0.00 | 0.41 |
| Halomonas | 0.02 | 0.01 | 0.03 | 0.19 |
| Phaeodactylibacter | 0.13 | 0.14 | 0.03 | 0.00 |
| Defluviicoccus | 0.18 | 4.44 | 1.11 | 0.05 |
Table 3.
Prediction of the main functions and relative abundance.
| Sample | Functional Groups | Relative Abundance (%) |
|---|---|---|
| S0 | Chemoheterotrophy | 25.88 |
| Aerobic chemoheterotrophy | 18.11 | |
| Animal parasites or symbionts | 7.17 | |
| Fermentation | 6.59 | |
| Human pathogens | 5.77 | |
| S1 | Chemoheterotrophy | 26.41 |
| Aerobic chemoheterotrophy | 24.65 | |
| Nitrate reduction | 10.79 | |
| Nitrogen respiration | 10.78 | |
| Nitrate respiration | 10.78 | |
| S2 | Chemoheterotrophy | 25.27 |
| Aerobic chemoheterotrophy | 24.25 | |
| Nitrate reduction | 9.15 | |
| Nitrogen respiration | 9.13 | |
| Nitrate respiration | 9.12 | |
| S3 | Chemoheterotrophy | 30.94 |
| Aerobic chemoheterotrophy | 29.90 | |
| Nitrate reduction | 7.29 | |
| Nitrogen respiration | 6.76 | |
| Nitrate respiration | 3.62 |
Disclaimer/Publisher’s Note: The statements, opinions and data contained in all publications are solely those of the individual author(s) and contributor(s) and not of MDPI and/or the editor(s). MDPI and/or the editor(s) disclaim responsibility for any injury to people or property resulting from any ideas, methods, instructions or products referred to in the content. |
© 2024 by the authors. Licensee MDPI, Basel, Switzerland. This article is an open access article distributed under the terms and conditions of the Creative Commons Attribution (CC BY) license (https://creativecommons.org/licenses/by/4.0/).
Share and Cite
MDPI and ACS Style
Shen, N.; Guo, H.; Yao, T.; Xu, L.; Gao, Y.; Yang, P. Treatment of Pickle Wastewater under Varying Salinity Conditions within the Sequencing Batch Biofilm Reactor System. Water 2024, 16, 1312. https://doi.org/10.3390/w16091312
AMA Style
Shen N, Guo H, Yao T, Xu L, Gao Y, Yang P. Treatment of Pickle Wastewater under Varying Salinity Conditions within the Sequencing Batch Biofilm Reactor System. Water. 2024; 16(9):1312. https://doi.org/10.3390/w16091312
Chicago/Turabian StyleShen, Nuonan, Hongyun Guo, Tingting Yao, Li Xu, Youxian Gao, and Ping Yang. 2024. "Treatment of Pickle Wastewater under Varying Salinity Conditions within the Sequencing Batch Biofilm Reactor System" Water 16, no. 9: 1312. https://doi.org/10.3390/w16091312
Note that from the first issue of 2016, this journal uses article numbers instead of page numbers. See further details here.