
Occurrence and Risk Assessment of Perfluoroalkyl Substances in Surface Water of Hefei City, Southeast China
1
Anhui Province Engineering Laboratory for Mine Ecological Remediation, School of Resources and Environmental Engineering, Anhui University, Hefei 230601, China
2
Anhui Hefei Ecological Environment Monitoring Center, Hefei 230088, China
*
Author to whom correspondence should be addressed.
Water 2024, 16(9), 1245; https://doi.org/10.3390/w16091245
Submission received: 1 April 2024
/
Revised: 21 April 2024
/
Accepted: 24 April 2024
/
Published: 26 April 2024
Abstract
:In this work, the spatial distribution, potential sources, and risk assessment of perfluoroalkyl substances (PFASs) were investigated at 22 surface water sampling sites in Hefei City. The study encompassed 11 distinct types of PFASs, which included 7 perfluoroalkyl carboxylic acids (PFCAs) and 4 perfluoroalkyl sulfonic acids (PFSAs). The findings indicated that the overall concentration of PFASs varied between 12.96 to 545.50 ng/L, with perfluorooctanoic acid (PFOA), perfluorobutanesulfonic acid (PFBS), perfluorobutyric acid (PFBA), and perfluorohexanoic acid (PFHxA) being the most prevalent, contributing to an average of 71% of the total PFASs concentration. Principal component analysis (PCA) elucidated the primary sources of PFASs, which included industrial emissions, fluoropolymer production and treatment, textile processing, and the impact of the electroplating industry. Employing the risk quotient (RQ) method facilitated the assessment of ecological risks associated with PFASs in surface water within the study area, suggesting that the current concentrations of PFASs in Hefei’s surface water pose a relatively low ecological risk. However, the long-term ecological effects of PFASs cannot be overlooked due to their potential for long-range transport and the cumulative nature of biological food chains.
1. Introduction
Perfluoroalkyl substances (PFASs) are a class of synthetic organic compounds that have been extensively used throughout the last century in various sectors such as construction, the chemical industry, textiles, and firefighting, due to their hydrophobic, oleophobic, and highly stable properties [1]. Since the 1950s, the global production of PFASs has increased exponentially, with the combined direct and indirect emissions of perfluorooctanesulfonic acid (PFOS) and its precursors estimated to have reached approximately 14,338 tons by 2015 [2]. Over the past 70 years, the production and use of fluorinated products have resulted in the discharge of more than 2600 tons of PFASs into aquatic environments [3]. Given their environmental persistence, propensity for long-distance dispersion, and potential for bioaccumulation, PFASs persistently accumulate and magnify within the food chain [4]. Moreover, their presence has been detected across various environmental mediums, including soil, water, air, and living organisms [5,6,7,8,9].
With the production and widespread utilization of PFASs, there have been widespread concerns regarding potential health risks associated with PFASs, encompassing immune- and neurotoxicity, reproductive and developmental toxicity, endocrine disruption, and liver toxicity. Studies have indicated that PFOS can impede the nervous system’s development and conditioned reflexes in young animals, while perfluorooctanoic acid (PFOA) may contribute to disruptions in lipid metabolism and mitochondrial energy processes [10,11]. Consequently, PFOS and PFOA have been successively added to the list of substances regulated by the Stockholm Convention [12]. Nevertheless, due to the stability, hydrophobicity, and oleophobicity of PFASs, numerous countries worldwide continue their production and utilization.
It is hypothesized that PFASs disseminate globally through the ocean-atmosphere nexus, with water serving as the primary medium of transport [13]. Investigations have revealed that concentrations of PFASs in rivers can reach several thousand nanograms per liter [14,15]. A prior study disclosed that PFOA discharges in European river systems aligned with previously documented regional emission projections [16], a pattern echoed in the case of Lake Ontario [17]. Moreover, the PFAS levels detected within the Cape Fear River basin in North Carolina suggest a multitude of sources distributed throughout the catchment area [18]. Collectively, these observations indicate that PFASs are retained within the aqueous phase and that their concentration profiles can be insightful for a source analysis.
In recent years, industries such as textiles, electronics, and packaging have rapidly advanced in China, propelling it to become the world’s largest producer of fluorine-containing products [19]. A significant portion of China’s PFAS production is attributed to cities [20]. Urban surface waters carry PFASs from industrial activities, as well as from direct or indirect human discharges. Thus, urban surface waters in cities serve as an exemplary region for assessing PFASs’ environmental exposure and monitoring pollution control efficacy. Hefei, the capital city of Anhui Province in eastern China, spans an area of 11,445 km2 and boasts a population exceeding 9 million. In recent years, the city’s surface water environment has faced significant pressure due to the accelerated urbanization and rapid economic development.
This study focused on Hefei City to investigate the occurrence characteristics and spatial distribution of 11 PFASs in its surface waters, aiming to evaluate the extent of pollution within the region. The specific objectives included: (1) studying the content and spatial distribution of PFASs; (2) identifying the types of pollution sources through a Spearman correlation analysis, ratio method, and principal component analysis (PCA); and (3) using the risk entropy method to assess the risk level of PFASs in the surface water of Hefei city.
2. Materials and Methods
2.1. Consumables and Reagents
This study primarily employs the following consumables and reagents: 11 Perfluorocarboxylic acid Mix Solution (100 μg/mL, Alta Scientific Co., Ltd., Tianjin, China), Stable Isotope Labeled 3 Perfluorocarboxylic acid Mix Solution (10 μg/mL Alta Scientific Co., Ltd., Tianjin, China), methanol (chromatographic purity, 99.9%, Fisher Chemical, Shanghai, China), ammonia (analytical purity, Shanghai Hubilab Equipment Co. Ltd., Shanghai, China), ammonium acetate (analytical purity, Tianjin Guangfu Science and Technology Development Co. Ltd., Tianjin, China), weak anion exchange columns (Waters Oasis WAX, 6 cc, 150 mg, 30 μm, Waters Corp., Milford, MA, USA), etc.
The standard solution of PFASs contains 11 substances: Perfluorobutyric acid (PFBA), Perfluorovaleric acid (PFPA), Perfluorohexanoic acid (PFHxA), Perfluoroheptanoic acid (PFHpA), Perfluorooctanoic acid (PFOA), Perfluorononanoic acid (PFNA), Perfluorodecanoic acid (PFDA), Perfluorobutanesulfonic acid (PFBS), Perfluorohexane sulfonate (PFHxS), Perfluoroheptane sulfonate (PFHpS), and Perfluorooctanesulfonic acid (PFOS). Isotope mixing internal standard solutions include: Perfluorohexanoic acid-13C2, Perfluorooctanoic acid-1,2,3,4-13C4, abd Sodium Perfluorooctanesulfonate-1,2,3,4-13C4. Table S1 (in Supplementary Materials) provides the full name, abbreviation, and commercial sources of individual PFASs and internal standards.
2.2. Study Area and Sample Collection
In this study, a comprehensive examination of PFASs in the surface water within the Hefei City area was conducted through the collection and analysis of water samples. The primary focus was on reservoir water and river water, which are critical sources of drinking water and play significant roles in the ecosystem and human activities.
In Hefei City, 22 representative cross-sections of national, provincial, and municipal control points were selected as sampling sites. Samples were collected from 4 December to 11 December 2023. Figure 1 shows the distribution of these sampling sites. Water samples were gathered at various locations using a Plexiglas water sampler and, subsequently, stored in polypropylene plastic containers for analysis. The water samples were then conveyed to the laboratory and preserved in a cold storage environment maintained at −4 °C. Table S2 (in Supplementary Materials) presents the precise latitude and longitude data corresponding to each of the designated sampling locations.
2.3. Sample Pre-Treatment
First, a 1 L water sample was measured, and 4.625 g of ammonium acetate was added. Subsequently, all samples were supplemented with 10 ng of the isotope internal standard solution. Additionally, a subset of samples designated for quality control received an extra 5 ng of the standard solution. The Oasis WAX solid-phase extraction columns were primed by rinsing them with a series of solvents: 5 mL of a 0.1% methanolic ammonia solution, followed by 7 mL of pure methanol, and, finally, 10 mL of ultrapure water, each used to condition the columns prior to sample loading. The aqueous samples were enriched at a rate of 8 mL/min. The column underwent a cleansing step with 5 mL of a 0.025 mol/L ammonium acetate solution adjusted to pH 4.0, and, subsequently, it was washed with 12 mL of ultrapure water. Afterward, the SPE column was purged with nitrogen gas to remove any residual solvent. The elution process followed, first with 5 mL of methanol, and then with 7 mL of a 0.1% methanolic ammonia solution. The eluate was evaporated to almost complete dryness before being reconstituted to a final volume of 1 mL, mixed using a vortex mixer for 30 s, and prepared for analysis.
2.4. Instrumental Analysis
In this study, ultra-performance liquid chromatography–tandem mass spectrometry (UPLC-MS/MS, 1290-6465B, Agilent, Shanghai, China) and a C18 column (ACQUITY UPLC BEH C18, 2.1 mm × 50 mm, 1.7 μm, Waters Corp., Milford, MA, USA) were employed for the analysis of PFASs in water samples. The mobile phase was set as follows: 0.00–0.50 min, 25.0% A phase (methanol), and 75.0% B phase (0.005 mmol/L ammonium acetate solution); 0.50–10.00 min, A phase increased to 85.0%, and B phase decreased to 15.0%; from 10.00–10.50 min, phase A increased to 95.0%, and phase B decreased to 5.0%; from 10.50–14.00 min, phase A was maintained at 95.0%, and, from 14.00–14.10 min, phase A decreased to 25.0%, and phase B increased to 75.0%, and then was maintained for 2 min. The apparatus was configured to operate in the negative ion mode using Electrospray Ionization (ESI) as the ion source, utilizing the following parameters: sample injection volume (10.00 μL), column temperature (40 °C), and flow rate (0.3 mL/min). Table S3 (in Supplementary Materials) provides additional information on the machine parameters and the structure of the target.
2.5. Quality Assurance and Quality Control
The research equipment, including the study vessels and the pipeline of the fully automated solid-phase extractor, underwent thorough cleaning prior to use. This involved rinsing with pure water and methanol, followed by drying to ensure all apparatuses were free from contaminants that could affect the experimental outcomes. To ensure accuracy in the analysis of the target PFASs compounds, a rigorous calibration process was employed using three mixed internal standards. Each liter of water sample was fortified with a consistent amount of 10 ng of the internal standard mixture to facilitate precise quantification. A standard series spanning 1–100 μg/L calibration range was used to quantify the native compounds. The 11 PFASs demonstrated excellent linearity (R2 > 0.997) within the specified concentration range.
The limit of detection (LOD) and limit of quantification (LOQ) were determined based on signal-to-noise (S/N) ratios of 3 and 10, respectively. The LOQ values span a range of 0.008 to 0.062 ng/L. Any sample exhibiting concentrations below the LOQ was classified as non-detect (ND). The spiked recoveries ranged from 65.9% to 111.4%, with relative standard deviation (RSD) of 3.5% to 15.6%. The results obtained from this study indicate that the method can be effectively employed for the detection of PFAS in surface water samples. In addition, a negative control and a positive control group were established in the experiment. The negative control consisted of pure water without any PFASs to test the specificity and sensitivity of the experimental system. The results of the negative control did not show any detectable signal of PFASs, thereby excluding the possibility of non-specific signals or laboratory contamination. The positive controls contained solutions of known concentrations of PFASs and were used to validate the detectability and reproducibility of the analytical method. The results from the analysis of parallel samples, along with the inclusion of a process blank in each batch, further confirm the absence of any cross-contamination or interference during the analysis. This finding indicates that the method used is reliable and can accurately detect PFASs in surface water samples.
2.6. Statistical Analysis of Data
The statistical analysis of the experimental data was performed using IBM SPSS Statistics, version 26. The Spearman’s rank correlation test was employed to assess the relationship between the contents of each target variable. This study utilized the ratio method and PCA to thoroughly investigate the potential sources of PFASs. OriginPro 2022 was used to visualize the content characteristics and perform source analysis (correlation analysis) of the PFASs. Furthermore, the sampling locations of the PFASs were mapped using ArcGIS Desktop 10.8 (ESRI, 2023).
2.7. Ecological Risk Assessment
The ecological risk of PFASs in the surface water of Hefei was evaluated using the risk quotient method. At present, the risk quotient (RQ) method is widely used for ecological risk assessment. Nevertheless, due to the limited availability of toxicity data related to PFASs, only the predicted no-effect concentrations for a subset of five PFASs were determined. The calculation of risk quotients for these five PFASs in aquatic environments was conducted as follows [21]:
where MEC is the measured environmental concentration of perfluorinated compounds and PNEC is the predicted no-effect concentration.
3. Results and Discussion
3.1. Levels and Congener Pattern of PFASs
Table S4 (in Supplementary Materials) presents a summary of the content and detection rates of PFASs in the surface water of Hefei. This study encompassed 11 distinct types of PFASs, which included 7 perfluoroalkyl carboxylic acids (PFCAs) and 4 perfluoroalkyl sulfonic acids (PFSAs). The research results indicated that all 11PFASs were present in the study area. Specifically speaking, PFBA, PFPA, PFHxA, PFHpA, PFOA, PFNA, PFDeA, and PFOS were detected in 100% of samples. Subsequently, PFDA was found in 86.4 percent of samples, while PFHxS and PFHpS were detected in 81.8 percent and 50 percent of samples, respectively.
The measured levels of the total 11 polyfluoroalkyl substances (Σ11PFASs) in the surface water samples varied within a range of 12.96 to 545.50 ng/L, with an average concentration of 80.09 ng/L and a median value of 54.84 ng/L. The PFAS levels observed in the study region were comparable to concentrations reported from other areas within China [22,23], such as Taihu Lake [24] (164–299 ng/L, 7 PFASs detected), Han River [25] (8.9–568 ng/L, 8 PFASs detected), and Changshu [26] (139.1–721.4 ng/L, 14 PFASs detected). The mean concentration of ΣPFASs in this study, amounting to 80.09 ng/L, is substantially lower than ΣPFASs in Shanghai’s Huangpu River, which has an average value of 226.3 ng/L [27]. The observed discrepancy can be attributed to Shanghai’s status as one of the economic hubs of China. It is characterized by a robust regional economy and advanced industrialization, which consequently has some impact on the surrounding environment. Furthermore, due to the Huangpu River’s positioning at the lower course of the Yangtze River, it acts as a recipient of substantial quantities of PFASs originating from upstream sources.
The composition and distribution of individual PFASs in the water samples at each sampling site are depicted in Figure 2. Short-chain PFASs, defined as those with a carbon number less than or equal to 8, constituted a significant portion, representing 92% of the total PFASs on average. PFOA, PFBS, PFHxA, and PFBA predominantly contributed to the overall PFAS levels within the short-chain compound group, cumulatively representing an average of 71%. The concentrations of PFOA varied from 3.78 to 53.2 ng/L, which were lower than the levels reported in other rivers within Spain and Ghana [28,29,30,31]. The concentrations of PFBS varied between 0.47 ng/L and 102.2 ng/L, while those of PFHxA spanned from 1.63 ng/L to 183.4 ng/L, and the PFBA levels were recorded between 1.06 ng/L and 99.2 ng/L. The observed phenomenon could be attributed to the enhanced solubility and increased mobility of short-chain PFASs in comparison to their long-chain counterparts [32]. Notably, among the PFASs detected in aquatic environments, short-chain variants were predominant. This trend suggests that novel short-chain PFASs have progressively supplanted the traditional long-chain varieties and have been detected in substantial concentrations within the aqueous milieu [33]. The composition of PFASs in other studies exhibited a similar pattern [34].
3.2. Spatial Distribution of PFASs
Figure 3 displays the spatial patterns of the total 11 PFASs across the aquatic environments in the research zone. The most elevated level of PFASs was observed at point W12, with a value of 545.5 ng/L, significantly exceeding the concentrations at other sampling points. This was followed by W9 (173.12 ng/L) and W1 (161.93 ng/L), while the remaining 19 points exhibited PFAS concentrations ranging from 10 to 100 ng/L.
The predominant contributors to the elevated PFAS levels at sampling point W12 were PFBA (99.20 ng/L), PFPA (193.80 ng/L), and PFHxA (183.40 ng/L). The particular site is positioned on the Lujiang County River, downstream from many industrial parks, which may lead to increased PFAS concentrations due to effluents from upstream industrial activities. Additionally, the Ketan River, which flows through the southwestern part of Lujiang County River and is another significant waterway in the region, also exhibited elevated PFAS levels at sampling point W9.
It is noteworthy that the sampling point W1 is located near the Innovation Industrial Park within the Feixi Economic Development Zone, an area with a concentration of diverse industrial sectors. The industrial sectors in this area encompass a range of strategic emerging industries, including new energy vehicles, photovoltaic energy, high-end intelligent manufacturing, and biomedicine, among others. Among these, the semiconductor manufacturing and advanced new energy vehicle parts manufacturing industries may potentially contribute to the release of PFASs. The wastewater containing PFASs, if discharged into the proximate river, could influence the levels of PFASs at sampling point W1. Consequently, elevated concentrations of PFASs were detected at this site, with the maximum concentration observed for PFBS (102.20 ng/L). This suggests that PFBS has increasingly been used as an alternative to PFOS in the region.
3.3. Analysis of the Sources of PFASs
Surface water contamination with PFASs is primarily attributed to industrial discharges, municipal wastewater discharges, and surface runoff ingress [35]. The precise identification of pollutant sources facilitates prompt pollution mitigation.
Currently, a correlation analysis of PFASs is extensively employed to deduce potential sources of these compounds in aquatic environments [36]. In this study, water samples collected in December were analyzed, and the Spearman correlation coefficients for PFASs in the water are depicted in Figure 4. Notably, PFOS exhibited a significant correlation with PFHxA (p < 0.01). As illustrated in Figure 4, PFBA displayed significant positive correlations with PFPA, PFHxA, PFHpA, PFOA, and PFBS (p < 0.01). PFPA was also positively correlated with PFHxA, PFHpA, PFOA, PFNA, and PFBS (p < 0.01). Further, PFHxA exhibited significant positive associations with PFHpA, PFOA, and PFBS (p < 0.01). Additionally, PFDA displayed a significant correlation with PFBS (p < 0.01), and PFOS was positively linked to PFBS, PFHxA, and PFHpA (p < 0.01), suggesting a common origin for these compounds.
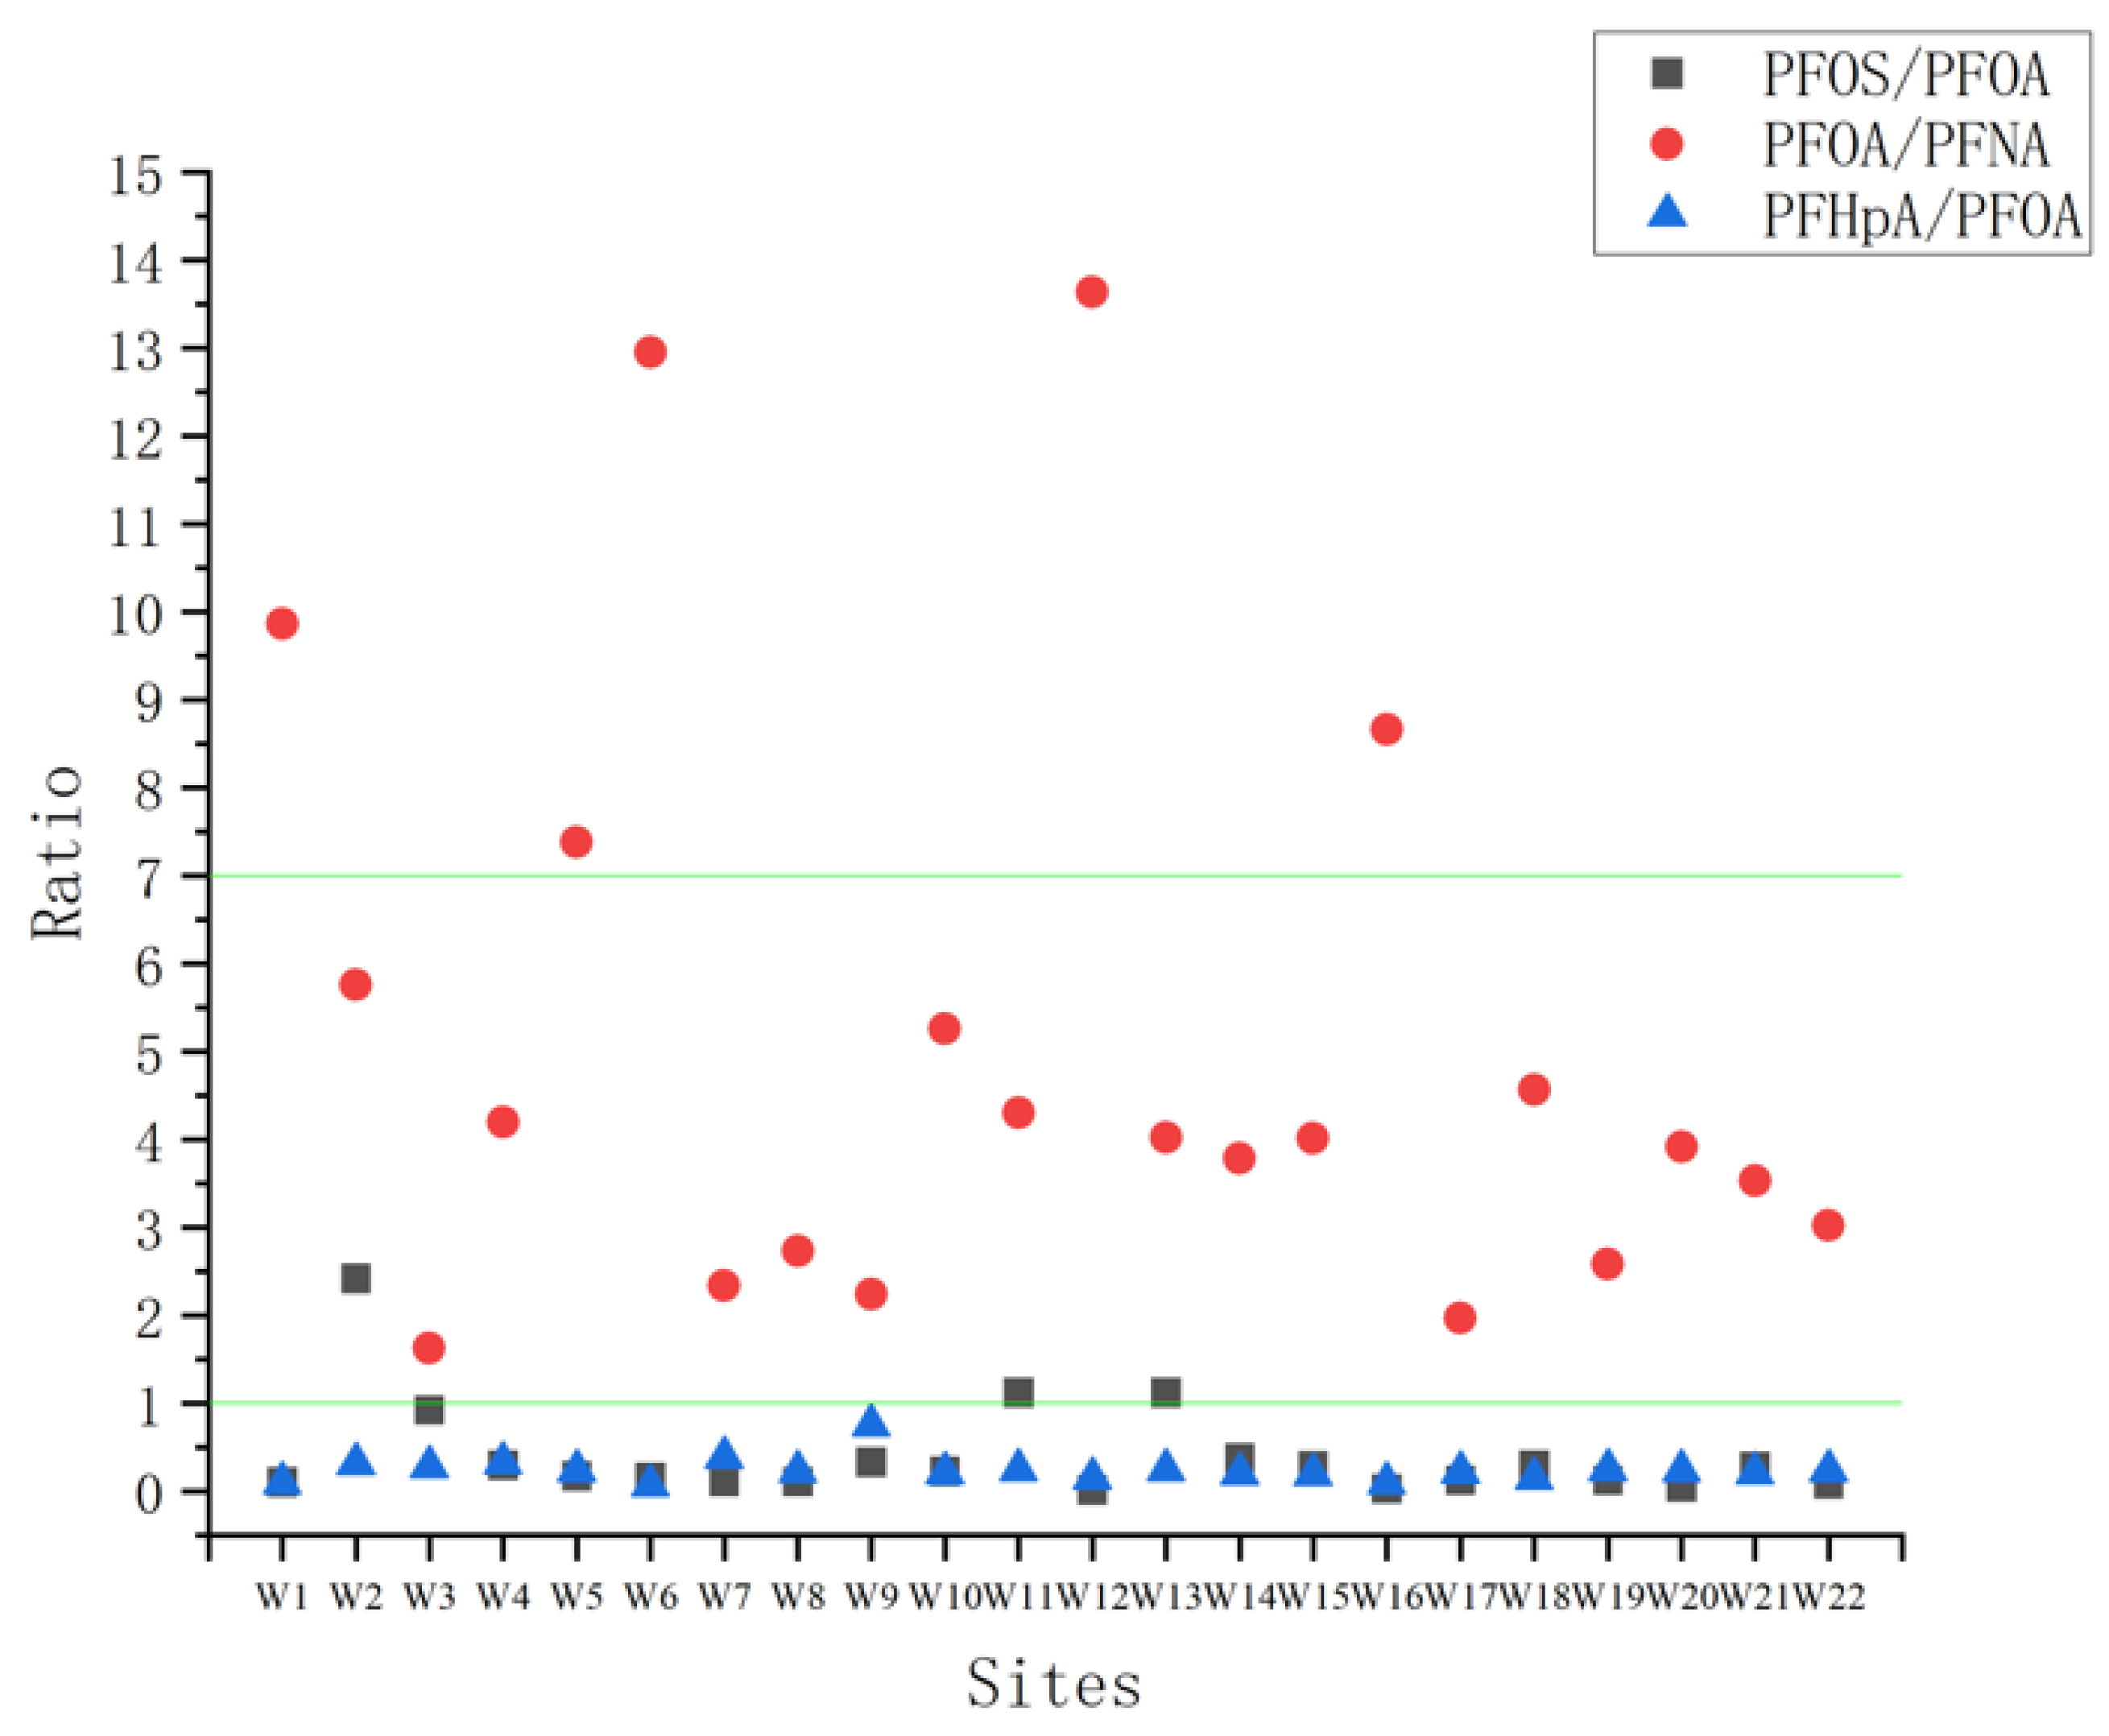
The ratio method is another crucial technique for investigating the origins of PFASs [37]. The ratios of PFOS to PFOA, PFOA to PFNA, and PFHpA to PFOA have been extensively utilized in the environmental source analysis of PFASs. Typically, the PFOS/PFOA ratio is used to identify potential sources of PFASs, where a ratio greater than 1 suggests point source pollution by PFOS, whereas a ratio less than 1 implies a rainfall contribution [38]. As depicted in Figure 5, the PFOS/PFOA values at sampling points W2, W11, and W13 were greater than 1, indicating their susceptibility to point source pollution. Conversely, the PFOS/PFOA values at the remaining sites were less than 1, which signifies that rainfall had a more pronounced impact on the variation of PFAS concentrations in surface water across most regions of Hefei City. The PFOA/PFNA ratio, ranging between 7 and 15, denotes direct discharge from industrial activities [39]. The PFOA/PFNA ratios at sampling points W1, W5, W6, W12, and W16 in this study fell within this range, suggesting that PFASs at these locations primarily stemmed from local factory effluents. Additionally, we also employed the PFHpA/PFOA ratio to evaluate the contribution of atmospheric deposition. All calculated ratios being below 1 indicate that atmospheric deposition is an unlikely primary source of PFASs in the investigated area.
Apart from the ratio method, this study explored the possible sources of PFASs in Hefei’s surface water by utilizing PCA. Excluding PFHxS and PFHpS due to their significantly lower detection concentrations, the analysis subjected the remaining PFASs to PCA, which identified four principal components (PC1, PC2, PC3, and PC4), cumulatively explaining 91.8% of the total variance. PC1, accounting for 47.6% of the variance, was characterized by short-chain PFCAs, including PFBA, PFPA, PFHxA, PFHpA, and PFOA. Among these, PFBA, PFPA, PFHxA, and PFHpA have been increasingly employed in industrial production in recent years as substitutes for long-chain PFASs [40]. Meanwhile, PFOA is primarily released into the environment during the production and use of fluoropolymers and related products worldwide. Consequently, PC1 is interpreted as representative of industrial production emissions. PC2, explaining 23.2% of the variance, was dominated by PFNA and PFDA. Historically, PFNA has been a crucial “processing aid” in fluoropolymer production [41], while PFDA is considered a degradation product of precursors due to its limited production [42]; hence, PC2 is suggestive of fluoropolymer processing aid emissions. PC3, contributing 12.1% to the total variance, was primarily influenced by PFOS, commonly used in textile, leather, and carpet treatments, as well as metal plating processes [43], thus indicating a combined contribution from these applications. Lastly, PC4, constituting 9.0% of the variance, was chiefly represented by PFBS, predominantly employed as an anti-fog agent in the electroplating sector to control hexavalent chromium emissions [44], rendering it an indicator of electroplating industry discharges.
The three sampling points with the highest PFAS content are W1, W9, and W12. Among these, PC1 exhibits the highest loading value at W12, suggesting that the W12 site is predominantly influenced by industrial discharges. Both PC2 and PC4 display comparable loading values at W1, indicating that this location experiences concurrent impacts from fluoropolymer processing additives and the electroplating sector. The preponderance of PC2’s loading value at site W9 over other components confirms that W9 is substantially influenced by fluoropolymer processing contamination.
3.4. Ecological Risk Assessment of PFASs
According to research by Brooke et al. [45], Cao Ying et al. [46], and Sun et al. [47], the PNEC values for PFOA, PFOS, PFNA, PFHxA, and PFDA in water are 570,000 ng/L, 25,000 ng/L, 100,000 ng/L, 97,000 ng/L, and 11,000 ng/L, respectively. The current study assesses the risk quotient for these compounds in water. The ecological risks associated with PFOA, PFOS, PFNA, PFHxA, and PFDA in water bodies were evaluated using the risk quotient method (as shown in Table S5). The findings revealed that the RQ values for these compounds were significantly less than 0.1 [48], suggesting that the PFASs present in the surface waters of Hefei City do not pose ecological risks to aquatic organisms such as fish. However, the long-term ecological effects of PFASs cannot be overlooked due to their potential for long-range transport and the cumulative nature of biological food chains.
4. Conclusions
This investigation detected 11 distinct PFASs in the surface water samples obtained from Hefei, indicating a widespread presence of these compounds within the region’s surface water bodies. The total concentrations of the 11 PFASs varied between 12.96 and 545.50 ng/L, averaging at 80.09 ng/L with a median value of 54.84 ng/L. The surface water PFAS levels in Hefei are comparable to those observed in most other regions across China.
Overall, the spatial distribution of PFASs in the surface water of Hefei was relatively uniform, with only a few exceptions at certain sites. Utilizing the Spearman correlation analysis, ratio method, and PCA enabled the identification of primary PFAS sources in Hefei’s surface water, which include industrial emissions, fluoropolymer processing, textile treatments, and the electroplating industry. The RQ values were calculated using the risk entropy method to assess the potential ecological risks of PFASs in the surface water of Hefei city. The findings revealed that the RQ values for various PFASs were significantly below 0.1, suggesting that perfluorinated compounds present in Hefei’s surface water bodies are unlikely to pose a detrimental impact on the local ecosystem. However, the long-term ecological effects of PFASs cannot be overlooked due to their potential for long-range transport and the cumulative nature of biological food chains. Sustained monitoring and scholarly research will continue to be essential for a comprehensive understanding of the persistent ecological implications caused by PFASs within Hefei’s aquatic environments.
Supplementary Materials
The following supporting information can be downloaded at: https://www.mdpi.com/article/10.3390/w16091245/s1, Table S1: The full name, abbreviation, and commercial sources of individual PFASs and internal standards; Table S2: Specific geographic locations of sampling sites; Table S3: Structural information on the target and instrument parameter settings; Table S4: Concentration range and detection rate of PFASs in surface water (ng/L); Table S5: Risk quotients for PFOA, PFOS, PFNA, PFHxA and PFDA at each site.
Author Contributions
Methodology, C.J.; Resources, L.Z.; Writing—original draft, Y.Z.; Supervision, N.W.; Project administration, H.C. All authors have read and agreed to the published version of the manuscript.
Funding
This research was funded by Wang Ning 2021 Monitoring and Assessment of the Status of Ultra-low Emission of Air Pollution, (No. K160139360).
Data Availability Statement
Data are contained within the article and Supplementary Materials.
Conflicts of Interest
The authors declare no conflict of interest.
References
- Gañán, J.; Pérez-Quintanilla, D.; Morante-Zarcero, S.; Sierra, I. Comparison of different mesoporous silicas for off-line solid phase extraction of 17β-estradiol from waters and its determination by HPLC-DAD. J. Hazard. Mater. 2013, 260, 609–617. [Google Scholar] [CrossRef] [PubMed]
- Wang, Z.; Boucher, J.M.; Scheringer, M.; Cousins, I.T.; Hungerbühler, K. Toward a comprehensive global emission inventory of C4–C10 perfluoroalkanesulfonic acids (PFSAs) and related precursors: Focus on the life cycle of C8-based products and ongoing industrial transition. Environ. Sci. Technol. 2017, 51, 4482–4493. [Google Scholar] [CrossRef] [PubMed]
- Kannan, K.; Hansen, S.; Franson, C.; Bowerman, W.; Hansen, K.; Jones, P.; Giesy, J. Perfluorochemical surfactants in the environment. Environ. Sci. Technol. 2001, 35, 3065–3070. [Google Scholar] [CrossRef] [PubMed]
- Chen, H.; Han, J.; Cheng, J.; Sun, R.; Wang, X.; Han, G.; Yang, W.; He, X. Distribution, bioaccumulation and trophic transfer of chlorinated polyfluoroalkyl ether sulfonic acids in the marine food web of Bohai, China. Environ. Pollut. 2018, 241, 504–510. [Google Scholar] [CrossRef] [PubMed]
- Chen, H.; Reinhard, M.; Nguyen, T.V.; You, L.; He, Y.; Gin, K.Y.-H. Characterization of occurrence, sources and sinks of perfluoroalkyl and polyfluoroalkyl substances (PFASs) in a tropical urban catchment. Environ. Pollut. 2017, 227, 397–405. [Google Scholar] [CrossRef] [PubMed]
- Kim, S.K.; Kannan, K. Perfluorinated acids in air, rain, snow, surface runoff, and lakes: Relative importance of pathways to contamination of urban lakes. Environ. Sci. Technol. 2007, 41, 8328–8334. [Google Scholar] [CrossRef] [PubMed]
- Karásková, P.; Venier, M.; Melymuk, L.; Bečanová, J.; Vojta, Š.; Prokeš, R.; Diamond, M.L.; Klánová, J. Perfluorinated alkyl substances (PFASs) in household dust in Central Europe and North America. Environ. Int. 2016, 94, 315–324. [Google Scholar] [CrossRef]
- Pan, Y.; Shi, Y.; Wang, J.; Jin, X.; Cai, Y. Pilot investigation of perfluorinated compounds in river water, sediment, soil and fish in Tianjin, China. Bull. Environ. Contam. Toxicol. 2011, 87, 152–157. [Google Scholar] [CrossRef] [PubMed]
- Wang, T.; Chen, C.; Naile, J.E.; Khim, J.S.; Giesy, J.P.; Lu, Y. Perfluorinated compounds in water, sediment and soil from Guanting Reservoir, China. Bull. Environ. Contam. Toxicol. 2011, 87, 74–79. [Google Scholar] [CrossRef]
- Sohlenius, A.K.; Eriksson, A.M.; Högström, C.; Kimland, M.; DePierre, J.W. Perfluorooctane sulfonic acid is a potent inducer of peroxisomal fatty acid beta-oxidation and other activities known to be affected by peroxisome proliferators in mouse liver. Pharmacol. Toxicol. 1993, 2, 90–93. [Google Scholar] [CrossRef]
- Starkov, A.A.; Wallace, K.B. Structural determinants of fluorochemical-induced mitochondrial dysfunction. Toxicol. Sci. 2002, 66, 244–252. [Google Scholar] [CrossRef] [PubMed]
- UNEP-D. SC-9/12: Listing of perfluorooctanoic acid (PFOA), its salts and PFOA-related compounds. In Proceedings of the UNEP-POPS-COP.9-SC-9-12, Conference of the Parties to the Stockholm, Geneva, Switzerland, 29 April–10 May 2019.
- Armitage, J.; Cousins, I.T.; Buck, R.C.; Prevedouros, K.; Russell, M.H.; MacLeod, M.; Korzeniowski, S.H. Modeling global-scale fate and transport of perfluorooctanoate emitted from direct sources. Environ. Sci. Technol. 2006, 40, 6969–6975. [Google Scholar] [CrossRef] [PubMed]
- Skutlarek, D.; Exner, M.; Farber, H. Perfluorinated surfactants in surface and drinking waters. Environ. Sci. Pollut. Res. Int. 2006, 13, 299. [Google Scholar] [PubMed]
- So, M.; Miyake, Y.; Yeung, W.; Ho, Y.; Taniyasu, S.; Rostkowski, P.; Yamashita, N.; Zhou, B.; Shi, X.; Wang, J.; et al. Perfluorinated compounds in the Pearl river and Yangtze river of China. Chemosphere 2007, 68, 2085–2095. [Google Scholar] [CrossRef] [PubMed]
- McLachlan, M.S.; Holmström, K.E.; Reth, M.; Berger, U. Riverine discharge of perfluorinated carboxylates from the European continent. Environ. Sci. Technol. 2007, 41, 7260–7265. [Google Scholar] [CrossRef]
- Boulanger, B.; Peck, A.M.; Schnoor, J.L.; Hornbuckle, K.C. Mass budget of perfluorooctane surfactants in Lake Ontario. Environ. Sci. Technol. 2005, 39, 74–79. [Google Scholar] [CrossRef] [PubMed]
- Nakayama, S.; Strynar, M.J.; Helfant, L.; Egeghy, P.; Ye, X.; Lindstrom, A.B. Perfluorinated compounds in the Cape Fear drainage basin in North Carolina. Environ. Sci. Technol. 2007, 41, 5271–5276. [Google Scholar] [CrossRef] [PubMed]
- Fang, S.; Sha, B.; Yin, H.; Bian, Y.; Yuan, B.; Cousins, I.T. Environment occurrence of perfluoroalkyl acids and associated human health risks near a major fluorochemical manufacturing park in southwest of China. J. Hazard. Mater. 2020, 396, 122617. [Google Scholar] [CrossRef] [PubMed]
- Wang, P.; Lu, Y.; Wang, T.; Fu, Y.; Zhu, Z.; Liu, S.; Xie, S.; Xiao, Y.; Giesy, J.P. Occurrence and transport of 17 perfluoroalkyl acids in 12 coastal rivers in south Bohai coastal region of China with concentrated fluoropolymer facilities. Environ. Pollut. 2014, 190, 115–122. [Google Scholar] [CrossRef]
- Lin, T.; Yu, S.; Chen, W. Occurrence, removal and risk assessment of pharmaceutical and personal care products (PPCPs) in an advanced drinking water treatment plant (ADWTP) around Taihu Lake in China. Chemosphere 2016, 152, 1–9. [Google Scholar] [CrossRef]
- Yang, L.; Zhu, L.; Liu, Z. Occurrence and partition of perfluorinated compounds in water and sediment from Liao River and Taihu Lake, China. Chemosphere 2011, 83, 806–814. [Google Scholar] [CrossRef]
- Zhang, Y.; Meng, W.; Guo, C.; Xu, J.; Yu, T.; Fan, W.; Li, L. Determination and partitioning behavior of perfluoroalkyl carboxylic acids and perfluorooctanesulfonate in water and sediment from Dianchi Lake, China. Chemosphere 2012, 88, 1292–1299. [Google Scholar] [CrossRef]
- Pan, G.; Zhou, Q.; Luan, X.; Fu, Q.S. Distribution of perfluorinated compounds in Lake Taihu (China): Impact to human health and water standards. Sci. Total Environ. 2014, 487, 778–784. [Google Scholar] [CrossRef] [PubMed]
- Wang, B.; Cao, M.; Zhu, H.; Chen, J.; Wang, L.; Liu, G.; Gu, X.; Lu, X. Distribution of perfluorinated compounds in surface water from Hanjiang River in Wuhan, China. Chemosphere 2013, 93, 468–473. [Google Scholar] [CrossRef] [PubMed]
- Li, X.; Hua, Z. Multiphase distribution and spatial patterns of perfluoroalkyl acids (PFAAs) associated with catchment characteristics in a plain river network. Chemosphere 2021, 263, 128284. [Google Scholar] [CrossRef] [PubMed]
- Sun, Z.; Zhang, C.; Yan, H.; Han, C.; Chen, L.; Meng, X.; Zhou, Q. Spatiotemporal distribution and potential sources of perfluoroalkyl acids in Huangpu River, Shanghai, China. Chemosphere 2017, 174, 127–135. [Google Scholar] [CrossRef]
- Ericson, I.; Nadal, M.; van Bavel, B.; Lindström, G.; Domingo, J.L. Levels of perfluorochemicals in water samples from Catalonia, Spain: Is drinking water a significant contribution to human exposure? Environ. Sci. Pollut. Res. 2008, 15, 614–619. [Google Scholar] [CrossRef] [PubMed]
- Essumang, D.K.; Eshun, A.; Hogarh, J.N.; Bentum, J.K.; Adjei, J.K.; Negishi, J.; Nakamichi, S.; Mamun, H.A.; Masunaga, S. Perfluoroalkyl acids (PFAAs) in the Pra and Kakum River basins and associated tap water in Ghana. Sci. Total Environ. 2017, 579, 729–735. [Google Scholar] [CrossRef] [PubMed]
- Llorca, M.; Farré, M.; Picó, Y.; Müller, J.; Knepper, T.P.; Barceló, D. Analysis of perfluoroalkyl substances in waters from Germany and Spain. Sci. Total Environ. 2012, 431, 139–150. [Google Scholar] [CrossRef]
- Schwanz, T.G.; Llorca, M.; Farré, M.; Barceló, D. Perfluoroalkyl substances assessment in drinking waters from Brazil, France and Spain. Sci. Total Environ. 2016, 539, 143–152. [Google Scholar] [CrossRef]
- Pan, C.G.; Yu, K.F.; Wang, Y.H.; Zhang, W.; Zhang, J.; Guo, J. Perfluoroalkyl substances in the riverine and coastal water of the Beibu Gulf, South China: Spatiotemporal distribution and source identification. Sci. Total Environ. 2019, 660, 297–305. [Google Scholar] [CrossRef] [PubMed]
- Wang, S.; Ma, L.; Chen, C.; Li, Y.; Wu, Y.; Liu, Y.; Dou, Z.; Yamazaki, E.; Yamashita, N.; Lin, B.-L.; et al. Occurrence and partitioning behavior of per-and polyfluoroalkyl substances (PFASs) in water and sediment from the Jiulong Estuary-Xiamen Bay, China. Chemosphere 2020, 238, 124578. [Google Scholar] [CrossRef] [PubMed]
- Chen, R.; Li, G.; Yu, Y.; Ma, X.; Zhuang, Y.; Tao, H.; Shi, B. Occurrence and transport behaviors of perfluoroalkyl acids in drinking water distribution systems. Sci. Total Environ. 2019, 697, 134162. [Google Scholar] [CrossRef] [PubMed]
- Liu, Z.; Lu, Y.; Wang, P.; Wang, T.; Liu, S.; Johnson, A.C.; Sweetman, A.J.; Baninla, Y. Pollution pathways and release estimation of perfluorooctane sulfonate (PFOS) and perfluorooctanoic acid (PFOA) in central and eastern China. Sci. Total Environ. 2017, 580, 1247–1256. [Google Scholar] [CrossRef] [PubMed]
- Gao, Y.; Fu, J.; Zeng, L.; Li, A.; Li, H.; Zhu, N.; Liu, R.; Liu, A.; Wang, Y.; Jiang, G. Occurrence and fate of perfluoroalkyl substances in marine sediments from the Chinese Bohai Sea, Yellow Sea, and East China Sea. Environ. Pollut. 2014, 194, 60–68. [Google Scholar] [CrossRef] [PubMed]
- Meng, J.; Wang, T.-Y.; Wang, P.; Lü, Y.-L. Spatial distribution and composition of perfluorinated compounds in soils around the Huaihe River. Environ. Sci. 2013, 34, 3188–3194. [Google Scholar]
- Yang, Q.Q.; Wang, S.L.; Liu, W.J.; Yang, Y.W.; Jiang, S.Q. Spatial distribution of perfluoroalkyl acids (PFAAs) and their precursors and conversion of precursors in seawater deeply affected by a city in China. Ecotoxicol. Environ. Saf. 2020, 194, 110404. [Google Scholar] [CrossRef] [PubMed]
- Wang, T.; Khim, J.S.; Chen, C.; Naile, J.E.; Lu, Y.; Kannan, K.; Park, J.; Luo, W.; Jiao, W.; Hu, W.; et al. Perfluorinated compounds in surface waters from Northern China: Comparison to level of industrialization. Environ. Int. 2012, 42, 37–46. [Google Scholar] [CrossRef] [PubMed]
- Campo, J.; Pérez, F.; Masiá, A.; Picó, Y.; Farré, M.; Barceló, D. Perfluoroalkyl substance contamination of the Llobregat River ecosystem (Mediterranean area, NE Spain). Sci. Total Environ. 2015, 503, 48–57. [Google Scholar] [CrossRef]
- Buck, R.C.; Franklin, J.; Berger, U.; Conder, J.M.; Cousins, I.T.; De Voogt, P.; Jensen, A.A.; Kannan, K.; Mabury, S.A.; Van Leeuwen, S.P.J. Perfluoroalkyl and polyfluoroalkyl substances in the environment: Terminology, classification, and origins. Integr. Environ. Assess. Manag. 2011, 7, 513–541. [Google Scholar] [CrossRef]
- Young, C.J.; Furdui, V.I.; Franklin, J.; Koerner, R.M.; Muir, D.C.G.; Mabury, S.A. Perfluorinated acids in arctic snow: New evidence for atmospheric formation. Environ. Sci. Technol. 2007, 41, 3455–3461. [Google Scholar] [CrossRef] [PubMed]
- Xie, S.; Wang, T.; Liu, S.; Jones, K.C.; Sweetman, A.J.; Lu, Y. Industrial source identification and emission estimation of perfluorooctane sulfonate in China. Environ. Int. 2013, 52, 1–8. [Google Scholar] [CrossRef] [PubMed]
- Xiao, F.; Halbach, T.R.; Simcik, M.F.; Gulliver, J.S. Input characterization of perfluoroalkyl substances in wastewater treatment plants: Source discrimination by exploratory data analysis. Water Res. 2012, 46, 3101–3109. [Google Scholar] [CrossRef] [PubMed]
- Brooke, D.; Footitt, A.; Nwaogu, T.A. Environmental risk evaluation report: Perflurooctane sulphonate (PFOS). Bioinformatics 2004, 17, 646–653. [Google Scholar]
- Cao, Y.; Zhou, T.; Liu, X.; Zhang, Y.; Liu, Z. Predicted non-effect concentrations of perfluorooctanoic acid (PFOA) in the environment of China. Environ. Chem 2013, 32, 1180–1187. [Google Scholar]
- Sun, R.; Wu, M.; Tang, L.; Li, J.; Qian, Z.; Han, T.; Xu, G. Perfluorinated compounds in surface waters of Shanghai, China: Source analysis and risk assessment. Ecotoxicol. Environ. Saf. 2018, 149, 88–95. [Google Scholar] [CrossRef]
- Li, B.; Liu, R.; Gao, H.; Tan, R.; Zeng, P.; Song, Y. Spatial distribution and ecological risk assessment of phthalic acid esters and phenols in surface sediment from urban rivers in Northeast China. Environ. Pollut. 2016, 219, 409–415. [Google Scholar] [CrossRef]
Figure 1.
Distribution of sampling sites.

Figure 2.
Compositions and distribution of individual PFASs.

Figure 3.
Distribution of individual PFASs at each site (ng/L).

Figure 4.
Spearman correlation coefficients between the concentrations of PFASs.

Figure 5.
Ratio of PFOS/PFOA, PFOA/PFNA, and PFHpA/PFOA at each site.

Disclaimer/Publisher’s Note: The statements, opinions and data contained in all publications are solely those of the individual author(s) and contributor(s) and not of MDPI and/or the editor(s). MDPI and/or the editor(s) disclaim responsibility for any injury to people or property resulting from any ideas, methods, instructions or products referred to in the content. |
© 2024 by the authors. Licensee MDPI, Basel, Switzerland. This article is an open access article distributed under the terms and conditions of the Creative Commons Attribution (CC BY) license (https://creativecommons.org/licenses/by/4.0/).
Share and Cite
MDPI and ACS Style
Zhang, Y.; Jiang, C.; Zhang, L.; Cheng, H.; Wang, N. Occurrence and Risk Assessment of Perfluoroalkyl Substances in Surface Water of Hefei City, Southeast China. Water 2024, 16, 1245. https://doi.org/10.3390/w16091245
AMA Style
Zhang Y, Jiang C, Zhang L, Cheng H, Wang N. Occurrence and Risk Assessment of Perfluoroalkyl Substances in Surface Water of Hefei City, Southeast China. Water. 2024; 16(9):1245. https://doi.org/10.3390/w16091245
Chicago/Turabian StyleZhang, Yu, Chuanjun Jiang, Liangpu Zhang, Hua Cheng, and Ning Wang. 2024. "Occurrence and Risk Assessment of Perfluoroalkyl Substances in Surface Water of Hefei City, Southeast China" Water 16, no. 9: 1245. https://doi.org/10.3390/w16091245
Note that from the first issue of 2016, this journal uses article numbers instead of page numbers. See further details here.