
Simultaneous Synthesis of Single- and Multiple-Contaminant Water Networks Using LINGO and Excel Software
by
 ,
,
Abeer M. Shoaib
1,
Amr A. Atawia
1,
Mohamed H. Hassanean
1,
Abdelrahman G. Gadallah
2,3 and
Ahmed A. Bhran
2,* 1
Petroleum Refining and Petrochemical Engineering Department, Faculty of Petroleum and Mining Engineering, Suez University, Suez 43512, Egypt
2
Chemical Engineering Department, College of Engineering, Imam Mohammad Ibn Saud Islamic University (IMSIU), Riyadh 11432, Saudi Arabia
3
Chemical Engineering Department, National Research Center, Cairo 11241, Egypt
*
Author to whom correspondence should be addressed.
Water 2024, 16(9), 1244; https://doi.org/10.3390/w16091244
Submission received: 5 March 2024
/
Revised: 23 April 2024
/
Accepted: 24 April 2024
/
Published: 26 April 2024
(This article belongs to the Special Issue Contaminants in the Water Environment)
Abstract
:Controlling the distribution of water and wastewater between industrial processes is vital to rationalize water usage and preserve the environment. In this paper, a mathematical technique is proposed to optimize water–wastewater networks, and a nonlinear program is introduced to minimize the consumption of freshwater and, consequently, the flowrate of wastewater discharge. A general mathematical model, able to handle industrial plants containing up to eight sources and eight sinks, is developed using LINGO optimization software to facilitate dealing with complex case studies. The introduced model can handle single-contaminant networks as well as multiple-contaminant ones. The optimal water network is synthesized through two steps; the first step involves the introduction of the case study data into the developed mathematical model. The second step considers using the optimal solution produced after running the developed LINGO model as feed data for a pre-designed Excel sheet able to deal with these results and simultaneously draw the optimal water–wastewater network. The proposed mathematical model is applied to two case studies. The first case study includes actual data from four fertilizer plants located in Egypt; the water resources and requirements are simultaneously integrated to obtain a sensible cutting in both freshwater consumption (lowered by 52.2%) and wastewater discharge (zero wastewater discharge). The second case study regards a Brazilian petrochemical plant; the obtained results show noticeable reductions in freshwater consumption by 12.3%, while the reduction percentage of wastewater discharge is 4.5%.
1. Introduction
The careful use of water in mass-exchange networks between processes or plants will reduce both freshwater consumption and wastewater discharge. Various mathematical programming-based methodologies were presented in the last decades for minimizing both freshwater consumption and wastewater discharge. A relaxed linear model aiming to design an optimal wastewater distribution network was firstly proposed in 1998 by Galan and Grossmann; they used different treatment technologies to decrease the contaminant levels in the network and achieve the maximum reuse of wastewater streams in the plant [1]. Gabriel and El-Halwagi introduced a linear program aiming to decrease the concentrations of contaminants and maximize the reuse and recycle of wastewater through the optimal design of a water interception network [2], while a mixed integer linear program, directed to design water–wastewater networks, was presented by Faria and Bagajewicz for the best handling of water allocation problems [3]. A mixed integer nonlinear programming (MINLP) model was proposed by Galan and Grossmann to design a wastewater network that included five contaminants with thirteen types of technologies to decrease the concentration of the contaminants [4]; their proposed model was applied on a mining plant in Turkey, and an optimal wastewater network with minimum cost was designed. Many other researchers have optimized water networks by MINLP, but for different applications, such as Buabeng and Majozi [5] who aimed to maximize the reuse of wastewater by regeneration–reuse and regeneration–recycling using a hollow-fiber reverse-osmosis membrane to minimize the cost of freshwater consumption. A MINLP model was also proposed by Padron et al. for the design of a wastewater network that included treatment units to decrease the concentration of contaminants and achieve the minimum consumption of freshwater [6]; they presented a case study of Mexico City to show the validity and effectiveness of their presented model. Many other mathematical methodologies have been introduced over the years. Nejad et al. [7] presented a mathematical model and applied it in a case study of a Tehran oil refinery to minimize water and wastewater flowrates; their study included three parameters of water quality, i.e., chemical oxygen demand, suspended solids and hardness. Hansen et al. [8] introduced a mathematical program directed to minimize freshwater consumption between several operations, including cooling systems and washing processes; they applied their proposed model in a petrochemical plant. The priority of source–sink matches was determined by using a ranking matrix technique [9]; three case studies of single and multiple contaminants were introduced to show the applicability of that technique. A closed-loop supply chain was proposed by Mohammad et al. [10] to control the shortage of water in an Azerbaijan city in Iran by using a Social Engineering Optimizer (SEO); their model showed a lowering in freshwater consumption. Arola et al. [11] presented a mathematical approach to maximize the reuse of wastewater by decreasing the concentration of contaminants such as phosphorous, chemical oxygen demand (COD) and total oxygen carbon (TOC) in wastewater; the study included a membrane bioreactor performing a regeneration process to decrease the concentration of contaminants. A mathematical technique was suggested by Chin et al. [12] to optimize the total cost of freshwater consumption and design an optimal water integration network in multiple-contaminant systems. Tuba et al. [13] presented a review of mathematical programming-based methodologies used for water minimization in industrial processes. Ho et al. [14] described a fuzzy multi-objective optimization to minimize freshwater consumption in oil industries in the presence of a single contaminant. A mathematical program was suggested by Liang et al. [15] to allocate wastewater and minimize the consumption of freshwater in a water allocation system in the Zhanghe River basin. Gajendra et al. [16] used the GAMS software (version 23.5.2) to allocate water and wastewater in water networks; the proposed model was formulated as linear Equations.
Graphical-based techniques were also considered in several studies to improve the distribution of water and wastewater in water networks; Irene et al. [17] used a graphical technique to minimize waste flowrates and fresh resources in the design of an inter-plant resource conservation network. Sahu et al. [18] introduced a graphical method to add a treatment unit to minimize the concentrations of contaminants and maximize the reuse of wastewater, while minimizing the costs of treatment. Another graphical technique was proposed by Farrag et al. [19] for the analysis and design of wastewater networks using the composition driving forces; they studied the effect of the mass load of contaminants on the maximum mass recovery. Yamin et al. [20] proposed a graphical technique based on six scenarios in the design of wastewater networks; the technique was applied to agricultural irrigation systems. A study of a water distribution system was presented by Praint et al. [21] to minimize the consumed freshwater in Bota the River area; this study used a graphical technique. The pinch technique was presented also to minimize wastewater discharge from industrial plants. Many other pinch-based techniques were introduced in the last decades to solve the problem of wastewater network optimization and minimize freshwater use and wastewater discharge in industrial plant operations [22,23,24,25,26,27,28,29,30]. However, pinch and graphical methods are only suitable for simple case studies; when a plant includes a high number of streams, it is difficult to optimize a water–wastewater network via graphical methods. Another group of research works used combined pinch and mathematical programming techniques to overcome the limitations of graphical methods in optimizing water–wastewater networks [31,32,33,34,35].
To date, no simple ready model capable of managing simple as well as complex cases, having a large number of streams and contaminants, and simultaneously drawing the optimum water–wastewater network is available. In this paper, a generalized mathematical model is proposed to minimize both freshwater consumption and the flowrate of wastewater discharge; nonlinear equations based on overall mass balance and component mass balance between several sources (up to eight sources) and several sinks (up to eight sinks) are formulated to be solved by LINGO software (version 14); Excel software (version 2010) is used to draw the water–wastewater network with the automated technique. Two case studies involving a single and multiple contaminants are presented to show the effectiveness of the suggested model in minimizing the flowrates of total freshwater consumption and wastewater discharge in the network. In the future, the proposed model can be applied to agriculture networks to maximize the reuse of irrigation water and minimize freshwater consumption in the mixing units that decreases the concentration of contaminants. Furthermore, the proposed model can be applied to drinkable water networks.
2. Methods
We considered a set of source streams, including up to eight sources, with flowrate FSK, where K is the source number in the network design. It was assumed that each source contained multiple contaminants (up to three contaminants) with concentrations XSKA, XSKB, and XSKC. The contaminants’ concentration limits in the discharged wastewater with flowrate gk-waste were XSAwaste, XSBwaste, and XSCwaste.
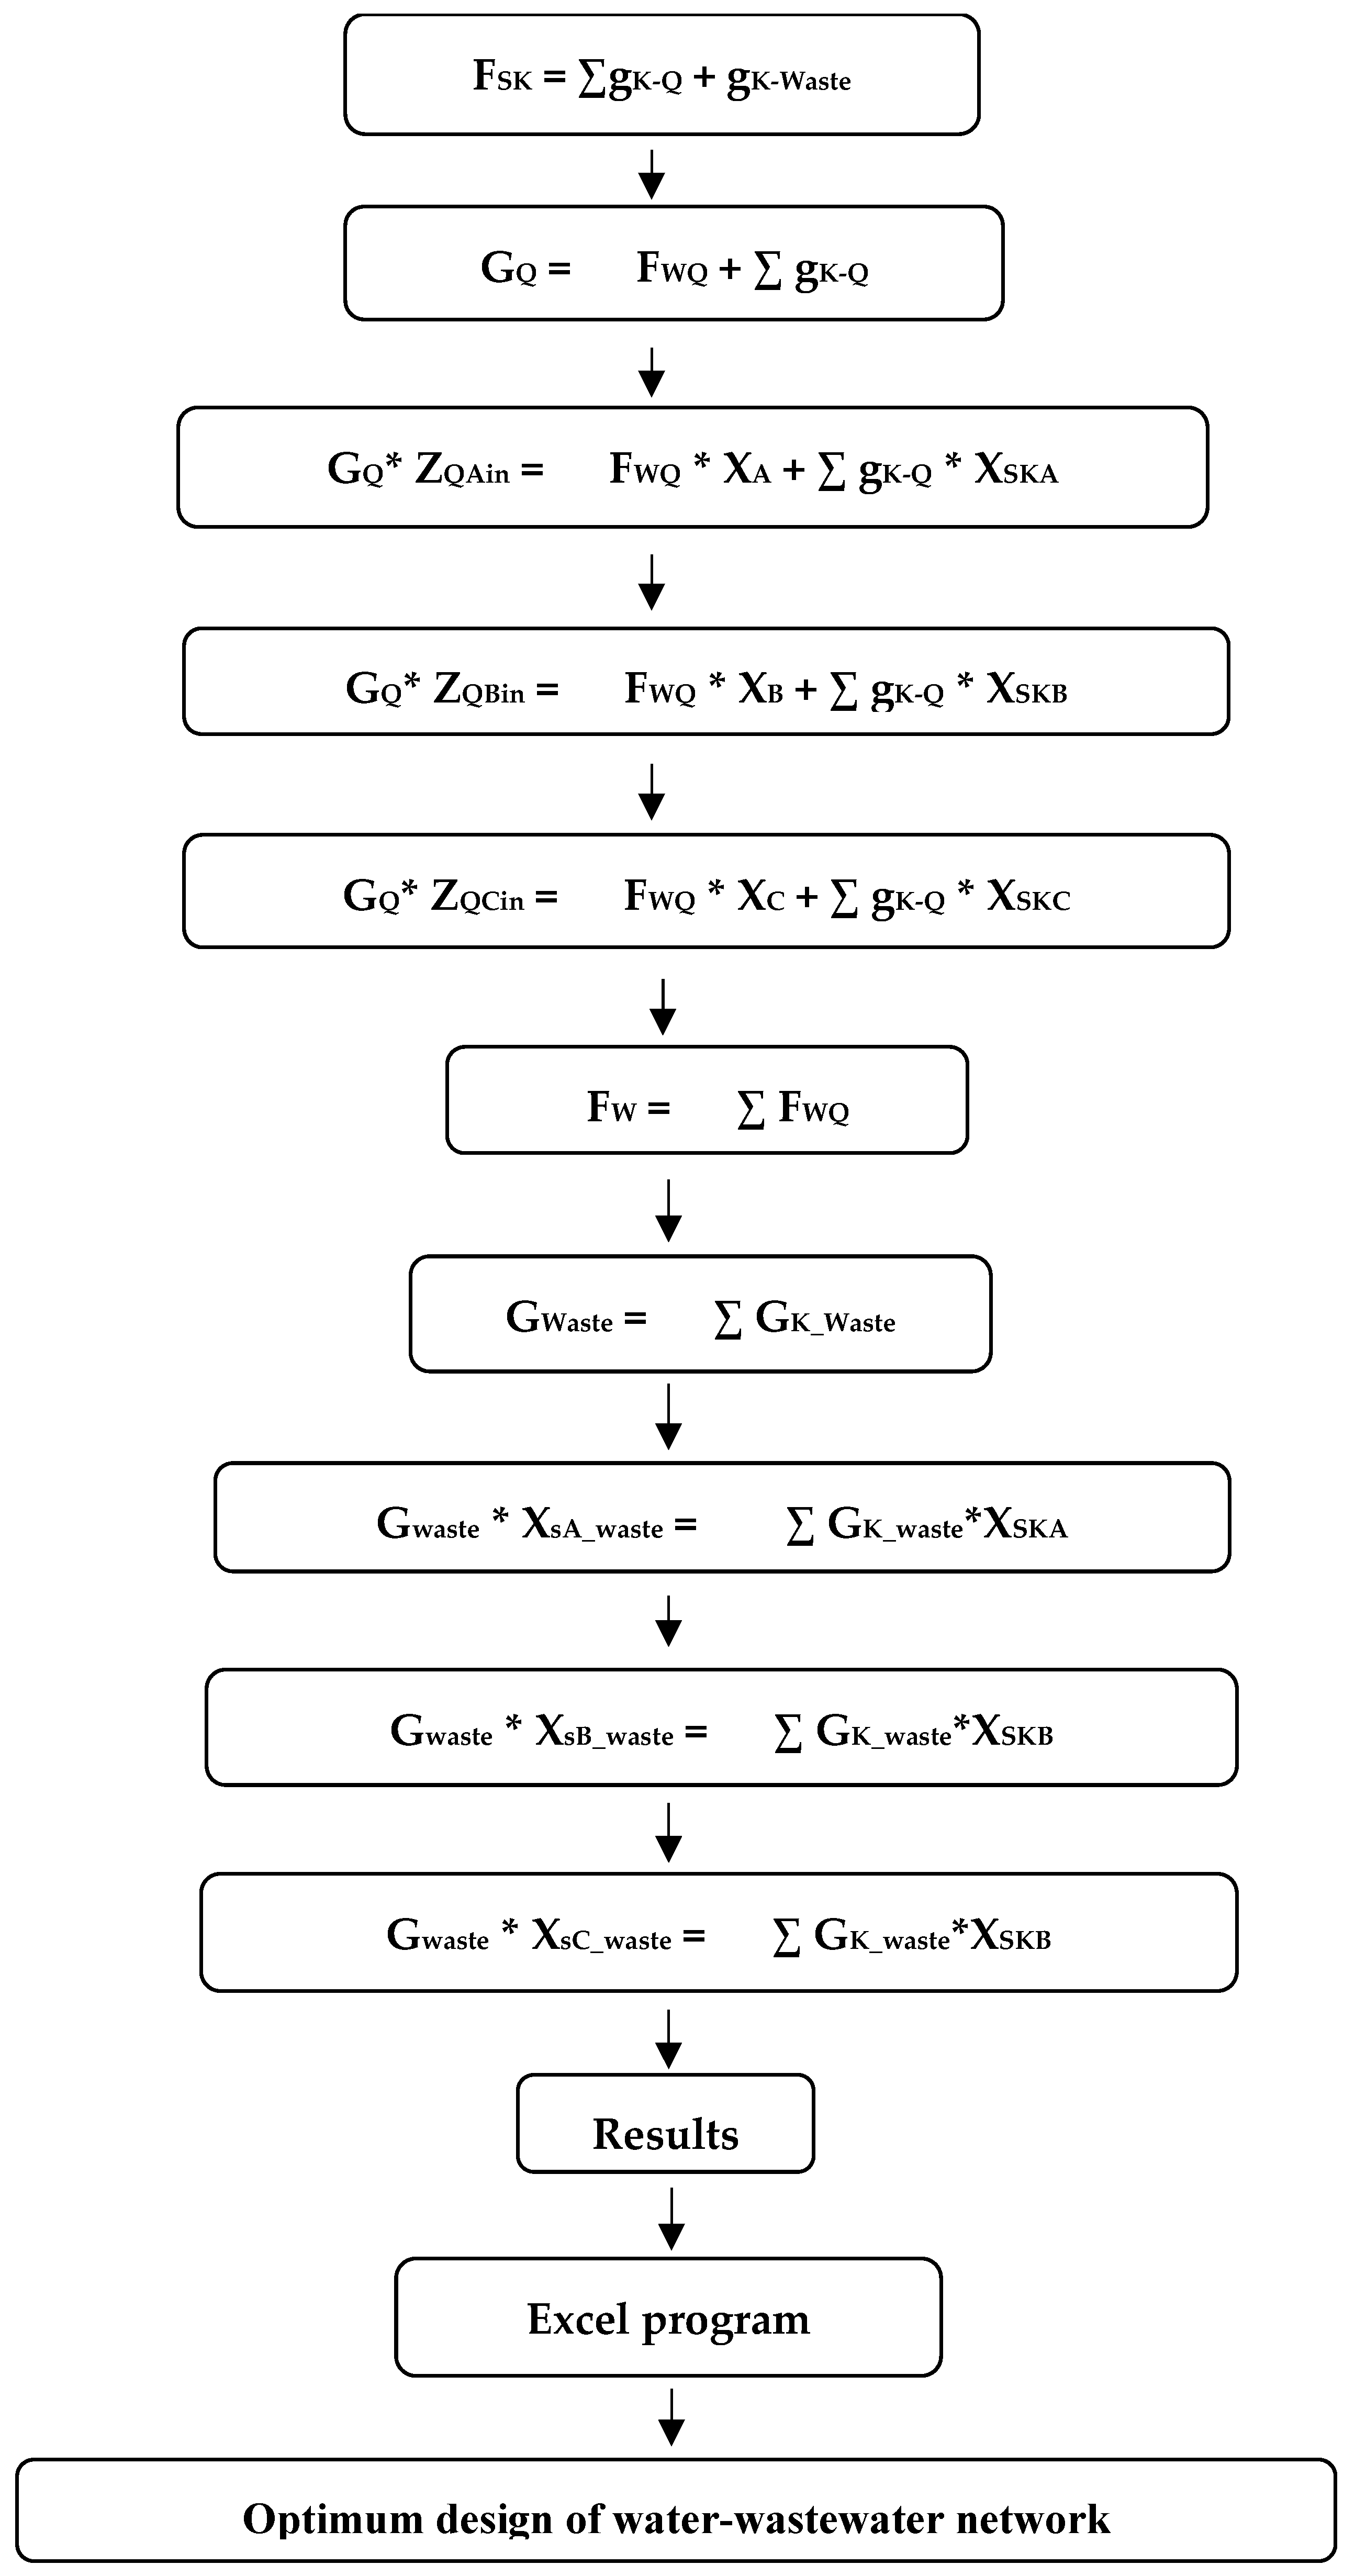
We considered a set of sink streams, including up to eight sinks, with flowrates GQ, where Q is the sink number in the network design; each sink was assumed to contain up to three contaminants with concentrations ZQAin, ZQBin, and ZQCin. Freshwater with flowrate FWQ was distributed to each sink according to the mass load limit, with concentrations XA, XB, and XC. Figure 1 presents the flowchart of the proposed model. The positive or zero values of the outlet flowrates for the sources and the inlet flowrates of the sinks are presented in the proposed model as assumptions; also, we assumed positive contaminant inlet concentrations for the sinks and outlet concentrations for the sources in the proposed model.
The procedure for obtaining the optimum design of a water–wastewater network is shown in Figure 1; the overall mass balance was applied for each source stream with flowrate FSK, which was equal to the sum of the flowrates from that source to the sinks (gK-Q) and of that of the portion of that stream which could be discharged as waste (gK-Waste).
The overall mass balance was applied to each sink; the inlet flowrate for each sink is GQ, which depends on the flowrate of freshwater fed to each sink (FWQ) and the flowrate from each source to that sink, gK-Q. The component mass balance of three contaminants (A, B, and C) was applied to each sink, and the concentration limits of the contaminants A, B, and C in each sink were ZQAin, ZQBin, and ZQCin respectively. The freshwater flowrate (FWQ) was determined assuming that the freshwater was mixed with the feed water in each sink to optimize the inlet mass load.
The overall mass balance was applied to determine the total waste discharge flowrate (GWaste), which depended on the discharge waste flowrate from each source (GK-Waste); the component mass balance was applied to the discharged wastewater, with the contaminants A, B, and C having the concentrations XSAwaste, XSBwaste, and XSCwaste, respectively. The contaminant concentration limits in discharged wastewater are established by environmental laws.
3. Case Studies
The proposed mathematical model was applied to two case studies to show its effectiveness in minimizing freshwater consumption and reducing the total wastewater discharge flowrate. The following subsections describe in detail the considered case studies.
3.1. Case Study 1
The first case study in this work included four fertilizer plants (phosphoric acid plant, concentrated-phosphoric acid plant, single-superphosphate plant, and triple-superphosphate plant), which contained eight contaminant sources of hydrofluorosilicic acid (H2SiF6), sulfuric acid (H2SO4), and phosphorus pentoxide (P2O5). In the presented case study, some source streams were completely discharged as waste. Furthermore, several sinks were completely supplied for their water needs by freshwater; this consequently resulted in a higher consumption of freshwater and in an extra discharge of wastewater. Figure 2 shows the source and sink streams that were not integrated into the network in the current actual case study.
As shown in Figure 2, before applying the proposed mathematical model, source 5 (separator of phosphoric acid) discharged all its wastewater (20 m3/h) to waste with its high concentration of H2SiF6. Four sinks (dilution mixer of sulfuric acid in the phosphoric acid plant, dilution mixer of sulfuric acid in the single-superphosphate plant, washing filter cake in the phosphoric acid plant, and washing filter in the phosphoric acid plant) were supplied only with freshwater with a flowrate of 270 m3/h.
The flowrates and concentrations of the eight sources are shown in Table 1; the flowrate of source 1 (condenser of the phosphoric acid plant) was 280 m3/h, and the source had normal concentrations of H2SiF6, H2SO4, and P2O5 (14, 0.3, and 4 wt% respectively); the flowrates of sources 2, 3, and 4 (reaction vacuum pump 1 of the phosphoric acid plant, filter vacuum pump 1 of the phosphoric acid plant, and filter vacuum pump 2 of the phosphoric acid plant) were 15, 18, and 18 m3/h, respectively, and these sources had the same concentrations of H2SiF6, H2SO4, and P2O5 (8, 0.1, and 3 wt% respectively).
Source 5 (separator of the phosphoric acid plant) had a high concentration of H2SiF6 (30 wt%); so, its wastewater, with flowrate of 20 m3/h, was discharged to waste. Source 6 (cooling water of the phosphoric acid plant) had a wastewater flowrate of 120 m3/h and concentrations of H2SiF6, H2SO4, and P2O5 of 10, 0.6, and 5 wt% respectively.
Source 7 (cooling water of the single-superphosphate plant) had a flowrate of 160 m3/h and concentrations of H2SiF6, H2SO4, and P2O5 of 12, 0.4, and 5 wt%, respectively, while source 8 (condenser of the concentrated unit in the phosphoric acid plant) had a high flowrate (250 m3/h), a high concentration of H2SiF6 (20 wt%), and normal concentrations of H2SO4 and P2O5 (0.2, and 4 wt%, respectively).
The flowrate and contaminant concentration limits (H2SiF6, H2SO4, and P2O5) for the seven sinks are shown in Table 2; the flowrate of sink 1 (dilution mixer of sulfuric acid in the phosphoric acid plant) was 10 m3/h, with concentration limits for H2SiF6, H2SO4, and P2O5 of 12, 0.5, and 4.5 wt%, respectively.
The data for the three gas scrubbers in the three different plants are shown in Table 2; sink 4 (gas scrubber in the phosphoric acid plant) and sink 5 (gas scrubber in the single-superphosphate plant) had the same flowrate of 280 m3/h, but the concentration limits of H2SiF6, H2SO4, and P2O5 in sink 4 and sink 5 were 14, 3, 5 wt% and 16, 3, 6 wt%, respectively. Sink 6 (gas scrubber in the triple-superphosphate plant) had a flowrate of 180 m3/h with concentration limits of H2SiF6, H2SO4, and P2O5 of 11, 3, and 5 wt%, respectively.
The washing filter in the phosphoric acid plant (sink 7) had a flowrate of 70 m3/h, with concentration limits of H2SiF6, H2SO4, and P2O5 of 14, 5, and 4 wt%, respectively.
The objective function of the model constructed for handling these fertilizer plants was to minimize freshwater consumption as well as wastewater discharge.
3.2. Case Study 2
The Brazilian petrochemical plant presented by Hansen et. al. [8] was the chosen second case study in the current research work. This case study included eight sources (clarified water, filtered water, cooling water 1, cooling water 2, cooling water 3, cooling water 4, bearing water 1, and bearing water 2) and six sinks (cooling water 1, cooling water 2, cooling water 3, cooling water 4, bearing water 1, and bearing water 2). We considered the COD parameter as the only indicator of contamination. The flowrate and COD limits in each plant stream are shown in Table 3.
4. Results and Discussions
After applying the data regarding the sources and sinks of the two investigated case studies to the suggested mathematical model (using LINGO software), the obtained results showed the optimum flowrates from sources to sinks, the freshwater consumption in each sink, and the wastewater flowrate from each source. After that, the obtained results were analyzed simultaneously by the predesigned Excel software, automatically achieving the drawing of the optimal wastewater network. This approach aimed to minimize freshwater consumption and reduce wastewater discharge in the two case studies under investigation.
4.1. Results and Discussion for Case Study 1
The data regarding the fertilizer plants (case study 1) were introduced into the designed mathematical model and solved by LINGO optimization software. The obtained results showed the flowrates from sources to sinks (Gk-Q), the flowrates from sources to waste, and the freshwater flowrates to the sinks; these results are listed in Table 4.
The obtained total freshwater flowrate (FW) was 129 m3/h; this freshwater was distributed to sink 1, sink 2, sink 3, sink 4, sink 5, and sink 6, with flowrates of 4.0201, 24.8, 21.738, 14.175, 26.684, and 37.581 m3/h, respectively. The obtained results were then analyzed by Excel software to draw an optimal wastewater network for the investigated fertilizer plants, as shown in Figure 3.
Source 1 supplied sink 5, sink 6, and sink 7, with flowrates of 65.056, 25.378, and 70 m3/h, respectively. Source 2 fed sink 2 and sink 6, with flowrates of 5.93 and 9.07 m3/h, respectively; also source 3 supplied sink 2 and sink 6, with flowrates of 8.93 and 9.07 m3/h, respectively. Source 4 fed sink 2, with a flowrate of 8.93 m3/h, and sink 6, with a flowrate of 9.07 m3/h. Source 5 supplied sink 4 and sink 5, with flowrates of 2.7824 and 17.217 m3/h, respectively, while source 6 supplied sink 4, sink 5, and sink 6, with flowrates of 68.7, 37.34, and 13.97 m3/h, respectively.
Source 7 fed sink 2, sink 3, sink 4, sink 5, and sink 6, with flowrates of 23.15, 8.425, 41.05, 55.66, and 31.71 m3/h, respectively, while source 8 supplied sink 1, sink 2, sink 3, sink 4, sink 5, and sink 6, with flowrates of 5.98, 42.29, 19.84, 59.69, 78.04, and 44.15 m3/h, respectively. Zero wastewater discharge was obtained in this case study.
By comparing the obtained results with the original case study data, freshwater consumption was reduced from 270 m3/h to 129 m3/h, with a reduction percentage of 52.2%, and the total flowrate of wastewater discharge decreased from 20 m3/h to zero discharge.
4.2. Results and Discussion for Case Study 2
By feeding the data regarding the second case study (Brazilian petrochemical plant) to the proposed model, the optimum flowrates from sources to sinks and to waste could be determined. The obtained results, listed in Table 5, were used as feed data for the Excel software to obtain the automated drawing of the optimum water–wastewater network, shown in Figure 4.
The clarified water source and filtered water source were considered as freshwater sources because the concentration of contaminants in these sources was zero. Regarding the results reported in Table 5, the clarified water flowrate of 966.54 m3/h was distributed between sinks K1, K2, K3, K4, K5, and K6, with flowrates of 623.57, 233.6, 57.213, 35.85, 3.06, and 13.25 m3/h, respectively. However, the filtered water source fed only the third sink (k3), with a flowrate of 15 m3/h. The cooling water 1 source stream supplied six sinks (K1, K2, K3, K4, K5, and K6) and was in part discharged as waste, with flowrates of 78.43, 43.4, 13.79, 9.15, 2.94, 1.75, and 567.54 m3/h, respectively. On the other hand, the cooling water 2, cooling water 3, and cooling water 4 sources discharged their water to waste, with flowrates of 277, 92, and 45 m3/h, respectively. The bearing water 1 source fed only K3, with a flowrate 6 m3/h, while the bearing water 2 source fed only sink 1, with a flowrate of 15 m3/h. The total wastewater discharge, with a flowrate of 982 m3/h, was collected from the S3, S4, S5, S6, S7, and S8 sources, with flowrates of 567.54, 277, 92, and 45 m3/h, respectively.
By comparing the results of the proposed mathematical model with those of the original case study, it was observed that the clarified water flowrate was reduced from 1102 m3/h to 966.54 m3/h, with a reduction percentage of 12.3%. It was also noticed that the filtered water flowrate was reduced from 18 m3/h to 15 m3/h, with a reduction percentage of 16.5%. Additionally, the wastewater discharge decreased by 4.5%, from 1029 m3/h to 982 m3/h.
Regarding the abovementioned results of the two investigated case studies, it is clear that the introduced approach is an effective and economical technique for designing an optimal water–wastewater network. These results showed that the achieved water–wastewater networks for the considered case studies are economically effective and more profitable compared to the current networks, minimizing freshwater consumption and reducing wastewater discharge. Moreover, the proposed technique can be applied to other case studies to optimize their existing water networks.
5. Conclusions
The water requirement of industrial processes in chemical plants is high; in the industry, water is used for washing, cooling, diluting, and processing in chemical plants. In this work, a mathematical model (LINGO optimization software, version 14.0) was proposed to design optimal mass-exchange networks; the presented model was formulated as a nonlinear program to minimize both freshwater consumption and wastewater discharge. Two sequential steps were established to design optimal water–wastewater networks; the first step consisted in applying the collected data into LINGO software; in the second step, the obtained results were simultaneously analyzed by the proposed Excel software, which was responsible for drawing an automated optimal water–wastewater network. Two case studies (fertilizer plants and a Brazilian petrochemical plant) were presented to show the validity of the proposed model. The obtained results for the abovementioned two case studies showed a reduction in freshwater consumption by 52.2 and 12.3%, respectively. Furthermore, the wastewater discharge was reduced to zero in the fertilizer plants studied, while the reduction percentage of wastewater discharge for the Brazilian petrochemical plant was 4.5%. It was also noticed that the obtained water-wastewater networks are more efficient and profitable than the present networks. This can be attributed to the reduction in freshwater consumption and wastewater discharge. Furthermore, the proposed approach is easy to use and can be applied to different industries, including fertilizer plants and petrochemical plants.
Author Contributions
Conceptualization, A.M.S., M.H.H. and A.A.B.; methodology, A.M.S. and M.H.H.; software, A.M.S. and A.A.A.; validation, A.A.A., A.M.S. and A.A.B.; formal analysis, A.A.A. and M.H.H.; investigation, A.A.A. and A.G.G.; resources, A.M.S. and A.A.B.; data curation, A.A.A. and A.G.G.; writing—original draft preparation, A.A.A.; writing—review and editing, A.M.S., A.G.G. and A.A.B.; visualization, A.M.S., M.H.H. and A.G.G.; supervision, A.M.S., M.H.H. and A.A.B.; funding acquisition, A.G.G. and A.A.B. All authors have read and agreed to the published version of the manuscript.
Funding
This work was supported and funded by the Deanship of Scientific Research at Imam Mohammad Ibn Saud Islamic University (IMSIU) (grant number IMSIU-RG23020).
Data Availability Statement
Data are available upon request through the corresponding author.
Conflicts of Interest
The authors declare no conflicts of interest.
References
- Galan, B.; Grossmann, I.E. Optimal Design of Distributed Wastewater Treatment Networks. Ind. Eng. Chem. Res. 1998, 37, 4036–4048. [Google Scholar] [CrossRef]
- Gabriel, B.; El-Halwagi, M. Simultaneous Synthesis of Waste Interception and Material Reuse Networks: Problem Reformulation for Global Optimization. Am. Inst. Chem. Eng. 2005, 24, 171–180. [Google Scholar] [CrossRef]
- Faria, D.C.; Bagajewicz, M. A new approach for the design of multicomponent water/wastewater networks. Comput. Aided Chem. Eng. 2008, 4, 43–48. [Google Scholar] [CrossRef]
- Galan, B.; Grossmann, I.E. Optimal Design of Real-World Industrial Wastewater Treatment Networks. Comput. Aided Chem. Eng. 2011, 37, 1251–1255. [Google Scholar] [CrossRef]
- Buabeng, E.; Majozi, T. Effective Synthesis and Optimization Framework for Integrated Water and Membrane Networks: A Focus on Reverse Osmosis Membranes. Ind. Eng. Chem. Res. 2015, 54, 9394–9406. [Google Scholar] [CrossRef]
- Padron, J.I.; Almaraz, S.; Martinez, A.R. Sustainable Wastewater Treatment Plants Design Through Multi objective Optimization. Comput. Chem. Eng. 2020, 140, 106–122. [Google Scholar] [CrossRef]
- Nejad, S.M.; Ataei, A.; Reza, G.; Mehrdadi, N.; Ebadati, F.; Lotfi, F. Water Pinch Analysis for Water and Wastewater Minimization in Tehran Oil Refinery Considering Three Contaminants. Environ. Monit. Assess. 2012, 184, 2709–2728. [Google Scholar] [CrossRef] [PubMed]
- Hansen, E.; Rodrigues, M.A.; Aragao, M.E.; Aquim, P.M. Water and Wastewater Minimization in a petrochemical Industry Through Mathematical Programming. J. Clean. Prod. 2017, 12, 959–981. [Google Scholar] [CrossRef]
- Li, Z.; Majozi, T. Optimal Design of Batch Water Network with a Flexible Scheduling Framework. Ind. Eng. Chem. Res. 2019, 58, 9500–9511. [Google Scholar] [CrossRef]
- Mohammad, A.; Ahmadi, A.; Mirzapour, S.M. Sustainable closed-loop Supply Chain Network for an Integrated Water Supply and Wastewater Collection System Under Uncertainly. J. Environ. Manag. 2020, 275, 111–128. [Google Scholar] [CrossRef]
- Arola, K.; Manttari, M.; Kallioinen, M. Two-Stage Nanofiltration for Purification of Membrane Bioreactor Treated Municipal Wastewater—Minimization of Concentrate Volume and Simultaneous Recovery of Phosphorus. Sep. Purif. Technol. 2020, 20, 317–344. [Google Scholar] [CrossRef]
- Chin, H.H.; Jia, X.; Sabev, P.; Klemes, J.; Liu, Z.Y. Internal and Total Site Water Network Design with Water Mains Using Pinch-Based and Optimization Approaches. ACS Sustain. Chem. Eng. 2021, 9, 6639–6658. [Google Scholar] [CrossRef]
- Tuba, D.; Ozel, S.; Bulkan, S. Water and energy minimization in industrial processes through mathematical programming: A literature review. J. Clean. Prod. 2021, 284, 124752. [Google Scholar] [CrossRef]
- Ho, L.Y.; Cheah, Y.T.; Chan, Y.J.; Chan, Y.J.; Wan, Y.K. Water Stress Reduction Using Superstructure-Based Mathematical Model: Synthesise a Wastewater Treatment Plant Associated with Nutrient Recovery for Palm Oil Industry. Process Integr. Optim. Sustain. 2024, 8, 393–405. [Google Scholar] [CrossRef]
- Liang, Y.; Weijun, H.; Dagmawi, M.; Wan, Z.; Thomas, S.; Xia, W. A system dynamics simulation model for water conflicts in the Zhanghe River Basin, China. Int. J. Water Resour. Dev. 2023, 39, 1039–1055. [Google Scholar] [CrossRef]
- Gajendra, K.; Ram, S.; Canxing, F.; Kuppusamy, S.; Fuchun, Z.; Tariq, M.; Karolina, K.; Xiang, G.; Xinghui, L.; Wesam, A. Development of optimum waste water using network. Energy 2024, 297, 131297. [Google Scholar] [CrossRef]
- Irene, M.L.; Dominic, C.Y. Flowrate Targeting Algorithm for Interplant Resource Conservation Network. Part 2: Assisted Integration Scheme. Ind. Eng. Chem. Res. 2010, 49, 6456–6468. [Google Scholar] [CrossRef]
- Sahu, G.C.; Garg, A.; Majozi, T.; Bandyopadhyay, S. Optimum Design of Waste Water Treatment Network. Ind. Eng. Chem. Res. 2013, 52, 5161–5171. [Google Scholar] [CrossRef]
- Farrag, N.M.; Kamel, D.A.; Ghallab, A.O.; Gadalla, M.A.; Fouad, M.K. Graphical Design and Analysis of Mass Exchange Networks Using Composition Driving Forces. South Afr. J. Chem. Eng. 2021, 36, 94–104. [Google Scholar] [CrossRef]
- Yamin, Y.; Yan, W.; Jie, Y.; Zhengguang, L.; Qi, L.; Bohong, W. Tech-economic modeling and analysis of agricultural photovoltaic-water systems for irrigation in arid areas. J. Environ. Manag. 2023, 338, 117858. [Google Scholar] [CrossRef]
- Pranit, D.; Kul, V.; Vijendra, K.; Aneesh, M. Water distribution system modelling of GIS-remote sensing and EPANET for the integrated efficient design. J. Hydroinformatics 2024, 26, 567–588. [Google Scholar] [CrossRef]
- Khezri, S.M.; Lotfi, F.; Tabibian, S.; Erfani, Z. Application of water pinch technology for water and wastewater minimization in aluminum anodizing industries. Int. J. Environ. Sci. Tech. 2010, 7, 281–290. [Google Scholar] [CrossRef]
- Mughees, W.; Al-Ahmad, M. Application of water pinch technology in minimization of water consumption at a refinery. Comput. Chem. Eng. 2015, 73, 34–42. [Google Scholar] [CrossRef]
- Liu, Z.Y.; Yang, Y.Z.; Zhang, Y. Determination the pinch point and calculating the freshwater target for water-using systems with single contaminant. Chem. Eng. Res. Des. 2007, 85, 1485–1490. [Google Scholar] [CrossRef]
- Chin, H.H.; Liew, P.Y.; Varbanov, P.S.; Klemes, J.J. Extension of pinch analysis to targeting and synthesis of water recycling networks with multiple contaminants. Chem. Eng. Sci. 2022, 248, 117223. [Google Scholar] [CrossRef]
- Kim, Y.; Lim, J.; Shim, J.Y.; Lee, H.; Cho, H.; Kim, J. Optimizing wastewater heat recovery systems in textile dyeing processes using pinch analysis. Appl. Therm. Eng. 2022, 214, 118880. [Google Scholar] [CrossRef]
- Skouteris, G.; Ouki, S.; Foo, D.; Saroj, D.; Altini, M.; Melidis, P.; Cowley, B.; Ells, G.; Palmer, S.; Odell, S. Water footprint and water pinch analysis techniques for sustainable water management in the brick-manufacturing industry. J. Clean. Prod. 2018, 172, 786–794. [Google Scholar] [CrossRef]
- Souifi, M.; Souissi, A. Simultaneous water and energy saving in cooling water networks using pinch approach. Mater. Today Proc. 2019, 13, 1115–1124. [Google Scholar] [CrossRef]
- Zhang, Q.; Yang, M.; Liu, G.; Feng, X. Relative concentration based pinch analysis for targeting and design of hydrogen and water networks with single contaminant. J. Clean. Prod. 2016, 112, 4799–4814. [Google Scholar] [CrossRef]
- Deng, C.; Feng, X.; Sum, D.K.; Foo, D.C.Y. Process-based Graphical approach for simultaneous targeting and design of water network. AIChE J. 2011, 57, 3085–3104. [Google Scholar] [CrossRef]
- Mabitla, S.S.; Majozi, T. A hybrid method for synthesis of integrated water and regeneration networks with variable removal ratios. J. Environ. Manag. 2019, 231, 666–678. [Google Scholar] [CrossRef] [PubMed]
- Quintero, V.; Quiroga, A.G.; Delgado, A.D.G. A hybrid methodology to minimize freshwater consumption during shrimp shell waste valorization combining multi-contaminant pinch analysis and superstructure optimization. Polymers 2021, 13, 1887. [Google Scholar] [CrossRef] [PubMed]
- Karthick, R.; Kumaraprasad, G.; Sruti, B. Hyprid optimization approach for water allocation and mass exchange network. Resour. Conserv. Recycl. 2010, 54, 783–792. [Google Scholar] [CrossRef]
- Cao, K.; Feng, X.; Ma, H. Pinch multi-agent genetic algorithm for optimizing water-using networks. Comput. Chem. Eng. 2007, 31, 1565–1575. [Google Scholar] [CrossRef]
- Esmaeeli, A.; Sarrafzadeh, M.H. Reducing freshwater consumption in pulp and paper industries using pinch analysis and mathematical optimization. J. Water Process Eng. 2023, 53, 10364. [Google Scholar] [CrossRef]
Figure 1.
Procedure for achieving the optimum design of a water–wastewater network.

Figure 2.
Source and sink streams were not integrated into the existing water network.

Figure 3.
Design of water–wastewater network for the fertilizer plants studied.

Figure 4.
Design of a water–wastewater network for a Brazilian petrochemical plant (case study 2).


Table 1.
Data regarding the sources in the investigated fertilizer plants.
| Sources | Flowrate (m3/h) | H2SiF6 (wt%) | H2SO4 (wt%) | P2O5 (wt%) |
|---|---|---|---|---|
| Source 1 (condenser of phosphoric acid plant) | 280 | 14 | 0.3 | 4 |
| Source 2 (reaction vacuum pump 1 of phosphoric acid plant) | 15 | 8 | 0.1 | 3 |
| Source 3 (filter vacuum pump 1 of phosphoric acid plant) | 18 | 8 | 0.1 | 3 |
| Source 4 (filter vacuum pump 2 of phosphoric acid plant) | 18 | 8 | 0.1 | 3 |
| Source 5 (separator of phosphoric acid plant) | 20 | 30 | 0.5 | 4 |
| Source 6 (cooling water of phosphoric acid plant) | 120 | 10 | 0.6 | 5 |
| Source 7 (cooling water of single-superphosphate plant) | 160 | 12 | 0.4 | 5 |
| Source 8 (condenser of the concentrated unit in phosphoric acid plant) | 250 | 20 | 0.2 | 4 |
Table 2.
Data regarding the sinks in the considered fertilizer plants.
| Sinks | Flowrate (m3/h) | H2SiF6 (wt%) | H2SO4 (wt%) | P2O5 (wt%) |
|---|---|---|---|---|
| Sink 1 (dilution mixer of sulfuric acid in phosphoric acid plant) | 10 | 12 | 0.5 | 4.5 |
| Sink 2 (dilution mixer of sulfuric acid in single-superphosphate plant) | 140 | 12 | 0.8 | 3.69 |
| Sink 3 (washing filter cake in phosphoric acid plant) | 50 | 10 | 3 | 5 |
| Sink 4 (gas scrubber in phosphoric acid plant) | 280 | 14 | 3 | 5 |
| Sink 5 (gas scrubber in single-superphosphate plant) | 280 | 16 | 3 | 6 |
| Sink 6 (gas scrubber in triple-superphosphate plant) | 180 | 11 | 3 | 5 |
| Sink 7 (washing filter in phosphoric acid plant) | 70 | 14 | 5 | 4 |
Table 3.
Data regarding the sources and sinks in the considered Brazilian petrochemical plant.
| Sources | Flowrate (m3/h) | COD (mg/L) | Sinks | Flowrate (m3/h) | COD (mg/L) |
|---|---|---|---|---|---|
| Clarified water | 1131 | 0 | Cooling water 1 | 717 | 3.7 |
| Filtered water | 21 | 0 | Cooling water 2 | 277 | 4.7 |
| Cooling water 1 | 717 | 30 | Cooling water 3 | 92 | 5.8 |
| Cooling water 2 | 277 | 25 | Cooling water 4 | 45 | 6.1 |
| Cooling water 3 | 92 | 25 | Bearing water 1 | 6 | 14.7 |
| Cooling water 4 | 45 | 25 | |||
| Bearing water 1 | 6 | 20 | Bearing water 2 | 15 | 3.5 |
| Bearing water 2 | 15 | 20 |
Table 4.
The optimum flowrates from sources to sinks and to waste of the studied fertilizer plants.
| Stream | Flowrate (m3/h) | Stream | Flowrate (m3/h) | Stream | Flowrate (m3/h) |
|---|---|---|---|---|---|
| FW | 129 | G4–6 | 9.0697 | G8–2 | 42.29 |
| GWaste | Zero | G5–4 | 2.7824 | G8–3 | 19.84 |
| G1–2 | 25.966 | G5–5 | 17.217 | G8–4 | 59.69 |
| G1–4 | 93.598 | G6–4 | 68.7 | G8–5 | 78.04 |
| G1–5 | 65.056 | G6–5 | 37.34 | G8–6 | 44.15 |
| G1–6 | 25.378 | G6–6 | 13.97 | FW1 | 4.0201 |
| G1–7 | 70 | G7–2 | 23.15 | FW2 | 24.8 |
| G2–2 | 5.9302 | G7–3 | 8.425 | FW3 | 21.738 |
| G2–6 | 9.0697 | G7–4 | 41.05 | FW4 | 14.175 |
| G3–2 | 8.9302 | G7–5 | 55.66 | FW5 | 26.684 |
| G3–6 | 9.0697 | G7–6 | 31.71 | FW6 | 37.581 |
| G4–2 | 8.9302 | G8–1 | 5.98 |
Table 5.
Flowrates from sources to sinks and to waste for the studied Brazilian petrochemical plant.
Table 5.
Flowrates from sources to sinks and to waste for the studied Brazilian petrochemical plant.
| Sinks | Sources Flowrates (m3/h) Distributed between Sinks and Waste | |||||||
|---|---|---|---|---|---|---|---|---|
| S1 (Clarified Water) | S2 (Filtered Water) | S3 (Cooling Water 1) | S4 (Cooling Water 2) | S5 (Cooling Water 3) | S6 (Cooling Water 4) | S7 (Bearing Water 1) | S8 (Bearing Water 2) | |
| K1 | 623.57 | 0 | 78.43 | 0 | 0 | 0 | 0 | 15 |
| K2 | 233.6 | 0 | 43.4 | 0 | 0 | 0 | 0 | 0 |
| K3 | 57.213 | 15 | 13.79 | 0 | 0 | 0 | 6 | 0 |
| K4 | 35.85 | 0 | 9.15 | 0 | 0 | 0 | 0 | 0 |
| K5 | 3.06 | 0 | 2.94 | 0 | 0 | 0 | 0 | 0 |
| K6 | 13.25 | 0 | 1.75 | 0 | 0 | 0 | 0 | 0 |
| Waste | 0 | 0 | 567.54 | 277 | 92 | 45 | 0 | 0 |
| Source Total Flowrate | 966.54 | 15 | 717 | 277 | 92 | 45 | 6 | 15 |
Disclaimer/Publisher’s Note: The statements, opinions and data contained in all publications are solely those of the individual author(s) and contributor(s) and not of MDPI and/or the editor(s). MDPI and/or the editor(s) disclaim responsibility for any injury to people or property resulting from any ideas, methods, instructions or products referred to in the content. |
© 2024 by the authors. Licensee MDPI, Basel, Switzerland. This article is an open access article distributed under the terms and conditions of the Creative Commons Attribution (CC BY) license (https://creativecommons.org/licenses/by/4.0/).
Share and Cite
MDPI and ACS Style
Shoaib, A.M.; Atawia, A.A.; Hassanean, M.H.; Gadallah, A.G.; Bhran, A.A. Simultaneous Synthesis of Single- and Multiple-Contaminant Water Networks Using LINGO and Excel Software. Water 2024, 16, 1244. https://doi.org/10.3390/w16091244
AMA Style
Shoaib AM, Atawia AA, Hassanean MH, Gadallah AG, Bhran AA. Simultaneous Synthesis of Single- and Multiple-Contaminant Water Networks Using LINGO and Excel Software. Water. 2024; 16(9):1244. https://doi.org/10.3390/w16091244
Chicago/Turabian StyleShoaib, Abeer M., Amr A. Atawia, Mohamed H. Hassanean, Abdelrahman G. Gadallah, and Ahmed A. Bhran. 2024. "Simultaneous Synthesis of Single- and Multiple-Contaminant Water Networks Using LINGO and Excel Software" Water 16, no. 9: 1244. https://doi.org/10.3390/w16091244
Note that from the first issue of 2016, this journal uses article numbers instead of page numbers. See further details here.