
A High-Robust Displacement Prediction Model for Super-High Arch Dams Integrating Wavelet De-Noising and Improved Random Forest


1
State Key Laboratory of Hydrology-Water Resources and Hydraulic Engineering, Hohai University, Nanjing 210098, China
2
College of Water Conservancy and Hydropower Engineering, Hohai University, Nanjing 210098, China
3
National Engineering Research Center of Water Resources Efficient Utilization and Engineering Safety, Nanjing 210098, China
*
Authors to whom correspondence should be addressed.
Water 2023, 15(7), 1271; https://doi.org/10.3390/w15071271
Submission received: 13 February 2023
/
Revised: 17 March 2023
/
Accepted: 21 March 2023
/
Published: 23 March 2023
(This article belongs to the Section Urban Water Management)
Abstract
:We present a novel deformation prediction model for super-high arch dams based on the prototype monitoring displacement field. The noise reduction processing of the monitoring data is conducted by a wavelet technique. The performance-improved random forest intelligent regression approach is then established for constructing the arch dam deformation statistical models, whose hyper-parameters are intelligently optimized in terms of the improved salp swarm algorithm. In total, three enhancement strategies are developed into the standard salp swarm algorithm to improve the global searching ability and the phenomenon of convergence precocious, including the elite opposition-based learning strategy, the difference strategy, and the Gaussian mutation strategy. A prediction example for super-high arch dams is presented to confirm the feasibility and applicability of the prediction model based on five evaluation criteria. The prediction results show that the proposed model is superior to other standard models, and exhibits high-prediction accuracy and excellent generalization performance. The stability of the proposed prediction model is investigated by artificially introducing noise strategies, which demonstrates the high-robust prediction features and provides a promising tool for predicting carbon emissions, epidemics, and so forth.
1. Introduction
Among water-conservancy engineering measures, dams play an important role in regulating the spatial and temporal distribution of water resources [1]. Moreover, dams are a key component of the flood control engineering system. Despite their enormous benefits, the consequences of dam failure are unacceptable [2]. Unfortunately, since the 1920s, several dams such as the St. Francis Dam [3], Malpasset Arch Dam [4], Banqiao Earth Dam [5] and others have experienced serious failures. However, most dam failures occur with warning signs [6]. Therefore, by analyzing prototype observation results in a timely manner and establishing a reasonable model, most hidden dangers can be identified and subsequently prevented from causing catastrophic engineering accidents [7,8].
Modern concrete dams are equipped with various monitoring devices, such as strain gauges, osmometers, and thermometers installed at key points, to monitor performance indicators such as deformation, cracks, and stress [9]. By analyzing the data collected from these devices, the running status of the dam can be assessed. Deformation, in particular, is a crucial indicator for evaluating dam safety performance as it comprehensively reflects the dam’s stability [10]. By establishing a corresponding prediction model and mining the inherent laws of deformation data, the current situation of the dam can be accurately assessed, and the development trend can be predicted. This approach allows for the timely identification of hidden dangers and the implementation of appropriate measures to prevent catastrophic failures.
During the displacement acquisition process, various factors can introduce noise in the displacement collection, which can seriously affect the quality of the displacement data and lead to misjudgment of the dam’s state by regulators [11]. Therefore, noise removal is an essential step in displacement pretreatment. Although Fourier analysis is a traditional denoising method, it is ineffective for nonstationary signals such as displacement. Therefore, wavelet analysis is used to denoise the signal. Wavelet denoising involves decomposing the original signal, applying a threshold, and reconstructing the signal [12]. In the wavelet denoising process, the choice of threshold function is significant, and the hard or soft threshold function is commonly employed. However, using a hard threshold function for denoising can lead to large variances in the denoised outcomes, while using a soft threshold function can result in the loss of some high-frequency information when reducing the coefficients of wavelet with large absolute value [13]. To overcome the shortcomings of the above threshold functions, this paper proposes using the Garrot function proposed by Gao as a new threshold function. This method effectively improves the noise reduction effect [14].
To ensure dam safety, it is necessary to establish data-based predictive models that calculate the dependent variable under water, road, gravity load, and other loads. These models compare the forecast value with the monitoring value to evaluate the running state of the dam under the current load. However, prediction models based on mechanistic principles may not be very accurate due to the uncertainty of parameters [15]. On the other hand, statistical models are easy to implement but do not consider the dam’s physical properties and foundation. According to statistical methods, the dam deformation monitoring model usually has three effects [1]: water pressure component, temperature component, and aging component. To date, a variety of powerful predictive models have been applied in many areas of science and engineering. Ma [16] increased the efficiency in slope stability analysis by using MKRVM. Li [17] applied RSCART to conduct landslide sensitivity analysis. Bui [18] used ANFIS for flood susceptibility. Of course, many intelligent algorithms are also applied to the field of deformation prediction. Hu [19] developed LSTM model to predict the settlement of o concrete-face rockfill dams. Chen [20] used SVM to predict dam deformation. Najafzadeh [21] applied a multiple-kernel SVM to estimation of water quality. Kang [22] simulated temperature effect on dam with kernel learning machines. However, the existing models do not consider the impact of noise on data, which limits the improvement of fitting accuracy and reliability. In addition, given the outliers in the data, the prediction effect of some models with low robustness is poor.
Random forests (RF) are widely recognized for their outstanding data-mining capabilities and prediction accuracy. RF can also effectively resist interference of outliers and noise [23]. RF is now widely applied to dynamic load identification [24], gene dataset analysis [25], the technology of locating loose particles [26] and others. RF also bears good applicability in predicting dam deformation. Dai [27] applied the performance-enhanced RF model to the displacement of concrete dam. Liu [28] constructed a safety monitoring model by using a RF model. However, in these studies, their determination of hyperparameters is anthropogenic or not comprehensive. Optimizing the hyperparameters and considering the noise contained in the data will effectively enhance the capability of prediction.
The setting of hyperparameters during the training process of the RF model Is a key factor in increasing precision and improving the model’s generalization performance [29]. Finding appropriate parameters for different datasets while ensuring efficiency is a hot topic in random forest research. Traditional parameter optimization methods are mainly based on Grid Search or set according to human experience, which can be inefficient, especially when dealing with many parameters and large datasets. Therefore, introducing machine learning algorithms for parameter selection is a good option. Examples of optimization algorithms include particle swarm optimization [7,30], gravity search algorithm [31], and gray wolf optimization [32].
The Salp Swarm Algorithm (SSA) is a biological heuristic algorithm that was first proposed in 2017 [33]. The fundamental idea behind this algorithm is that, by tracking food sources, salp swarms can approach global optimization and achieve their goals. As a new metaheuristic algorithm, SSA possesses several appealing characteristics [34]. Firstly, the algorithm has only one main control parameter. Secondly, the gradual motion of followers effectively prevents the algorithm from getting stuck in local extreme values. Thirdly, during each iteration, the algorithm preserves the best solutions, even if the whole population deteriorates. This ensures that the best solution is not lost. Additionally, the control parameters are adaptively reduced in the iterative process, which controls the leader’s exploration and development around the current food source. These advantages help the algorithm to better avoid local solutions in multimodal search spaces.
Previous studies have demonstrated the competitive performance of SSA in various optimization problems compared to other well-known metaheuristic algorithms [33]. However, SSA, like most optimization algorithms, suffers from local optimization and low solution precision [35]. To address these issues, an improved version of SSA, called ISSA, has been proposed. ISSA incorporates the elite opposition-based learning strategy to balance development and exploration capabilities [35], a difference strategy to enhance the follower position [36], and Gaussian mutation to prevent the algorithm from falling into local optimization [37]. Experimental results in this paper demonstrate that ISSA outperforms or performs equivalently to SSA and other metaheuristic algorithms.
The focus of this paper is to investigate the accuracy, generalization performance, and robustness of the proposed model in dam prediction compared to other models. Section 2 introduces the selection of influence factors of arc dam deformation and the pre-processing technique using wavelet denoising. Section 3 elaborates on the construction principle of the RF model. Section 4 describes the steps to optimize RF model parameters using ISSA. Section 5 discusses how to construct the prediction model by combining the RF model, ISSA model, and wavelet denoising. Section 6 provides an example of the Xiaowan arch dam to verify the precision and stability of the proposed model. Finally, Section 7 summarizes the findings and provides concluding remarks.
2. Statistical Model Construction and Pre-Processing Technique for Dam Displacement Data
2.1. The Selection of the Influencing Factors of Dam Deformation
Based on the structural and mechanical theory analysis of super-high arch dams, the causes of dam displacement include three parts [1]:
where , and are respectively the water pressure component, the temperature component, and the aging component.
- Water pressure component
The horizontal displacement caused by water load includes three parts: is caused by the dam itself; is caused by dam foundation deformation; is caused by rotation of water gravity. Three types of horizontal displacement are presented in Figure 1.
Through the theory proposed by Wu, is linearly related to , and , and is linearly related to and , is linearly related to . Since the research object of this paper is arch dam, we add the explanatory variables of arch dam. Therefore, the expression of the component is:
where denotes the fitting coefficient, usually, is taken 4 or 5 for arch dams, denotes the upstream water level.
- Temperature and aging component
Since the temperature component changes periodically with time, the period harmonic is appropriate to fit the environmental variable.
where denotes the cycle, is usually taken as 1 or 2, and denote coefficients, is the cumulative number of days.
For normal operation dams, the aging displacement changes with time from sharp to stable. The mathematical model can be expressed as follows:
where and are fitting coefficients of aging factors, represents time, .
Therefore, combining Equations (2)–(4) into Equation (1), the horizontal displacement of the super-high arch dams can be given as:
where is the coefficient determined by the initial state.
2.2. Wavelet De-Noising for Displacement Signal Processing
In the process of displacement acquisition, the displacement is inevitable to be affected by various factors, which lead to the noise contained in the acquired displacement. Noise in displacement seriously affects the displacement quality and makes people misjudge the state of the dam. Therefore, noise removal is an essential step of displacement pretreatment. The traditional de-noising method is Fourier analysis, but Fourier analysis is powerless for displacement which is a non-stationary signal, so wavelet analysis is widely used to process the noisy signal.
2.2.1. Wavelet Threshold De-Noising Principle
Wavelet threshold de-noising includes the wavelet decomposition of the original signal to obtain each detail component and approximate component, the thresholding of the detail component, and the wavelet reconstruction of the processed components to obtain the noise-reduced signal. Suppose that the signal becomes after being polluted by noise, the general de-noising model can be expressed as:
where is the noise, denotes the noise intensity, and the simplest case is the Gaussian white noise when . The wavelet de-noising aims at removing and restoring the signal . Discrete wavelet transform is applied to to obtain:
where denotes a wavelet coefficient, but Equation (7) is complex to calculate and generally has no display expression, so we often use Mallat’s pyramidal decomposition algorithm which is one of the fast algorithms for wavelet decomposition and reconstruction:
where and are low pass and high pass filters corresponding to and respectively. Integrating Equations (8) and (9), the wavelet reconstruction formula is given as:
where and are low pass and high pass filters. After the transform of Equation (6), the wavelet coefficients of the original noise and signal are obtained. The wavelet threshold is used to classify the wavelet coefficients. Coefficients of the signal that are larger than threshold are retained, while those of noise that are smaller than the threshold should be set to zero. Based on this, wavelet de-noising is divided into three steps. Firstly, a wavelet signal with layers is selected for wavelet decomposition. Then, the coefficients are determined according to the threshold function. Finally, the signal is reconstructed using the processed coefficients of each layer.
2.2.2. Selection of Wavelet Bases, Threshold, and Threshold Function
The choice of wavelet can have a significant impact on the results of signal analysis. Ideally, a selected wavelet should possess certain desirable properties, such as orthogonality, higher order loss-moment, anti-symmetry. However, it is difficult to find a wavelet that possesses all of these properties simultaneously. For example, only the Haar wavelet is either symmetric or anti-symmetric, while higher order loss-moment and compact support are contradictory properties. As a result, the selection of wavelet often involves a trade-off between conflicting characteristics. In practice, compactly supported wavelets are commonly used, and the choice of wavelet ultimately depends on the specific features of the signal being analyzed [38].
The choice of a threshold is a critical step that significantly affects the de-noising effect. Various thresholds, such as the general threshold (VisuShrink), SureShrink threshold, Minimax threshold, BayesShrink threshold, and variable threshold, have been extensively studied in the literature. In this paper, we adopt the variable threshold, which is an improvement over the general threshold and can ensure a good de-noising effect when N is large:
where is the number of decomposition layers, denotes the length of data, and denotes the standard deviation of the noise.
Threshold functions reflect strategies for processing wavelet coefficients. Hard and soft threshold functions are commonly used, but they have their own shortcomings. The hard threshold function has a breakpoint at , and its de-noising process often leads to a large variance in the results. The soft function provides more stable noise reduction results, but it reduces the coefficients of wavelets with large absolute values, resulting in less well-preserved high-frequency information and less clear signal edges. To address the drawbacks of these threshold functions, Gao proposed a method to create a new threshold function using the Garrot function [7], whose analytical formula is:
3. Random Forests for Monitoring Model Construction
3.1. Random Forests
The random forest (RF) model is a combination model composed of multiple classification trees and regression trees without pruning. Suppose that each sample point in the given classified data set is made up of an instance and a tag , is the instance space, is the tag set, is a forest made up of a series of decision trees.
The boundary function of RF is:
where is the probability of correct classification of the random forest model, is the maximum probability of misclassification of the RF model.
Set the data set out of bag which corresponds to individual classifier in the random forest . is the ratio that the sample x is predicted to be marked as and the expression of can be given as:
where is characteristic function, indicates the number of trees, the denominator represents the sum of out-of-bag sample data of each decision tree, and the numerator represents the sum of the data amount of out-of-bag data correctly classified in each decision tree. Define the intensity of random forests and the expectation of random forest boundary function:
According to Equations (14) and (15), we can get:
Equation (16) reflects the average accuracy of all decision trees in the random forest on their out-of-bag data. The correlation of random forests:
where and are the out-of-bag estimate of and respectively, and that can be expressed as follows:
where indicates the category different from the category that maximizes the estimate in the training set and which can be expressed as:
The generalization error can be derived as:
According to the Law of Large Numbers, the generalization error of trees has the following convergence relation:
Equation (22) shows that with the increase of trees, the generalization error of random forests tends to an upper bound, which also theoretically shows that random forests have good scalability for unknown data and will not overfit. The upper bound of the generalization error is:
where is the correlation degree of random forest and is the intensity of random forest.
Based on the analysis of generalization error and Equation (23), there are two crucial factors that determine the generalization ability of RF: the strength of trees in the forest and the correlation of trees in the forest. The former requires high accuracy of individual learners, while the latter requires diversity and high differences among individual learners. However, in practice, individual learners trained to solve the same problem are not inherently independent. Therefore, improving the accuracy of individuals and the independence of individual decision trees is crucial for optimizing random forests.
3.2. The Construction Process of Random Forest
Figure 2 illustrates the overall random forest model building process, which is divided into three stages:
- Select samples randomly. Bootstrap is used for sampling with the replacement method, and a training set is constructed for each decision tree.
- Select features randomly to construct a decision tree. Each node of the decision tree is formed by selecting a part of the total features continuously.
- All decision trees are combined into a random forest. At the prediction stage, each decision tree votes with the weight Select the tree with the most votes to get the equal-weighted vote model of the basic learning model as follows:
3.3. Relevant Parameters of the Random Forest Model
Many hyper-parameters need to be adjusted in the random forest model. One part of them comes from the basic decision tree, and the other part comes from the RF model itself. Under the premise of ensuring the stability of training data, excellent combinations of parameters can improve maximum accuracy and generalization performance. The introduction of the hyper-parameters of the RF model is given as follows:
- Number of basic decision trees (ntree) is according to the training environment of the model.
- Maximum number of features (features) is the maximum number of the candidate features when building the basic decision tree model.
- Depth of the base decision tree (depth) controls the maximum value of the lower limit of subtree growth in a random forest model.
- Minimum sample number of leaf nodes (leaf) is used for pruning the subtree of the random forest model. This parameter determines whether to retain leaf nodes and sibling leaf nodes
- Evaluation criteria for node feature selection (criteria) include entropy, Gini coefficient, and so on.
Different parameters have different effects on the random forest model. This paper focuses on (1), (2), (3), and (4). For parameter (5), the Gini coefficient is selected to build trees, to improve the construction speed of the RF model.
4. Improved Salp Swarm Algorithm
4.1. Mathematical Model of the Salp Swarm
The swap swarm is a population of marine organisms characterized by transparent, barrel-shaped bodies. Individuals in the population move and feed in a chain formation, with each individual connected head to tail. Figure 3 illustrates an individual and the chain of the swap swarm [33]. The swarm is composed of leaders and followers, with leaders possessing superior environmental judgment for global search, and followers conducting local search.
Inspired by the collective behavior of the salp swarm, the algorithm to simulate this behavior is as follows:
Assume that the population number of the salp swarm is , and the spatial dimension is , then the position of the salps in the N-dimensional space is . The food position in the search space can be written as . The maximum of the space is and the minimum of the space is . The initialization process of the population can be expressed as:
where and are the leader and follower in the search space respectively, where is the dimension, , and is the serial number of the follower, . During chain movement and foraging, the leader’s position update calculation can be expressed as:
where is the convergence factor and its expression is , and denote the maximum number of iterations and current number of iterations, and are both random numbers.
The location update of the follower is influenced by its initial position, velocity, and acceleration during movement and mutual influence between the front and rear individuals. Their motion conforms to Newton’s law of motion, and the iteration formula is:
where and is respectively in the positions of the followers which are closely connected, corresponds to its updated position.
4.2. Performance-Improved Salp Swarm Algorithm
Like other intelligent algorithms, the Salp Swarm Algorithm (SSA) has some shortcomings, such as low-solution accuracy and a tendency to fall into local optima easily. To address these issues, scholars have proposed several improvement measures. For example, Wang introduced the self-adaptive evaluation-move strategy to the basic algorithm [39], and Gehad Ismail Sayed proposed an SSA algorithm based on chaos theory [35]. To further enhance the solution precision and global search capability of SSA, an improved Salp Swarm Algorithm (ISSA) is proposed in this chapter. Firstly, the elite opposition-based learning strategy is used to effectively balance the development and exploration capabilities [36]. Secondly, a difference strategy is introduced to improve the follower position, expanding the search scope and promoting the precision of the algorithm. Finally, Gaussian mutation is applied to the food position to prevent the algorithm from falling into local optimization. Experimental results demonstrate that the performance of ISSA is superior to or at least equal to that of SSA and other metaheuristic algorithms.
4.2.1. Elite Opposition-Based Learning Strategy
This strategy can simultaneously evaluate both current and reverse candidate solutions, providing more opportunities to find the global optimal solution. However, the reverse learning strategy is not suitable for all types of optimization algorithms. In the case of multimodal function problems, the transformed candidate objects may deviate from the global optimal solution. To address this issue, this paper introduces good information about elite individuals based on opposition-based learning and provides proof of the global convergence of elite reverse learning strategies. The steps of the strategy are as follows:
where denotes elite individual, and are the t-th current solution and reverse solution of the i-th generation, is the j-th component of :
where , , is a random number subject to uniform distribution on [0, 1].
The proposed strategy involves selecting superior individuals from both the reverse solution and the current solution to be included in the next generation. This approach enhances the diversity of the population and reduces the probability of falling into local optimization. If the optimization algorithm can provide the interval of the optimal solution, the search interval composed of elite individuals can converge to the interval of the optimal solution. The generation of inverse solution on the search interval composed of elite individuals can guide the search process closer to the optimal solution, thus improving the convergence speed of the algorithm.
In this chapter, the generated reverse and current solutions are processed using a greed strategy, and more excellent individuals are retained to increase population diversity and avoid the algorithm from falling into local optimization.
4.2.2. Differential Strategy
As can be seen from the SSA, the location update of the i-th salp is only related to its own location and the location of the following salp. This method of updating the location immediately after receiving the location information in one direction may limit the search effect of the algorithm.
In view of this defect of the algorithm, the location information of the i − 2-th salp is introduced to guide the individual followers to increase the search range. This strategy is helpful to refrain from local optimum, enhances the search capabilities of the algorithm, and improves the solution accuracy. Select three individuals, i.e., , , that follows each other from the population, and then update the position of the i-th follower as follows:
where is at the j-dimension of the i-th salp in the round, , and are random number that follows the uniform distribution between [0, 1].
4.2.3. Gaussian Mutation Strategy
In the Salp Swarm Algorithm, all individuals directly or indirectly learn from the current best individual (food). However, this can lead to a loss of species diversity in the later stages of evolution. If the best individual falls into the local best, it can easily result in search stagnation and premature convergence. To address this issue, the application of Gaussian mutation on the food can enhance the algorithm’s capability to jump out of the local optima. Additionally, the mutation result of the greedy reservation strategy can guarantee a good global retraction of the calculation. This approach helps to improve the algorithm’s ability to escape local optima and promotes exploration of the search space.
In the procedure of optimization, if the adaptability of the best individual (food) at present hasn’t been improved for several consecutive cycles ( set as 5), the Gaussian mutation is used on the food. The expression is as follows:
where is a random variable that follows the standard normal distribution. The greedy strategy that is applied to the result of the Gaussian mutation can be expressed as:
where and denote the fitness function of and , respectively.
5. Construction Process of Prediction Model and Performance Evaluation Criterions
According to Section 2, Section 3 and Section 4, a displacement prediction model for arch dams integrating wavelet de-noising and improved random forest can be constructed. Its structure is presented in Figure 4 and the operation process has been implemented on the Python platform. Operation steps are as follows:
Step 1: Create a data set of input and output modes, and the data set is divided into a test set and a training set as required. The model takes the influence factor of dam deformation and dam deformation as input variable and output variable. According to Equation (8), for the concrete arch dam, the input variables are as follows:
Step 2: Wavelet de-noising for displacement.
Step 3: Set the size of population , the dimension , the maximum number of iterations , and the upper bounds and the lower bounds of the random forest hyperparameters.
Step 4: Initialize the location of the salp swarm and the food.
Step 5: Update the salp swarm and food position based on the rules in Section 5.
Step 6: Cycle Step5 until is reached, and then output the food location, that is, the best hyper-parameters of the RF model.
Step 7: Establish the RF prediction model according to the optimal hyperparameters. The prediction model is objectively evaluated by using the five statistical indicators given in Equations (34)–(38), including the mean absolute error (MAE), the maximum error (ME), the mean absolute percentage error (MAPE), the root mean square error (RMSE), and the multiple correlation coefficient (R2).
where represents the number of samples, denotes mean value, and are the i-th measured and predicted value. A detailed construction process is summarized in Figure 4.
6. Engineering Example
6.1. Project Background and Deformation Monitoring
Taking the Xiaowan concrete arch dam located across the Lancangjiang River in Yunnan Province as a study object to verify the proposed prediction model. The lowest point of the dam foundation surface is 953 m. The top breadth of the crown cantilever is 12 m and the bottom breadth is 72.91 m. The elevation is 1245 m, and the maximum height is 292 m. It is one of the highest dams of the same type in the world. The check water level of Xiaowan Hydropower Station is 1242.51 m, with a total reservoir capacity of 15 billion m3. The normal pool level is 1240 m and the dead water level is 1166 m, with a regulated reservoir capacity is 9.9 billion m3 [40]. The project focuses on electricity generation and has comprehensive Utility benefits. Figure 5 shows the airscape of Xiaowan Arch Dam.
As of now, the primary construction of the Xiaowan Hydropower Station has been completed. Figure 6 illustrates the arrangement of pendulum monitoring instruments for measuring horizontal displacement. The research object of this study is the radial displacement of A09-PL-01, A09-PL-02, and A19-PL-01 from 1 July 2010, to 17 February 2020. The evolution of the water level and the horizontal displacement at the three measuring points are presented in Figure 7. A positive value indicates the radial horizontal displacement downstream. The algorithm’s effectiveness was verified through a total of 3519 observations, with 80% of these being training sets and the remaining 20% being test sets.
In this study, the displacement data of the training set were first denoised using the WD method with Sym4 as the wavelet basis function. The variable threshold (Equation (11)) and the Garrot threshold function method (Equation (12)) were used, and the number of decomposition layers was set to 3. Subsequently, ISSA, as introduced in Section 5, was utilized to optimize the hyperparameters of the RF model. The initial parameters of the salp swarm algorithm were set to 15 for the population number and 30 for the maximum number of iterations. The search space of ntree, depth, leaf, and feature was set to [3, 20], [1, 50], [1, 200], and {auto, log2, sqrt}, respectively, which represents an integer space. After the final iteration, the optimal hyperparameters of the random forest model were obtained as the final food location. Based on the optimal hyperparameters, a random forest prediction model was established, and the prediction results and performance indicators were obtained.
6.2. Performance Analysis of the Proposed Model Considering Wavelet De-Noising Technique and ISSA Algorithm
To verify the optimization effects of wavelet de-noising and ISSA on the prediction model, corresponding models were established for each measuring point. The aim was to investigate the influence of wavelet de-noising on model accuracy, as well as the effect of the ISSA algorithm on convergence and global search ability. The comparison results are presented below.
For measuring point A09-PL-01, a prediction and fitting model was established using ISSA-RF. The model included two cases: one where the original data was pre-processed by wavelet de-noising, and the other where Savitzky-Golay de-noising was used. The latter is also known as a smoothing filter and is a common method to eliminate noise based on polynomial fitting in the time domain. The comparison results, including the displacement plot and residual plot with Savitzky-Golay de-noising or wavelet de-noising, are presented in Figure 8. It can be observed that wavelet de-noising effectively reduced the noise of the fitting displacement. The residual map also shows that the model residual after wavelet de-noising is smaller than that after Savitzky-Golay de-noising in the prediction part, indicating that wavelet de-noising has a better effect on enhancing the prediction ability.
Furthermore, to compare the optimization effects of ISSA and SSA, prediction models were established at three measuring points. Figure 9 shows the three-dimensional trajectory of ISSA and SSA when optimizing the three measuring points. The three dimensions of the trajectory are the hyperparameters to be optimized. It can be seen from Figure 9 that SSA converges faster, but it can easily get bogged down in local optimization. On the other hand, ISSA has roughly the same convergence ability, but it also has a stronger global search ability. This, to some extent, avoids the impact of local optimization on prediction models. Table 1 shows that the optimal fitness of ISSA is also better than that of SSA. Based on the global search capability and prediction accuracy, it can be concluded that the improvement of the salp swarm algorithm is feasible and efficient.
6.3. Accuracy Evaluation of the Prediction Models
The proposed model is referred to as the WD-RF-ISSA model, which takes the wavelet de-noised data sequence as its input vector. To avoid blindly selecting RF hyperparameters, ISSA is utilized for optimizing the hyperparameters. To validate the prediction capability of the proposed model established in Section 5, displacement prediction models were established using other methods, such as the ISSA-RF model and the SSA-RF model, to verify the feasibility and applicability of the enhancement strategies. Furthermore, the GWO-RF model is established to validate the superiority of SSA. In addition, ELM and stepwise regression models (SR) were also established. Figure 10 presents the predicted displacements and residuals of the above six models, and Figure 11 provides the prediction performance using six different models in three datasets. The specific values for predicted performance are presented in Table 1. The comparison results are as follows:
- (1)
- Comparison of performance between the proposed model and the ISSA-RF model: The results presented in Figure 10 and Figure 11 and Table 1 indicate that for measuring point A09-PL-02, the WD-ISSA-RF model exhibits a higher multiple correlation coefficient (R2) of 97.89% as compared to 97.48% for the ISSA-RF model. Moreover, the WD-ISSA-RF model has smaller MAE, MSE, and MAPE values than the ISSA-RF model. Similar trends were observed for the other two measuring points. Therefore, it can be concluded that the WD-ISSA-RF model outperforms the ISSA-RF model in terms of modeling accuracy, and wavelet de-noising is an effective technique for enhancing prediction capability.
- (2)
- Comparison of performance between the ISSA-RF model and the SSA-RF model: The ISSA-RF model employs the elite opposition-based learning strategy, difference strategy, and Gaussian mutation strategy to enhance the global search ability and avoid local optimization. From Figure 10, it can be observed that ISSA maintains a roughly similar convergence speed but exhibits a better global search ability as compared to SSA. The results presented in Figure 11 and Table 1 indicate that the ISSA-RF model has smaller MAE, MSE, and MAPE values than the SSA-RF model at all three measuring points. Hence, the ISSA-RF model demonstrates stronger predicting, learning, and generalization ability than the SSA-RF model. Although the ME of the ISSA-RF model on A09-PL-02 is slightly higher than that of the SSA-RF model, this does not affect the overall conclusion since the maximum error is an outlier value.
- (3)
- Comparison of performance between the SSA-RF model and the GWO-RF model. As a swarm intelligence algorithm, GWO achieves global optimization according to behavior of gray wolves [41]. GWO divides the wolves into four groups, including , , and common gray wolf according to their social rank. Wolf , and are the leaders of the gray wolf group, with the highest adaptability. The common gray wolf obeys wolf , and , according to their location, and is constantly approaching the prey, which is the optimal solution. Figure 12 reveals the relationship curve (A19-PL-01) between the fitness value and the number of iterations of the SSA and GWO. Figure 12 reveals that the best fitness of SSA is better than that of GWO and the SSA algorithm has a faster convergence speed.
- (4)
- Comparison of performance between the RF model and the ELM model. The ELM model proposes a novel hidden layer forward-type network based on the theory of generalized inverse [42]. By changing the hidden layer nodes, the optimal fitness value is obtained. From Table 1 and Figure 11, the prediction accuracy of the ELM model at the three measuring points varies. Although the R2 of the ELM model on A9-PL-02 and A19-PL-01 is equal to or slightly better than that of the GWO-RF model, the R2 on A9-PL-01 is 0.893, far less than that of the GWO-RF model on A9-PL-01. This situation has also occurred in other monitoring indicators, indicating that the stability and generalization performance of the RF model surpasses the ELM model. Data samples may have the problem of multicollinearity, and this can lead to random fluctuations in the output of the ELM model. This problem is well overcome by the RF model.
- (5)
- Comparison of performance between the RF model and SR model. The SR model adaptively screens variables with high importance on the basis of multiple regression, to establish a prediction model with selected variables [1]. From Table 1 and Figure 11, it is clear that each performance index of the ISSA-RF model is better than that of the SR model at the three different measuring points. Therefore, the ISSA-RF model is more accurate in prediction than the SR model, and has stronger learning and generalization ability.
By comparing the results of the six models, it can be seen that by using ISSA to optimize the RF model, the model with wavelet de-noised data as the input vector has better prediction capability and generalization performance.
6.4. Robustness Analysis
The proposed model’s robustness refers to its ability to withstand inherent errors. To test the robustness of the model, this study established training samples with different types of random errors for model training and prediction. Three different types of outliers, including point-scattered type, step type, and vibrating type, were added to the training set to test the proposed model’s performance. Point-scattered outliers are outlier points that are one percent of the number of training sets, with an outlier amplitude of 3 mm. A step-type outlier point refers to the point where the change range of the collected data is greater than that of daily statistics and it remains for a while or continues. The vibrating outlier means that the collected data of the point rises and falls repeatedly in a short time. In this paper, Gaussian noise is used to simulate the vibrating outlier in an interval of the test set.
Three prediction models based on three training sets, including different types of outliers, were established, as shown in Figure 13. The fitting and forecasting effect remained almost unchanged for different types of training sets. This suggests that the model is not affected by various types of errors during training, and the fitting results in the data set with errors are close to the original data set, indicating the model’s strong robustness. Furthermore, the model also performed well in terms of deformation prediction.
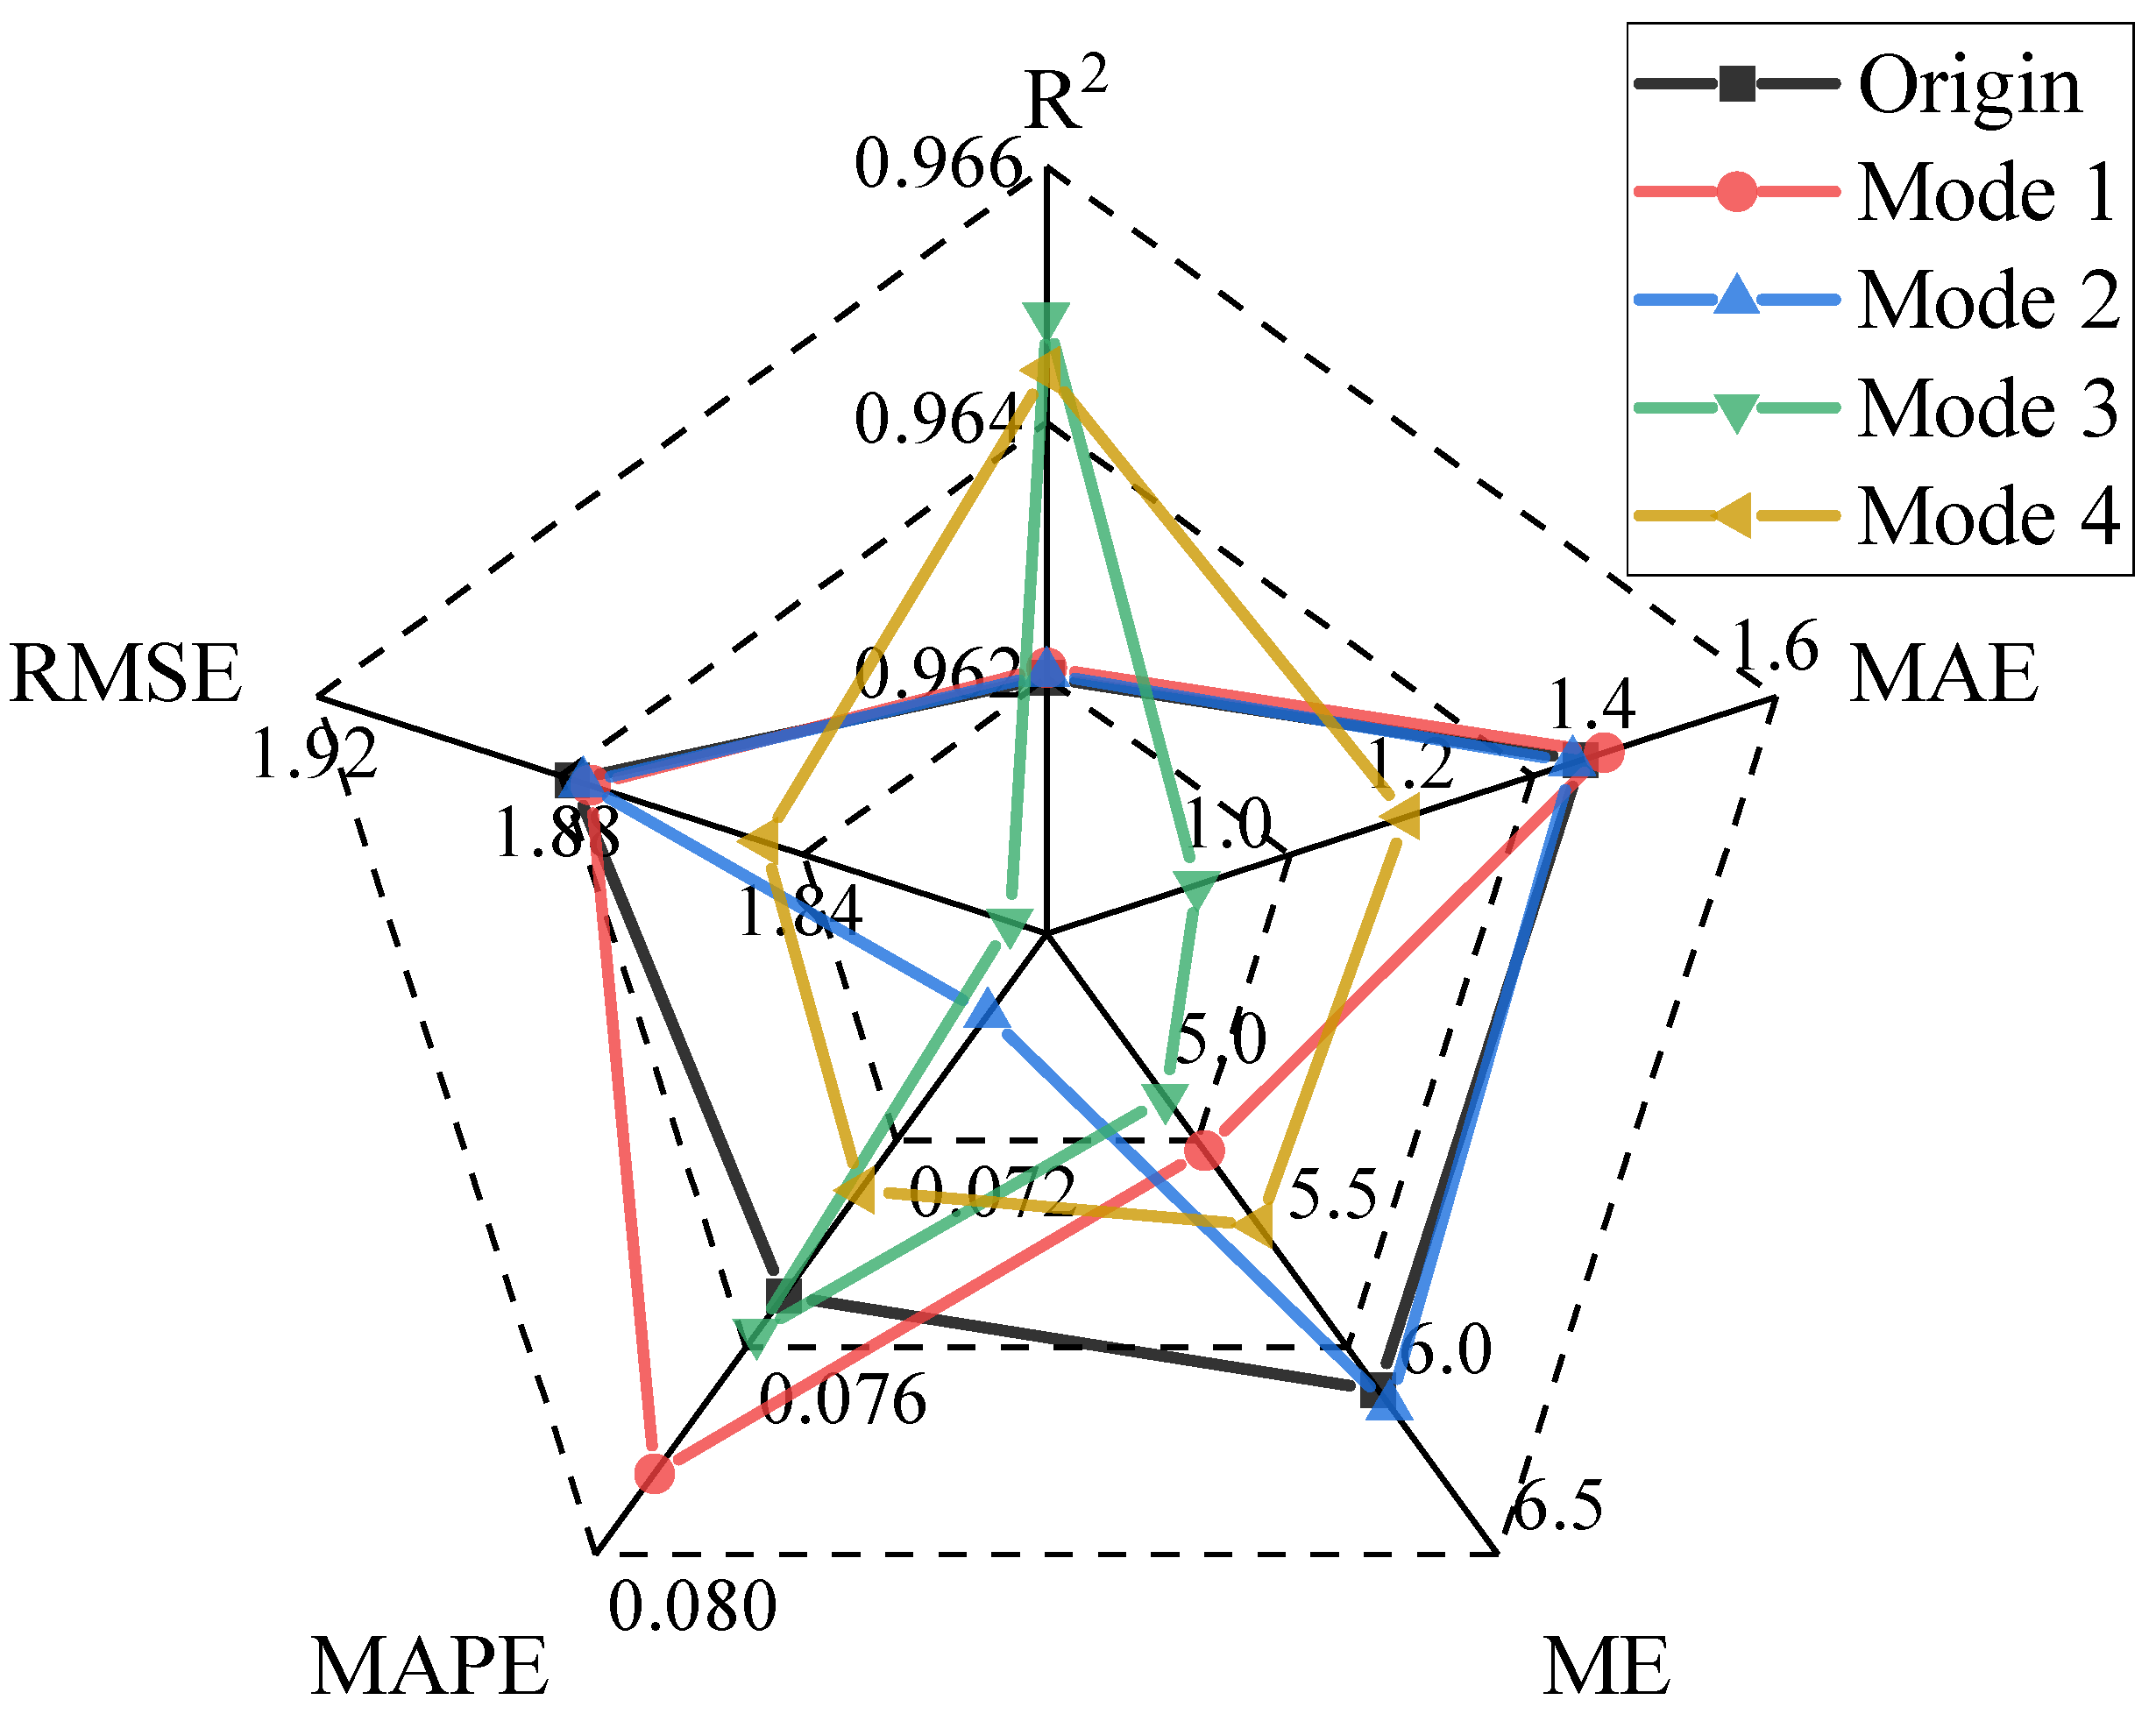
Performance indicators, such as MAE, ME, MAPE, RMSE, and R2, were used to numerically evaluate the stability performance of the model set. Figure 14 shows the prediction accuracy, even with the addition of different types of noise. The performance indicators remained almost unchanged, demonstrating that the proposed prediction model has very stable forecast performance across different data sets and effectively eliminates the impact of outliers on prediction accuracy.
7. Conclusions
In this paper, a performance-enhanced random forest intelligent model is proposed for predicting deformation in super-high arch dams. First, the prototype deformation monitoring data were preprocessed using the wavelet de-noising technique. Then, a statistical model for monitoring the deformation field was constructed by considering three main factors: water pressure, temperature, and aging response. The random forest was used as a regression approach to intelligently learn the strong correlation factors between measured dam deformation and its influencing variables. To address the subjectivity of determining the hyper-parameters, an improved salp swarm heuristics algorithm was employed to optimize the model parameters by combining three improvement schemes: elite opposition-based learning strategy, differential strategy, and Gaussian mutation strategy.
To verify the effectiveness of the proposed model, a super-high arch dam was selected as an engineering example. The proposed wavelet de-noising technique was used to illustrate the impact of de-noising processing and the importance of noise reduction, providing a visualization for comparing the accuracy of the predicted model with and without noise reduction. The study demonstrates the capacity of the pre-processing wavelet de-noising technique in reducing the uncertain factors of chaos in the monitoring data. Additionally, the global optimization ability of the improved Salp Swarm Algorithm (ISSA) was investigated by comparing it with the standard Salp Swarm Algorithm (SSA). The study shows that ISSA outperforms SSA in terms of global search capability and prediction accuracy.
Subsequently, the prediction accuracy of the proposed model was compared with the SSA-RF, GWO-RF, ELM, and SR models. The results of the proposed model revealed that the hyperparameter settings of the RF model are a key factor in increasing precision and improving generalization performance. In this study, ISSA was employed to optimize the hyperparameters of random forests, and compared with different meta-heuristic algorithms, such as the standard SSA and GWO algorithms. It was found that the proposed prediction model’s predictive power and convergence capability can be effectively enhanced compared to other standard optimization algorithms.
Furthermore, it is crucial to consider the robustness validation of the proposed prediction model by incorporating four types of noise schemes. For each scheme, the deformation of the dam was analyzed and compared to the original training set without introducing noise. Statistical performance indicators showed that the proposed model can effectively resist the influence of outliers and noise.
In conclusion, the proposed prediction framework can reduce the noise of the raw data and search for the optimal hyper-parameters adaptively, thus increasing the prediction precision. Overall, this framework is capable of adapting to different noise levels and maintaining its predictive power.
Author Contributions
Conceptualization, C.G. and B.W.; methodology, C.G. and B.W.; software, B.W.; validation, B.W. and Y.C.; formal analysis, C.G.; resources, Y.C.; data curation, B.W. and Y.C.; writing—original draft preparation, C.G.; writing—review and editing, B.W. and Y.C.; supervision, C.G. All authors have read and agreed to the published version of the manuscript.
Funding
This research was supported by the National Natural Science Foundation of China (Grant Nos. 51739003, 52079046, U2243223), the Fundamental Research Funds for the Central Universities (B210202017).
Data Availability Statement
Not applicable.
Conflicts of Interest
The authors declare no conflict of interest.
Abbreviations
| WD | Wavelet De-noising |
| RF | Random Forests |
| SSA | Salp Swarm Algorithm |
| ISSA | Improved Salp Swarm Algorithm |
| ANN | Artificial Neural Networks |
| LSTM | Long Short-Term Memory Model |
| SVM | Support Vector Machine |
| PSO | Particle Swarm Optimization |
| GSA | Gravity Search Algorithm |
| GWO | Gray Wolf Optimization |
| R2 | Multiple Correlation Coefficient |
| ME | Maximum Error |
| RMSE | Root Mean Squared Error |
| MAE | Mean Absolute Error |
| MAPE | Mean Absolute Percentage Error |
| ELM | Extreme Learning Machine |
| SR | Stepwise Regression Model |
References
- Wu, Z.R.; Su, H.Z.; Guo, H.Q. Risk assessment method of major unsafe hydroelectric project. Sci. Chin. Ser. E Technol. Sci. 2008, 51, 1345–1352. [Google Scholar] [CrossRef]
- Zhang, J.; Li, Y.; Xuan, G.; Wang, X.; Li, J. Overtopping breaching of cohesive homogeneous earth dam with different cohesive strength. Sci. Chin. Ser. E Technol. Sci. 2009, 52, 3024–3029. [Google Scholar] [CrossRef]
- Longwell, C.R. Lessons from the St. Francis Dam. Science 1928, 68, 36–37. [Google Scholar] [CrossRef]
- Liu, W.M.; Carling, P.A.; Hu, K.H.; Wang, H.; Zhou, Z.; Zhou, L.Q.; Liu, D.Z.; Lai, Z.P.; Zhang, X.B. Outburst floods in China: A review. Earth-Sci. Rev. 2019, 197, 14. [Google Scholar] [CrossRef]
- Hervouet, J.M.; Petitjean, A. Malpasset dam-break revisited with two-dimensional computations. J. Hydraul. Res. 1999, 37, 777–788. [Google Scholar] [CrossRef]
- Zhong, D.H.; Sun, Y.F.; Li, M.C. Dam break threshold value and risk probability assessment for an earth dam. Nat. Hazards 2011, 59, 129–147. [Google Scholar] [CrossRef]
- Su, H.Z.; Li, X.; Yang, B.B.; Wen, Z.P. Wavelet support vector machine-based prediction model of dam deformation. Mech. Syst. Signal Proc. 2018, 110, 412–427. [Google Scholar] [CrossRef]
- Ribas, J.R.; Severo, J.C.R.; Guimaraes, L.F.; Perpetuo, K.P.C. A fuzzy FMEA assessment of hydroelectric earth dam failure modes: A case study in Central Brazil. Energy Rep. 2021, 7, 4412–4424. [Google Scholar] [CrossRef]
- Prakash, G.; Sadhu, A.; Narasimhan, S.; Brehe, J.M. Initial service life data towards structural health monitoring of a concrete arch dam. Struct. Control Health Monit. 2018, 25, e2036. [Google Scholar] [CrossRef]
- Wei, B.W.; Yuan, D.Y.; Xu, Z.K.; Li, L.H. Modified hybrid forecast model considering chaotic residual errors for dam deformation. Struct. Control Health Monit. 2018, 25, 16. [Google Scholar] [CrossRef]
- Mostafapour, A.; Davoodi, S. Acoustic emission source locating in two-layer plate using wavelet packet decomposition and wavelet-based optimized residual complexity. Struct. Control Health Monit. 2018, 25, 12. [Google Scholar] [CrossRef]
- Qiu, H.; Lee, J.; Lin, J.; Yu, G. Wavelet filter-based weak signature detection method and its application on rolling element bearing prognostics. J. Sound Vib. 2006, 289, 1066–1090. [Google Scholar] [CrossRef]
- Sendur, L.; Selesnick, I.W. Bivariate shrinkage functions for wavelet-based denoising exploiting interscale dependency. IEEE Trans. Signal Process. 2002, 50, 2744–2756. [Google Scholar] [CrossRef] [Green Version]
- Gao, H.Y. Wavelet shrinkage denoising using the non-negative garrote. J. Comput. Graph. Stat. 1998, 7, 469–488. [Google Scholar]
- Zaminpardaz, S.; Teunissen, P.J.G.; Tiberius, C. A risk evaluation method for deformation monitoring systems. J. Geod. 2020, 94, 15. [Google Scholar] [CrossRef] [Green Version]
- Ma, C.H.; Yang, J.; Cheng, L.; Ran, L. Research on slope reliability analysis using multi-kernel relevance vector machine and advanced first-order second-moment method. Eng. Comput. 2022, 38, 3057–3068. [Google Scholar] [CrossRef]
- Li, Y.; Chen, W. Landslide Susceptibility Evaluation Using Hybrid Integration of Evidential Belief Function and Machine Learning Techniques. Water 2020, 12, 113. [Google Scholar] [CrossRef] [Green Version]
- Bui, D.T.; Khosravi, K.; Li, S.J.; Shahabi, H.; Panahi, M.; Singh, V.P.; Chapi, K.; Shirzadi, A.; Panahi, S.; Chen, W.; et al. New Hybrids of ANFIS with Several Optimization Algorithms for Flood Susceptibility Modeling. Water 2018, 10, 1210. [Google Scholar] [CrossRef] [Green Version]
- Hu, Y.T.; Gu, C.S.; Meng, Z.Z.; Shao, C.F.; Min, Z.Z. Prediction for the Settlement of Concrete Face Rockfill Dams Using Optimized LSTM Model via Correlated Monitoring Data. Water 2022, 14, 2157. [Google Scholar] [CrossRef]
- Chen, Y.J.; Gu, C.S.; Shao, C.F.; Gu, H.; Zheng, D.J.; Wu, Z.R.; Fu, X. An Approach Using Adaptive Weighted Least Squares Support Vector Machines Coupled with Modified Ant Lion Optimizer for Dam Deformation Prediction. Math. Probl. Eng. 2020, 2020, 23. [Google Scholar] [CrossRef]
- Najafzadeh, M.; Niazmardi, S. A Novel Multiple-Kernel Support Vector Regression Algorithm for Estimation of Water Quality Parameters. Nat. Resour. Res. 2021, 30, 3761–3775. [Google Scholar] [CrossRef]
- Kang, F.; Liu, X.; Li, J.J. Temperature effect modeling in structural health monitoring of concrete dams using kernel extreme learning machines. Struct. Health Monit. 2020, 19, 987–1002. [Google Scholar] [CrossRef]
- Rodriguez-Galiano, V.F.; Ghimire, B.; Rogan, J.; Chica-Olmo, M.; Rigol-Sanchez, J.P. An assessment of the effectiveness of a random forest classifier for land-cover classification. ISPRS J. Photogramm. Remote Sens. 2012, 67, 93–104. [Google Scholar] [CrossRef]
- Liu, Y.R.; Wang, L.; Li, M. Kalman filter-random forest-based method of dynamic load identification for structures with interval uncertainties. Struct. Control Health Monit. 2022, 29, 25. [Google Scholar] [CrossRef]
- Chen, X.; Ishwaran, H. Random forests for genomic data analysis. Genomics 2012, 99, 323–329. [Google Scholar] [CrossRef] [Green Version]
- Tesfamariam, S.; Liu, Z. Earthquake induced damage classification for reinforced concrete buildings. Struct. Saf. 2010, 32, 154–164. [Google Scholar] [CrossRef]
- Dai, B.; Gu, C.S.; Zhao, E.F.; Qin, X.N. Statistical model optimized random forest regression model for concrete dam deformation monitoring. Struct. Control Health Monit. 2018, 25, 15. [Google Scholar] [CrossRef]
- Li, X.; Wen, Z.P.; Su, H.Z. An approach using random forest intelligent algorithm to construct a monitoring model for dam safety. Eng. Comput. 2021, 37, 39–56. [Google Scholar] [CrossRef]
- Probst, P.; Wright, M.N.; Boulesteix, A.L. Hyperparameters and tuning strategies for random forest. Wiley Interdiscip. Rev.-Data Min. Knowl. Discov. 2019, 9, e1301. [Google Scholar] [CrossRef] [Green Version]
- Wei, B.W.; Liu, B.; Yuan, D.Y.; Mao, Y.; Yao, S.Y. Spatiotemporal hybrid model for concrete arch dam deformation monitoring considering chaotic effect of residual series. Eng. Struct. 2021, 228, 111488. [Google Scholar] [CrossRef]
- Khatibinia, M.; Khosravi, S. A hybrid approach based on an improved gravitational search algorithm and orthogonal crossover for optimal shape design of concrete gravity dams. Appl. Soft. Comput. 2014, 16, 223–233. [Google Scholar] [CrossRef]
- Li, M.J.; Pan, J.Y.; Liu, Y.L.; Wang, Y.Z.; Zhang, W.C.; Wang, J.X. Dam deformation forecasting using SVM-DEGWO algorithm based on phase space reconstruction. PLoS ONE 2022, 17, e0267434. [Google Scholar] [CrossRef] [PubMed]
- Mirjalili, S.; Gandomi, A.H.; Mirjalili, S.Z.; Saremi, S.; Faris, H.; Mirjalili, S.M. Salp Swarm Algorithm: A bio-inspired optimizer for engineering design problems. Adv. Eng. Softw. 2017, 114, 163–191. [Google Scholar] [CrossRef]
- Faris, H.; Mafarja, M.M.; Heidari, A.A.; Aljarah, I.; Al-Zoubi, A.M.; Mirjalili, S.; Fujita, H. An efficient binary Salp Swarm Algorithm with crossover scheme for feature selection problems. Knowl.-Based Syst. 2018, 154, 43–67. [Google Scholar] [CrossRef]
- Sayed, G.I.; Khoriba, G.; Haggag, M.H. A novel chaotic salp swarm algorithm for global optimization and feature selection. Appl. Intell. 2018, 48, 3462–3481. [Google Scholar] [CrossRef]
- Wang, S.; Ding, L.; Xie, C.; Guo, Z.; Hu, Y. A Hybrid Differential Evolution with Elite Opposition-Based Learning. J. Wuhan Univ. Nat. Sci. Ed. 2013, 59, 111–116. [Google Scholar]
- Li, C.S.; Zhang, N.; Lai, X.J.; Zhou, J.Z.; Xu, Y.H. Design of a fractional-order PID controller for a pumped storage unit using a gravitational search algorithm based on the Cauchy and Gaussian mutation. Inf. Sci. 2017, 396, 162–181. [Google Scholar] [CrossRef]
- Torrence, C.; Compo, G.P. A practical guide to wavelet analysis. Bull. Am. Meteorol. Soc. 1998, 79, 61–78. [Google Scholar] [CrossRef]
- Wang, M.; Wang, Y.; Ji, Z. Permanent Magnet Synchronous Motor Multi-parameter Identification Based on Improved Salp Swarm Algorithm. J. Syst. Simul. 2018, 30, 4284. [Google Scholar]
- Gu, Y.; Zheng, D.; Guo, H.; He, X. Regression analysis of 3D initial geostress field for dam site of Xiaowan Hydropower Station. Rock Soil Mech. 2008, 29, 1015. [Google Scholar]
- Mirjalili, S.; Mirjalili, S.M.; Lewis, A. Grey Wolf Optimizer. Adv. Eng. Softw. 2014, 69, 46–61. [Google Scholar] [CrossRef] [Green Version]
- Huang, G.B.; Zhou, H.M.; Ding, X.J.; Zhang, R. Extreme Learning Machine for Regression and Multiclass Classification. IEEE Trans. Syst. Man Cybern. B-Cybern. 2012, 42, 513–529. [Google Scholar] [CrossRef] [PubMed] [Green Version]
Figure 1.
Schematic diagram of water components , , for an arch dam.

Figure 2.
Random forest model establishment process.

Figure 3.
Individual salp and swam of salps.
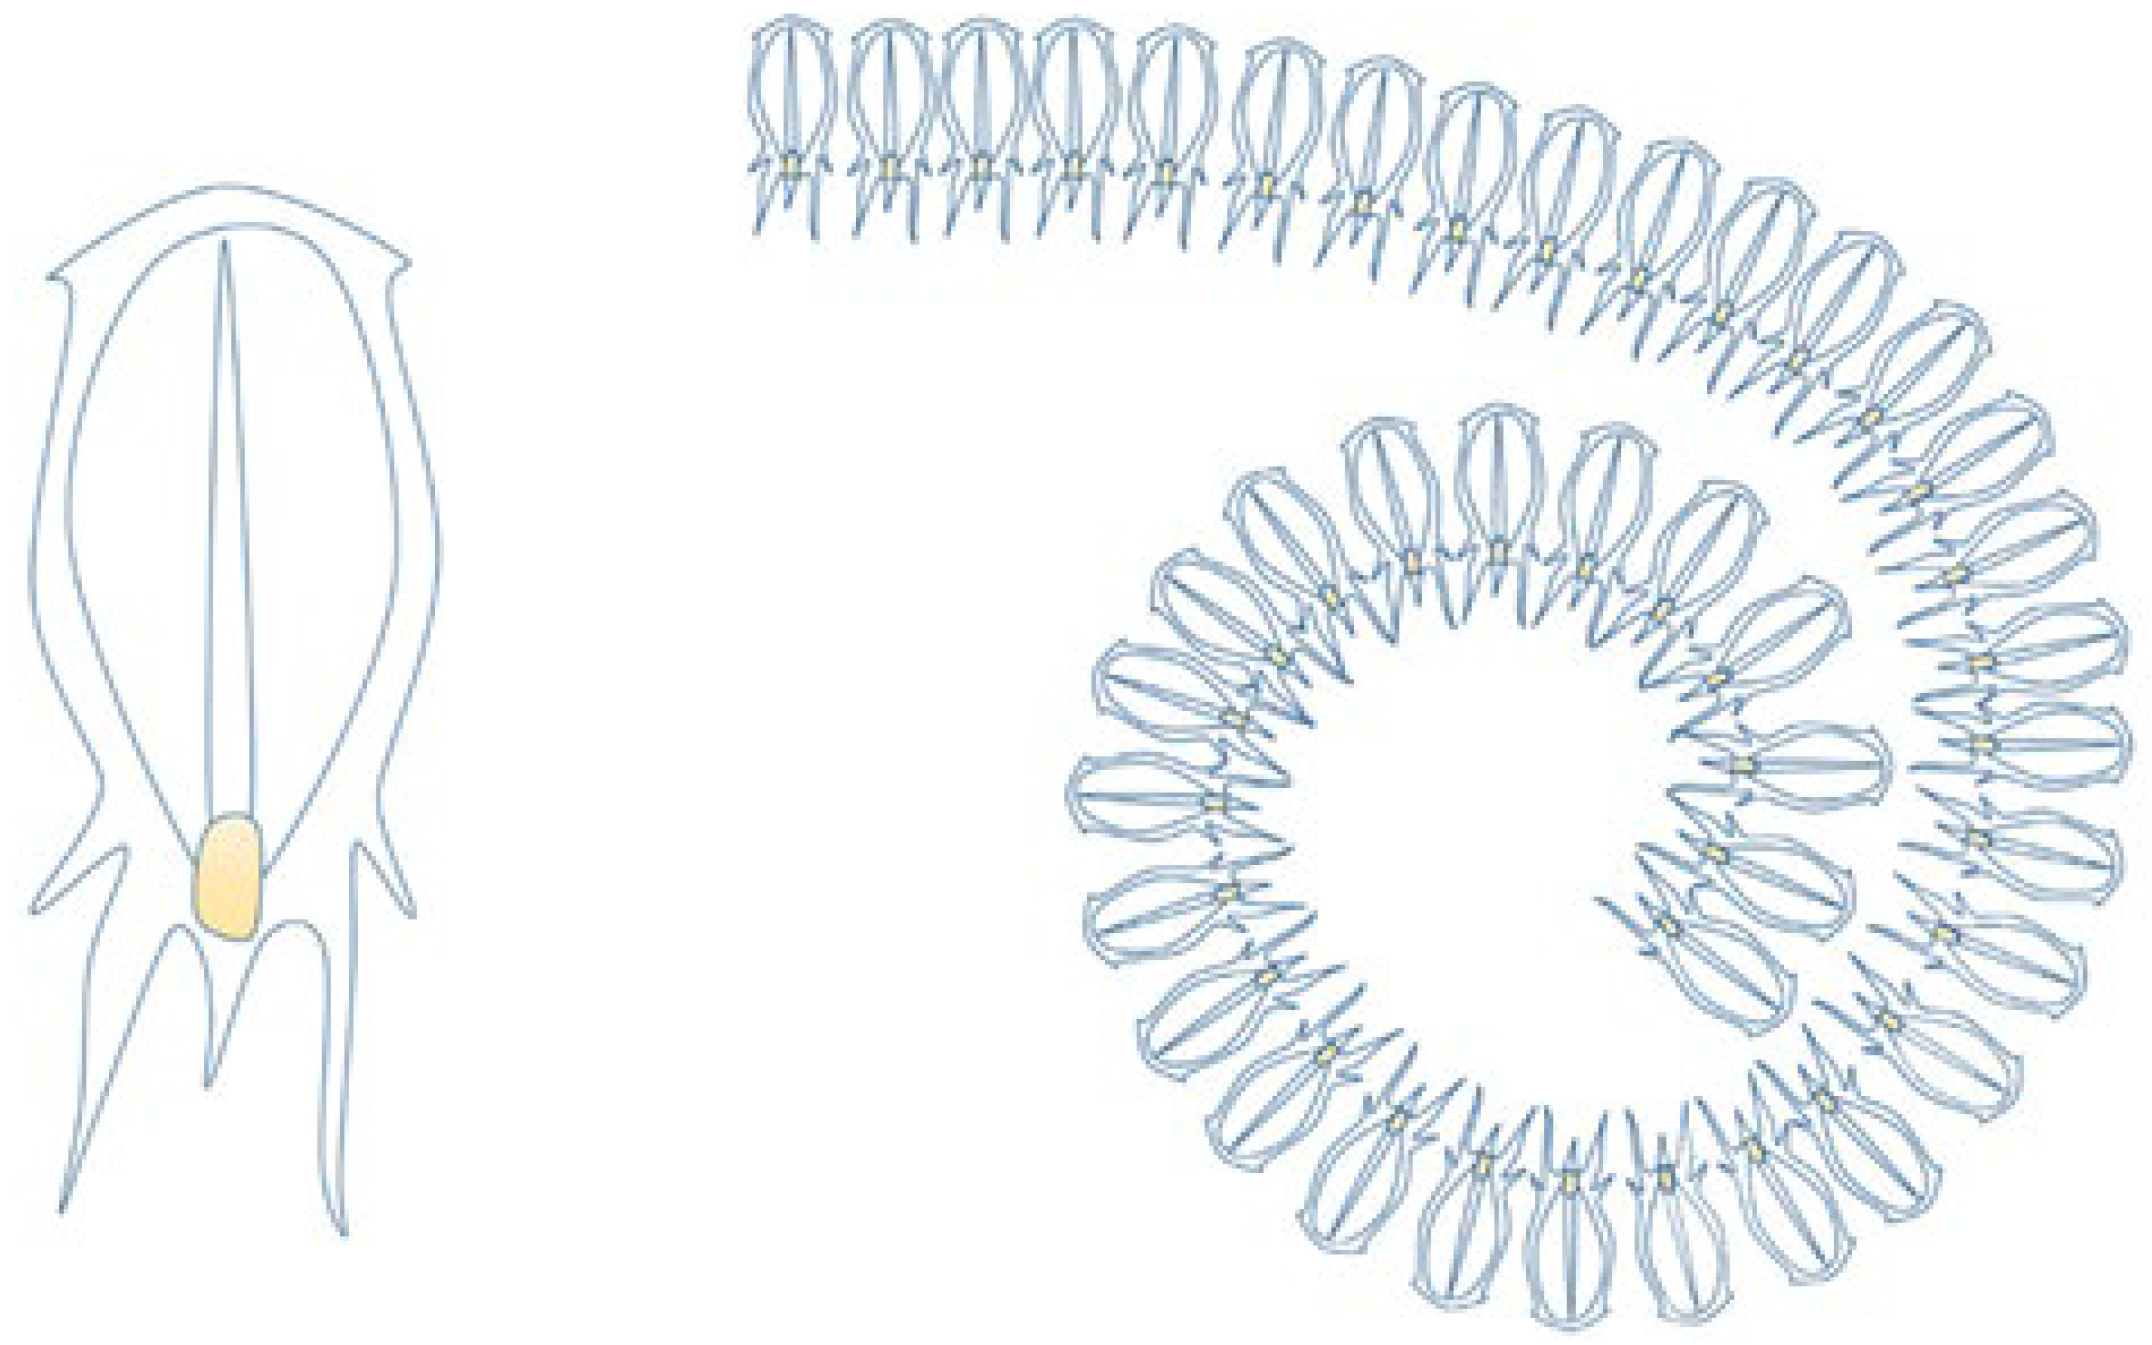
Figure 4.
Construction process of the proposed dam deformation prediction model.
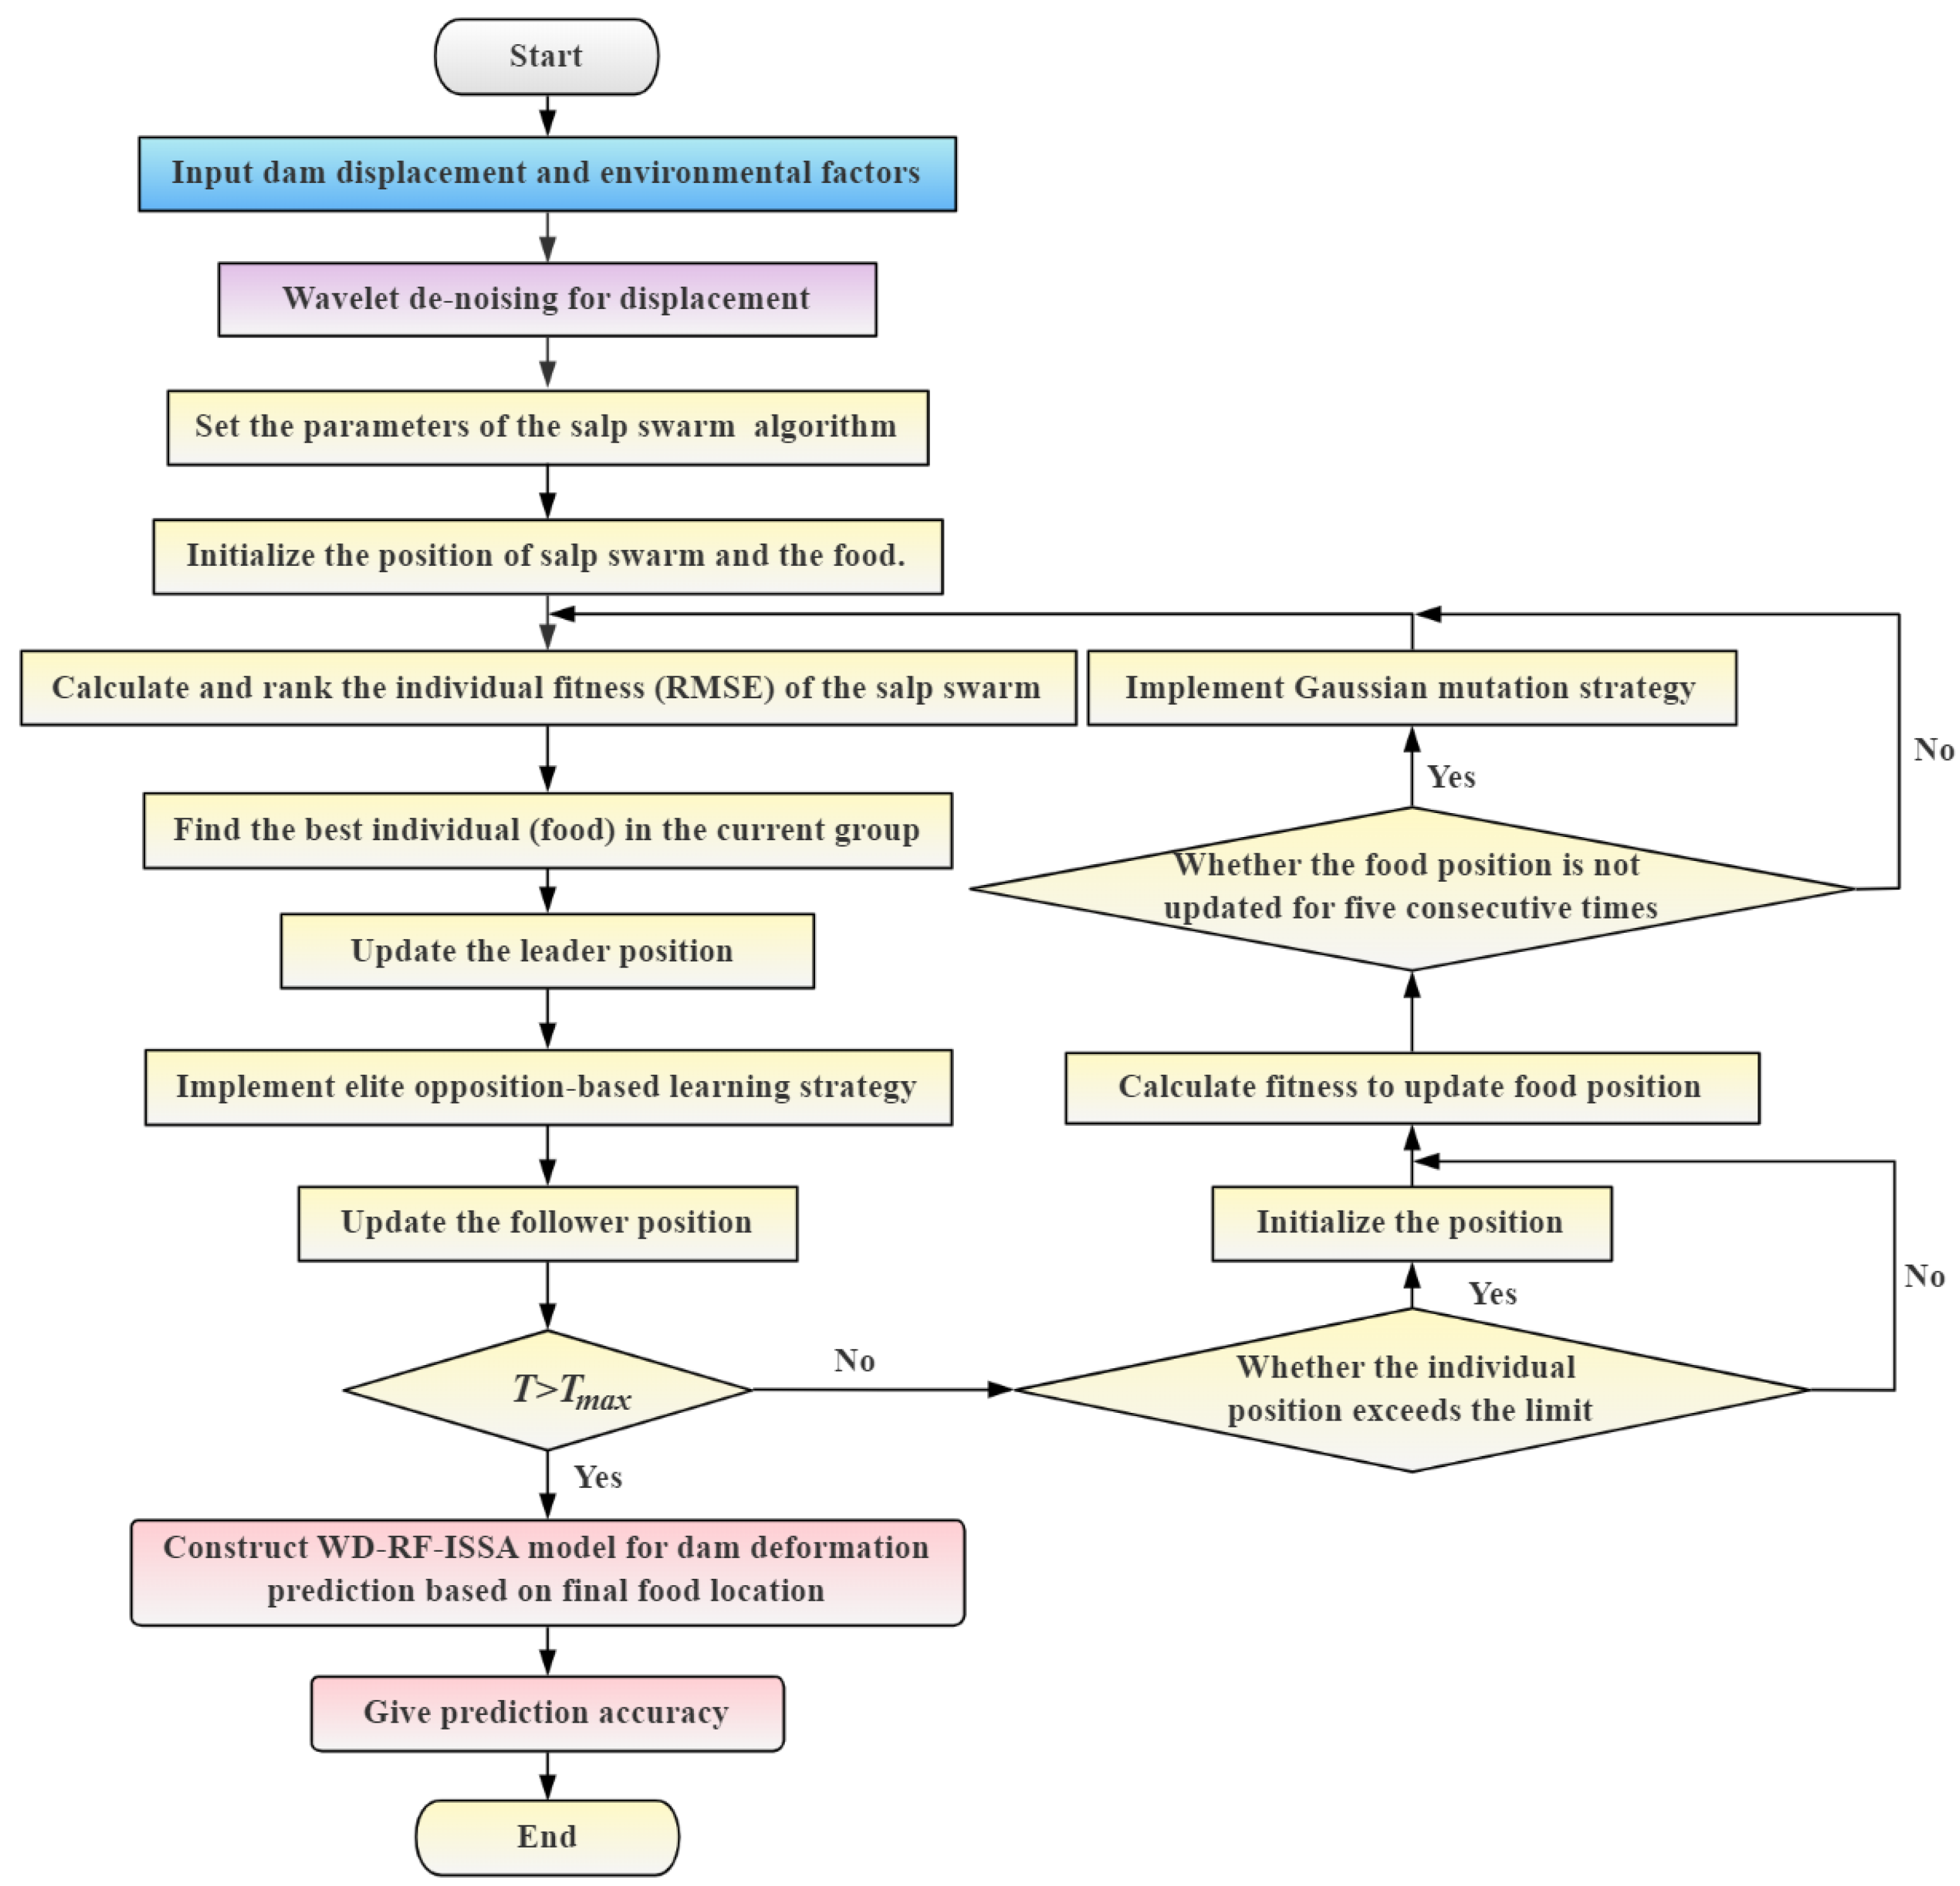
Figure 5.
Airscape of Xiaowan Arch Dam.
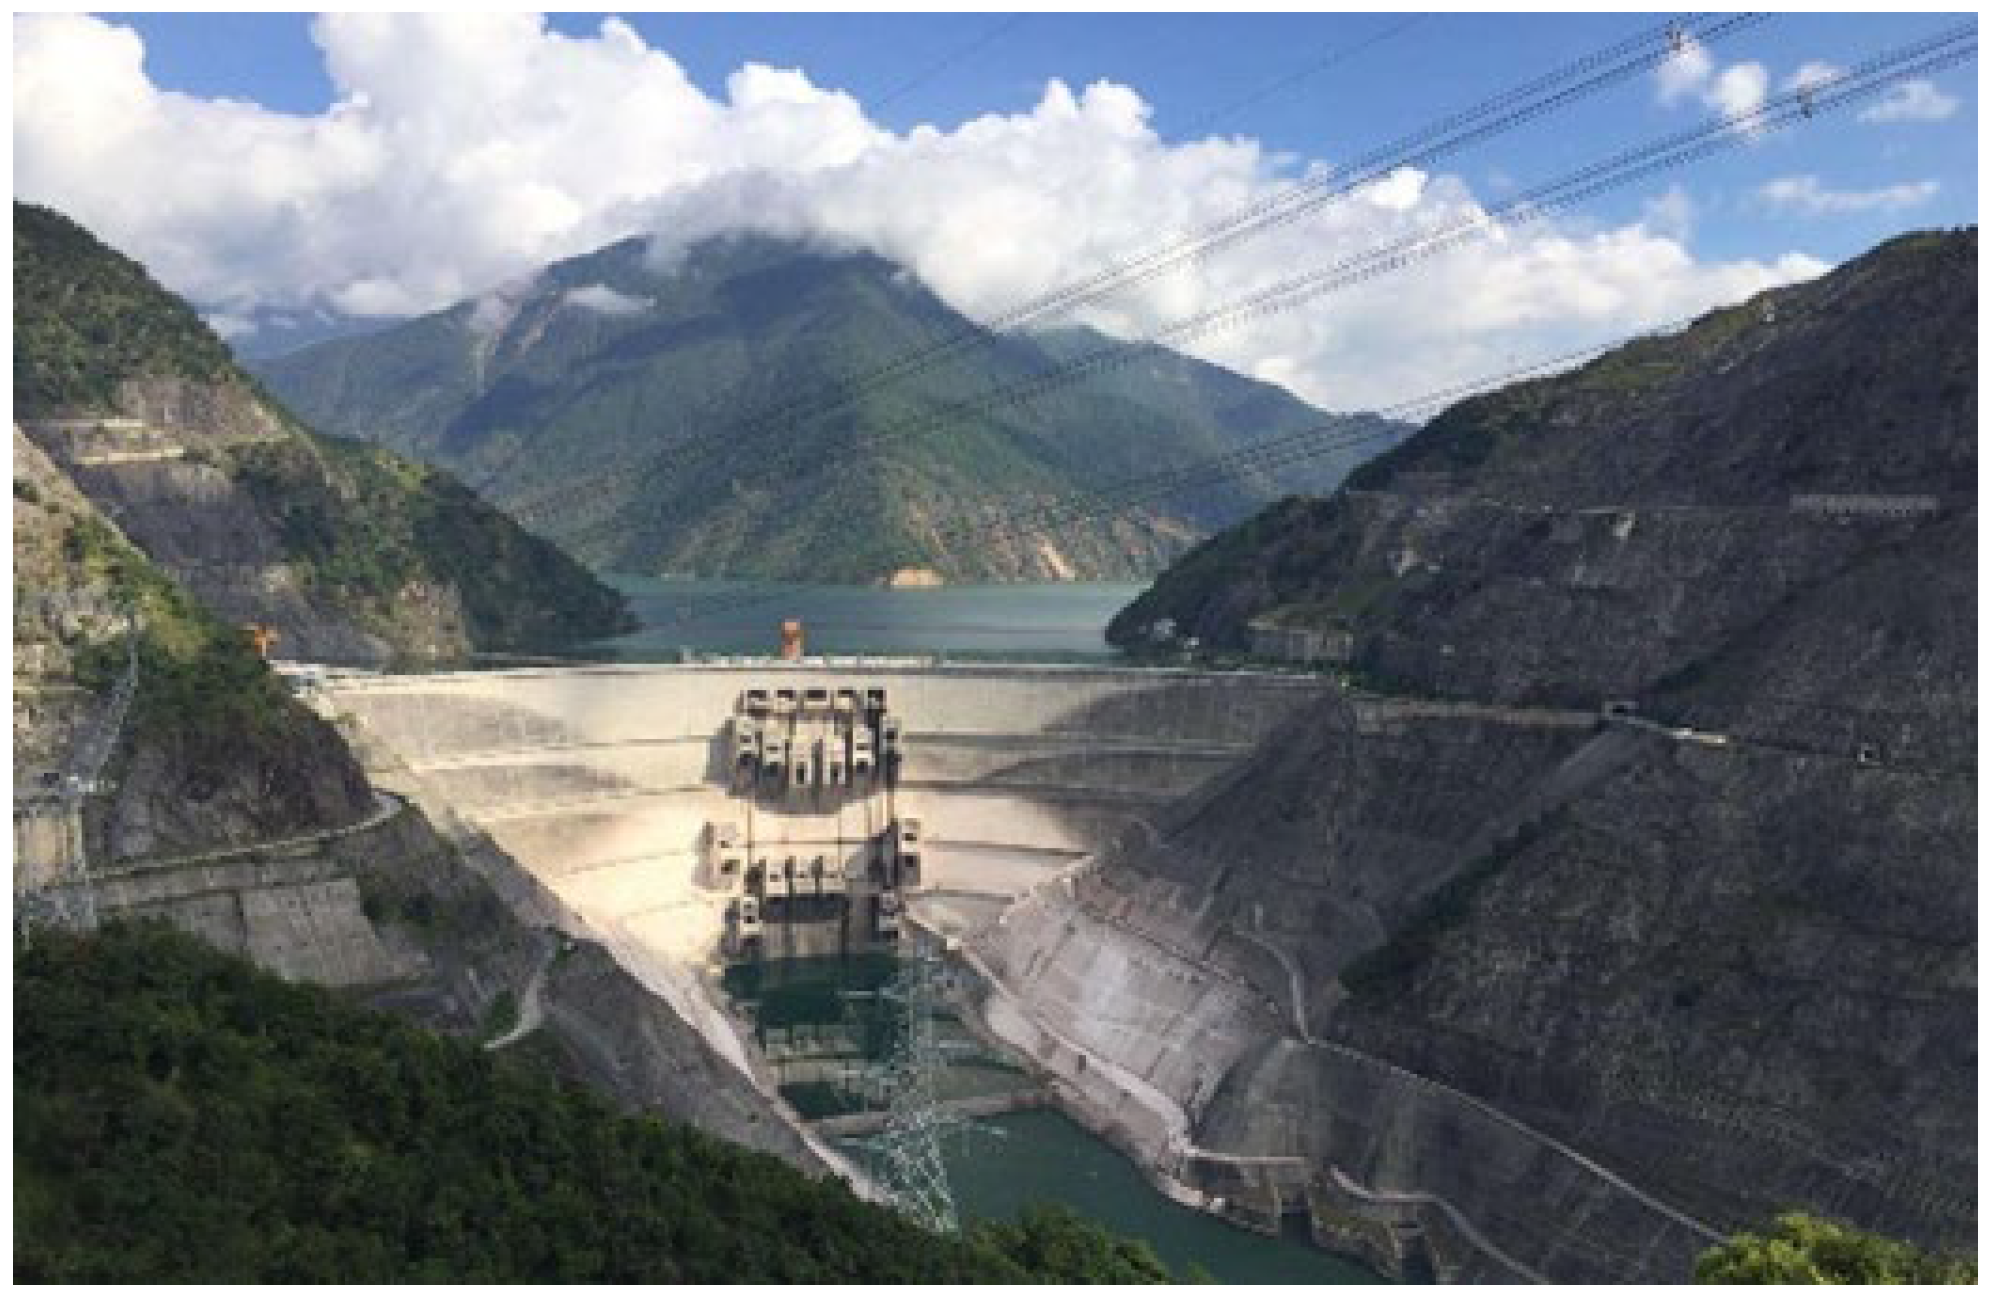
Figure 6.
Layout of pendulum monitoring instruments.
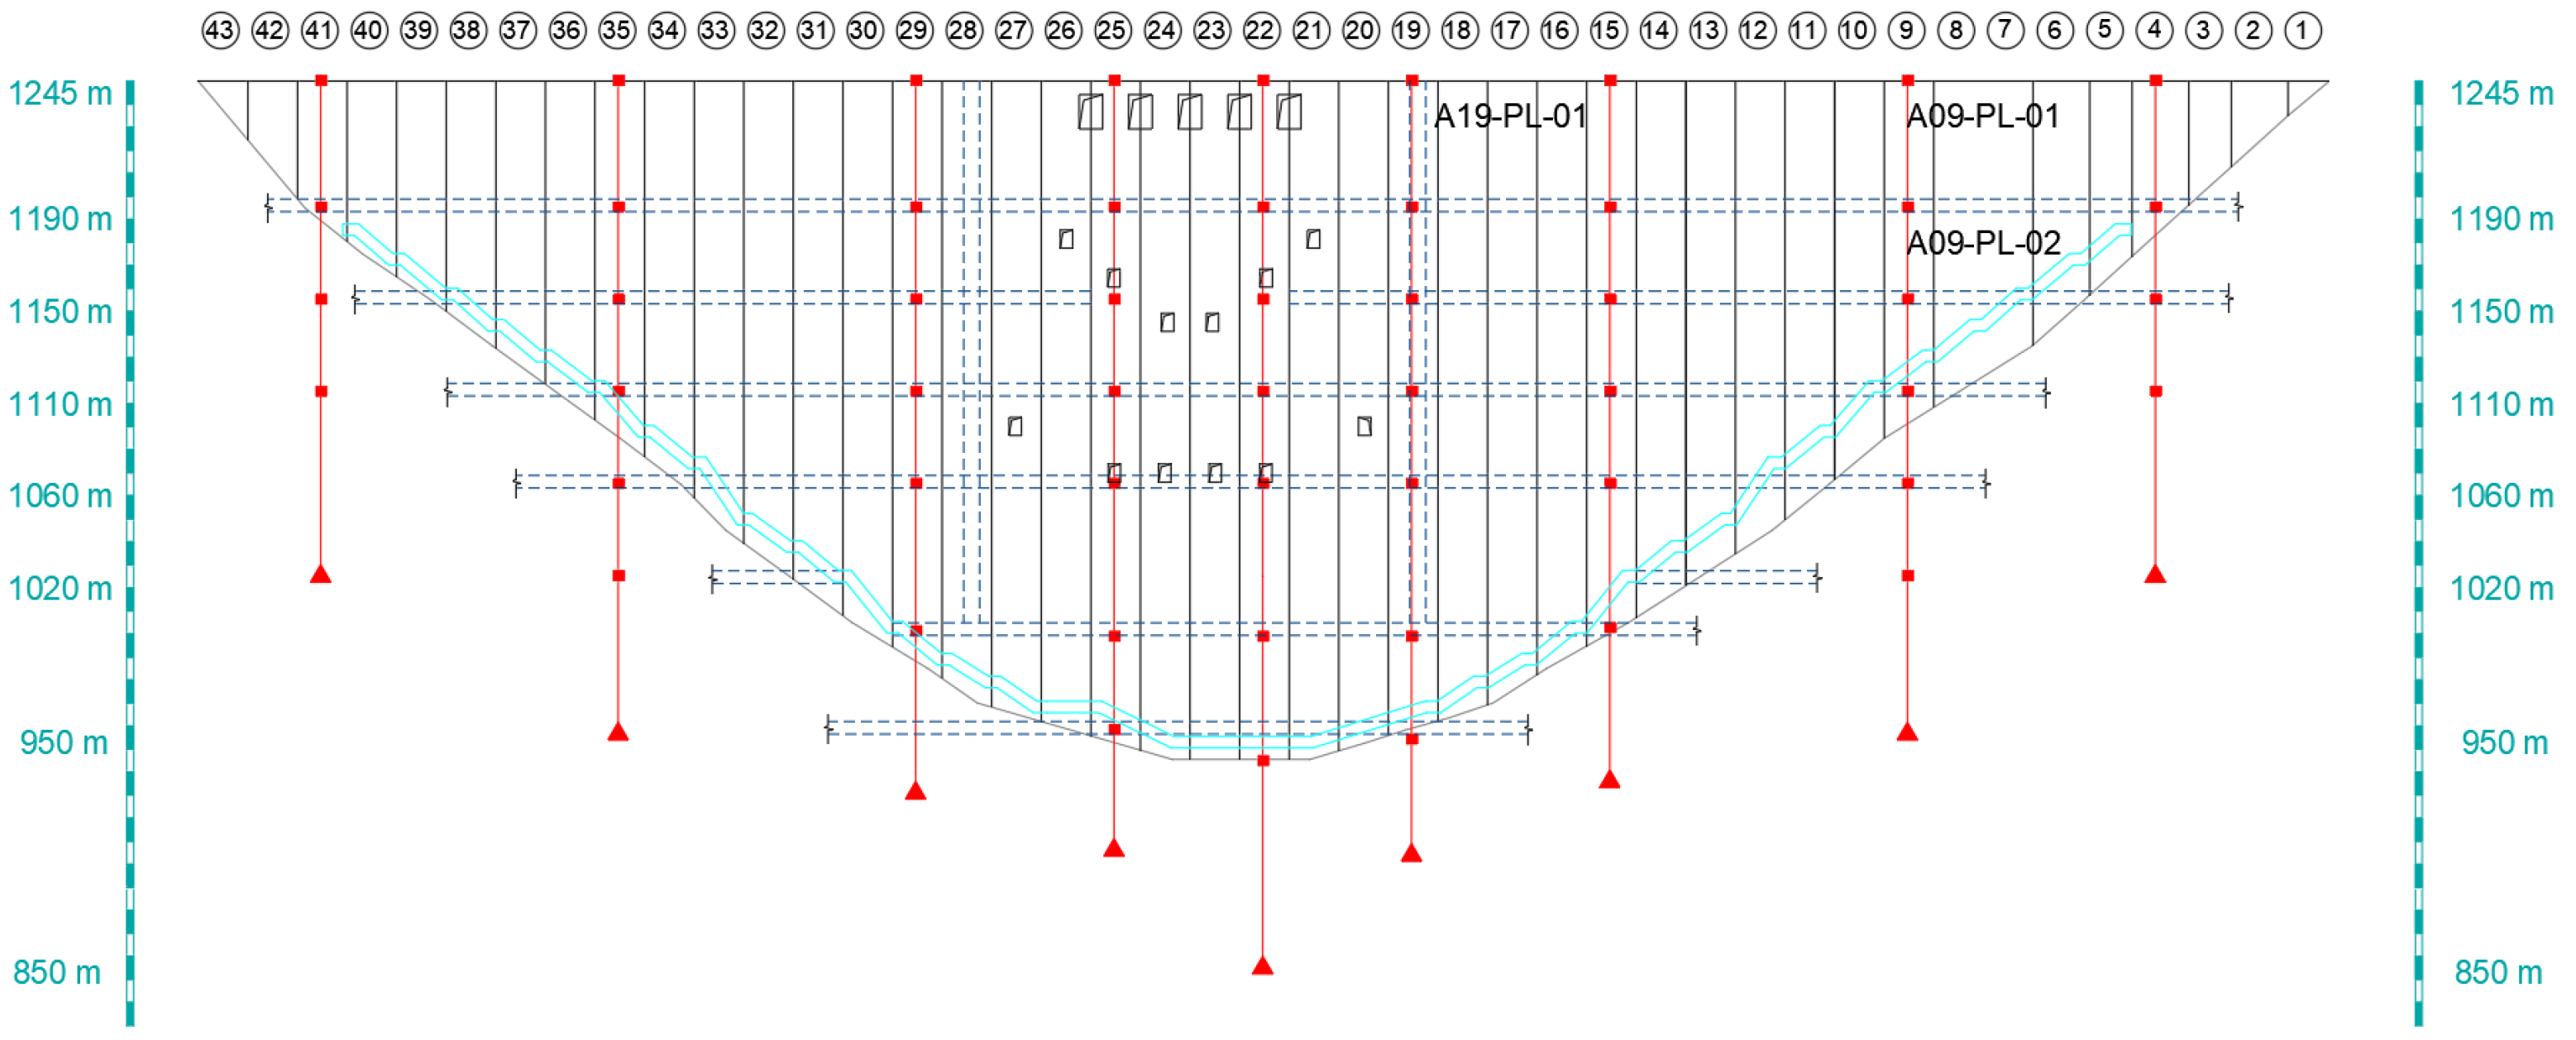
Figure 7.
Evolution of the water level and the horizontal displacement at three measuring points.

Figure 8.
The displacement and residual error plot with Savitzky-Golay de-noising or wavelet de-noising on A09-PL-01.
Figure 8.
The displacement and residual error plot with Savitzky-Golay de-noising or wavelet de-noising on A09-PL-01.

Figure 9.
3D-trajectory of SSA (left column) and ISSA (right column) when optimizing the three measuring points.
Figure 9.
3D-trajectory of SSA (left column) and ISSA (right column) when optimizing the three measuring points.
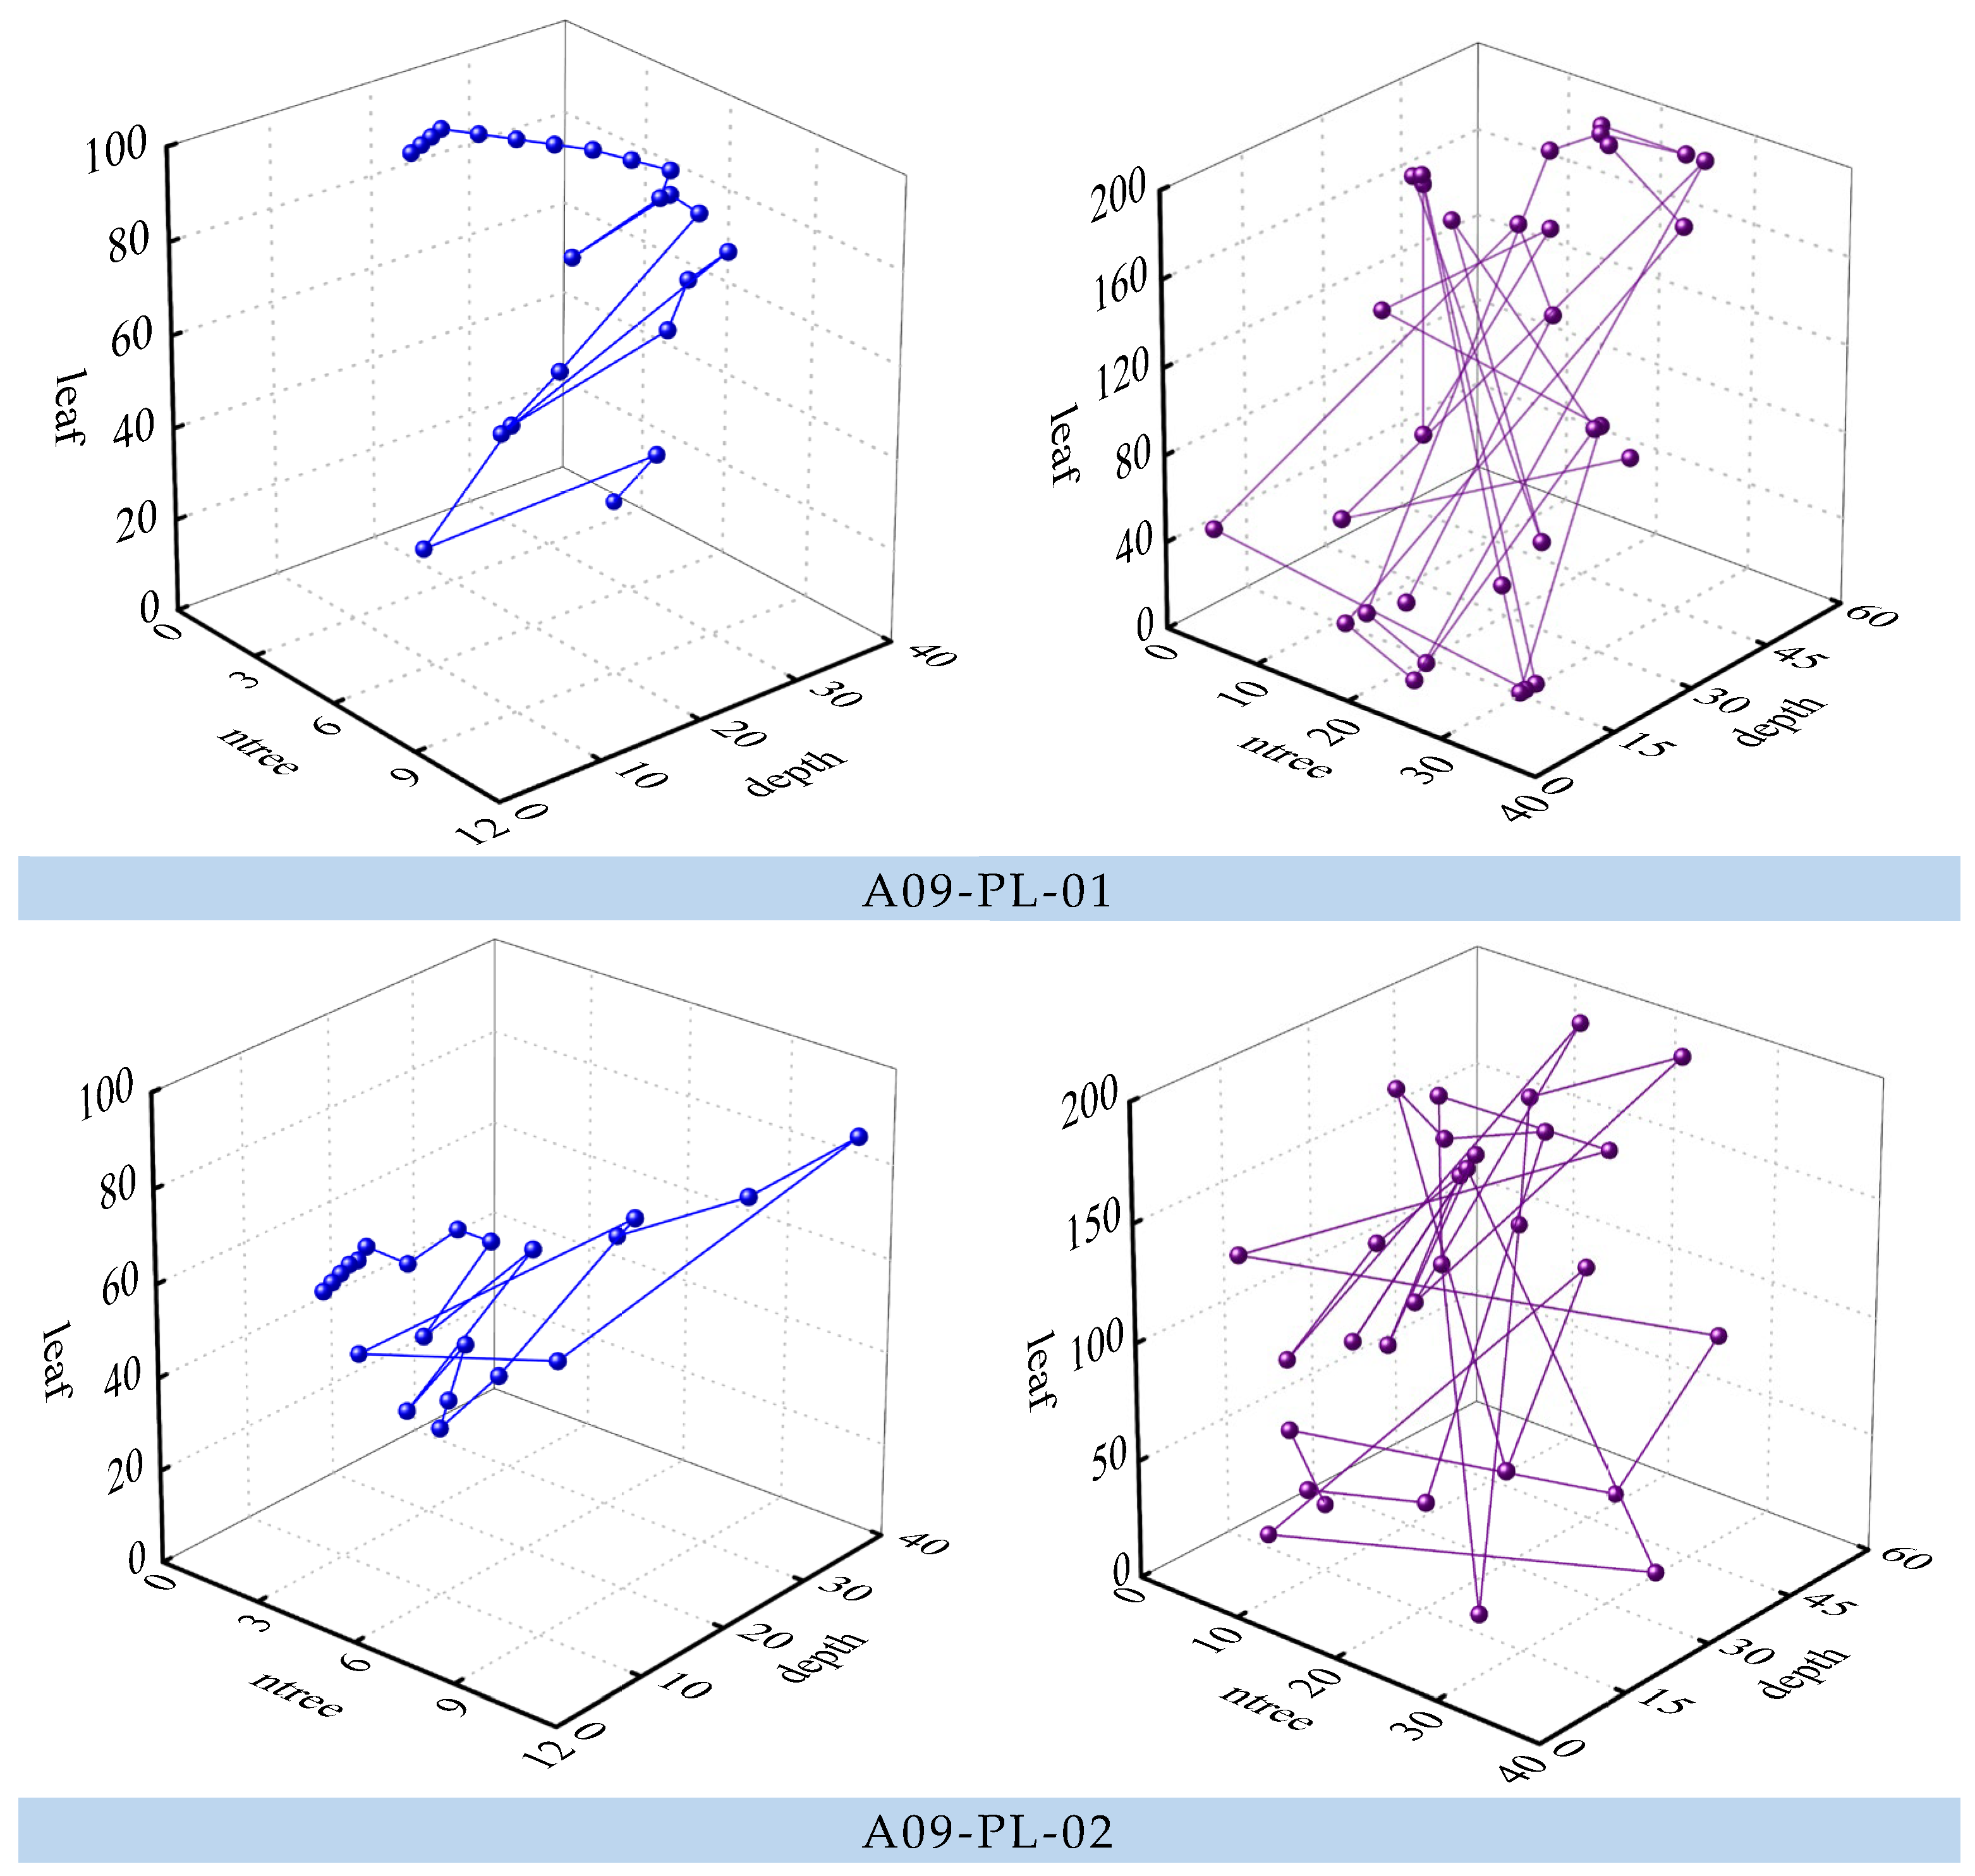
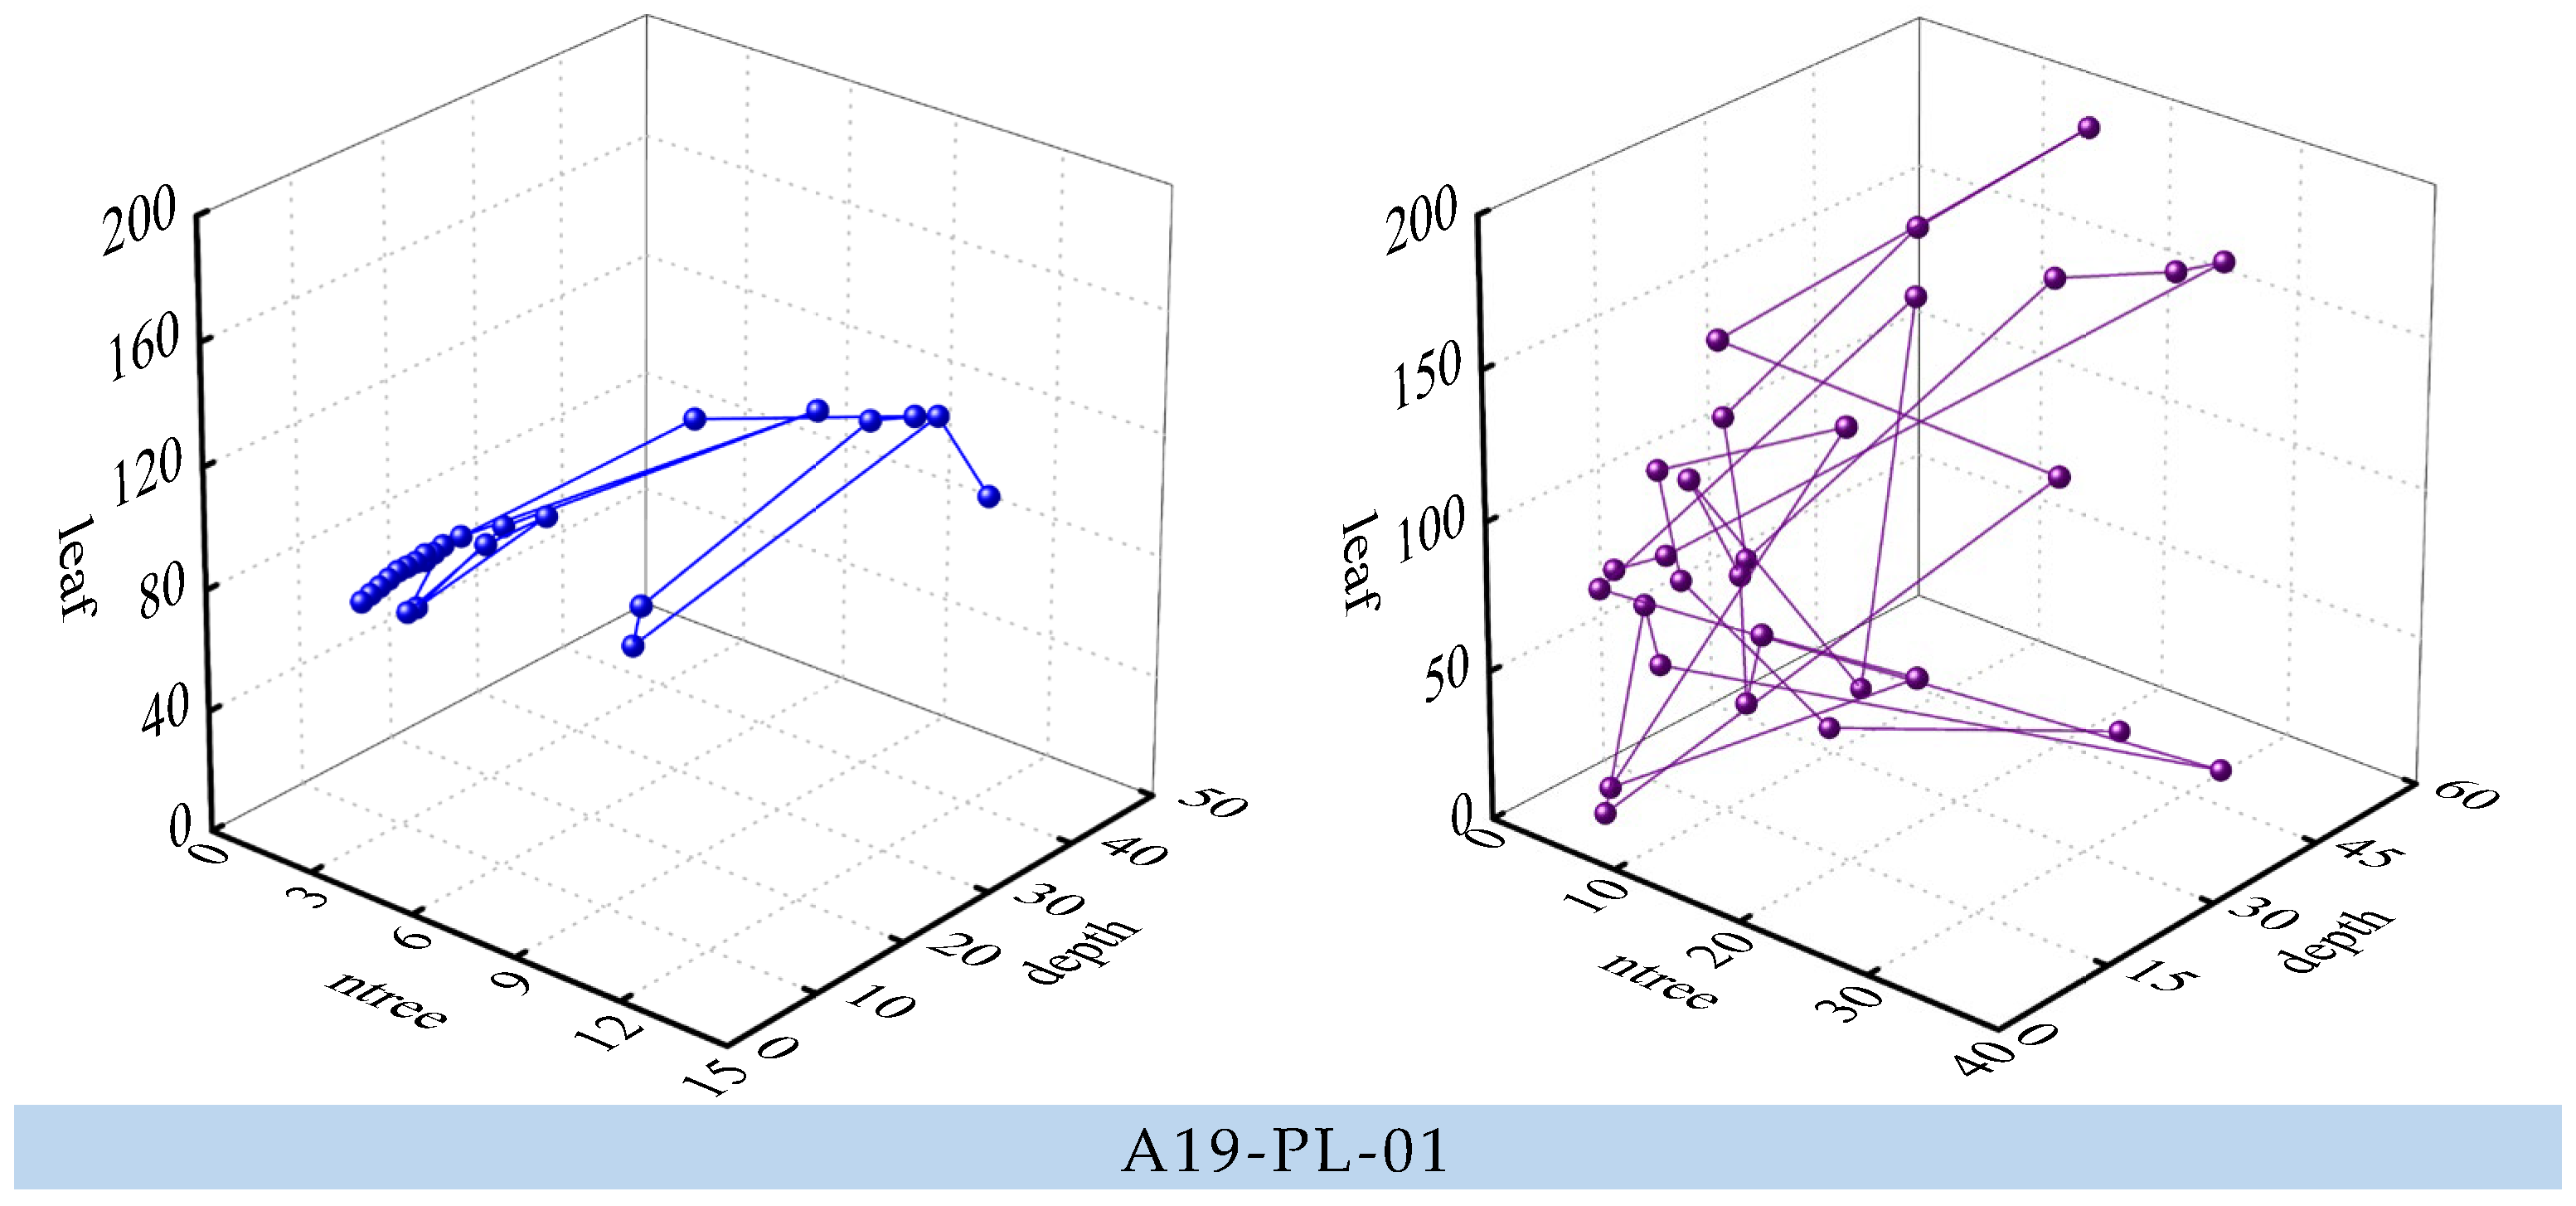
Figure 10.
The predicted displacements and residuals of the six different prediction models for three monitoring points. (a) A09-PL-01. (b) A09-PL-02. (c) A19-PL-01.
Figure 10.
The predicted displacements and residuals of the six different prediction models for three monitoring points. (a) A09-PL-01. (b) A09-PL-02. (c) A19-PL-01.
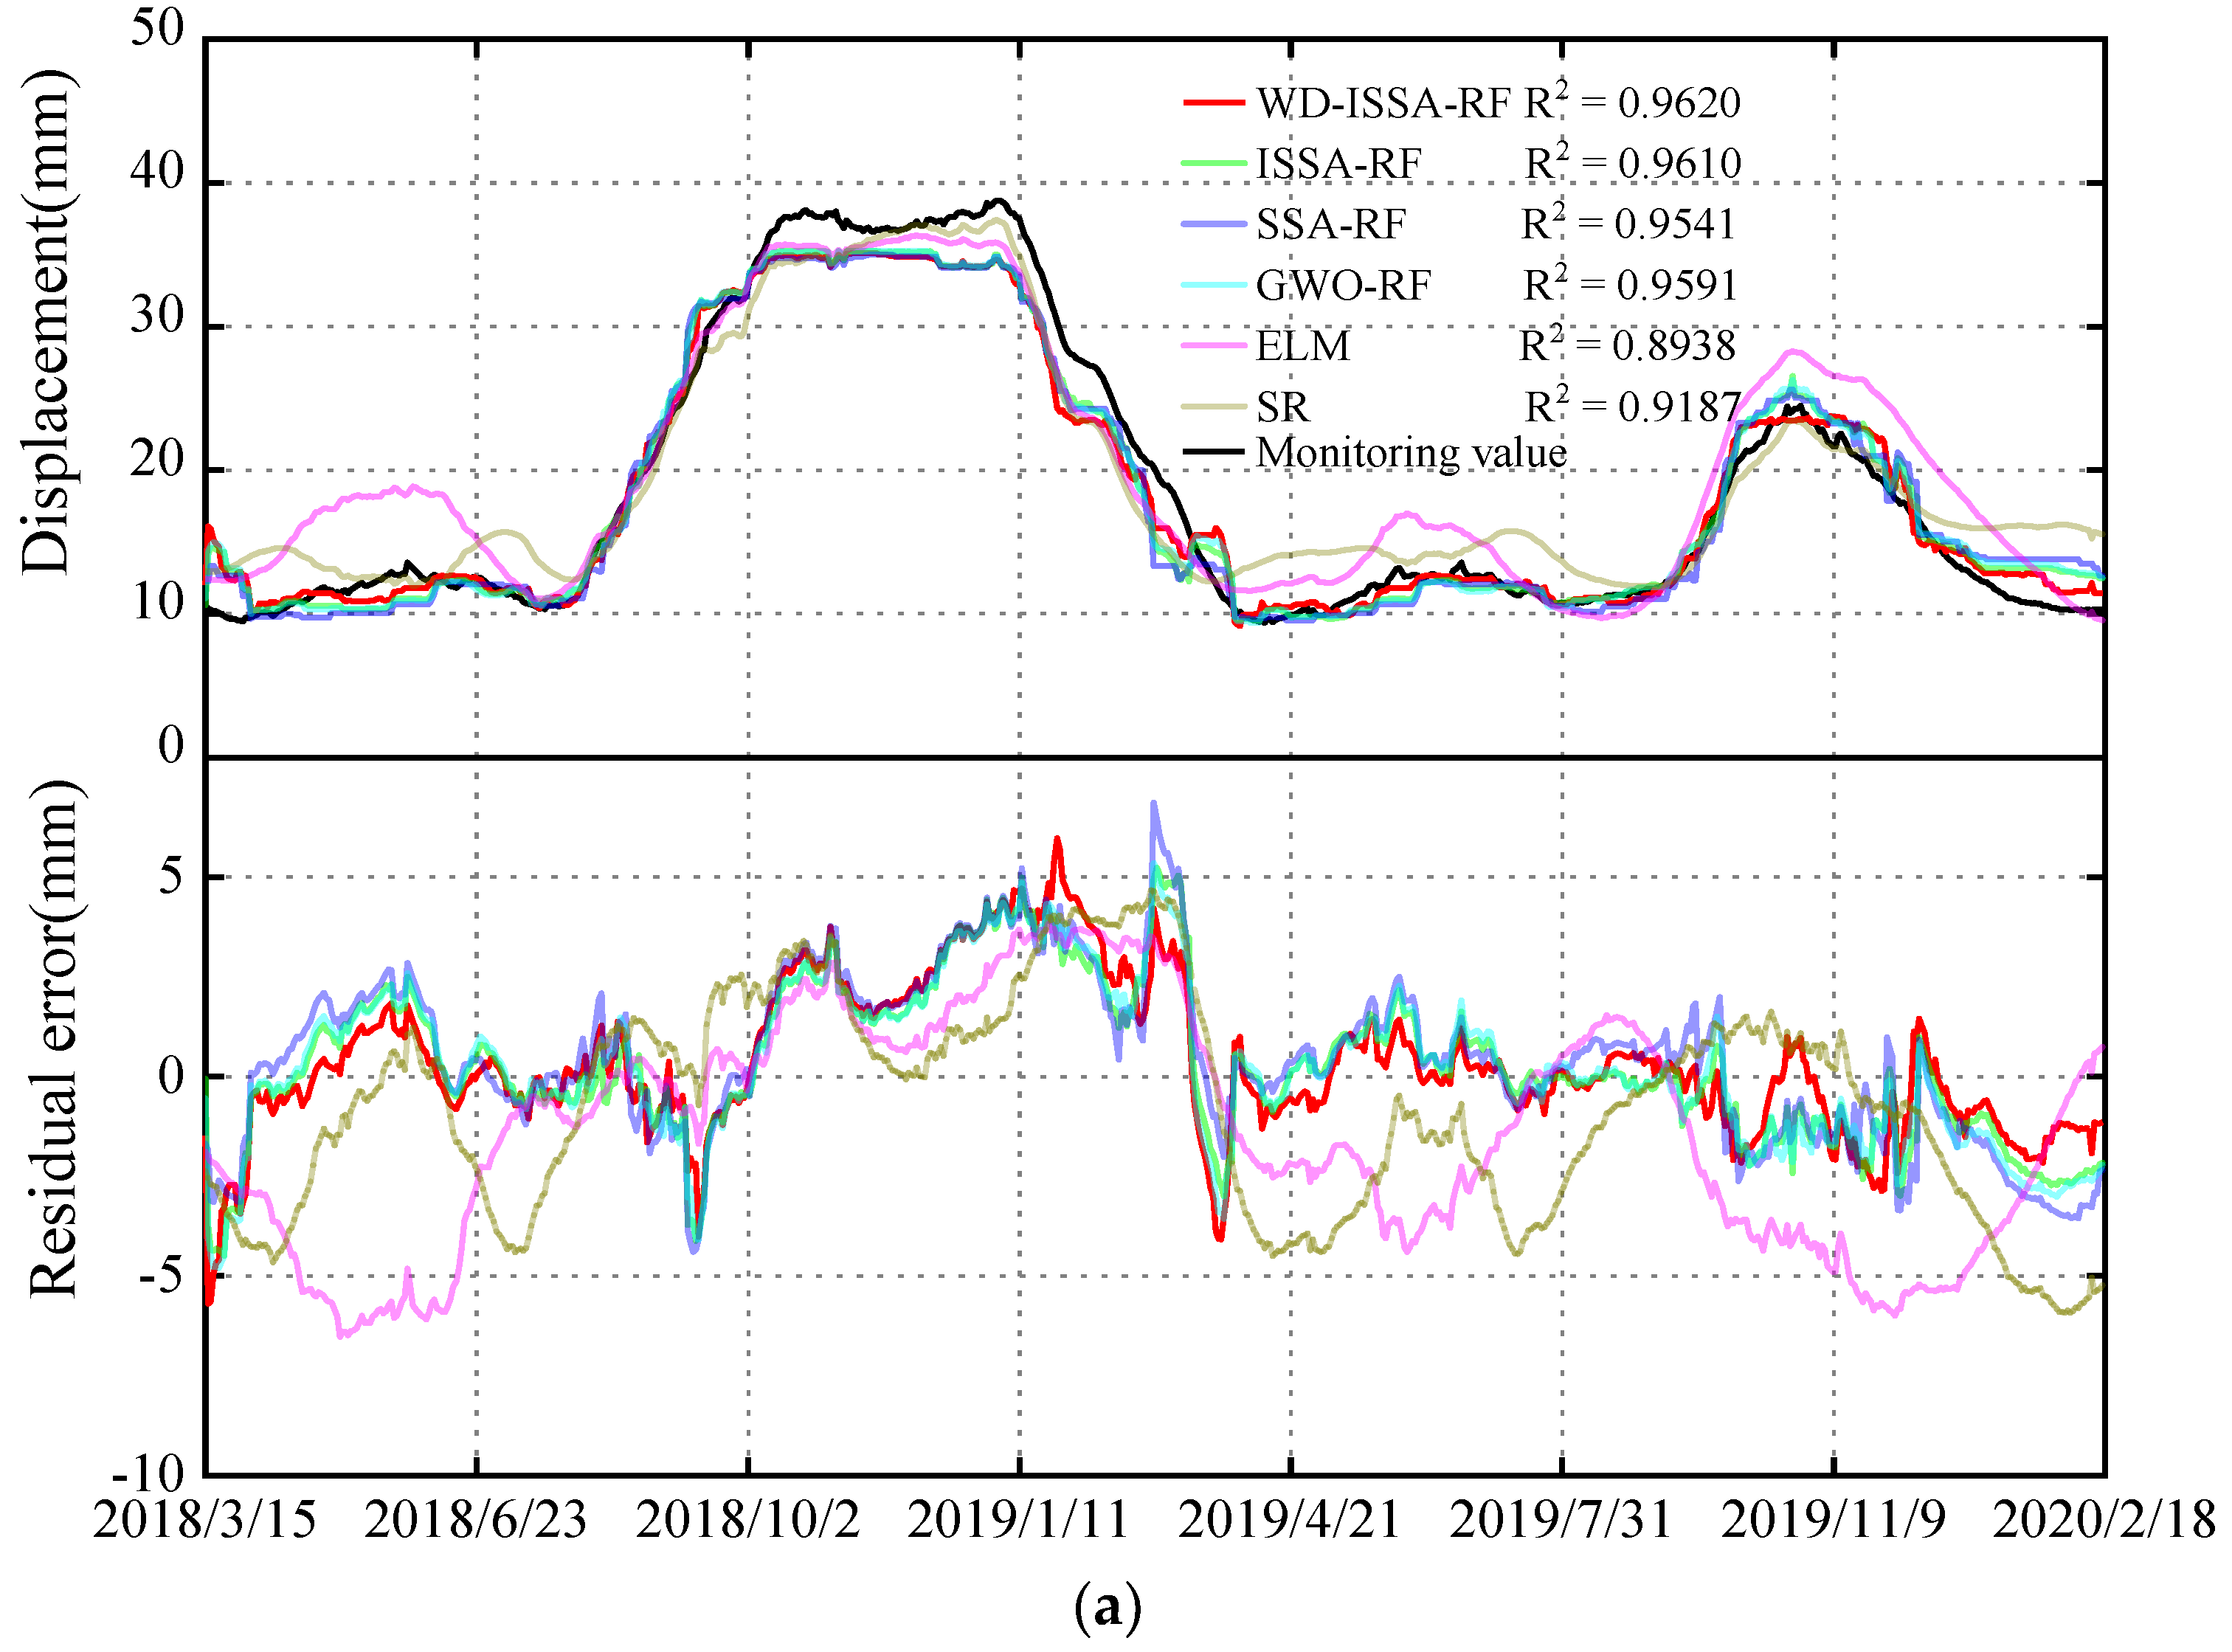
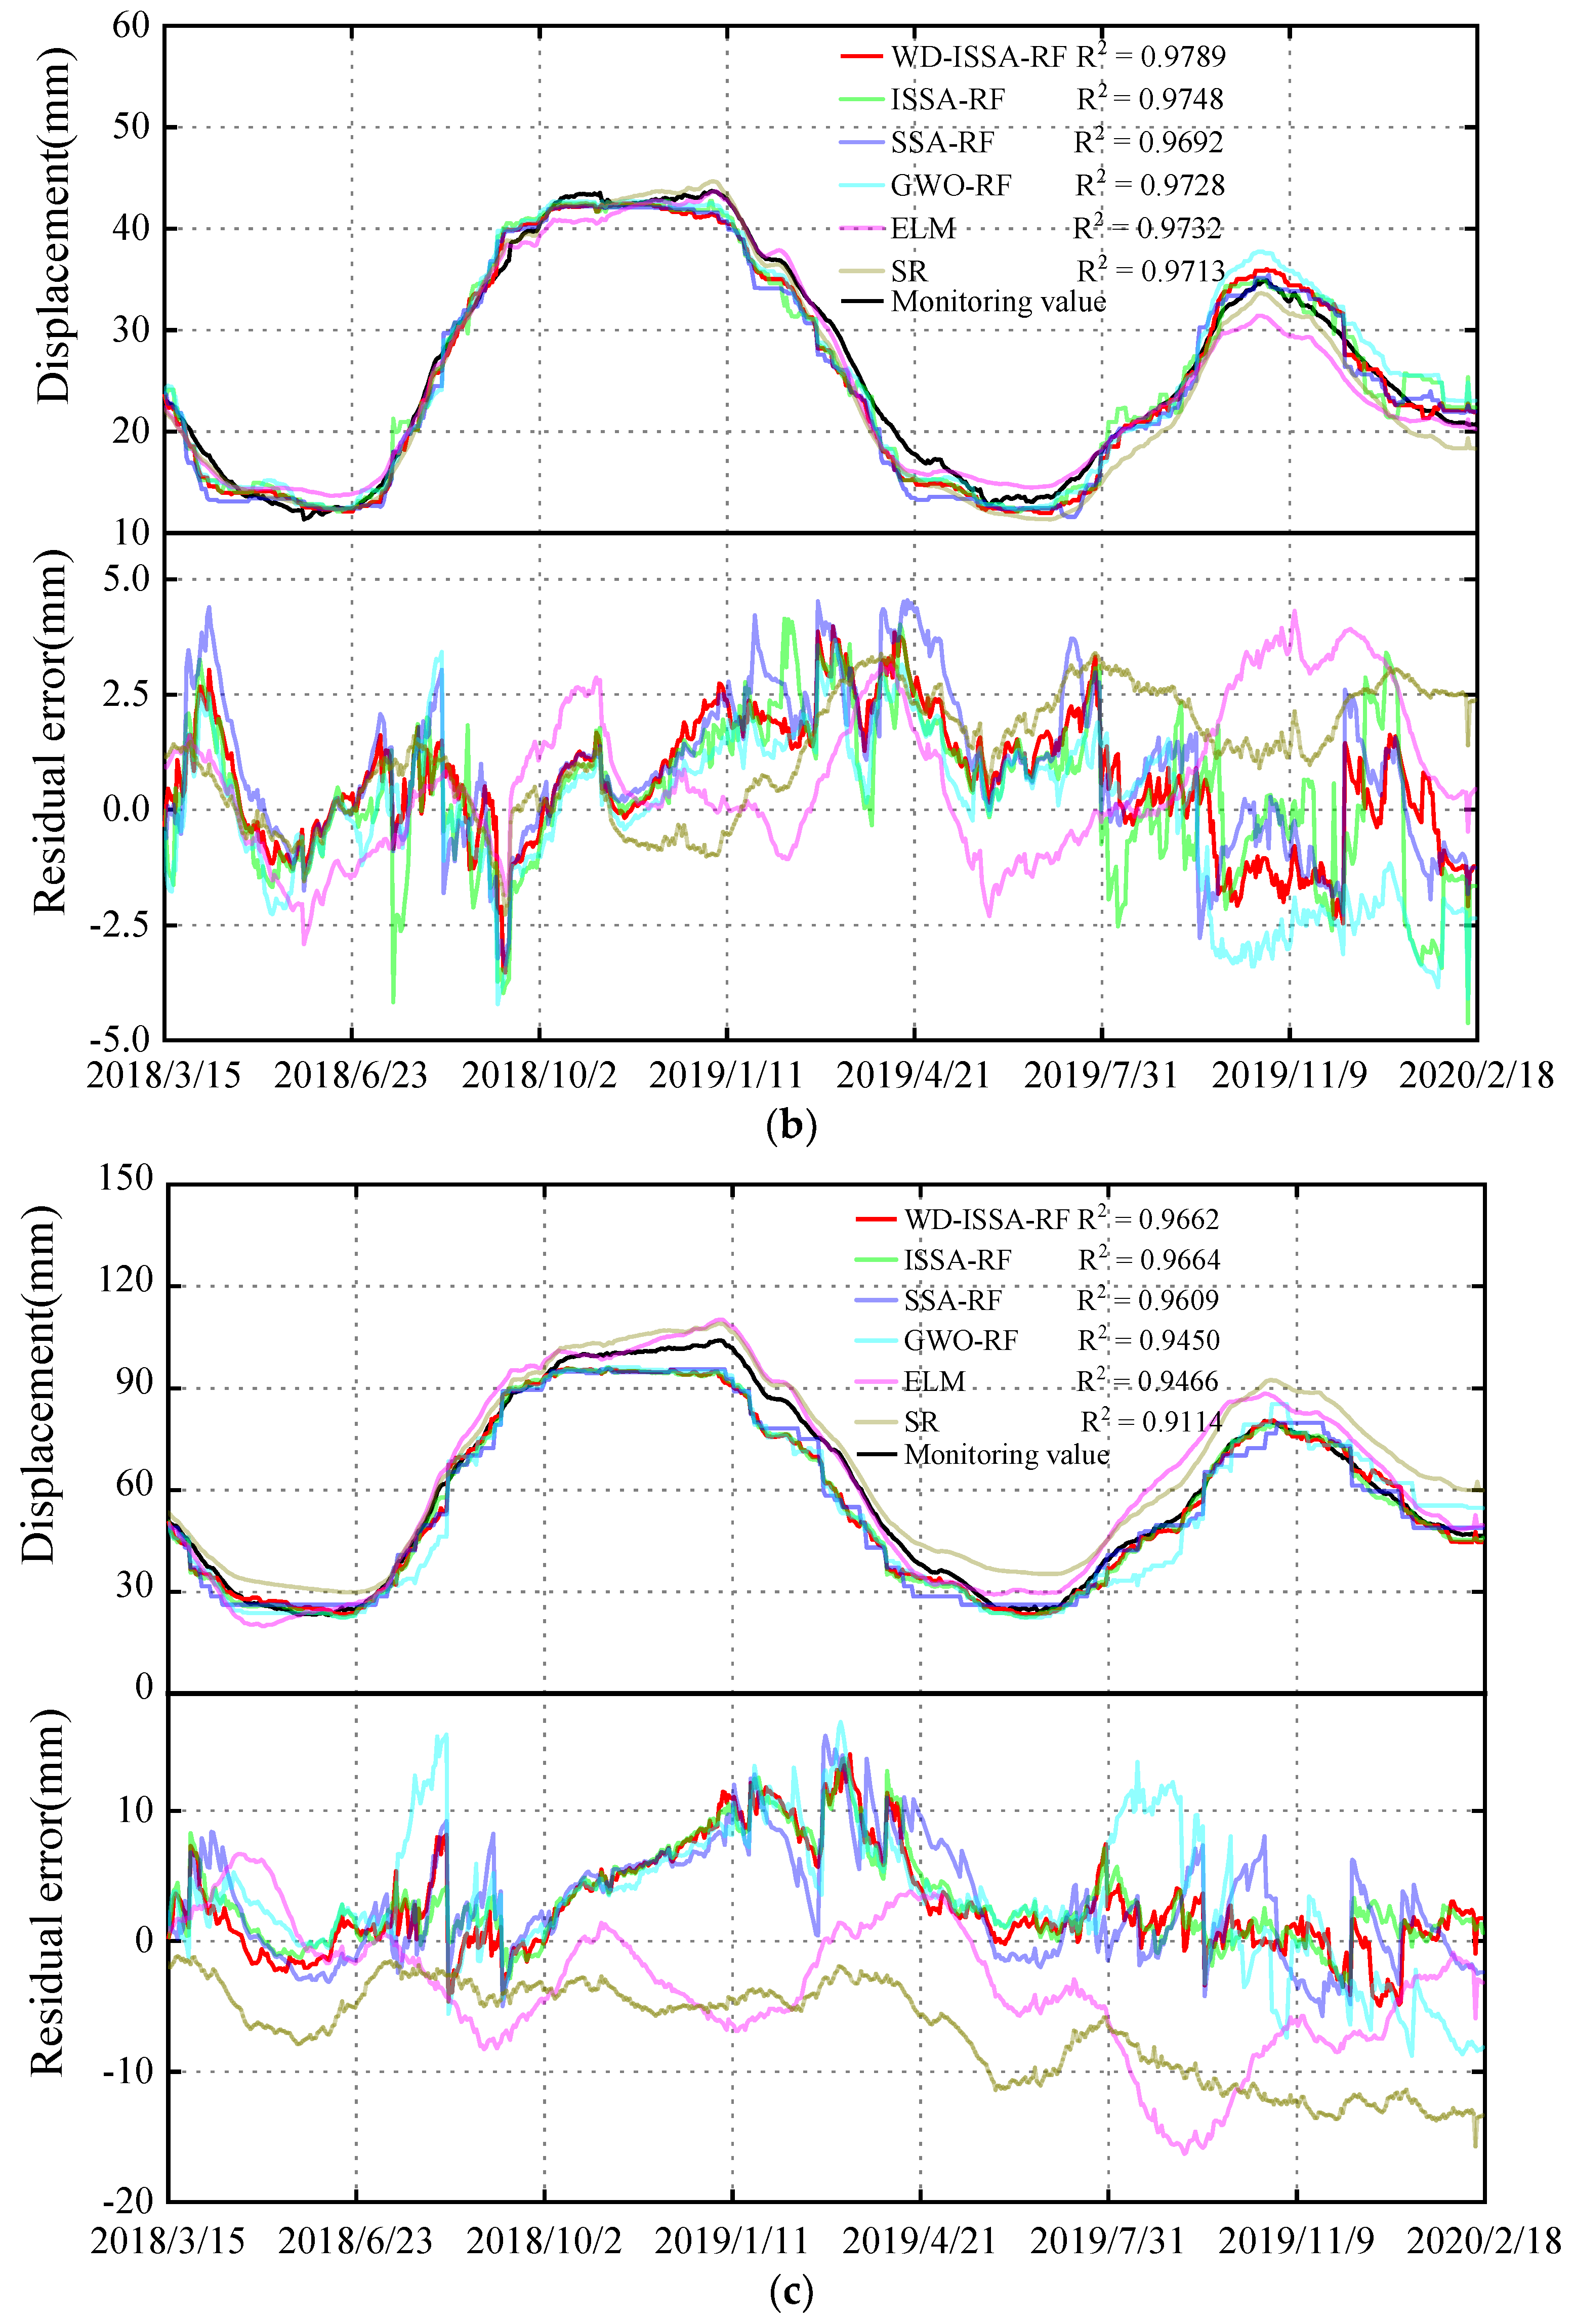
Figure 11.
Comparison of prediction performance using six prediction models for three monitoring points.
Figure 11.
Comparison of prediction performance using six prediction models for three monitoring points.

Figure 12.
Comparison of convergence performance based on ISSA and GWO optimization algorithms.
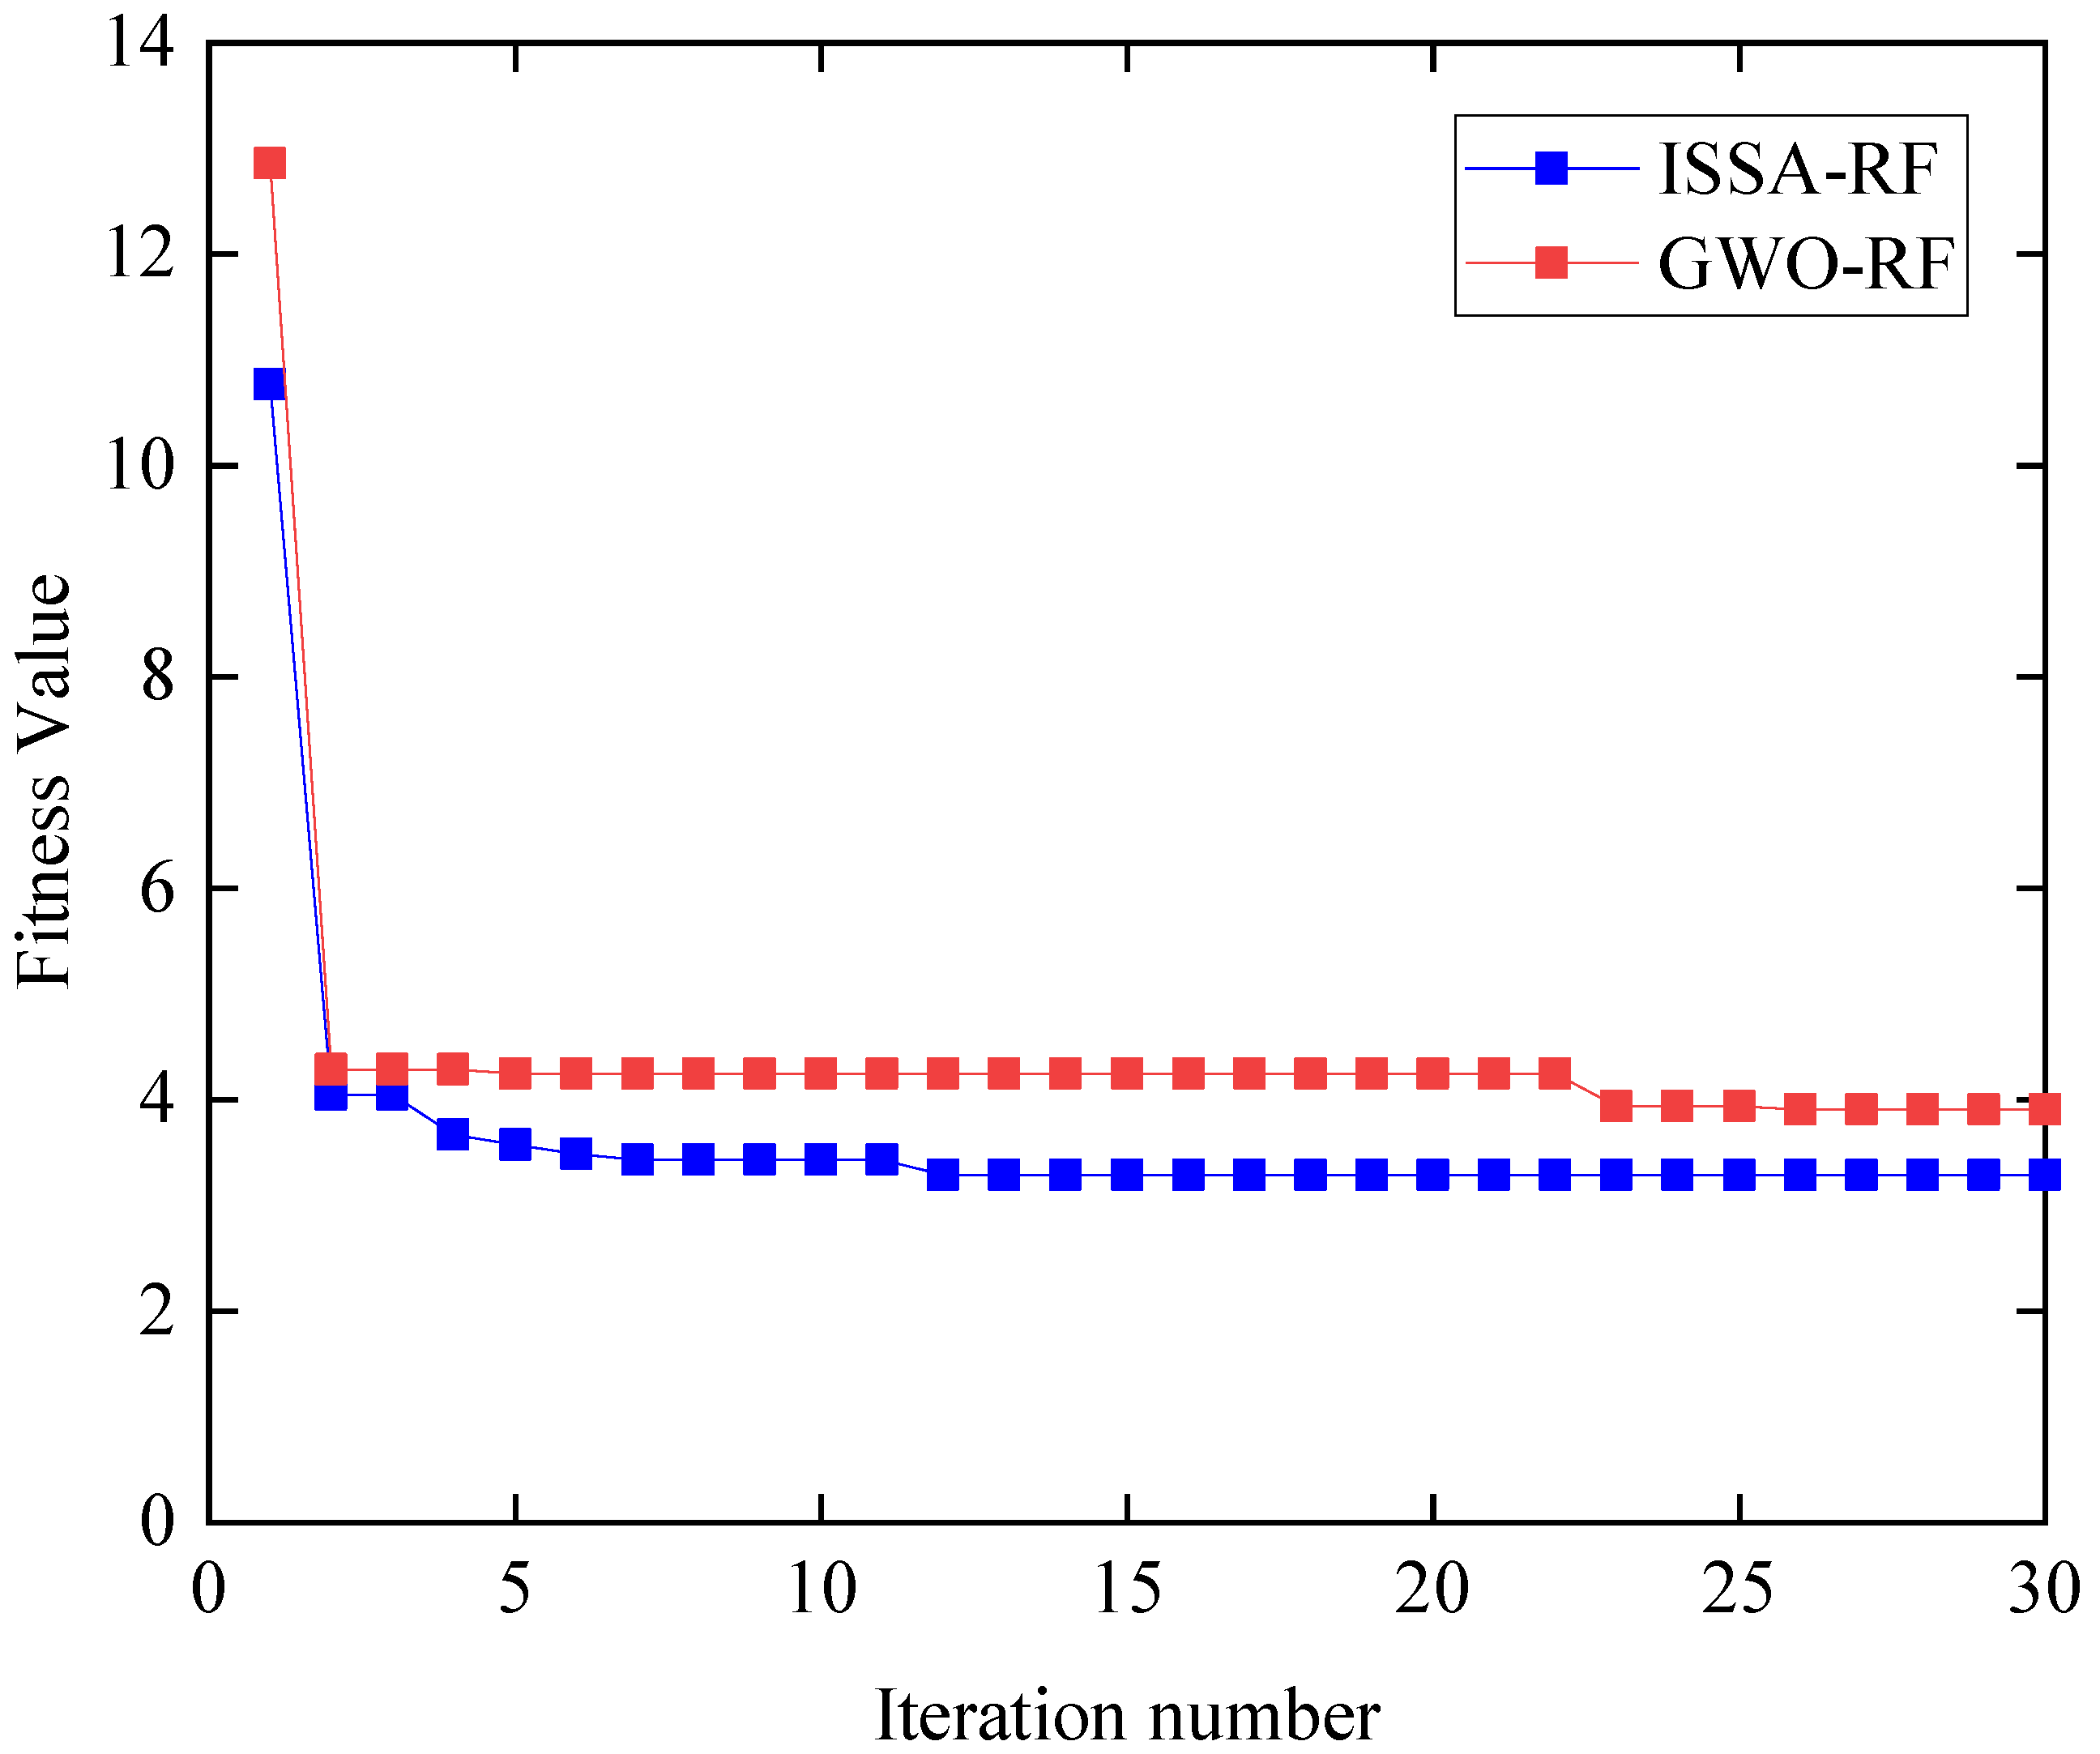
Figure 13.
Predicting and fitting results of the proposed model in four noise modes. (a) Mode 1: point-scattered type. (b) Mode 2: step type. (c) Mode 3: vibrating type. (d) Mode 4: Mixed type.
Figure 13.
Predicting and fitting results of the proposed model in four noise modes. (a) Mode 1: point-scattered type. (b) Mode 2: step type. (c) Mode 3: vibrating type. (d) Mode 4: Mixed type.
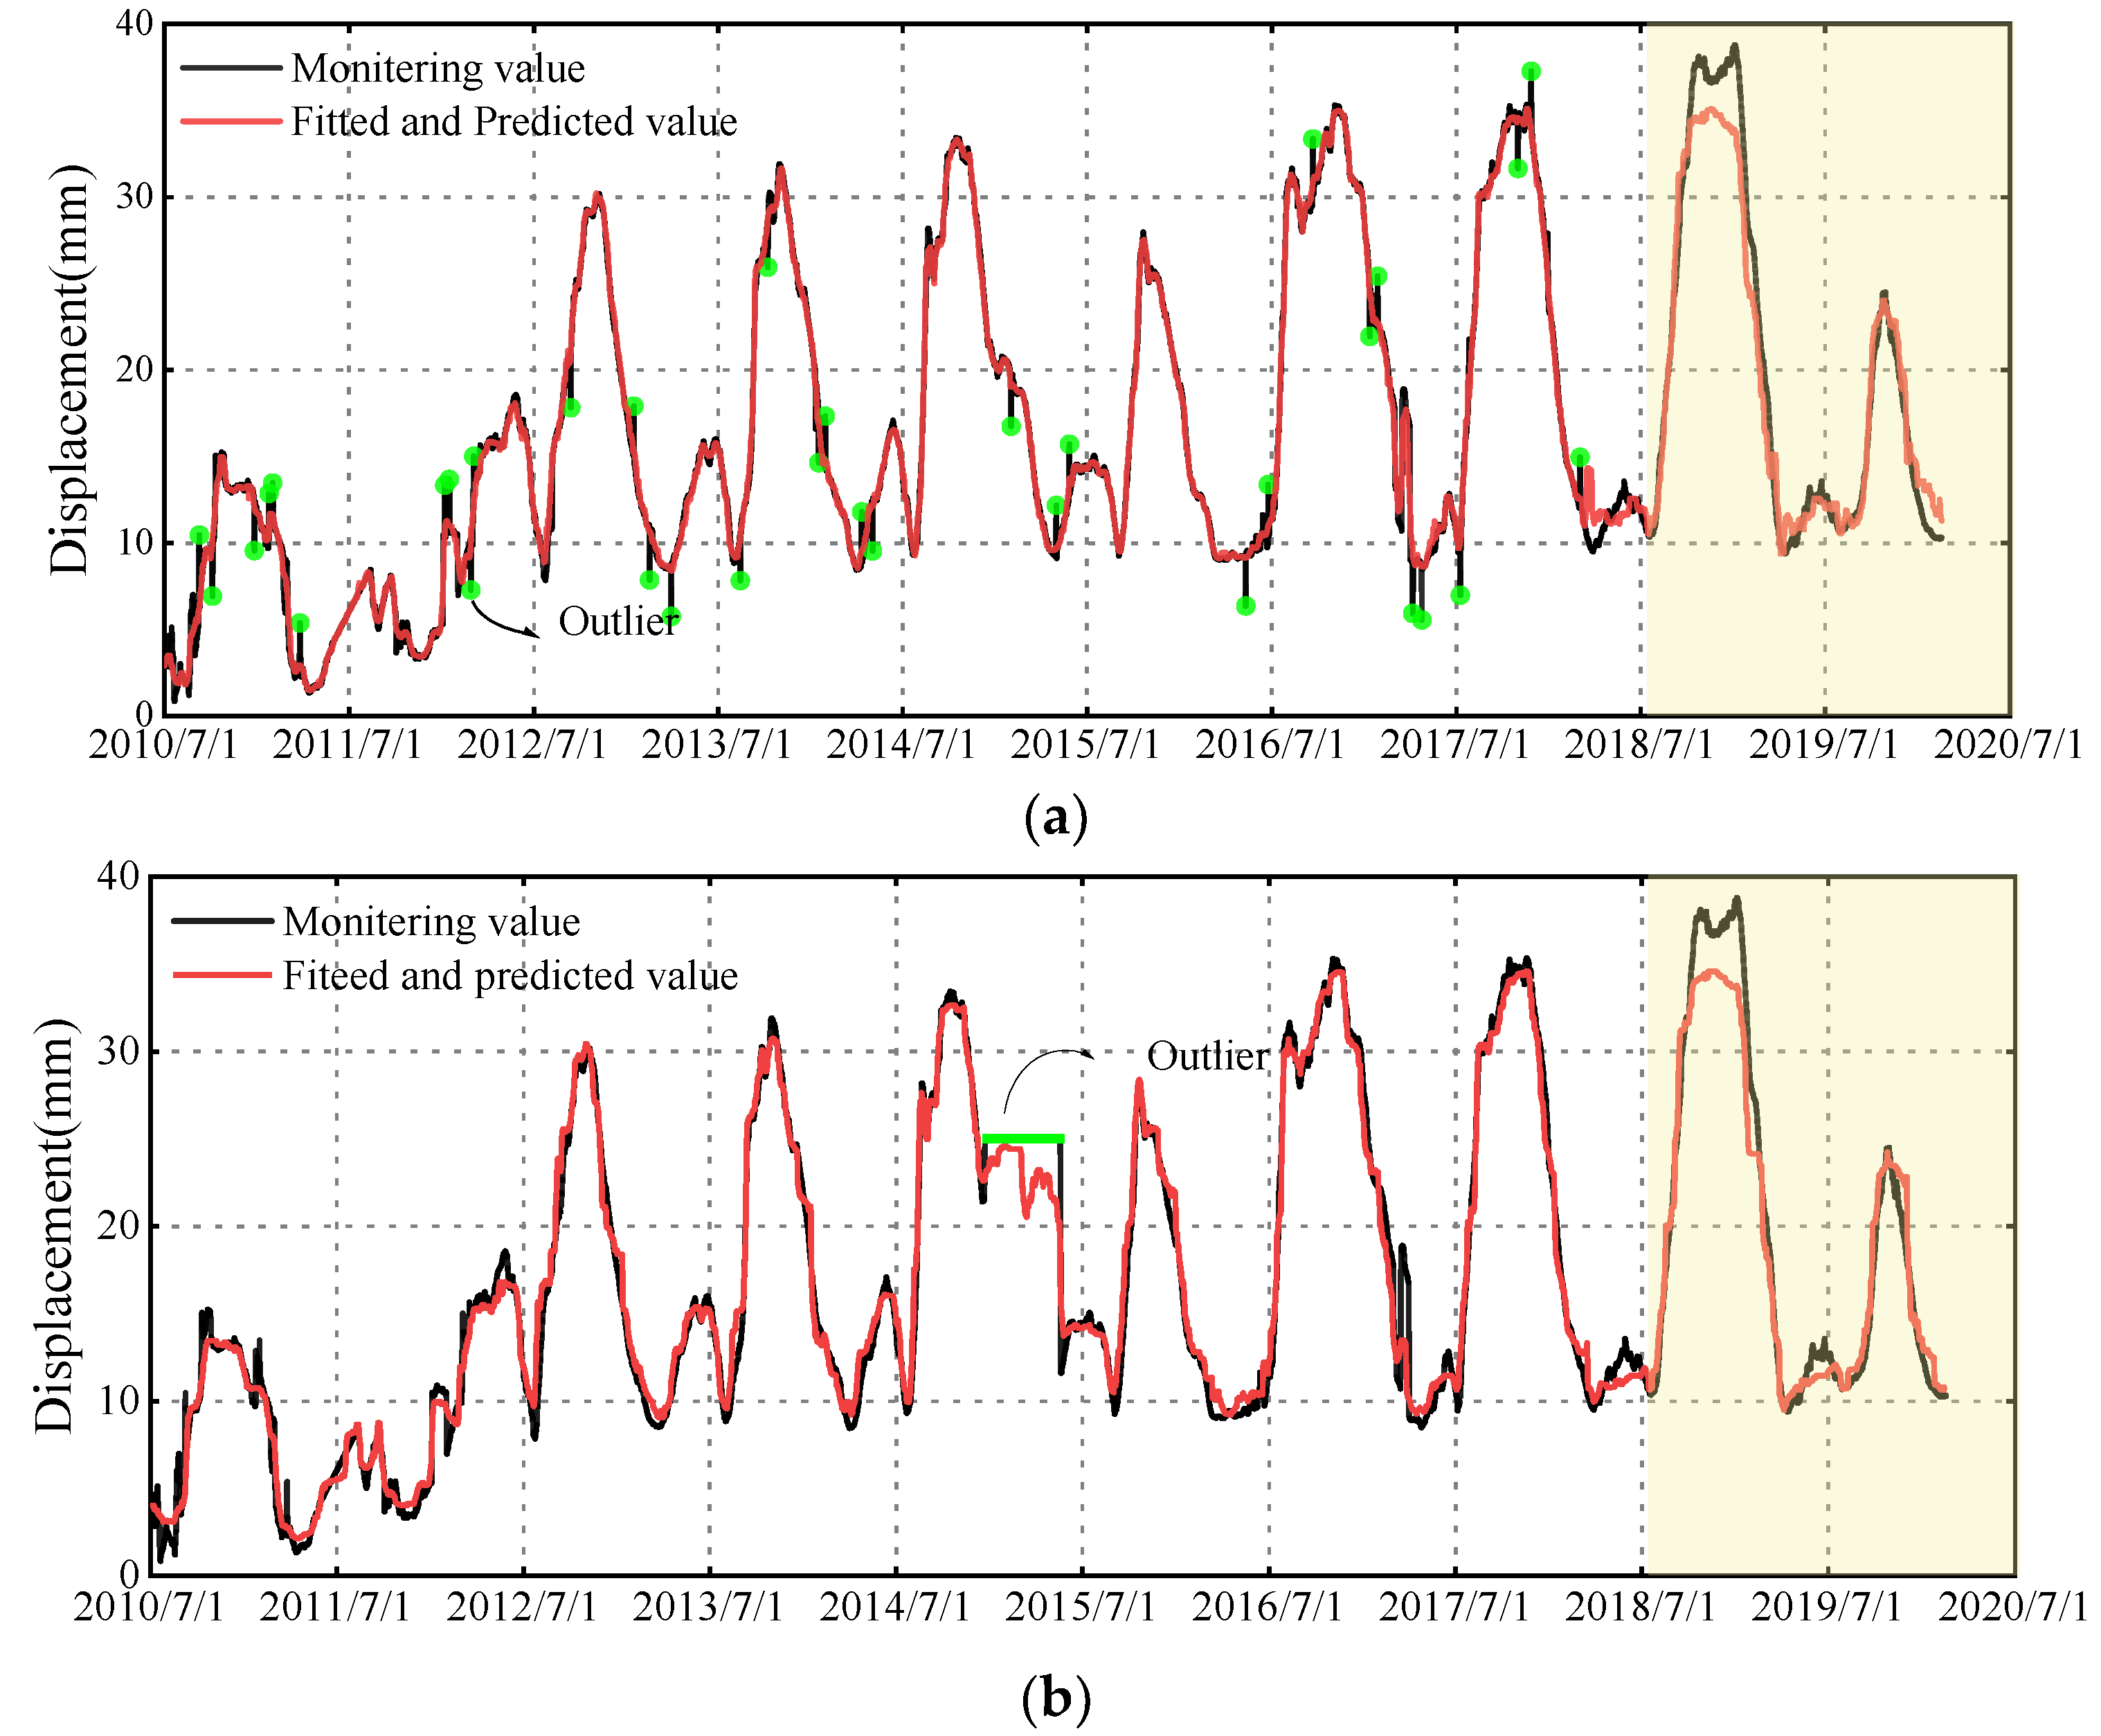

Figure 14.
Comparison of performance indicators of the proposed model in four noise modes.

Table 1.
Performance indexes of six prediction models for predicting dam deformation for three monitoring points.
Table 1.
Performance indexes of six prediction models for predicting dam deformation for three monitoring points.
| Statistical Indicators | WD-ISSA-RF | ISSA-RF | SSA-RF | GWO-RF | ELM | SR | |
|---|---|---|---|---|---|---|---|
| A09-PL-01 | R2 | 0.962 | 0.961 | 0.954 | 0.959 | 0.893 | 0.919 |
| MAE | 1.386 | 1.451 | 1.625 | 1.521 | 2.599 | 2.248 | |
| ME | 5.970 | 5.240 | 6.868 | 5.364 | 6.520 | 5.919 | |
| MAPE | 0.075 | 0.082 | 0.093 | 0.088 | 0.174 | 0.165 | |
| RMSE | 1.878 | 1.901 | 2.063 | 1.946 | 3.137 | 2.744 | |
| A09-PL-02 | R2 | 0.979 | 0.975 | 0.969 | 0.972 | 0.973 | 0.971 |
| MAE | 1.235 | 1.327 | 1.442 | 1.403 | 1.300 | 1.478 | |
| ME | 3.977 | 4.620 | 4.454 | 4.421 | 4.311 | 3.400 | |
| MAPE | 0.054 | 0.058 | 0.064 | 0.059 | 0.057 | 0.069 | |
| RMSE | 1.510 | 1.649 | 1.823 | 1.713 | 1.700 | 1.761 | |
| A19-PL-01 | R2 | 0.966 | 0.966 | 0.960 | 0.945 | 0.946 | 0.911 |
| MAE | 3.464 | 3.500 | 4.038 | 4.873 | 4.766 | 6.829 | |
| ME | 14.342 | 14.021 | 15.763 | 16.79 | 16.30 | 15.73 | |
| MAPE | 0.058 | 0.061 | 0.073 | 0.089 | 0.092 | 0.149 | |
| RMSE | 4.806 | 4.783 | 5.167 | 6.128 | 6.035 | 7.778 | |
Disclaimer/Publisher’s Note: The statements, opinions and data contained in all publications are solely those of the individual author(s) and contributor(s) and not of MDPI and/or the editor(s). MDPI and/or the editor(s) disclaim responsibility for any injury to people or property resulting from any ideas, methods, instructions or products referred to in the content. |
© 2023 by the authors. Licensee MDPI, Basel, Switzerland. This article is an open access article distributed under the terms and conditions of the Creative Commons Attribution (CC BY) license (https://creativecommons.org/licenses/by/4.0/).
Share and Cite
MDPI and ACS Style
Gu, C.; Wu, B.; Chen, Y. A High-Robust Displacement Prediction Model for Super-High Arch Dams Integrating Wavelet De-Noising and Improved Random Forest. Water 2023, 15, 1271. https://doi.org/10.3390/w15071271
AMA Style
Gu C, Wu B, Chen Y. A High-Robust Displacement Prediction Model for Super-High Arch Dams Integrating Wavelet De-Noising and Improved Random Forest. Water. 2023; 15(7):1271. https://doi.org/10.3390/w15071271
Chicago/Turabian StyleGu, Chongshi, Binqing Wu, and Yijun Chen. 2023. "A High-Robust Displacement Prediction Model for Super-High Arch Dams Integrating Wavelet De-Noising and Improved Random Forest" Water 15, no. 7: 1271. https://doi.org/10.3390/w15071271
Note that from the first issue of 2016, this journal uses article numbers instead of page numbers. See further details here.