1. Introduction
Groundwater is the most important water resource on Earth and is a major source of water for domestic, industrial and agricultural uses and ecological environments worldwide. However, since the beginning of the 20th century, accelerating urbanization, industrialization and climate changes pose risks to the quantity and quality of groundwater, resulting in regional groundwater dynamic imbalances [
1]. In the mid-1980s, global groundwater exploitation was approximately 5500 × 10
8 m
3/a; of athis total, the exploitation by India, the United States, China, the European Community, Japan, Egypt and Australia was 3631.8 × 10
8 m
3/a, or 66%. Furthermore, the exploitation of groundwater in different countries was highly variable. By the end of the 20th century, global groundwater exploitation exceeded 7500 × 10
8 m
3/a, which has led to a series of environmental problems, such as groundwater funnelling, seawater intrusion, land subsidence, soil salinization, desertification, and water pollution, and serious disasters and economic losses [
2]. Therefore, the sustainability and management of the groundwater development and utilization require the correct understanding and assessment of these risks and problems caused by unreasonable exploitation and utilization of groundwater resources.
Risk has been defined as the probability of exposure to loss, injury, or other adverse or unwelcome circumstance [
3]. Due to the regional importance of groundwater, comprehensive studies on the risks from groundwater usage have been conducted worldwide, including on groundwater environmental, exploitation and utilization risks. Thus far, studies of groundwater risk have mainly focused on aspects of groundwater environmental risk, especially groundwater quality and associated health risks [
4,
5,
6,
7,
8,
9,
10,
11]. Because groundwater systems are large, open and complex, great uncertainty exists in the process of groundwater development and utilization. Therefore, without scientific and reasonable planning, the exploitation of groundwater can bring great risks and even lead to disasters. Given the consequences, a comprehensive risk analysis of groundwater that can provide reasonable and reliable plans for groundwater exploitation and minimize the risk of exploitation and utilization is necessary [
12,
13]. At present, there are many methods of groundwater risk assessment, such as fuzzy evaluation [
14,
15], factor analysis [
16], neural network analysis [
17,
18,
19], analytic hierarchy process [
20,
21,
22,
23] and so on. Zhang et al. proposed an approach with analysis hierarchy process and fuzzy comprehensive evaluation integrated together to establish a corresponding index system of groundwater risk assessment [
15]. Li et al. introduced artificial neural network (ANN) method with learning mechanism containing weights and then evaluated the risk of karst groundwater pollution in Guizhou Province, China. Considering some methods are difficult to solve the problem of determining weight correctly, such as the fuzzy evaluation method; some methods are complicated to calculate and require a large number of samples, such as factor analysis method; it’s reasonable to choose the catastrophe theory evaluation method to avoid these problems. The advantage of this method is that the determination of the importance of each index is based on the inherent contradictory position and mechanism of each target in the normalization formula itself, and the weight of the index is not used, thus the evaluation results are objective, accurate and easy to calculate. In recent years, some scholars have introduced catastrophe theory into the field of groundwater, and carried out a lot of basic research on risk assessment in the process of groundwater exploitation and utilization. Du chose Taian County in Liaoning Province as a study area and used catastrophe theory for calculating local groundwater resources exploitation threshold [
24]. Wang based on the evaluation results of groundwater development risk, and taking into account the natural situation, development and utilization of the status, socioeconomic status, used a catastrophe evaluation method to assess the risk of groundwater development in Shawan District [
25]. The dimensions of control variables of the above-mentioned studies are less than four, when there are more than four indicators corresponding to the criterion layer, the criterion layer needs to be stratified twice, which complicates the evaluation index system [
25]. So, it is necessary to extend the type of cusp-like catastrophe and break through the limitation of numbers of the control variables of catastrophe evaluation method.
In regions with frequent water stress and large aquifer systems, groundwater is often used as an additional water source. If groundwater extraction exceeds natural groundwater recharge for extensive areas and long times, overexploitation or persistent groundwater depletion occurs. Wada et al. (2010) provided a global overview of groundwater depletion and noted large extraction rates in China [
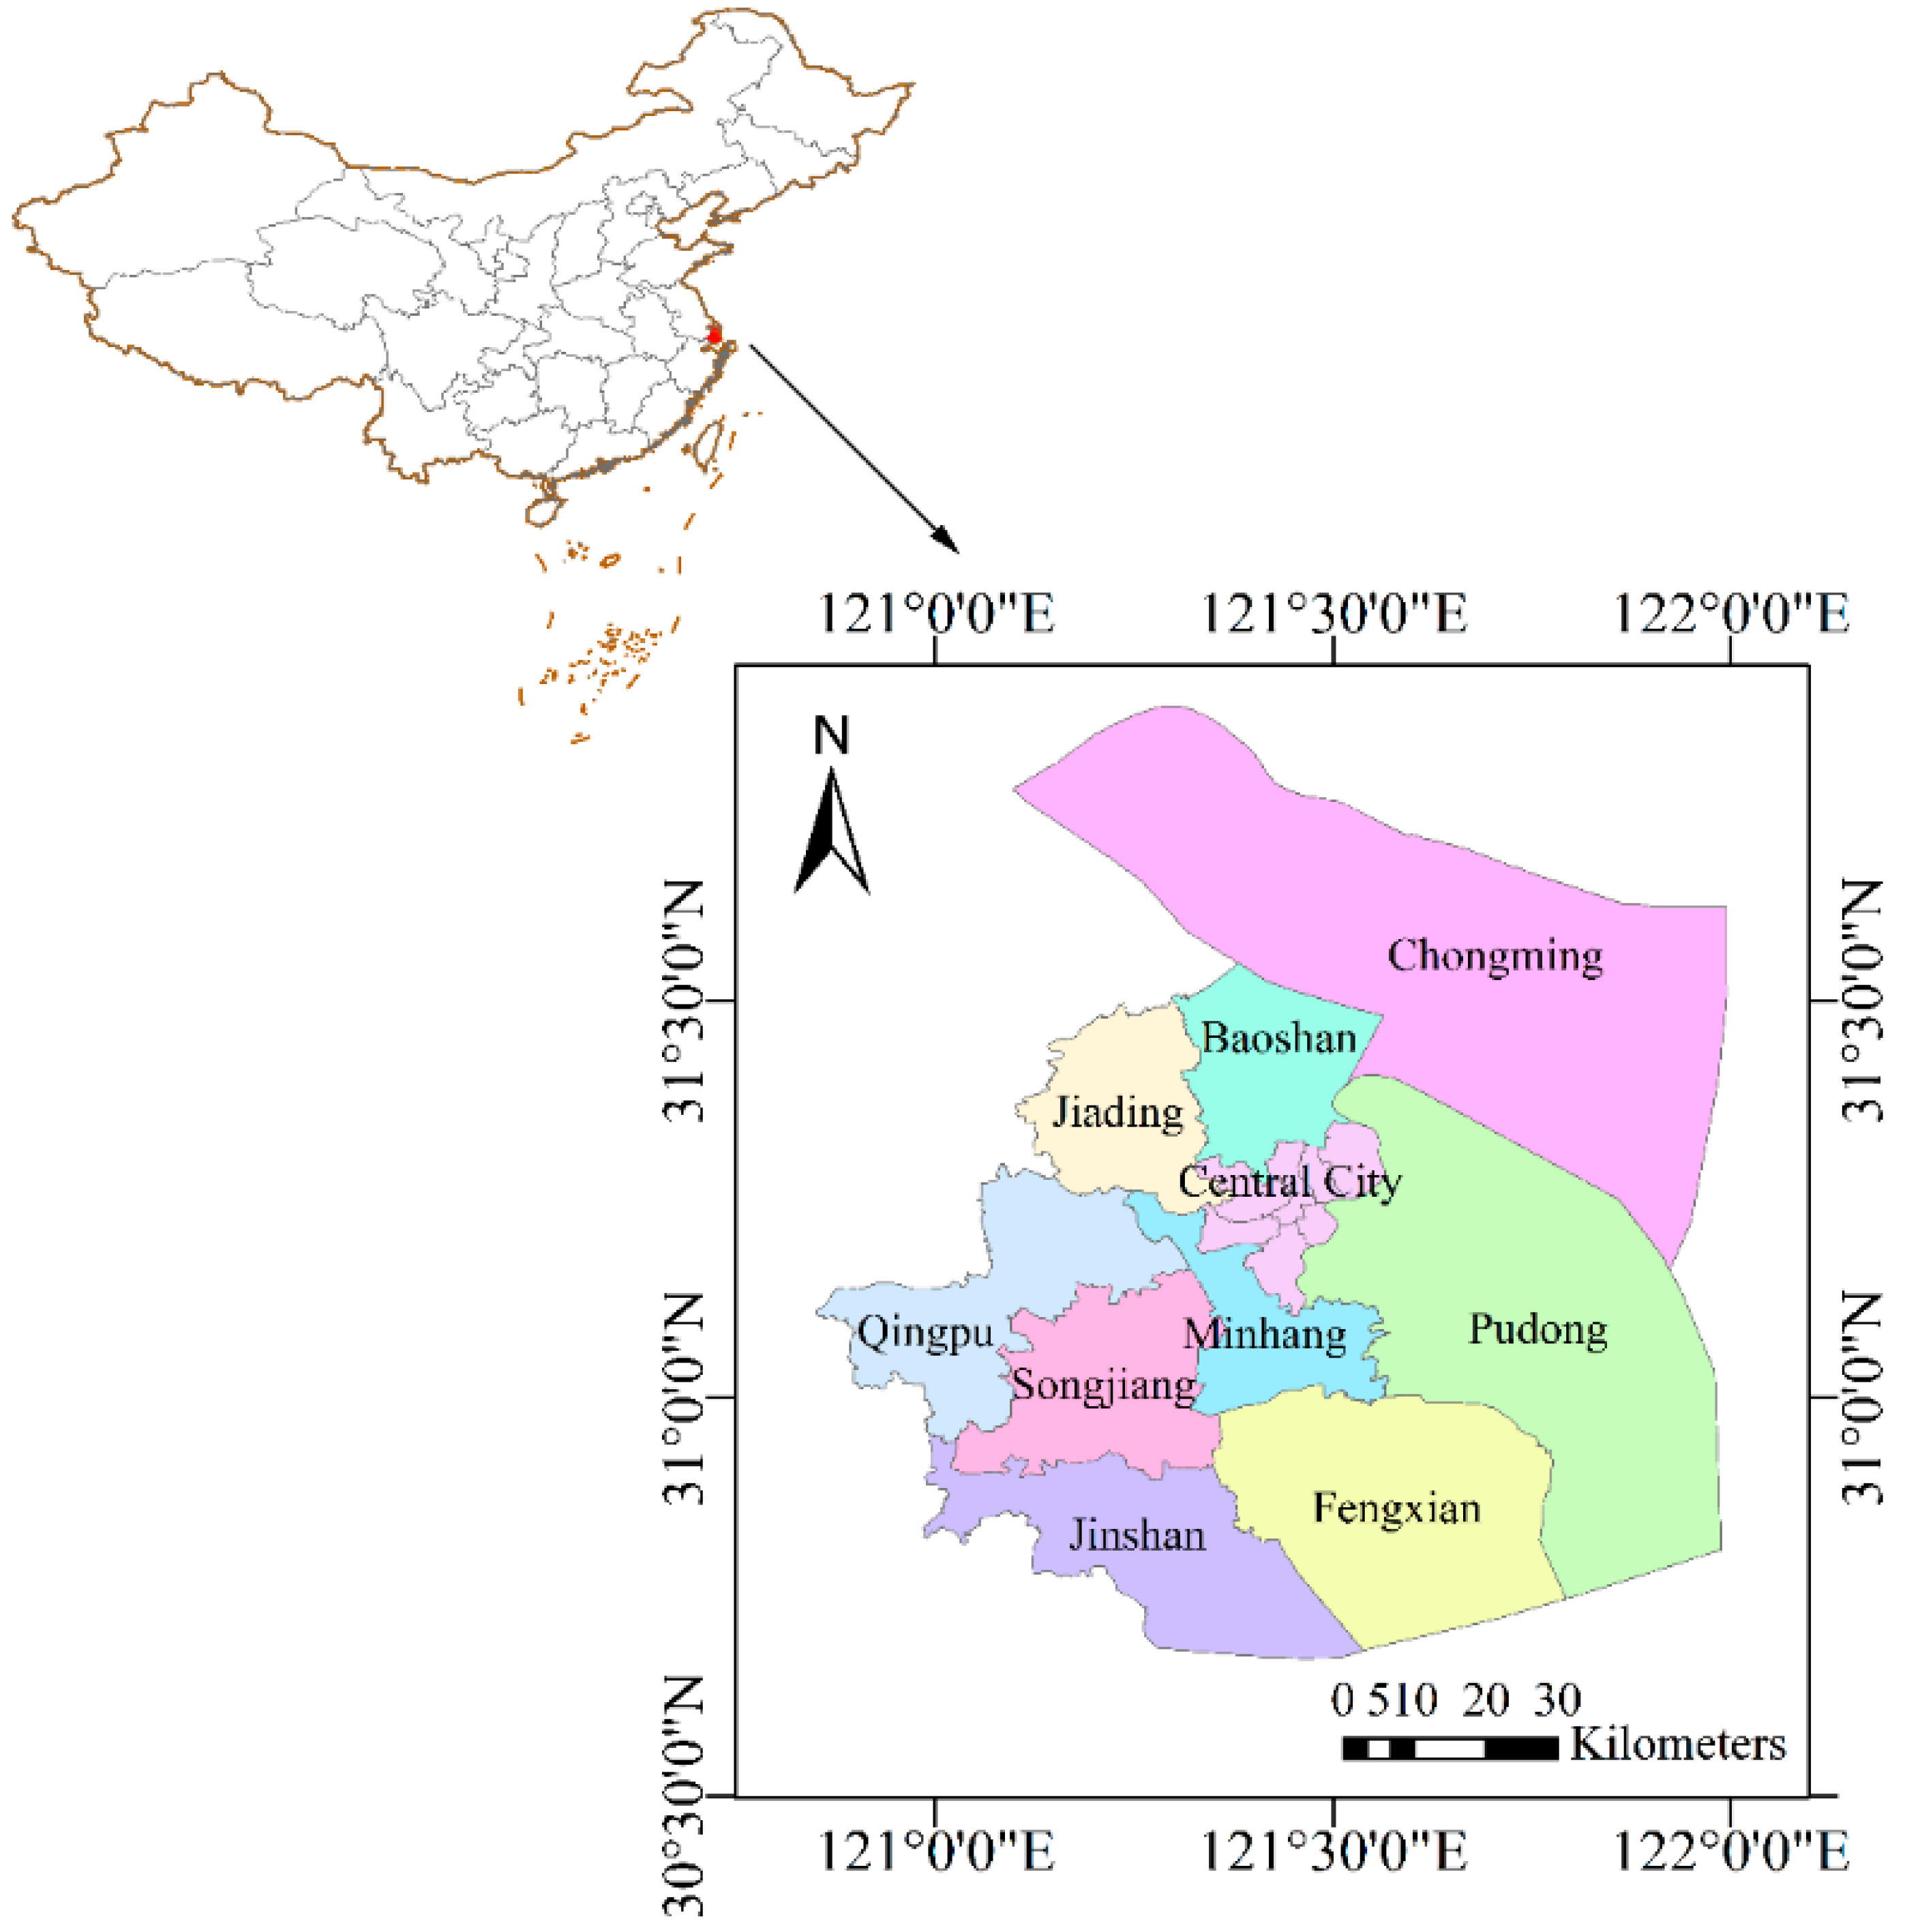
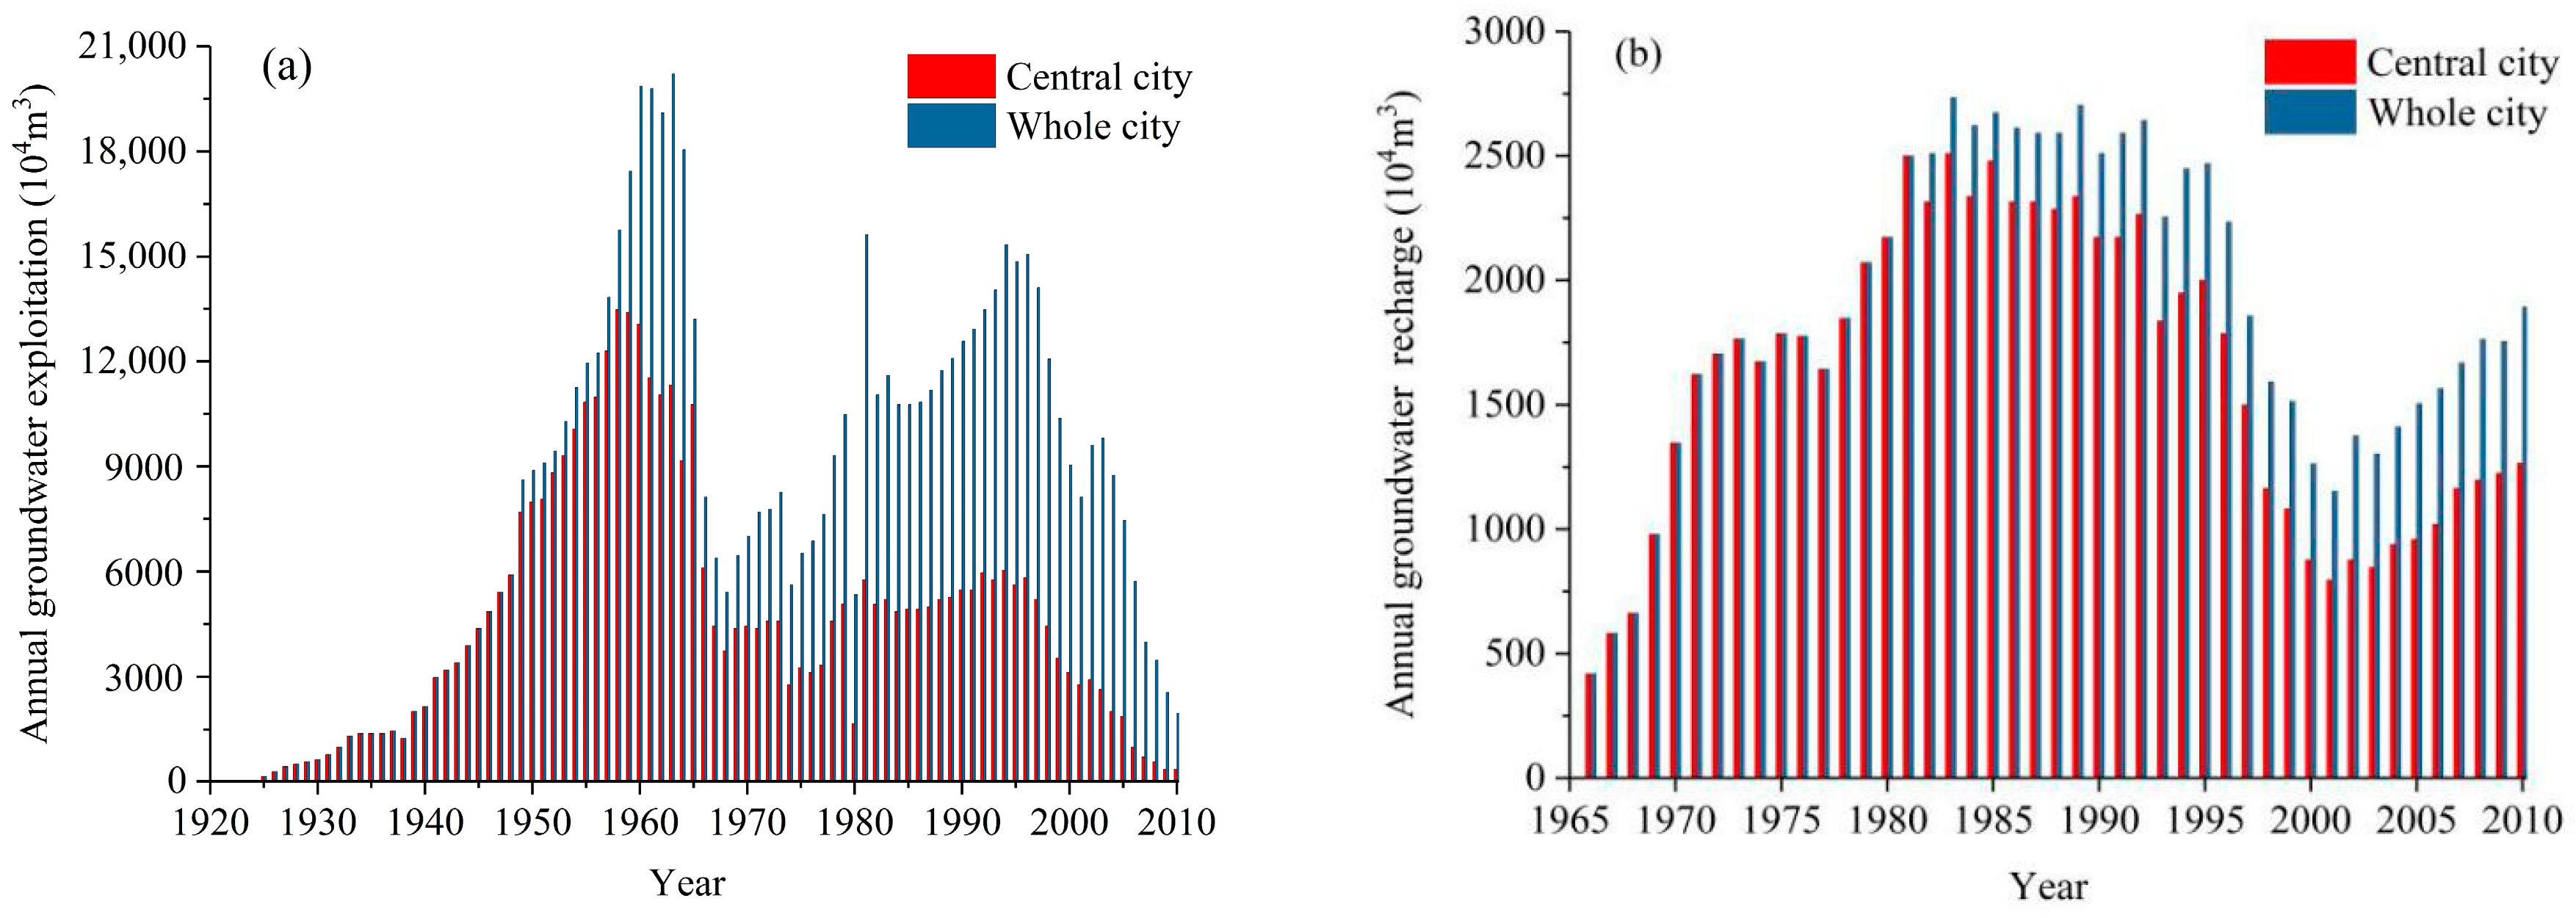
26]. Shanghai is one of the largest metropolitan areas in China. Like other megacities, Shanghai suffers from overexploitation of groundwater induced by poor water resources management. Since the first deep well was excavated in 1860 in the central city, the number of deep wells and annual exploitation have increased continuously. In 1963, groundwater exploitation reached a historical peak, when total groundwater exploitation for the entire city was 2.03 × 10
8 m
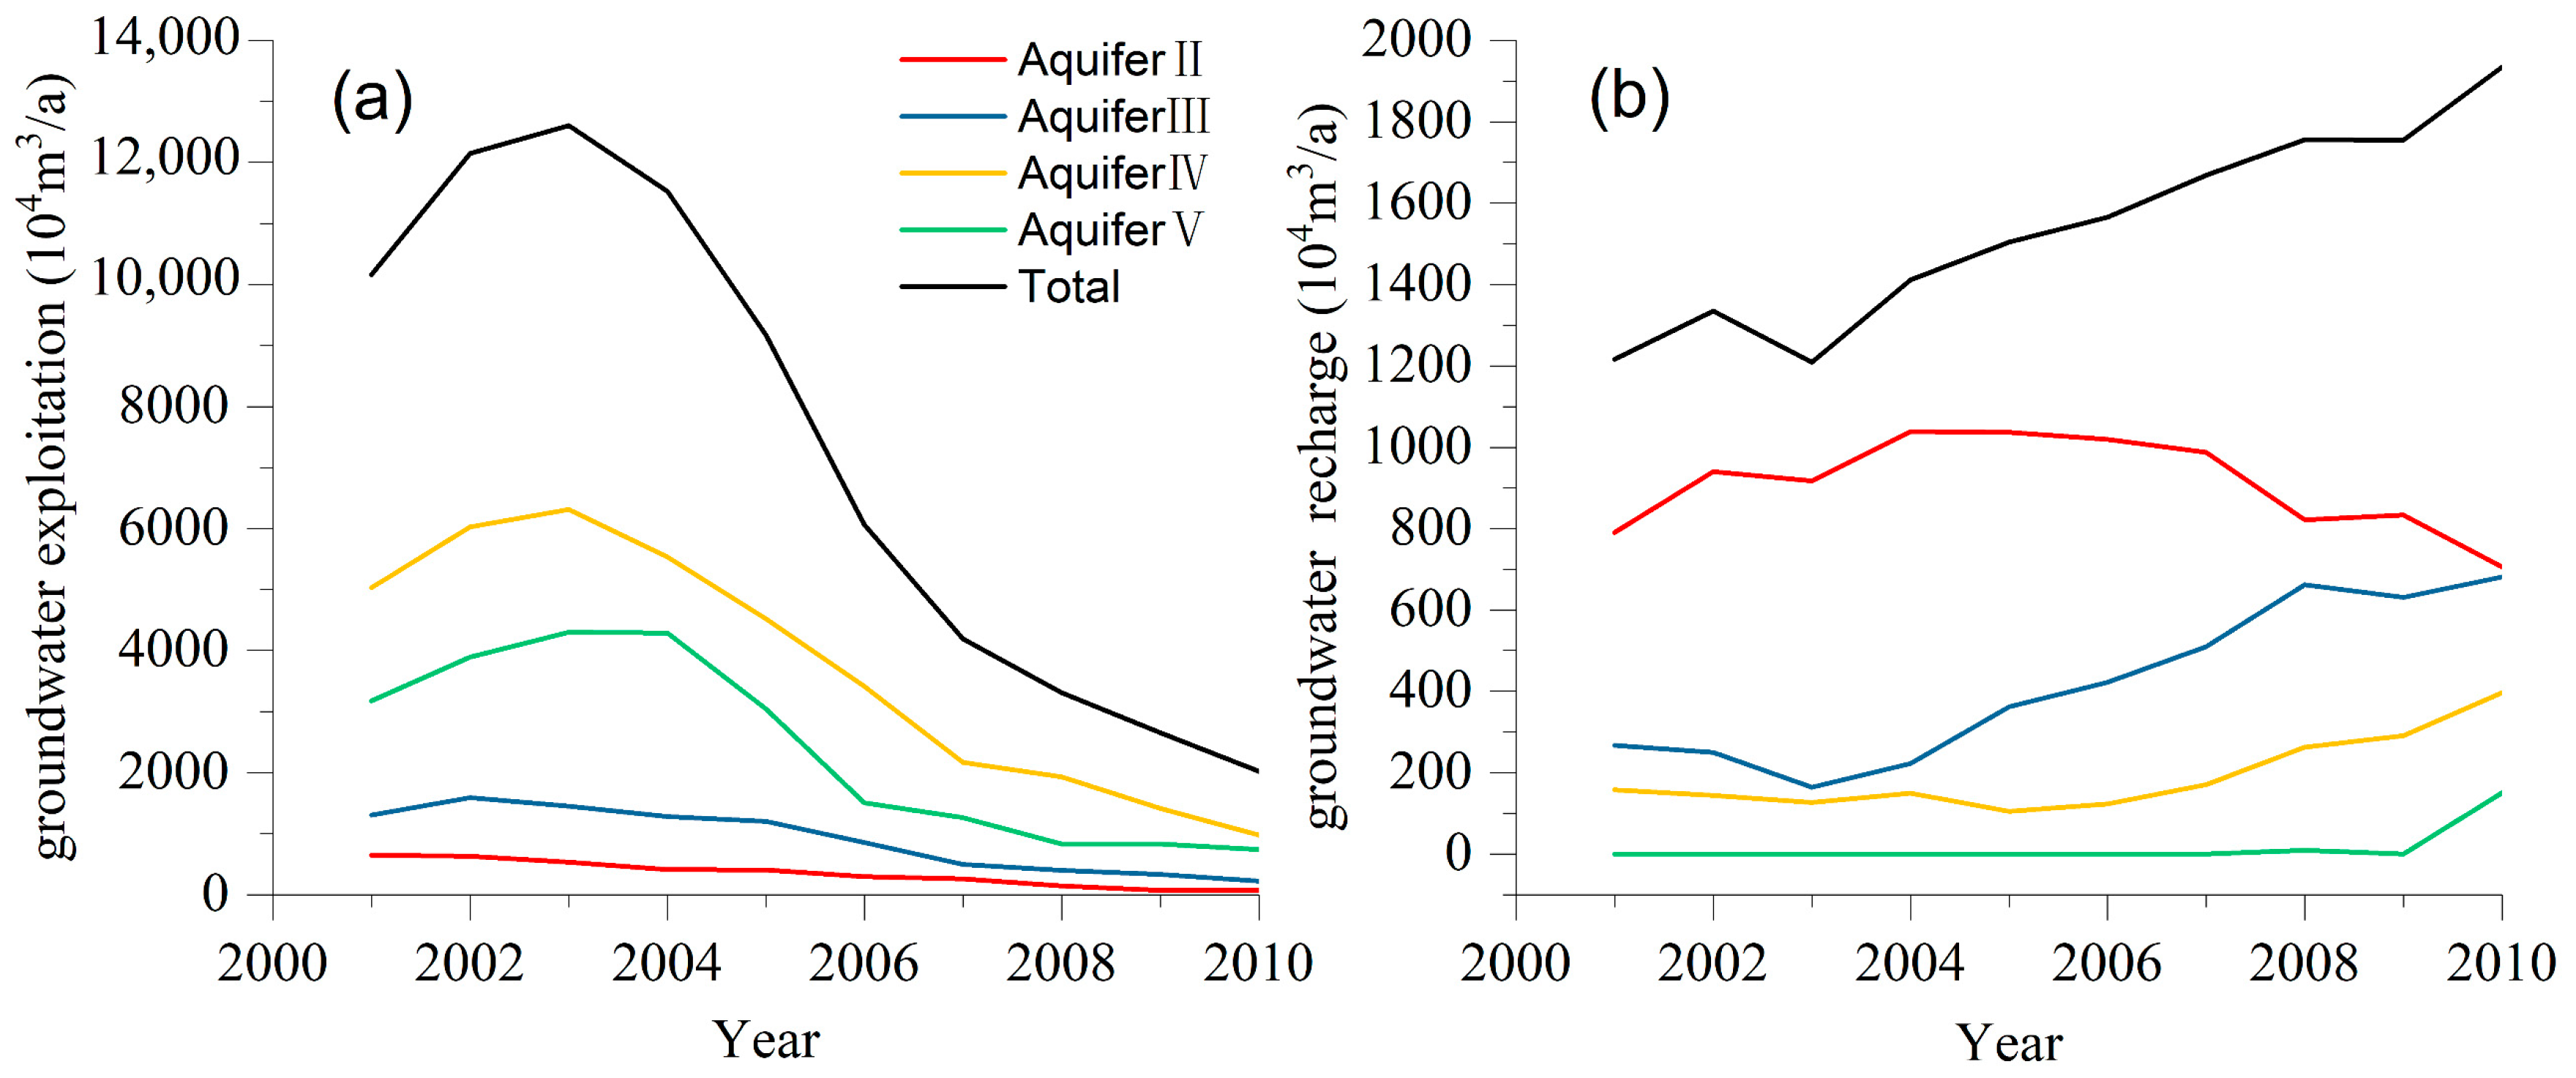
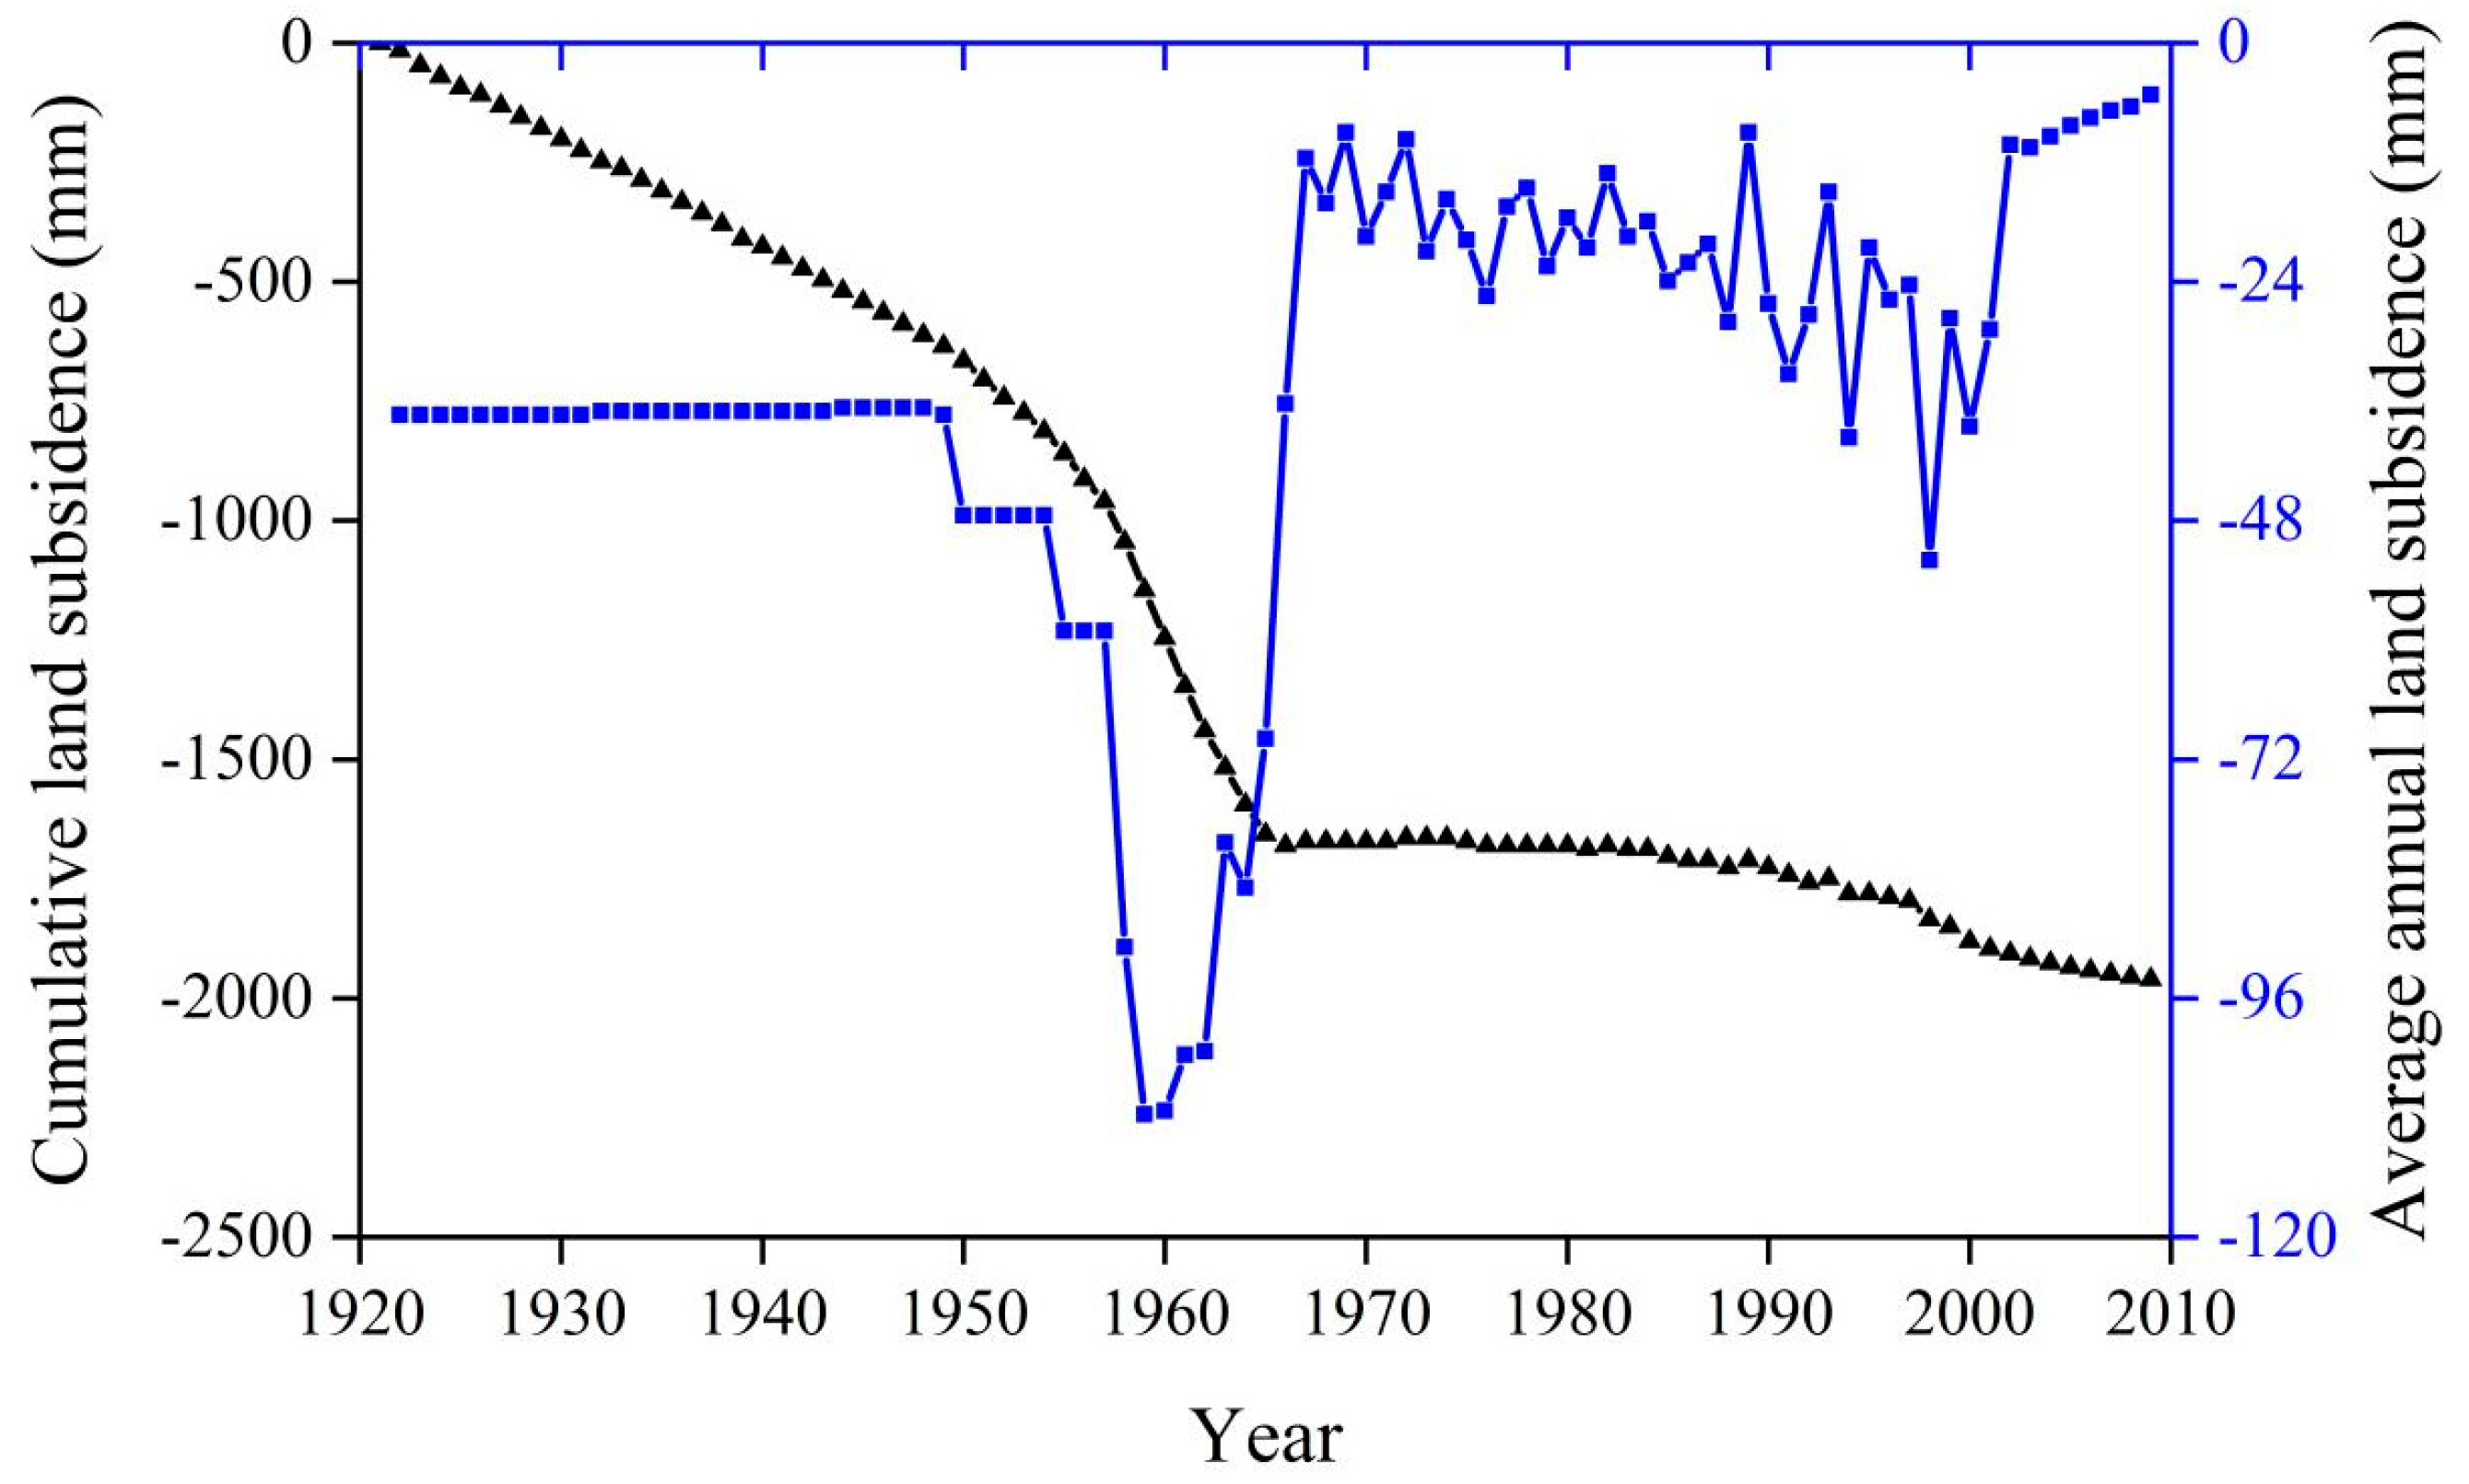
3/a and the number of deep wells reached 1051. Since 2000, the Shanghai Municipal Government has taken measures to address the exploitation, which has resulted in signs of recovery for the groundwater level of all aquifers in the city and easing of land subsidence. However, overexploitation of groundwater in Shanghai continues to decrease groundwater levels, cause land subsidence and sharply diminish groundwater resources; therefore, risks and challenges remain for sustainable groundwater usage in Shanghai.
Unbalanced development and utilization of groundwater exists all over the world. China is one of the earliest countries in the world to exploit and utilize groundwater. With the rapid development of China in the 1980s, the degree of groundwater development and utilization has increased rapidly, especially in large and medium-sized cities. Taking Shanghai as an example, the exploitation of groundwater in Shanghai has the characteristics of long duration, large intensity and wide scale, and it is a typical representative of regional groundwater development and utilization risk in cities. Objectives of this paper are: (1) to propose a risk assessment model for groundwater exploitation and utilization by deriving and expanding numbers of the control variables of the catastrophe theory, (2) to construct a universal evaluation index system of the groundwater exploitation and utilization risk according the features of groundwater system and its risks, (3) to assess and analyze the risk level of the groundwater exploitation and utilization in the districts and aquifers of Shanghai region.
2. Methodology
The process of continuous, gradual and smooth changes in nature can be solved using calculus. However, natural and social phenomena are subject to sudden changes and transitions, such as rock ruptures, bridge collapses, earthquakes, cell divisions and economic crisis. However, when continuous developments transition from gradual and quantitative change to sudden and qualitative change, they are termed catastrophic phenomena; the sudden jump from one form to another cannot be described and solved by calculus. To address this step-change process, mathematicians use catastrophe theory.
Catastrophe theory is widely applied in academia to many disciplines, and it has been used successfully to solve many problems that are intractable using other methods. Rene Thom [
27] pointed out that the application of catastrophe theory can be divided into two levels. The first level is theoretical application, which describes the catastrophe theory model with precise quantitative rules and can quickly give qualitative explanations for global characteristics and singularities of solutions. It is mainly applicable to mathematics [
28,
29,
30], physics [
31] and chemistry [
32]. The second level is the practical application of catastrophe theory, which brings observed phenomena, such as jumps and lags, into a mathematical model to simulate data. It has been primarily applied to biological [
33], social [
34] and environmental sciences [
35].
Catastrophe theory classifies the critical points of the system using the potential function and studies the characteristics of discontinuous change states near various critical points. According to their geometric shapes, there are seven primary catastrophe types [
36], which are shown in
Table 1.
As shown in
Table 1, the dimensions of these seven primary control variables are not greater than four. In practice, the research object is more complex, and the dimension of control variables (the number of evaluation indicators) is far more than four in most cases, which limits the application of catastrophe theory. Therefore, it is necessary to expand the type of primary catastrophe.
2.1. Extension of the Catastrophe Theory Evaluation Method
A catastrophe with one-dimensional state variables is called a cusp-like catastrophe. Because the state variables involved in this study are all one-dimensional, we apply and extend the cusp-like catastrophe, and the control variable dimension is extended from four to n. For a research object whose state variable is one-dimension, the dimension of control variable is no longer restricted, thus the application condition and range of catastrophe theory are expanded.
When
is a finite function,
is the coefficient and
is a polynomial close to
,
can be written as:
Considering infinitesimal diffeomorphism:
The effect of
on
is given by the formula:
In the case of only one substantive variable, the singularities all belong to the form
. According to the above deduction method, a diffeomorphism can be found to eliminate all terms that are multiples of
(
). Thus, the universal unfolding of the cusp-like point is:
Therefore, the cusp-like catastrophe potential function is:
When
n = 3, 4, 5, 6, the corresponding catastrophe types are folded, cusp, swallow tail and butterfly. When
n = 7, it is termed an Indian cottage due to its similar geometry. When
the geometry is more complex. The extended cusp catastrophic types are shown in
Table 2.
Based on the potential function, the equilibrium surface, singular point set and bifurcation point of different catastrophe models are analysed, and the normalized formula of control variables are obtained (
Table 2). The normalization formula is the basic formula for evaluating using catastrophe theory. The total catastrophe membership value can be obtained using a recursion operation with the normalization formula, which is the basis for the final comprehensive evaluation.
Taking cusp catastrophe as an example, from
, the equation of equilibrium surface is obtained as follows:
From
, we can know that the equation of singular point set is:
By eliminating
x, the bifurcation equation is obtained as follows:
The bifurcation equation written in the form of decomposition is as follows:
The bifurcation equation can be further rewritten as follows:
If |x| = 1, then a = −6, b = 8, which determines the range of state variables x and control variables a, b. That is to say, 0 ≤ |x| ≤ 1, 0 ≤ |a| ≤ 6, 0 ≤ |b| ≤ 8, the values of these three variables are not uniform. In order to operate conveniently, the range of state variables and control variables is usually limited to 0–1. For this reason, we should reduce a by 6 times and b by 8 times, the method of reducing the relative range does not affect the properties of catastrophe model.
The normalization formula of cusp catastrophe type is as follows:
Similarly, it can be concluded that the normalization formula of swallow tail catastrophe type is as follows:
The normalization formula of butterfly catastrophe type is as follows:
The normalization formula of Indian cottage type is as follows:
According to the requirements of evaluation content and index selection, the dimension of control variables can be properly expanded to meet the requirement of evaluation (
Table 2).
2.2. Risk Assessment Model for Groundwater Exploitation and Utilization Based on Catastrophe Theory
2.2.1. Construction of the Risk Evaluation Index System
Groundwater exploitation and utilization risk is the result of interactions between natural, social, economic and ecological factors, which can also be used to measure the risk and losses from the groundwater system. At present, progress has been made in generating a water resources risk evaluation index system, but there are many differences in index systems established by different scholars because the evaluation purposes are different. Because the groundwater system is characterized by non-linearity, openness and dynamic behavior, the established evaluation index system must include the main components of groundwater exploitation and utilization risk.
Generally, indicators should be selected to achieve two purposes: (1) the index system established can fully and accurately reflect the current groundwater exploitation and utilization risk evaluation status; (2) the index system should be simple and minimal. Considering groundwater recharge, allowable exploitation, population, society, economy and negative effects of ecological environment, we proposed the following risk evaluation index system for groundwater exploitation and utilization. The index consists of three levels: target, criterion and index (
Table 3).
2.2.2. The Proposed Catastrophic Risk Assessment Model
In this study, the catastrophe theory evaluation method was used to evaluate the risk of groundwater development and utilization [
37]. The specific steps are as follows:
Step 1: Construct the risk evaluation index system. Using the described risk assessment of groundwater development and utilization and inherent relationship between risk factors, we decompose the risk assessment objectives into many layers.
Step 2: Calculate the fuzzy membership value of the index. The scores of the underlying evaluation indices are determined and the values of the indices (control variables) are unified. The data are not comparable when the original data values and measurement units of each index are different. Therefore, before using the Catastrophe Normalization Formula, a multi-dimensional fuzzy membership function with values between [0, 1] is generated using fuzzy mathematics [
38].
For positive indices, larger values are considered better and the fuzzy membership value of the index value is calculated from:
For negative indices, smaller values are considered better and the fuzzy membership value of the index value is calculated from:
For moderate indices, the fuzzy membership value of the index value is:
In Equations (15)–(17), and are upper and lower bounds, whose values will affect the final results. However, in practical application, the indicator values are not absolutely accurate; some are approximate estimates and have fuzziness, so the upper and lower bounds of each index value can be selected in an appropriate range.
Step 3: Calculate the catastrophic membership value of the index. According to the initial value of the fuzzy membership function, the normalization formula of the catastrophe model and evaluation criteria of the catastrophe model are used to perform comprehensive quantitative recursive operations. Finally, they are normalized into one parameter, and the total catastrophe membership value is obtained.
When using the catastrophe model for comprehensive analysis, three different evaluation criteria can be adopted depending on the properties of the actual problem:
- 1)
Non-complementary criterion. When the control variables of the system cannot replace each other, the minimum value from the corresponding mutation values of the control variables (a, b, c, d) is chosen as x; that is, .
- 2)
Complementary criterion. If the control variables of the system can compensate for other’s shortcomings, the average values of corresponding to the control variables a, b, c and d are selected.
- 3)
Over-threshold complementary criterion. The control variables of the system must reach a certain threshold before they can complement each other.
Step 4: Comprehensive evaluation and comparative analysis. Comparing the evaluation result with the risk grade, the problems reflected by the evaluation value of each index are comprehensively analysed, which provides a mechanism for performing the comprehensive evaluation and decision-making.
2.2.3. Improving the Catastrophe Risk Assessment Model
As the index system becomes more complex and the number of catastrophe types increase, the calculation results will increase and ability to discriminate a comprehensive catastrophe membership value will decrease. This problem has become a major drawback of the catastrophe assessment model.
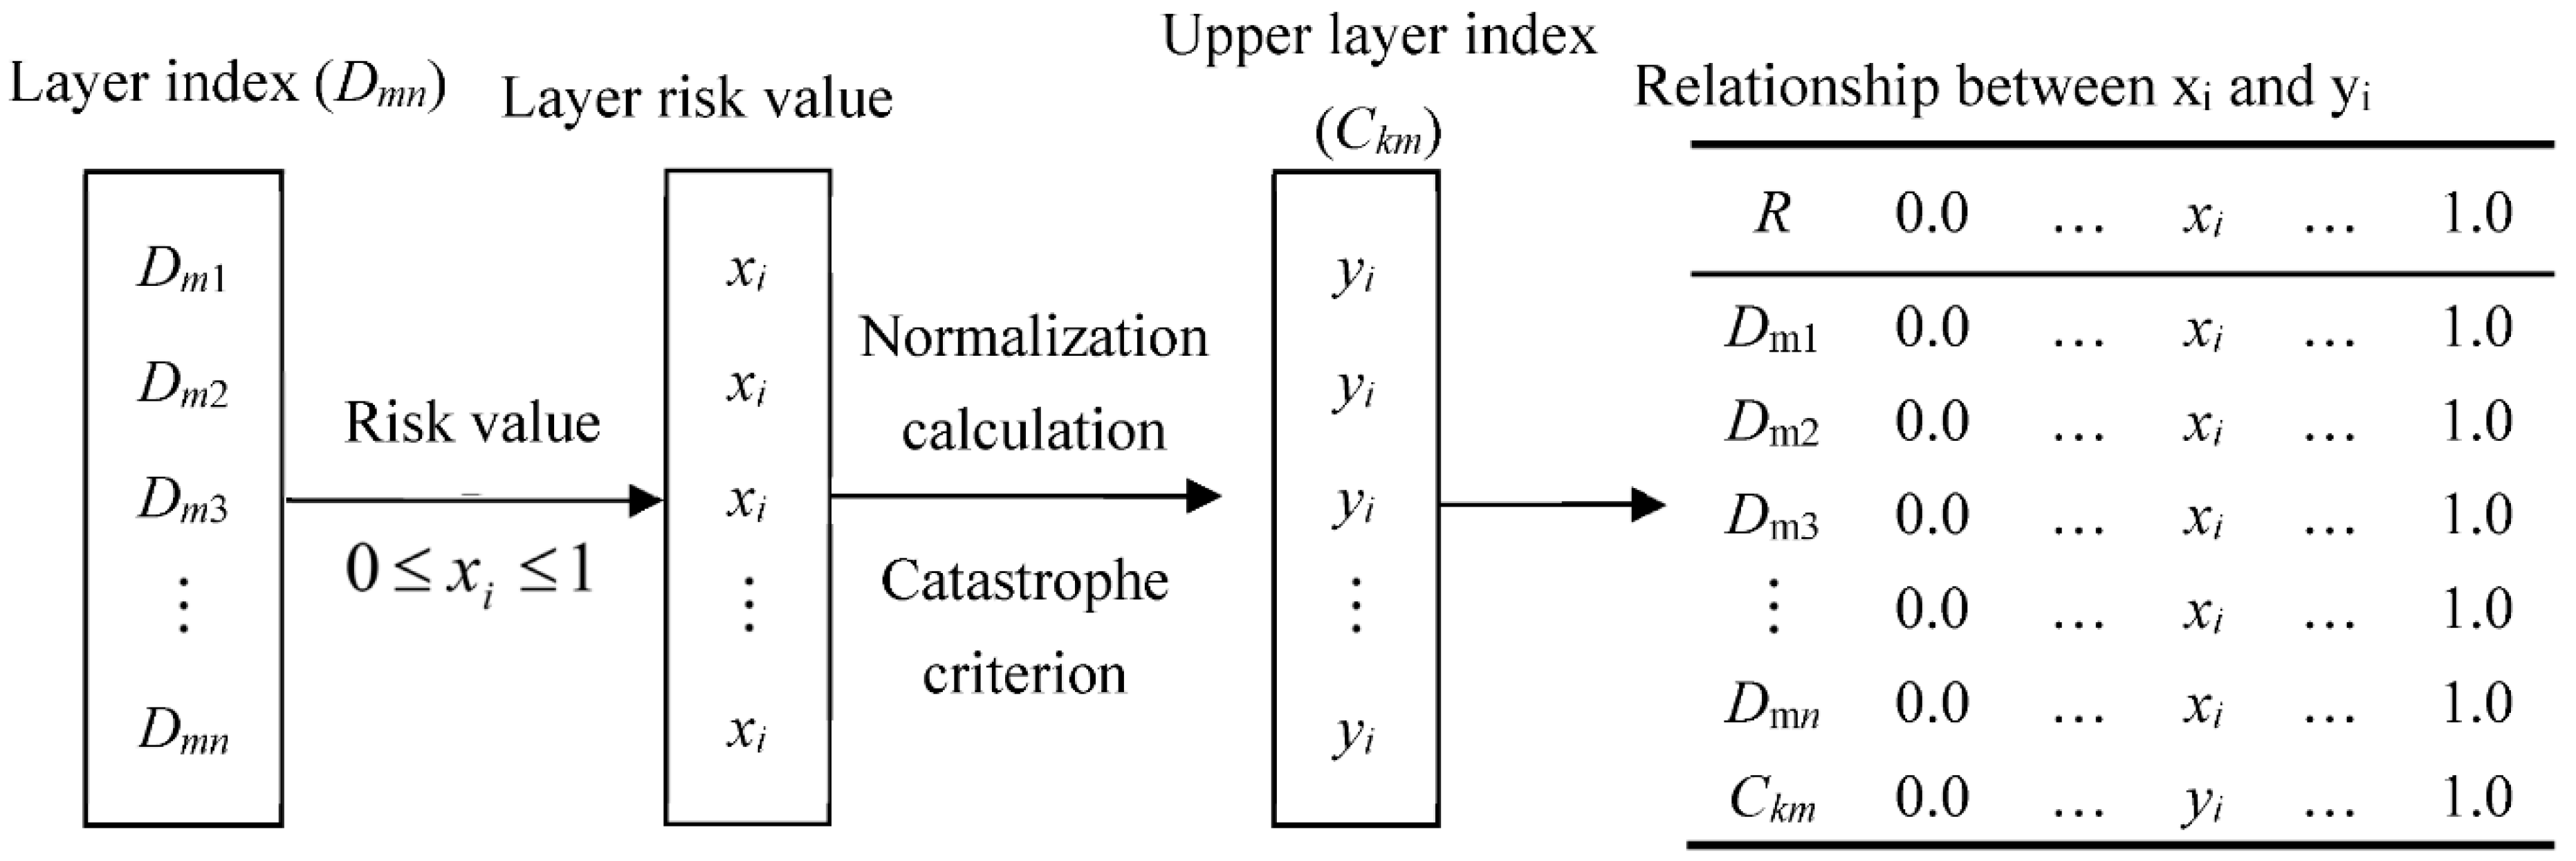
In this study, the hierarchical transformation method is adopted, and the values of the underlying indices are taken as . Using the catastrophe theory evaluation method, the catastrophe membership values of each index in the index layer are obtained. When n is large enough, the corresponding relationship table between the catastrophe membership value and the index of the index layer can be established. In this way, can be converted to the corresponding risk value.
Then, the risk value of each single index in the index layer is taken as
, and according to the Catastrophe Theory Evaluation Method, the corresponding relationship between the catastrophe membership value
and index
of the criterion layer is established until the target layer is calculated. Thus, each index in each layer, index, criteria and target, can be converted into a unified risk value, which can be used to evaluate the risk of each index (
Figure 1).
4. Results and Discussion
4.1. Construction of the Evaluation Index System of Shanghai Region
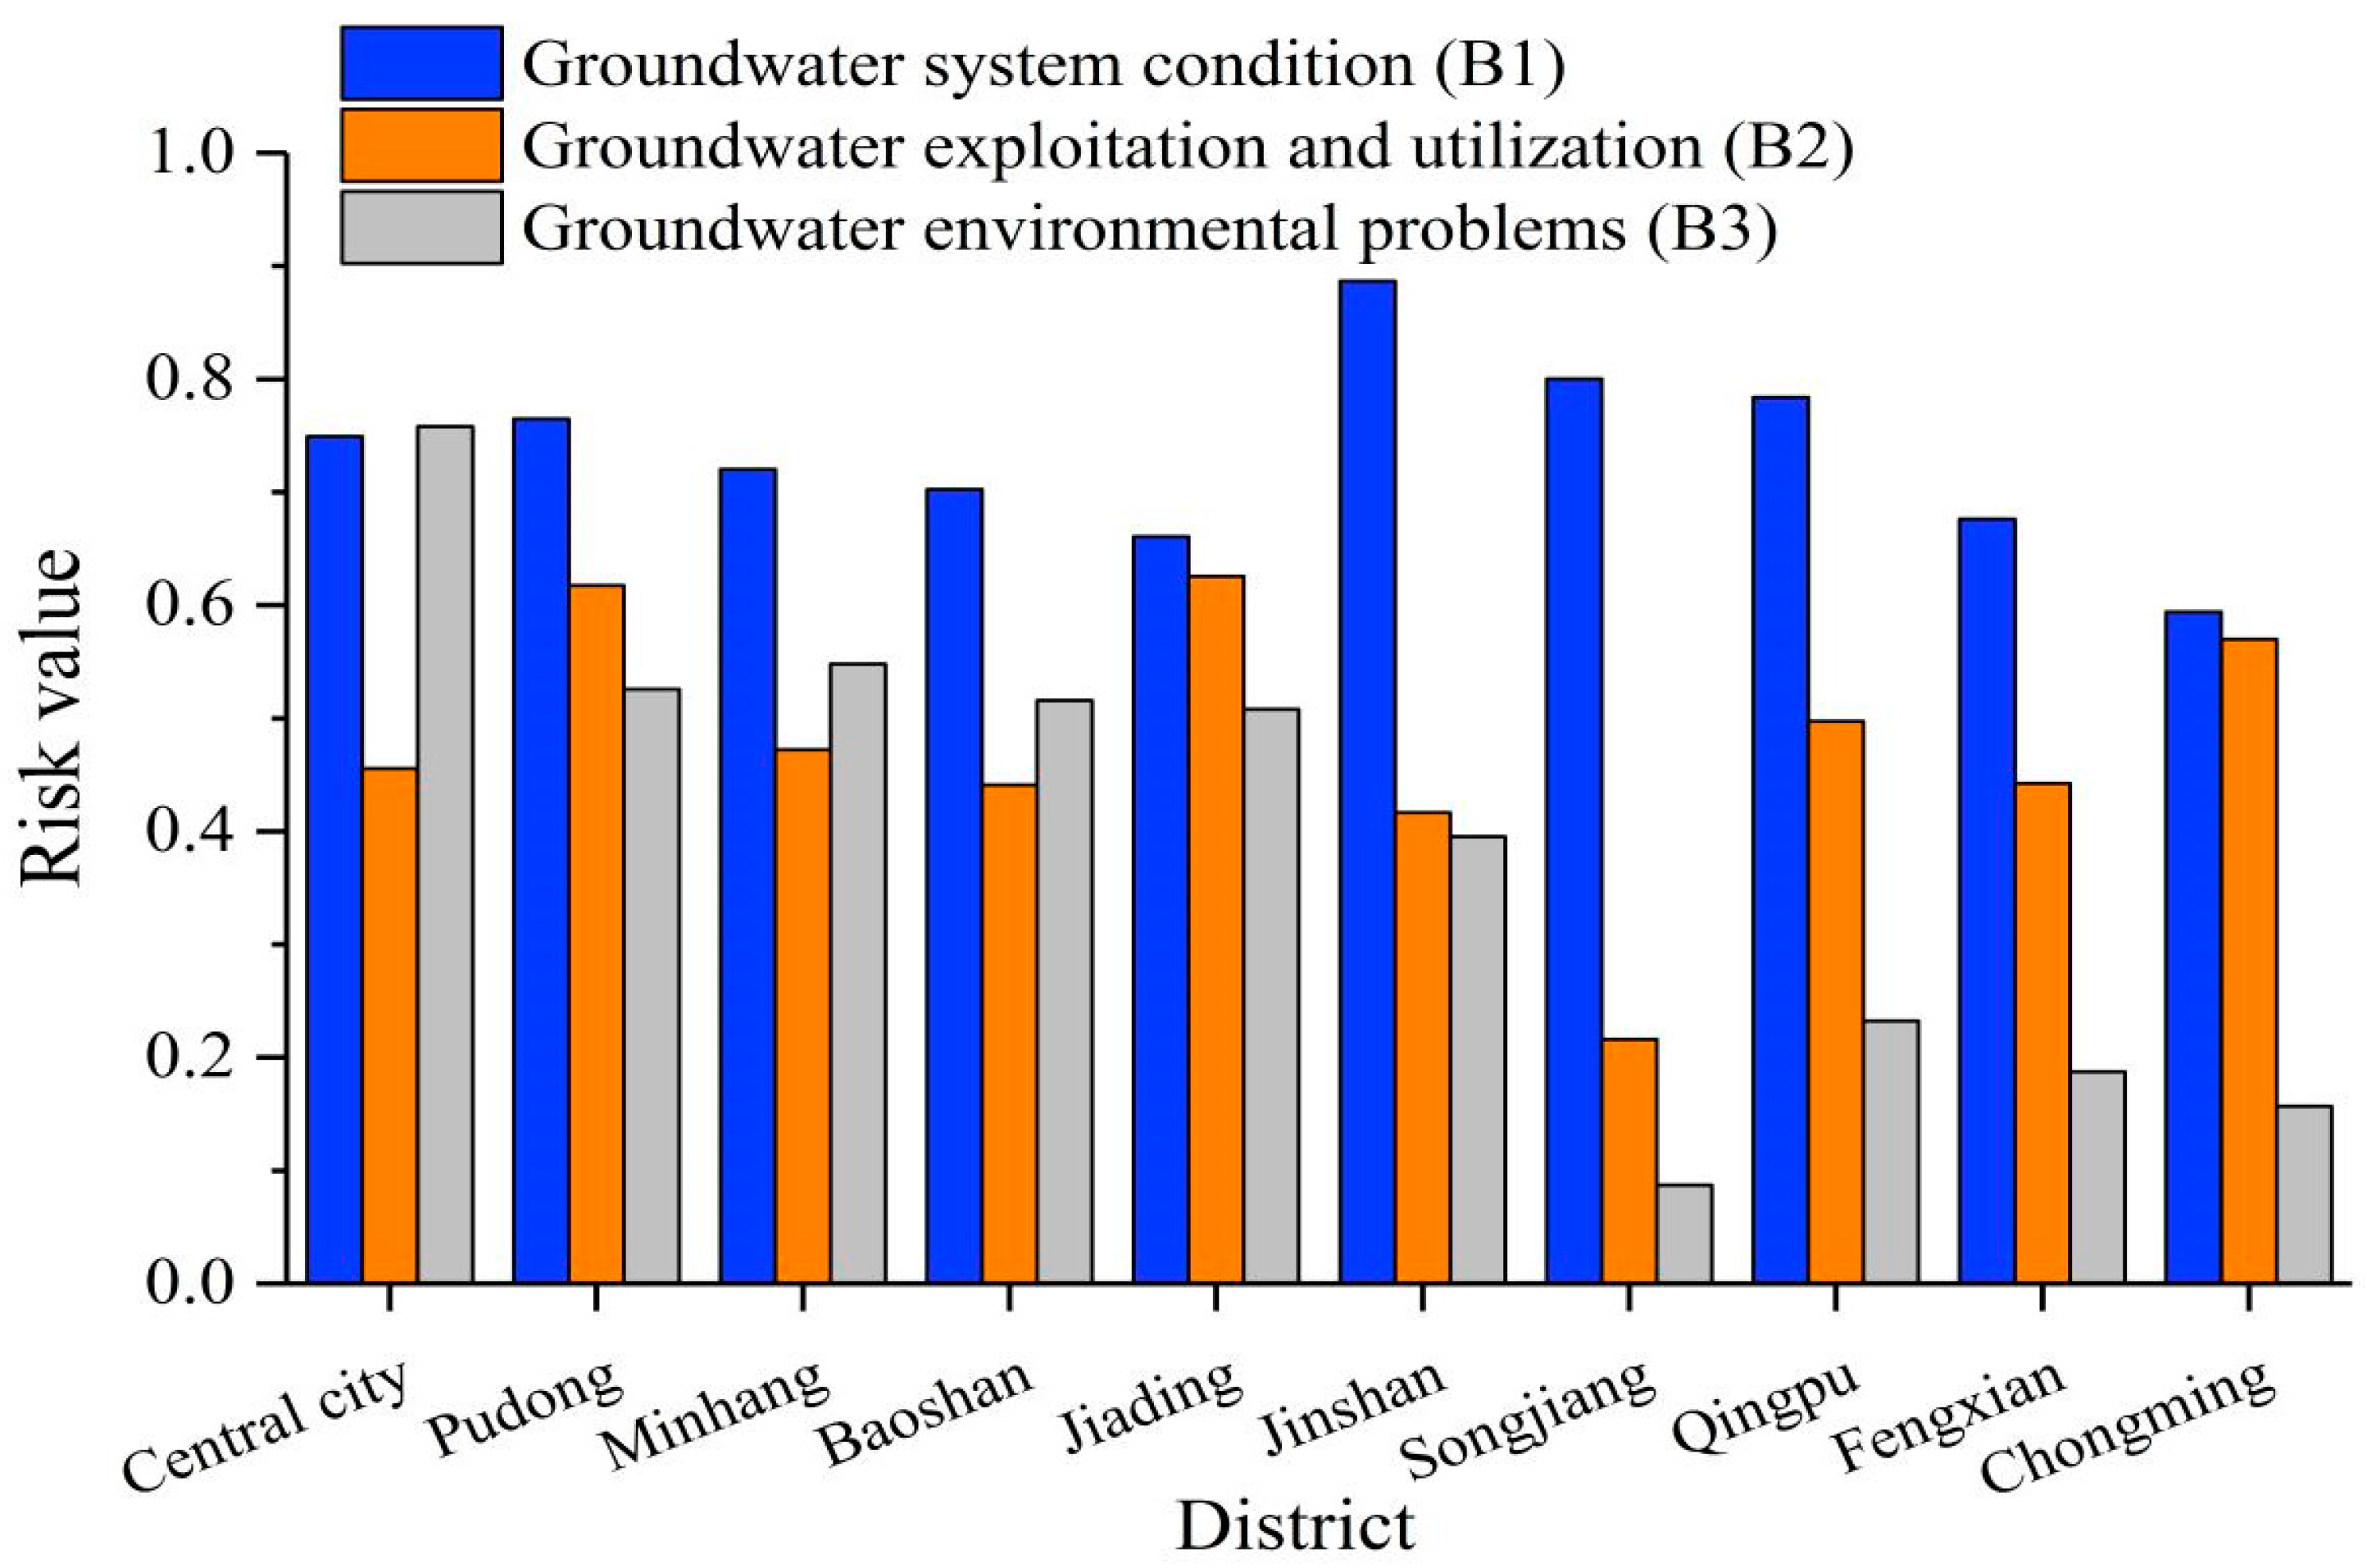
Based on the basic conditions and data for the study area, we define the groundwater system condition (B1), groundwater exploitation and utilization (B2) and groundwater environmental problems (B3) as the criterion layer and perform a multi-level comprehensive evaluation of groundwater exploitation and utilization risks in various districts (counties) and confined aquifers in Shanghai.
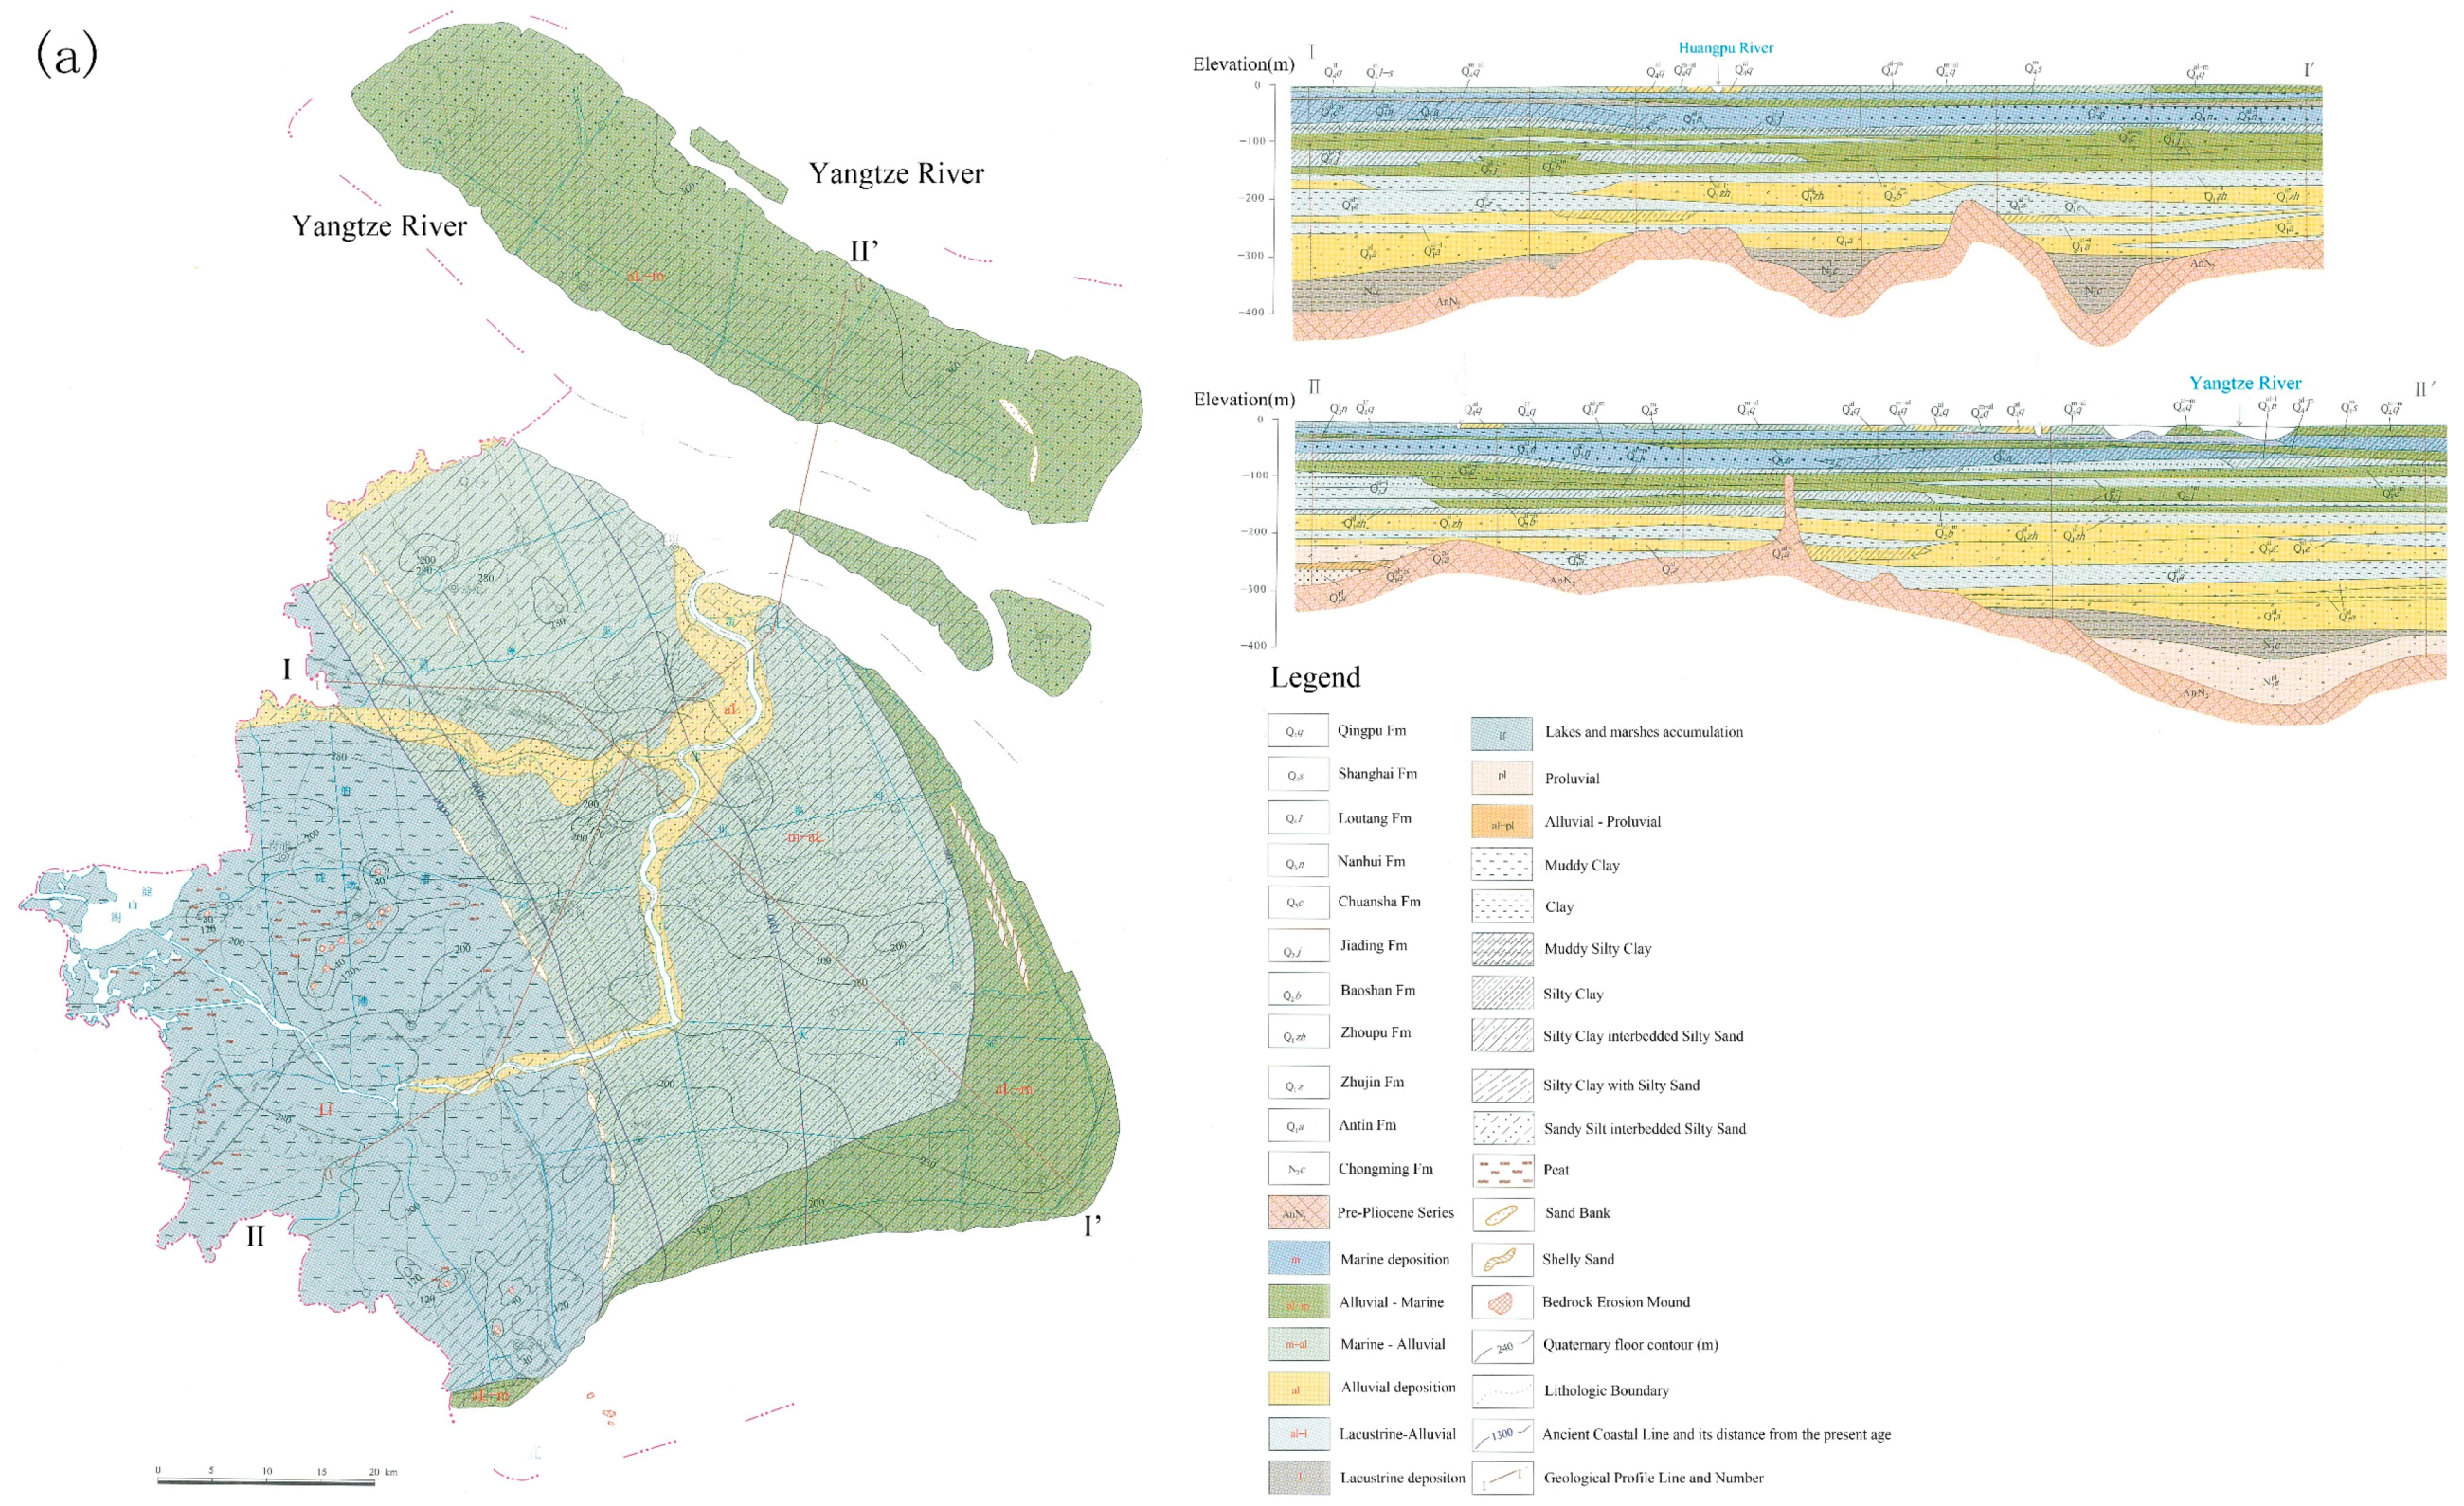
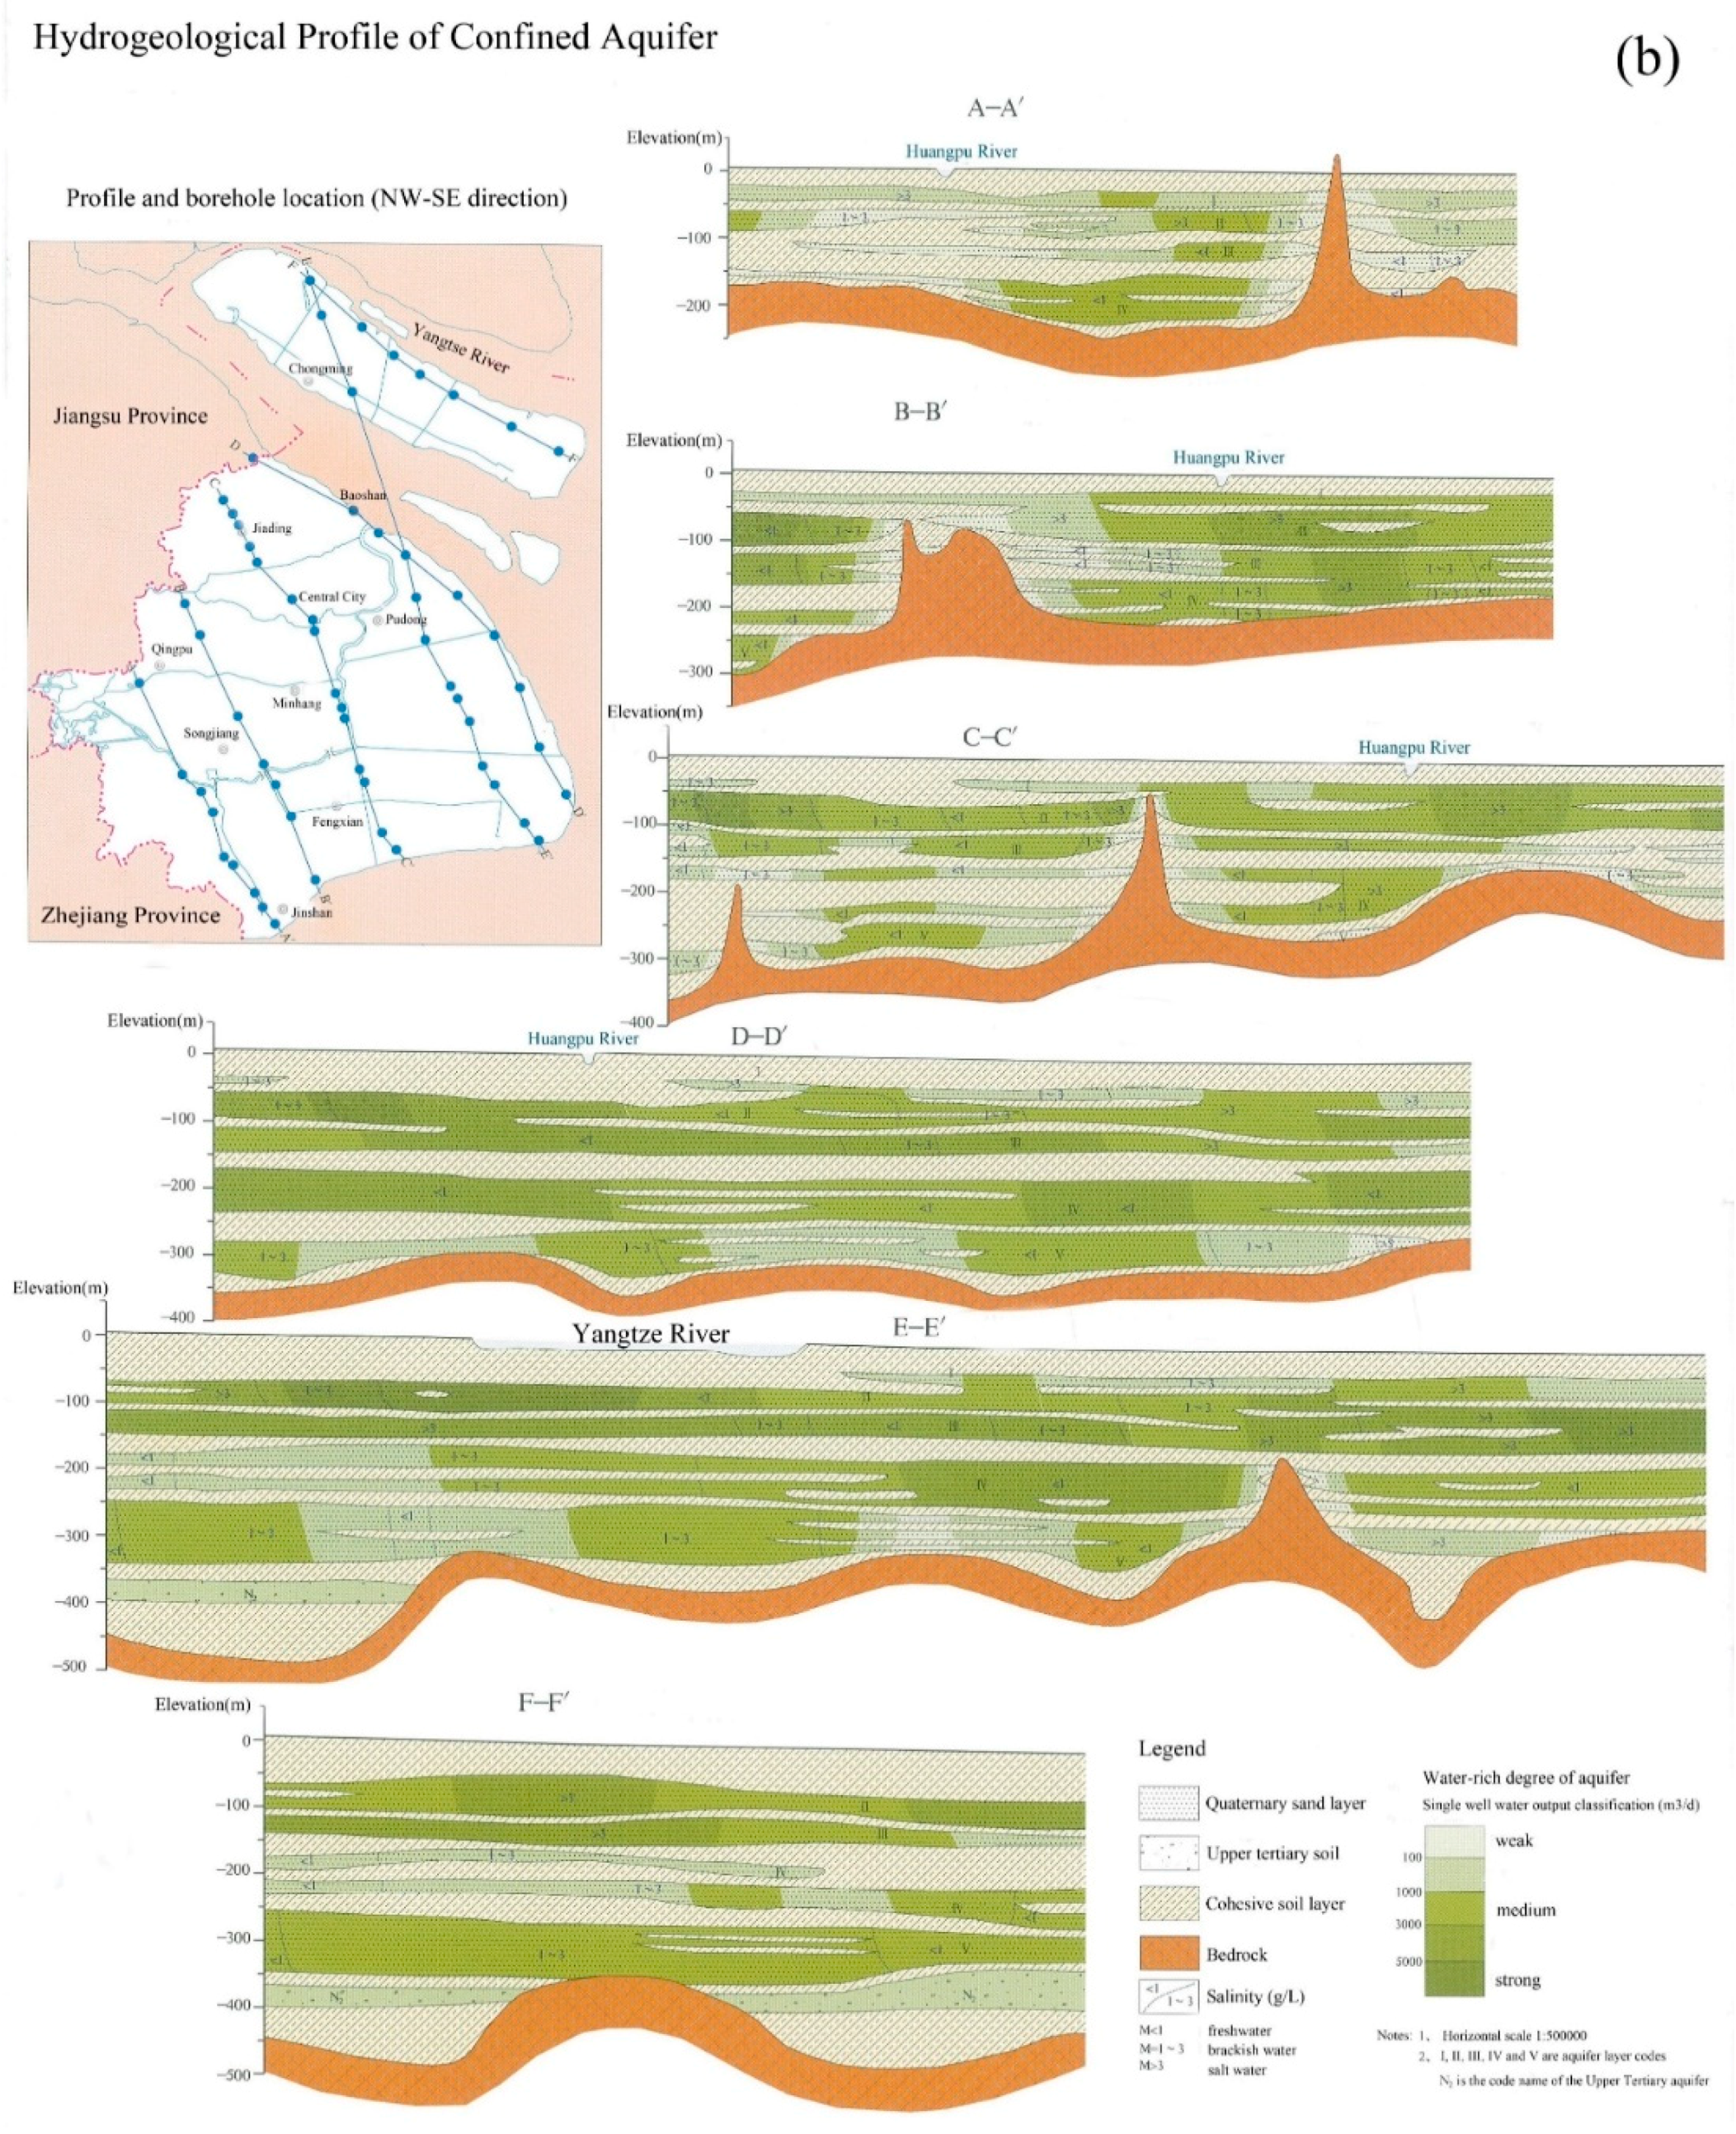
The groundwater system condition (B1) includes five indicators, which mainly reflect the constitutive characteristics of groundwater system. The hydraulic conductivity (C1) and the groundwater depth (C4) mainly reflect the characteristics of groundwater aquifer from water-bearing capacity and flow field; and the groundwater quantity exploitable (C2) is the allowable exploitation quantity obtained by water level and land subsidence as constraints; aquifer thickness (C3) and aquitard thickness (C5) are the main internal causes of land subsidence. Water storage coefficient, water-abundance, soil layer characteristics are not selected, mainly because the data are difficult to obtain.
Groundwater exploitation and utilization (B2) mainly reflects the current situation and characteristics of development and utilization. Groundwater exploitation (C6) and artificial recharge (C7) are the two main forms of groundwater exploitation and utilization in Shanghai, which belong to the indispensable indicators. In addition, if the area is rich in water, large-scale exploitation of groundwater will not necessarily lead to adverse consequences, on the contrary, in areas with poor water-rich, even a small amount of exploitation may lead to adverse consequences, and the degree of groundwater exploitation (C8) indicators can well characterize this situation.
Groundwater environmental problems (B3) include four indicators. The main problem in Shanghai is land subsidence caused by overexploitation of groundwater. Therefore, the accumulative land subsidence (C9), groundwater level change rate (C10) and area of groundwater overexploitation (C11) are selected to reflect the groundwater environmental problems. Because there is no groundwater overexploitation caused by groundwater pollution in Shanghai, TDS (C12) index is selected as the representative of groundwater quality index.
We note that socio-economic level indicators are not included in the evaluation system, because the influence of Shanghai’s social economy on groundwater development and utilization is mainly reflected in the amount of groundwater exploitation and recharge. We lack the relevant information on additional groundwater in Shanghai used for special purposes so are unable to conduct analyses on these. Choosing 2010 as the base year, the specific index system is shown in
Table 8.
4.2. Comprehensive Analysis of Groundwater Risk Assessment Results
First, according to the number of indices for each item, the basic catastrophic type is determined. Then, the normalized formula and evaluation criteria of the catastrophe type are selected to calculate the catastrophe membership value of each index in the evaluation system. Finally, the conversion relationship between the catastrophic membership value and standard risk value is established, and the membership value for each evaluation index in Shanghai is transformed into a unified risk value. The final comprehensive evaluation index values for groundwater exploitation and utilization risk in Shanghai are shown in
Table 9.
To evaluate the risk of groundwater exploitation and utilization, it is necessary to divide the risk value for each index into different grades using the risk evaluation criteria; this provides a mechanism for clearly evaluating the risk degree for each index. Considering the few prior studies evaluating risks from groundwater exploitation and utilization, we draw from the classifications for flood risk degree. Thus, five risk classes for groundwater exploitation and utilization are defined based on their comprehensive evaluation values (
Table 10). Ten districts in Shanghai are classified for risks from groundwater exploitation and utilization, the specific results are shown in
Figure 7 and
Figure 8.
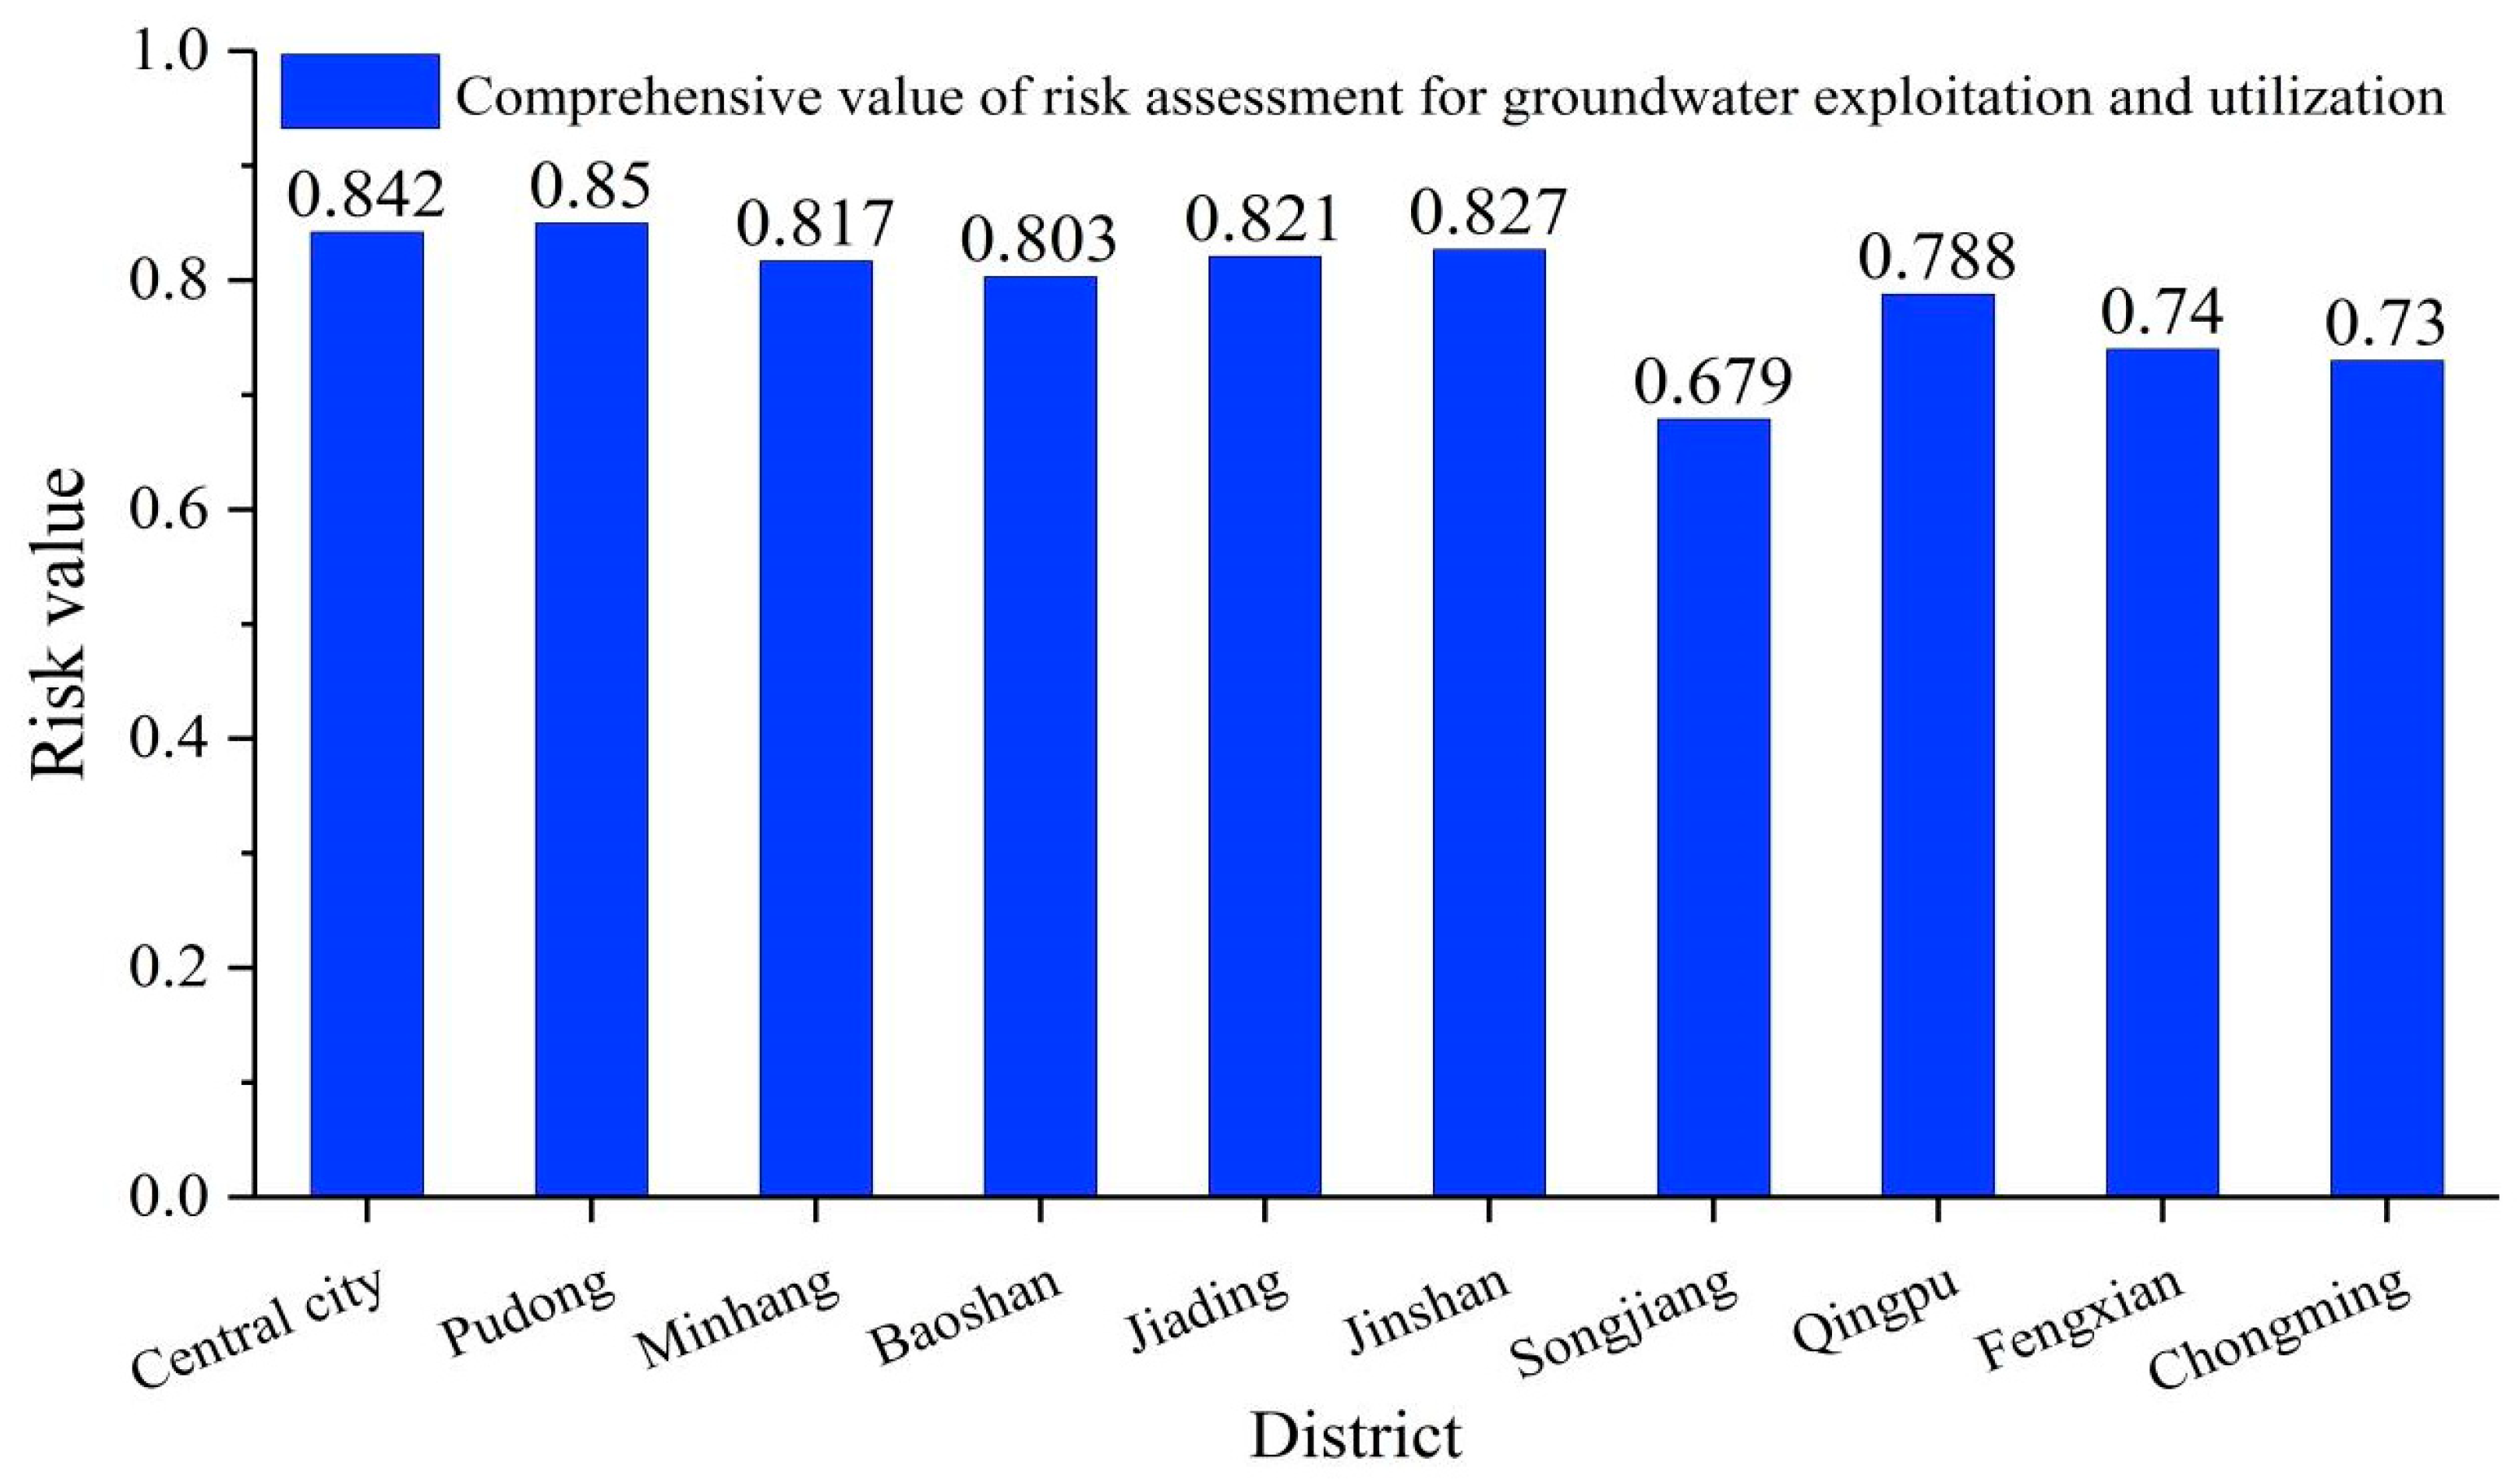
As shown in
Figure 8, comprehensive risk values for groundwater exploitation and utilization in Shanghai were estimated as between 0.679 and 0.850 in 2010. These values categorize Shanghai as having moderate risk, which indicates that the exploitation of groundwater will cause environmental problems and it is necessary to formulate a groundwater exploitation plan and take appropriate measures.
The comprehensive risk value for Songjiang District is 0.679, indicating that the low degree of groundwater utilization and the rising groundwater level provides good groundwater quality. Therefore, the comprehensive index risk value of Songjiang District is relatively low. The risk values for Chongming County and Fengxian District are 0.73 and 0.74, respectively, which indicate medium risk (0.5 ≤ R < 0.85).
Table 9 shows individual indices have higher risk value, such as the groundwater table change rate (C10) and groundwater exploitation (C6). The risk values for Minhang, Baoshan, Jiading and Qingpu District are around 0.80. Among them, Minhang, Baoshan and Jiading districts were challenged by earlier exploitation of groundwater, higher degree of utilization and serious environmental geological problems. Qingpu District is in two large groundwater depression cones, which results in weak bearing capacity of the system and slow recovery of the groundwater system after exploitation and utilization. The risk values of the central city, Pudong New Area and Jinshan District are relatively high, approaching 0.85. The central city was the earliest and most exploited area in Shanghai, which caused the most serious environmental geological problems and continues to pose a great threat to the safety of society, economic stability and human life. In the Pudong New Area, the population density and the intensity of urban construction have significantly impacted the groundwater system. As for Jinshan District, the aquifer V is basically bedrock with very poor water-quality, and aquifers III and IV are seriously over-exploited areas, which results in a relatively high risk of groundwater exploitation and utilization.
As we have shown, the proposed improved catastrophe theory evaluation method can be used to assess groundwater utilization with a quantitative assessment of risk. In the catastrophe evaluation model, the evaluation method of the underlying indicators directly affects the objective accuracy of the evaluation results. Our evaluation results are consistent with the observed status of the Shanghai groundwater system, which verifies that the index system and catastrophe evaluation model established in this evaluation process are reasonable, and the results are credible.
5. Conclusions
Groundwater is an important source of freshwater worldwide, especially in megacities where surface water resources are scarce. Therefore, groundwater exploitation and usage are inevitable. This study proposed a risk evaluation index system and established a catastrophe assessment model for groundwater exploitation and utilization risk in Shanghai using catastrophe theory. The main conclusions and novel aspects are as follows:
The multi-layer index system of risk evaluation of groundwater exploitation and utilization was constructed based on the features of groundwater system and its risks. Because groundwater system is an open and complex giant system, there is no clear and unified definition of groundwater exploitation and utilization risk. To comprehensively and quantitatively assess the risks of groundwater system caused by the unreasonable utilization, the multi indexes assessment is an effective method. Therefore, this paper constructed a multi-layer index system, which including three layers: target layer, criterion layer and index layer. The target layer is the risk state of groundwater exploitation and utilization, which consists of four indicators: groundwater system condition (B1), groundwater exploitation and utilization (B2), groundwater environmental problems (B3) and socio-economic level condition (B4).
The dimension of control variables of catastrophe type was extended to the unlimited. In practice, the research objects are considerably complex, and the dimension of control variables of the objects are far more than four. However, the number of the control variables of the primary catastrophe theory is less than four, which limited the application of this theory (e.g., in risk assessment). Therefore, we deduced and extended the type of cusp-like catastrophe, which breaks through the limitation of numbers of the control variables of catastrophe evaluation method. In addition, the catastrophic membership values directly obtained by the method have no risk implications and cannot be used to assess the risk. Therefore, this paper converted the catastrophic membership value of the index into the corresponding standard risk levels based on the relationship between the catastrophic membership and risk grades.
Finally, this study evaluated the exploitation and utilization risk of the groundwater system in Shanghai region. The comprehensive risk value of groundwater exploitation and utilization in all districts (counties) of Shanghai is moderate, between 0.68 and 0.85. The exploitation and utilization risk in Central City and Pudong are higher among the districts. These results can provide some information to understand and manage the groundwater risk in Shanghai region.


