1. Introduction
Precipitation is one of the primary drivers of the hydrological cycle and, thus of great importance in hydrological simulation [
1], which is a major water resources management tool for forecasting floods and droughts. The accuracy of hydrological simulation depends on the spatial and temporal resolution of precipitation data [
2]. Precipitation is more difficult than other atmospheric variables, such as temperature and relative humidity, to measure accurately because of its great spatial and temporal variability. Precipitation data are usually observed and collected using rainfall gauges and meteorological radar networks, but these measurement devices are usually geographically sparse and inadequate to fully capture the spatial and temporal variability of precipitation [
3,
4]. This situation is serious in China because of the country’s complex topography and relatively unevenly distributed economic resources [
5]. Satellite-based and reanalysis precipitation datasets have been effective in complementing traditionally obtained precipitation data as remote sensing and computing technologies have developed [
6,
7,
8].
Satellite-based precipitation measurement technology uses visible data, infrared imaging, and passive microwave detection to gather precipitation data [
9,
10]. However, satellite-based datasets inevitably contain errors due to the measurement technology [
11], the sampling method [
12], and the retrieval algorithms [
13]. Reanalysis datasets are created from a combination of observed data and model forecasts [
14]. The accuracy of reanalysis datasets is determined by the observed forcing data, the data assimilation method, and the prediction model(s) used [
15]. Many studies have shown that the accuracy of reanalysis datasets is highly related to both the observing system and the assimilated data [
16,
17]. Hodges et al. [
18] showed that newer reanalysis datasets, including the European Centre for Medium-Range Weather Forecasts (ECMWF) Interim Re-Analysis (ERA-Interim,
https://www.ecmwf.int/en/forecasts/datasets/archive-datasets/reanalysis-datasets/era-interim), the National Aeronautics and Space Administration Modern Era Retrospective-Analysis for Research and Applications (NASA’s MERRA,
https://climatedataguide.ucar.edu/climate-data/nasa-merra), and the NCEP-CFSR (
http://globalweather.tamu.edu) perform better than older datasets (such as the 25-year Japanese Reanalysis (JRA-25,
http://jra.kishou.go.jp/JRA-25/index_en.html)) in identifying recurrent extratropical cyclones because of the improvements in models, observations, and data assimilation in numerical weather prediction model (NWP) systems. Ebisuzaki and Zhang [
19] compared NCEP-CFSR to a set of operational analyses for 2007 and found that NCEP-CFSR captured daily variability in precipitation better than the older reanalyses. The performance of NCEP-CFSR was attributed to major improvements in modeling, observation, and the method of data assimilation. Dee et al. [
20] found that observed data have a significant effect on the initialization of an NWP model and thus on the quality of reanalysis data. They also found that successive generations of atmospheric reanalysis data have improved in quality as a result of better models, better input data, and better assimilation methods. Smith et al. [
21] showed that even when the model and data assimilation method do not change, observational data density, type, and quality change over time. These observational changes can introduce spurious errors into reanalysis data. Model bias can also act on the data to introduce errors, as can the method of observations. There are many widely used satellite-based and reanalysis datasets, such as PERSIANN-CDR, 3B42V7, and NCEP-CFSR, available on the internet. Detailed information about these datasets, such as resolution, coverage, and data sources, is shown in
Table 1. However, because of the errors inherent in satellite-based datasets and the high dependency of reanalysis datasets on the observation system, these datasets may not be suitable for hydrological applications in East Asia [
22]. The CMADS were developed by Dr. Xianyong Meng from the China Agricultural University (CAU) and has received worldwide attention [
5,
23,
24,
25,
26,
27,
28,
29,
30]. It using STMAS assimilation techniques as well as big data projection and processing methods to compensate for the fact that few specialized meteorological products were developed for East Asia [
22].
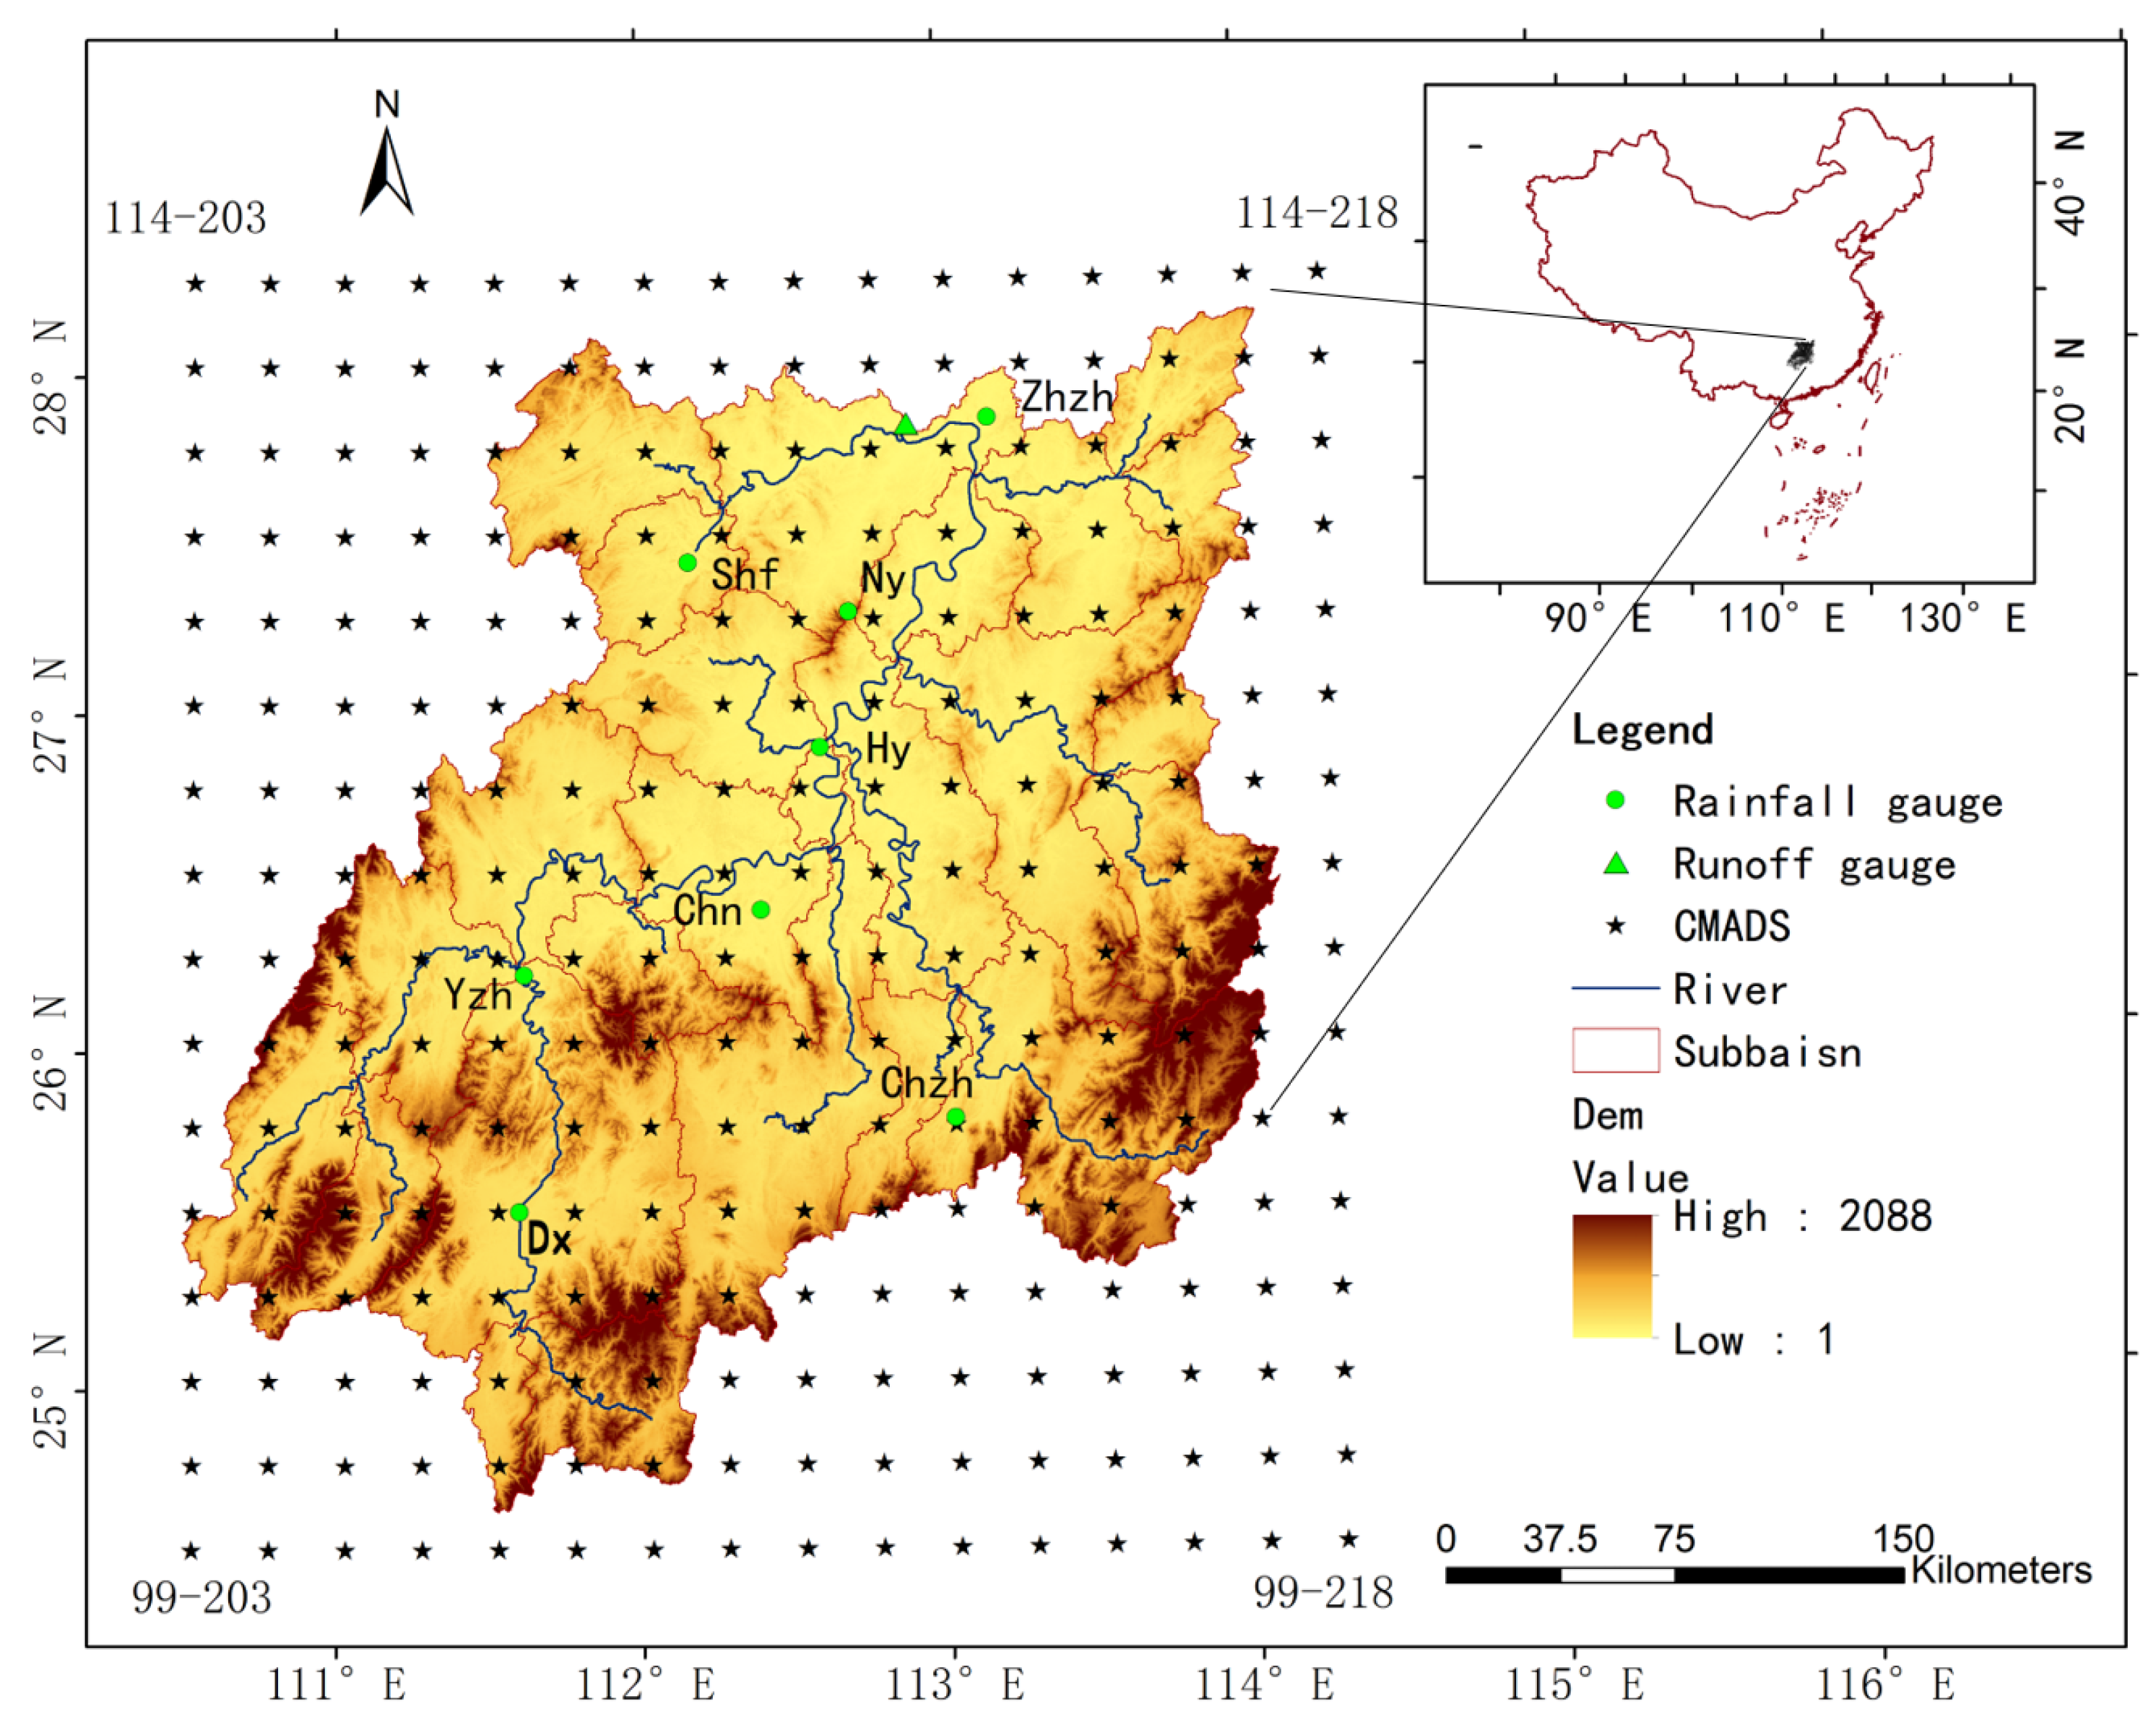
In this study, four precipitation products that include two precipitation reanalysis datasets (NCEP-CFSR and CMADS) and two satellite-based precipitation datasets (3B42V7 and PERSIANN-CDR) were analyzed and evaluated in a hydrological application for the Xiang River basin, a humid watershed in central China. These datasets all have high spatial and temporal resolution. 3B42V7 is the latest release of the post-real time product (
ftp://disc2.nascom.nasa.gov/ftp/data/s4pa//TRMM_L3/). Precipitation estimates from 3B42V7 have been evaluated in many studies [
31,
32,
33,
34]. PERSIANN-CDR is a new retrospective multi satellite-based precipitation dataset for long hydrological and climate studies [
35], which is available online (
ftp://data.ncdc.noaa.gov/cdr/persiann/files/). The dataset is produced by the PERSIANN algorithm [
36] using gridded satellite (GridSat-B1) infrared data. Studies of precipitation estimates from PERSIANN-CDR are relatively few, and most of them compare PERSIANN-CDR predictions with ground-based precipitation observations [
37,
38,
39]. only a small number are related to hydrological applications of PERSIANN-CDR [
40]. The daily NCEP-CFSR data, which are in a format that the SWAT model can use, are available online (
http://globalweather.tamu.edu). NCEP-CFSR datasets are widely used in many studies [
41,
42,
43]. CMADS, which we use in this study, is a new reanalysis product which can be downloaded from the internet (
www.cmads.org). There are very few studies that use CMADS because of its novelty, and they investigate northern arid areas such as the Juntanghu watershed [
26,
27,
44], the Manas River basin [
28], and the Qinghai-Tibet Plateau [
30]. However, the error characteristics of precipitation products vary with climatic regions, seasons, surface conditions, storm regimes, and altitudes [
45] which necessitates the analysis and evaluation of hydrological applications of precipitation dataset products in different regions. To the best of our knowledge, this is the first study of a hydrological application of CMADS in Central China.
This paper is organized as follows.
Section 2 describes the materials and methods used in the study.
Section 3 presents a detailed evaluation of the results given by the precipitation products, and a further discussion is given in
Section 4. Lastly,
Section 5 provides a short conclusion based on the results of our study.
4. Discussion
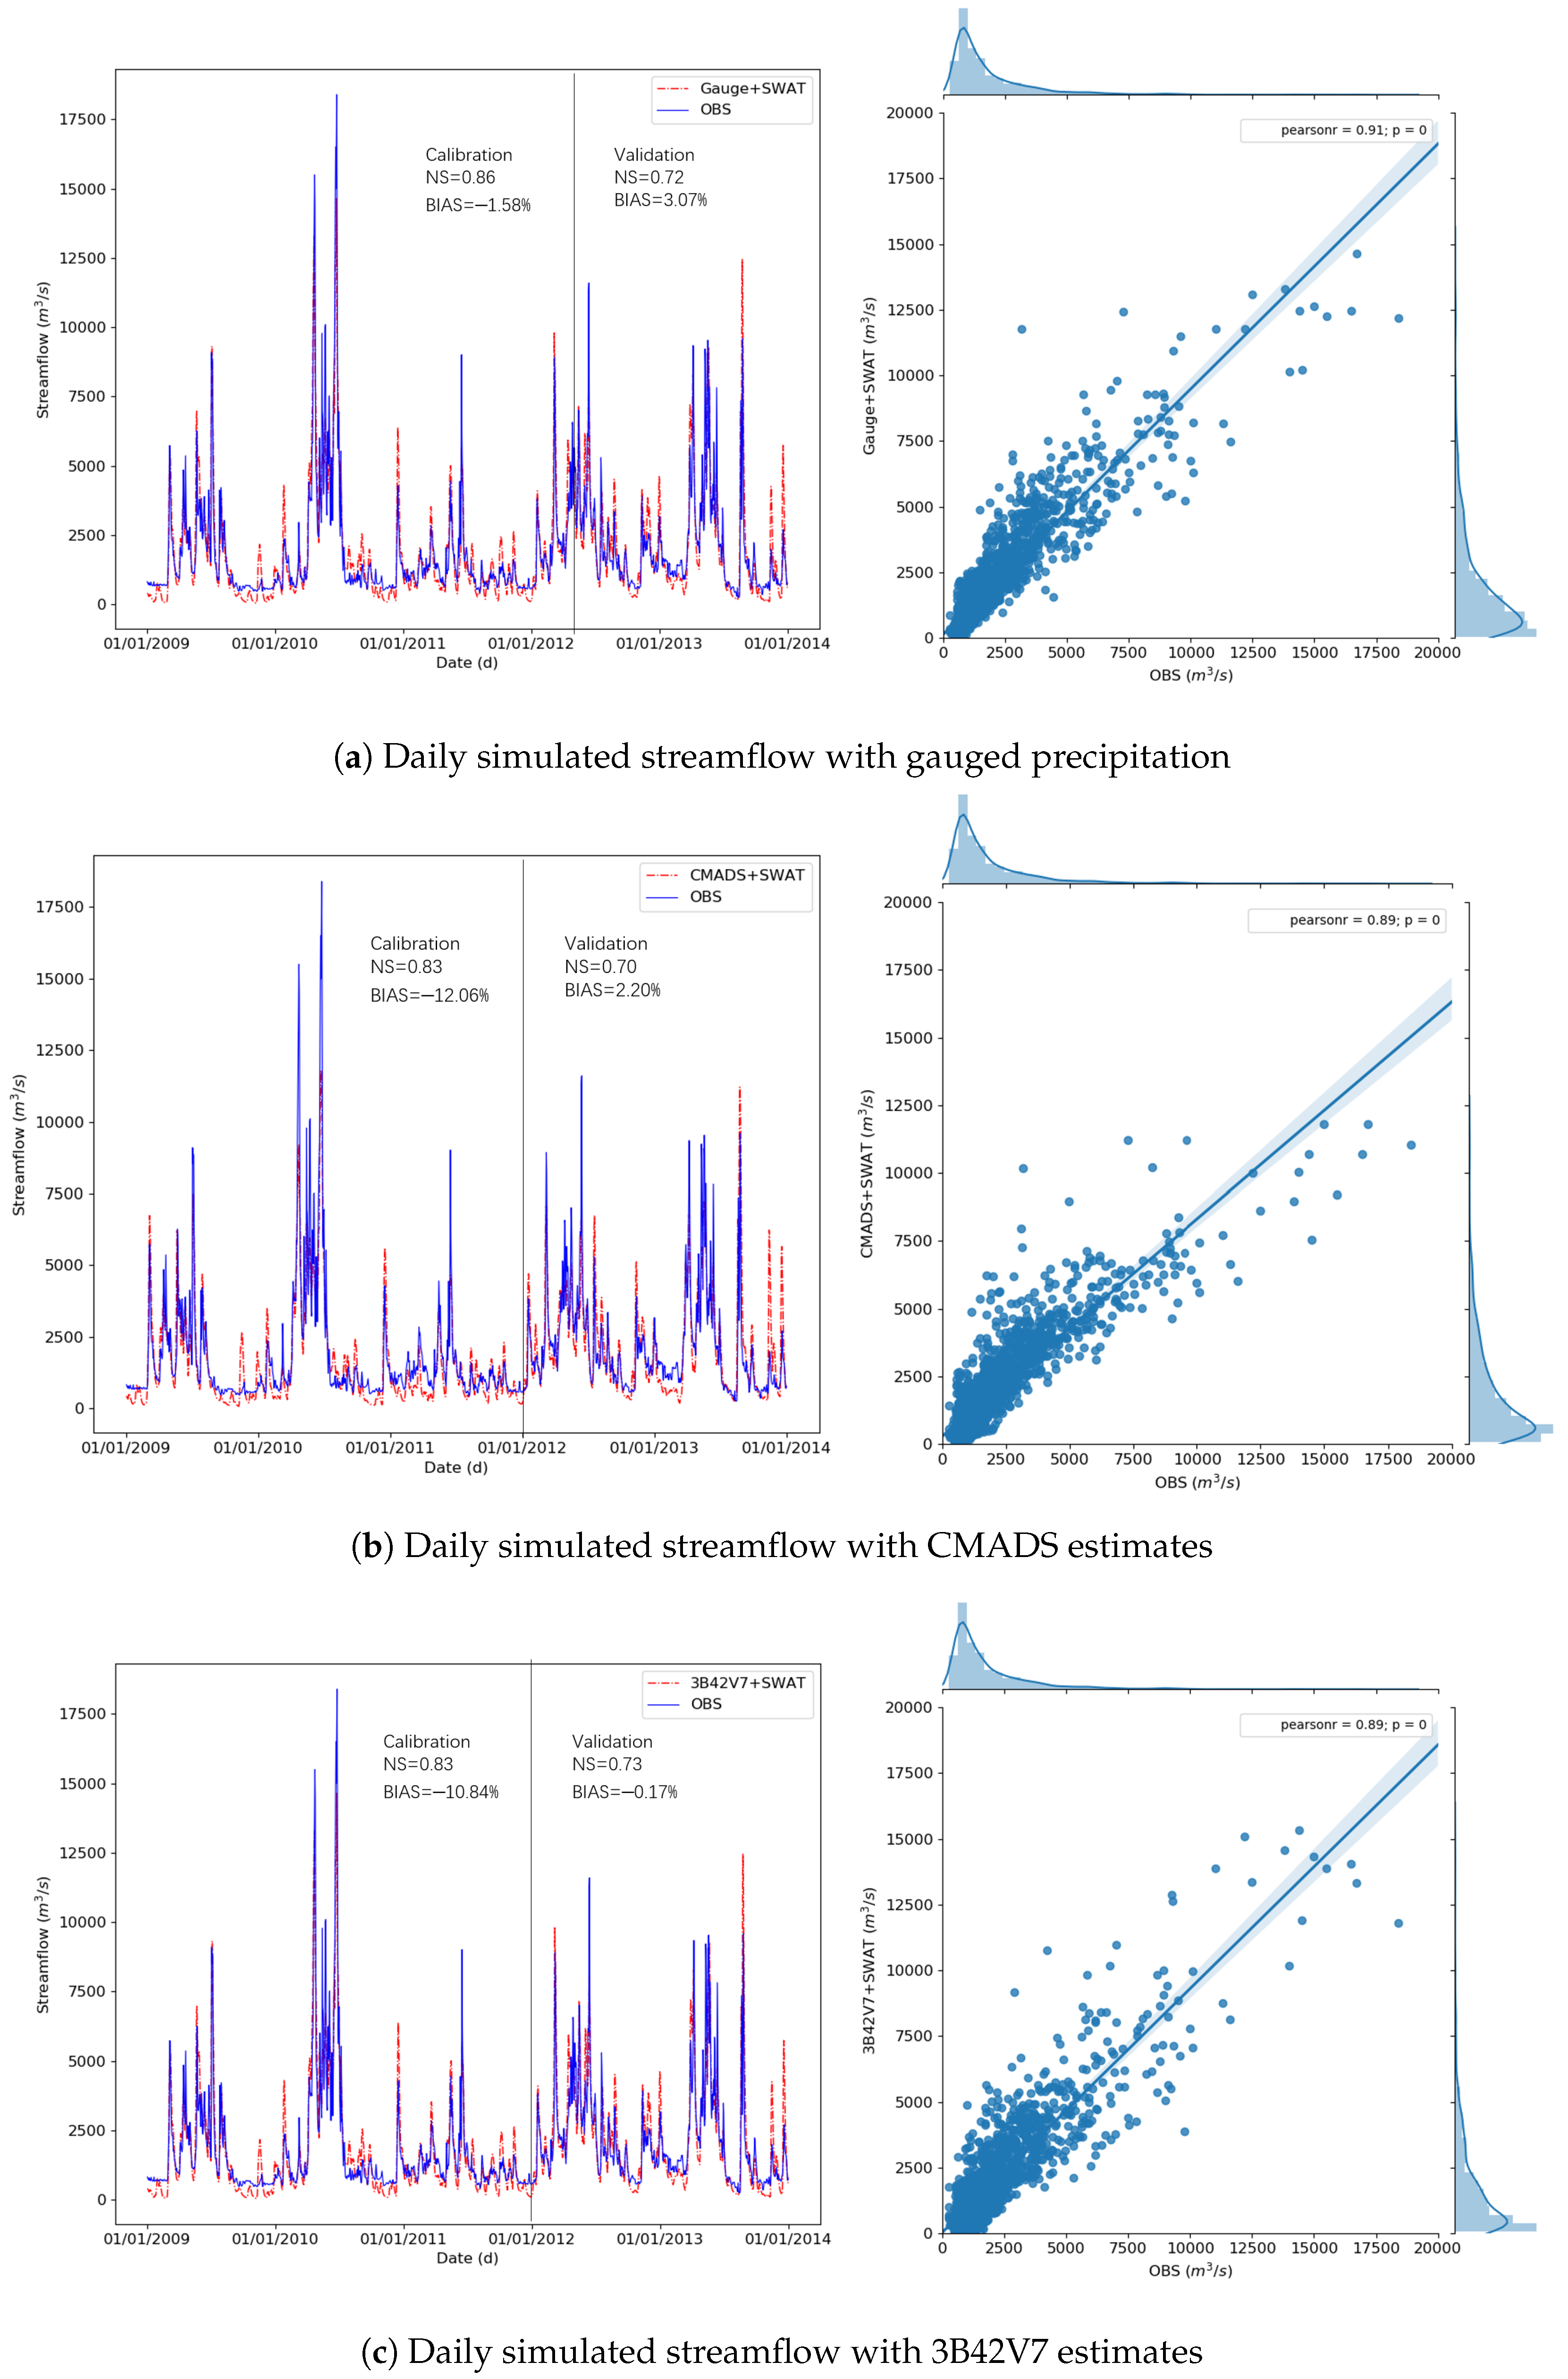
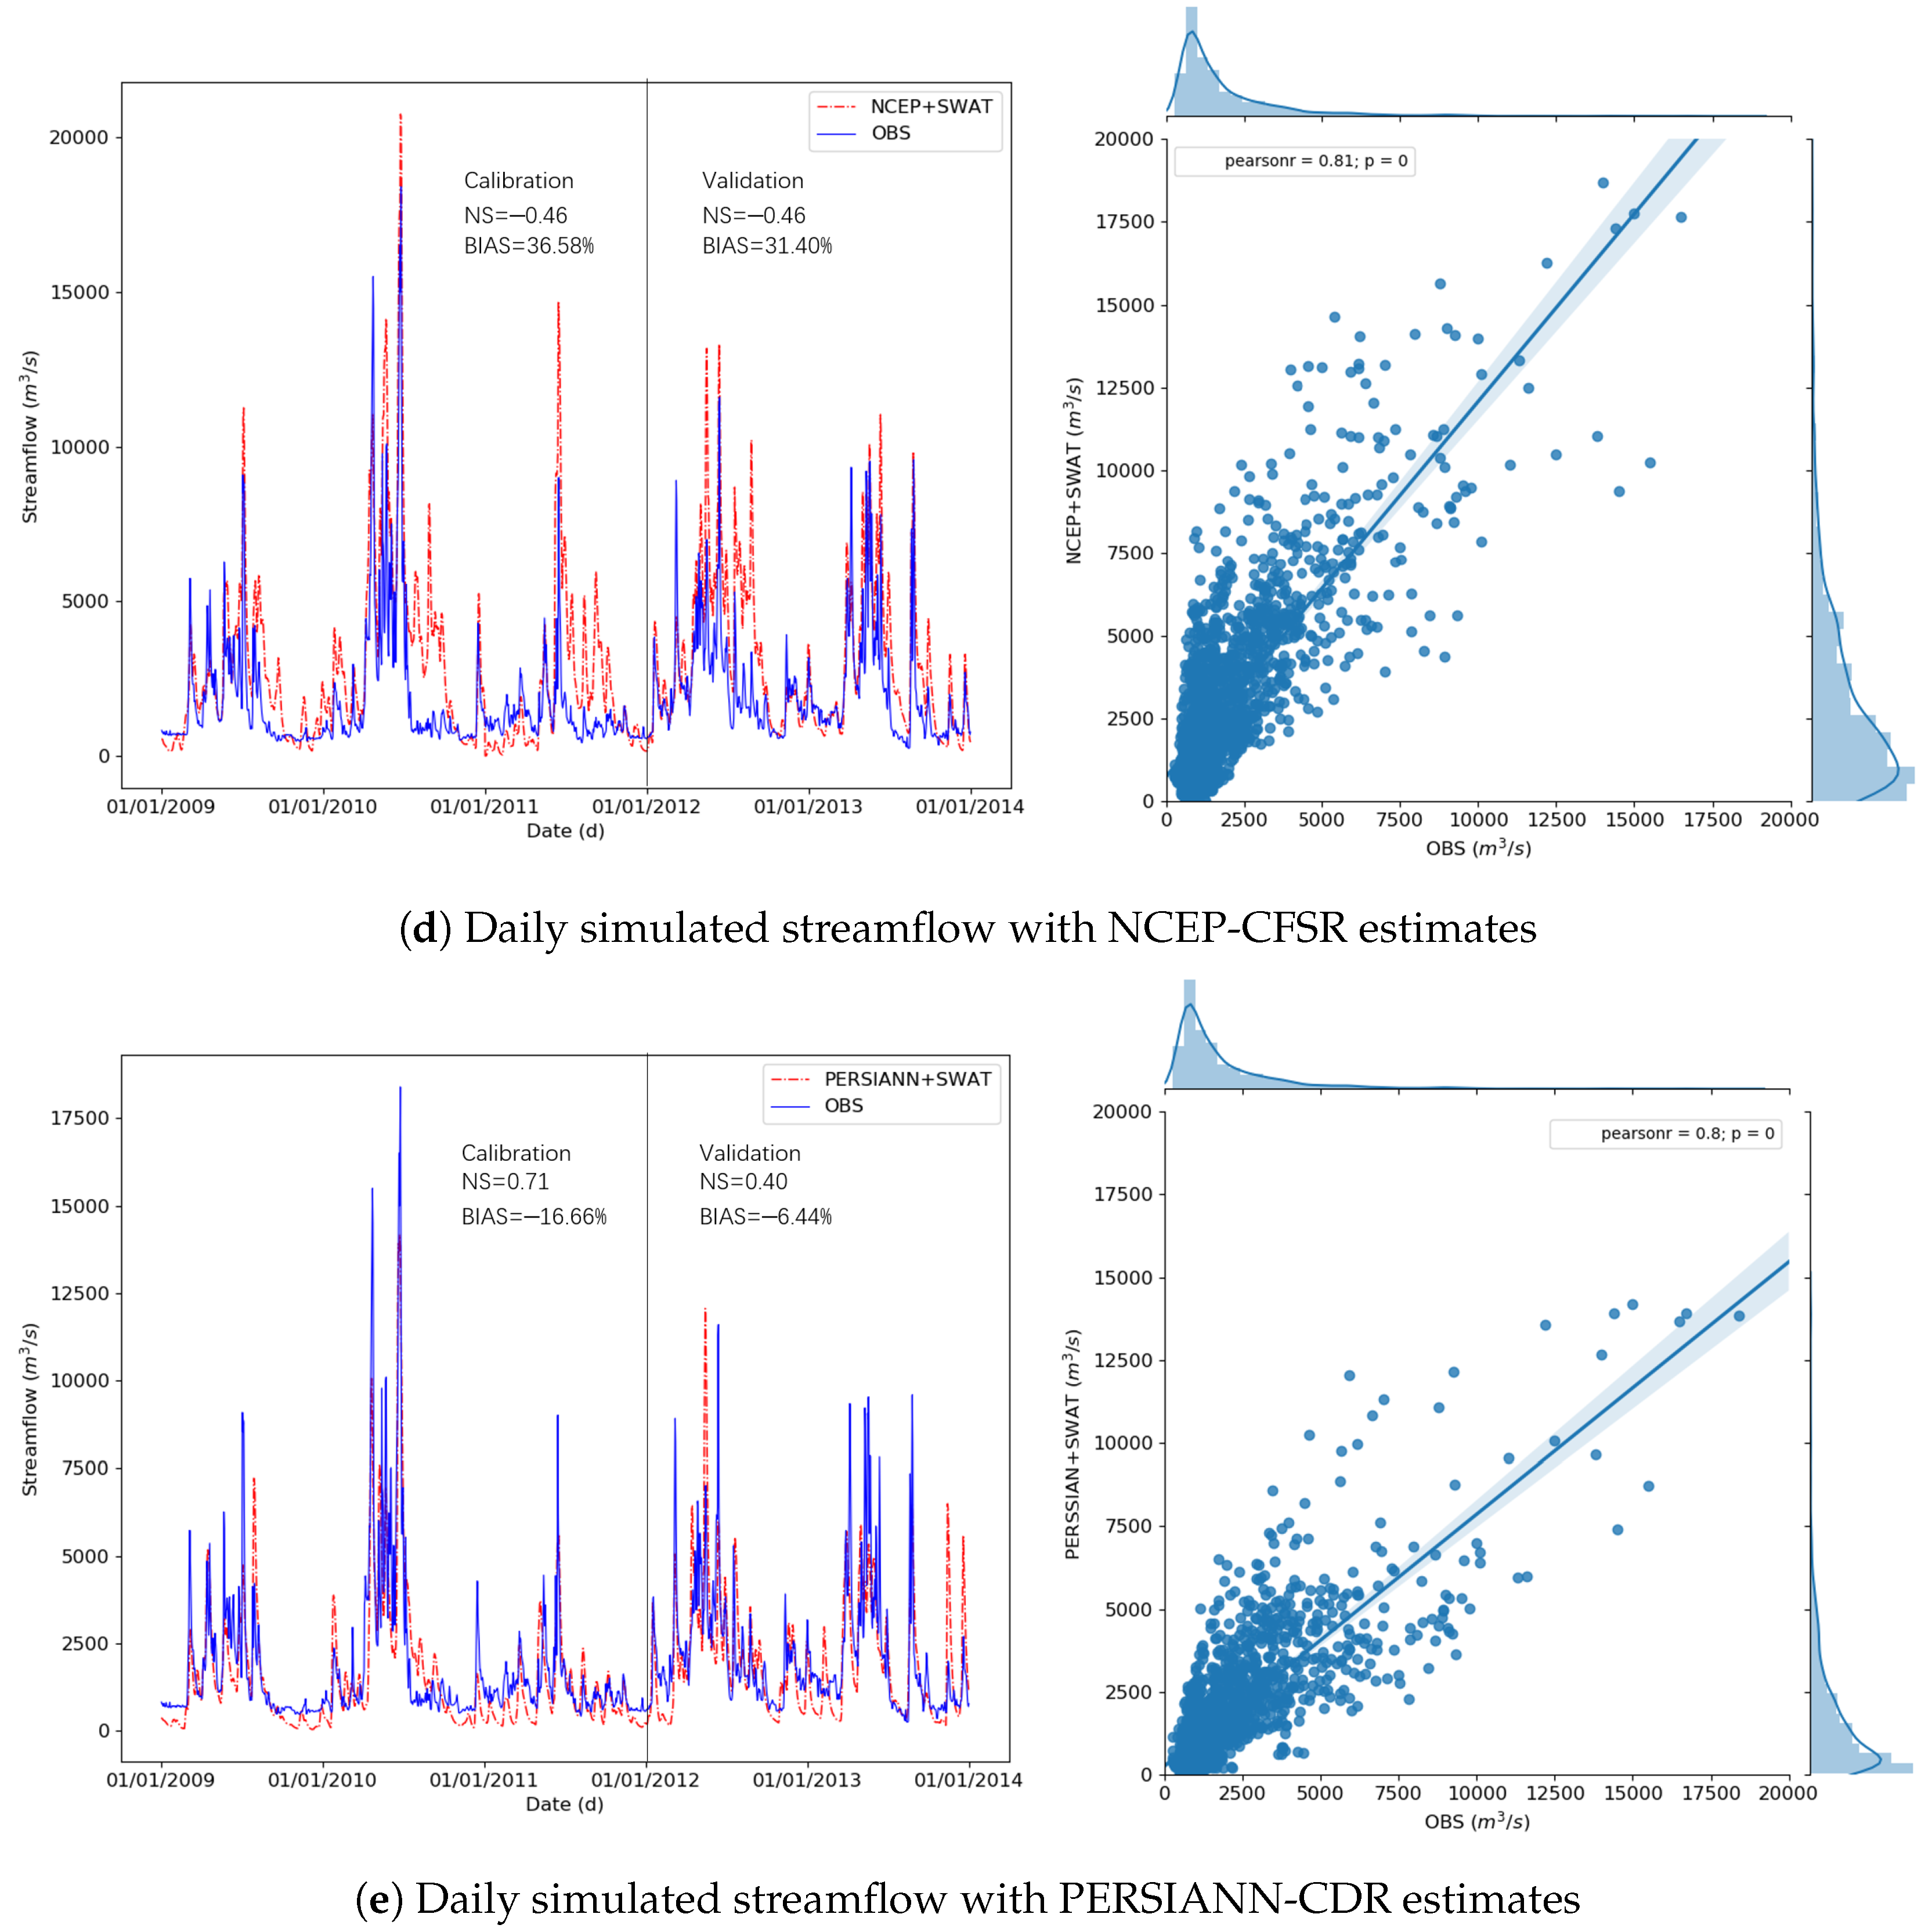
Hydrological simulation is thoroughly influenced by the inputs to the hydrological models. Clearly, there is some linkage between the precipitation estimates and the hydrological simulation. However, a precipitation dataset that shows good linear correlation with gauge observations does not necessarily produce a good hydrological simulation. For example, NCEP-CFSR was best linearly correlated with gauge observations but produced the worst hydrological simulation because of its substantial overestimation and relatively low probability of detecting rainfall events. A comparison of the CC and BIAS values for CMADS and NCEP-CFSR shows that these two precipitation datasets perform similarly. However, CMADS produces a much better hydrological simulation than NCEP-CFSR. This shows that the POD of precipitation estimates has a significant effect on hydrological simulation. Streamflow responds to rainfall events. If a precipitation dataset does not detect most of the rainfall events, it cannot adequately capture streamflow. The influence of FAR on the hydrological simulation cannot be determined from the results; however, it can be analyzed conceptually. If other indexes of precipitation datasets, such as CC, BIAS, and POD, are kept constant, a lower value of FAR will indicate a better hydrological simulation. In addition, the estimates of a precipitation dataset are not always consistent with its hydrological predictions. For example, the BIAS for precipitation estimates and for hydrological simulations are not consistent. The value of BIAS for the CMADS precipitation estimate was −28.67% at the whole basin scale but −12.06% for the simulated streamflow in both daily and monthly timesteps. Many factors may contribute to a difference between precipitation estimates and their corresponding hydrological outputs, such as: (1) areal precipitation is calculated by the Theissen polygon method, which does not consider the impact of topography whereas the SWAT model considers the elevation of precipitation grids; (2) the transformation of precipitation to streamflow is a very complicated nonlinear process, so error will not be transferred from precipitation to streamflow linearly; and (3) there are simplifications in the SWAT model, such as the assumptions in the universal soil loss equation for estimating sediment loss, the assumptions in calculating flow velocity in a river, and the ignoring of some hydrological processes that are considered to have relatively small impact on total hydrology.
The spatial resolution of the areas of comparison (from grids of different sizes to the whole basin) can substantially affect the results of the evaluation. [
47] used the GPM IMERG dataset and found that the spatial resolution of the areas compared had a significant effect on the results. The dataset gives better results when the temporal and spatial resolutions are downscaled. However, the spatial resolution of a precipitation dataset has a significant impact on the hydrological simulation. Many studies have shown that in hydrological modeling with high spatial and temporal resolutions, datasets can better characterize streamflow [
55]. Thus precipitation datasets with higher spatial and temporal resolution are needed to provide good hydrological simulations. However, as mentioned above, increased spatial and temporal resolution of these datasets worsens the model performance when compared to observation datasets, which can adversely affect the simulation. High-resolution datasets also increase model processing time. From a practical engineering perspective, a more efficient way to combine the input data preparation and the hydrological modeling, that considers both modeling accuracy and modeling efficiency, needs to be further studied [
56]. In this study, CMADS performs better in modeling accuracy and is more usable because of its SWAT compatible data structure. Hence, considering the modeling accuracy and modeling efficiency, CMADS are more applicable in practical streamflow simulation.
5. Conclusions
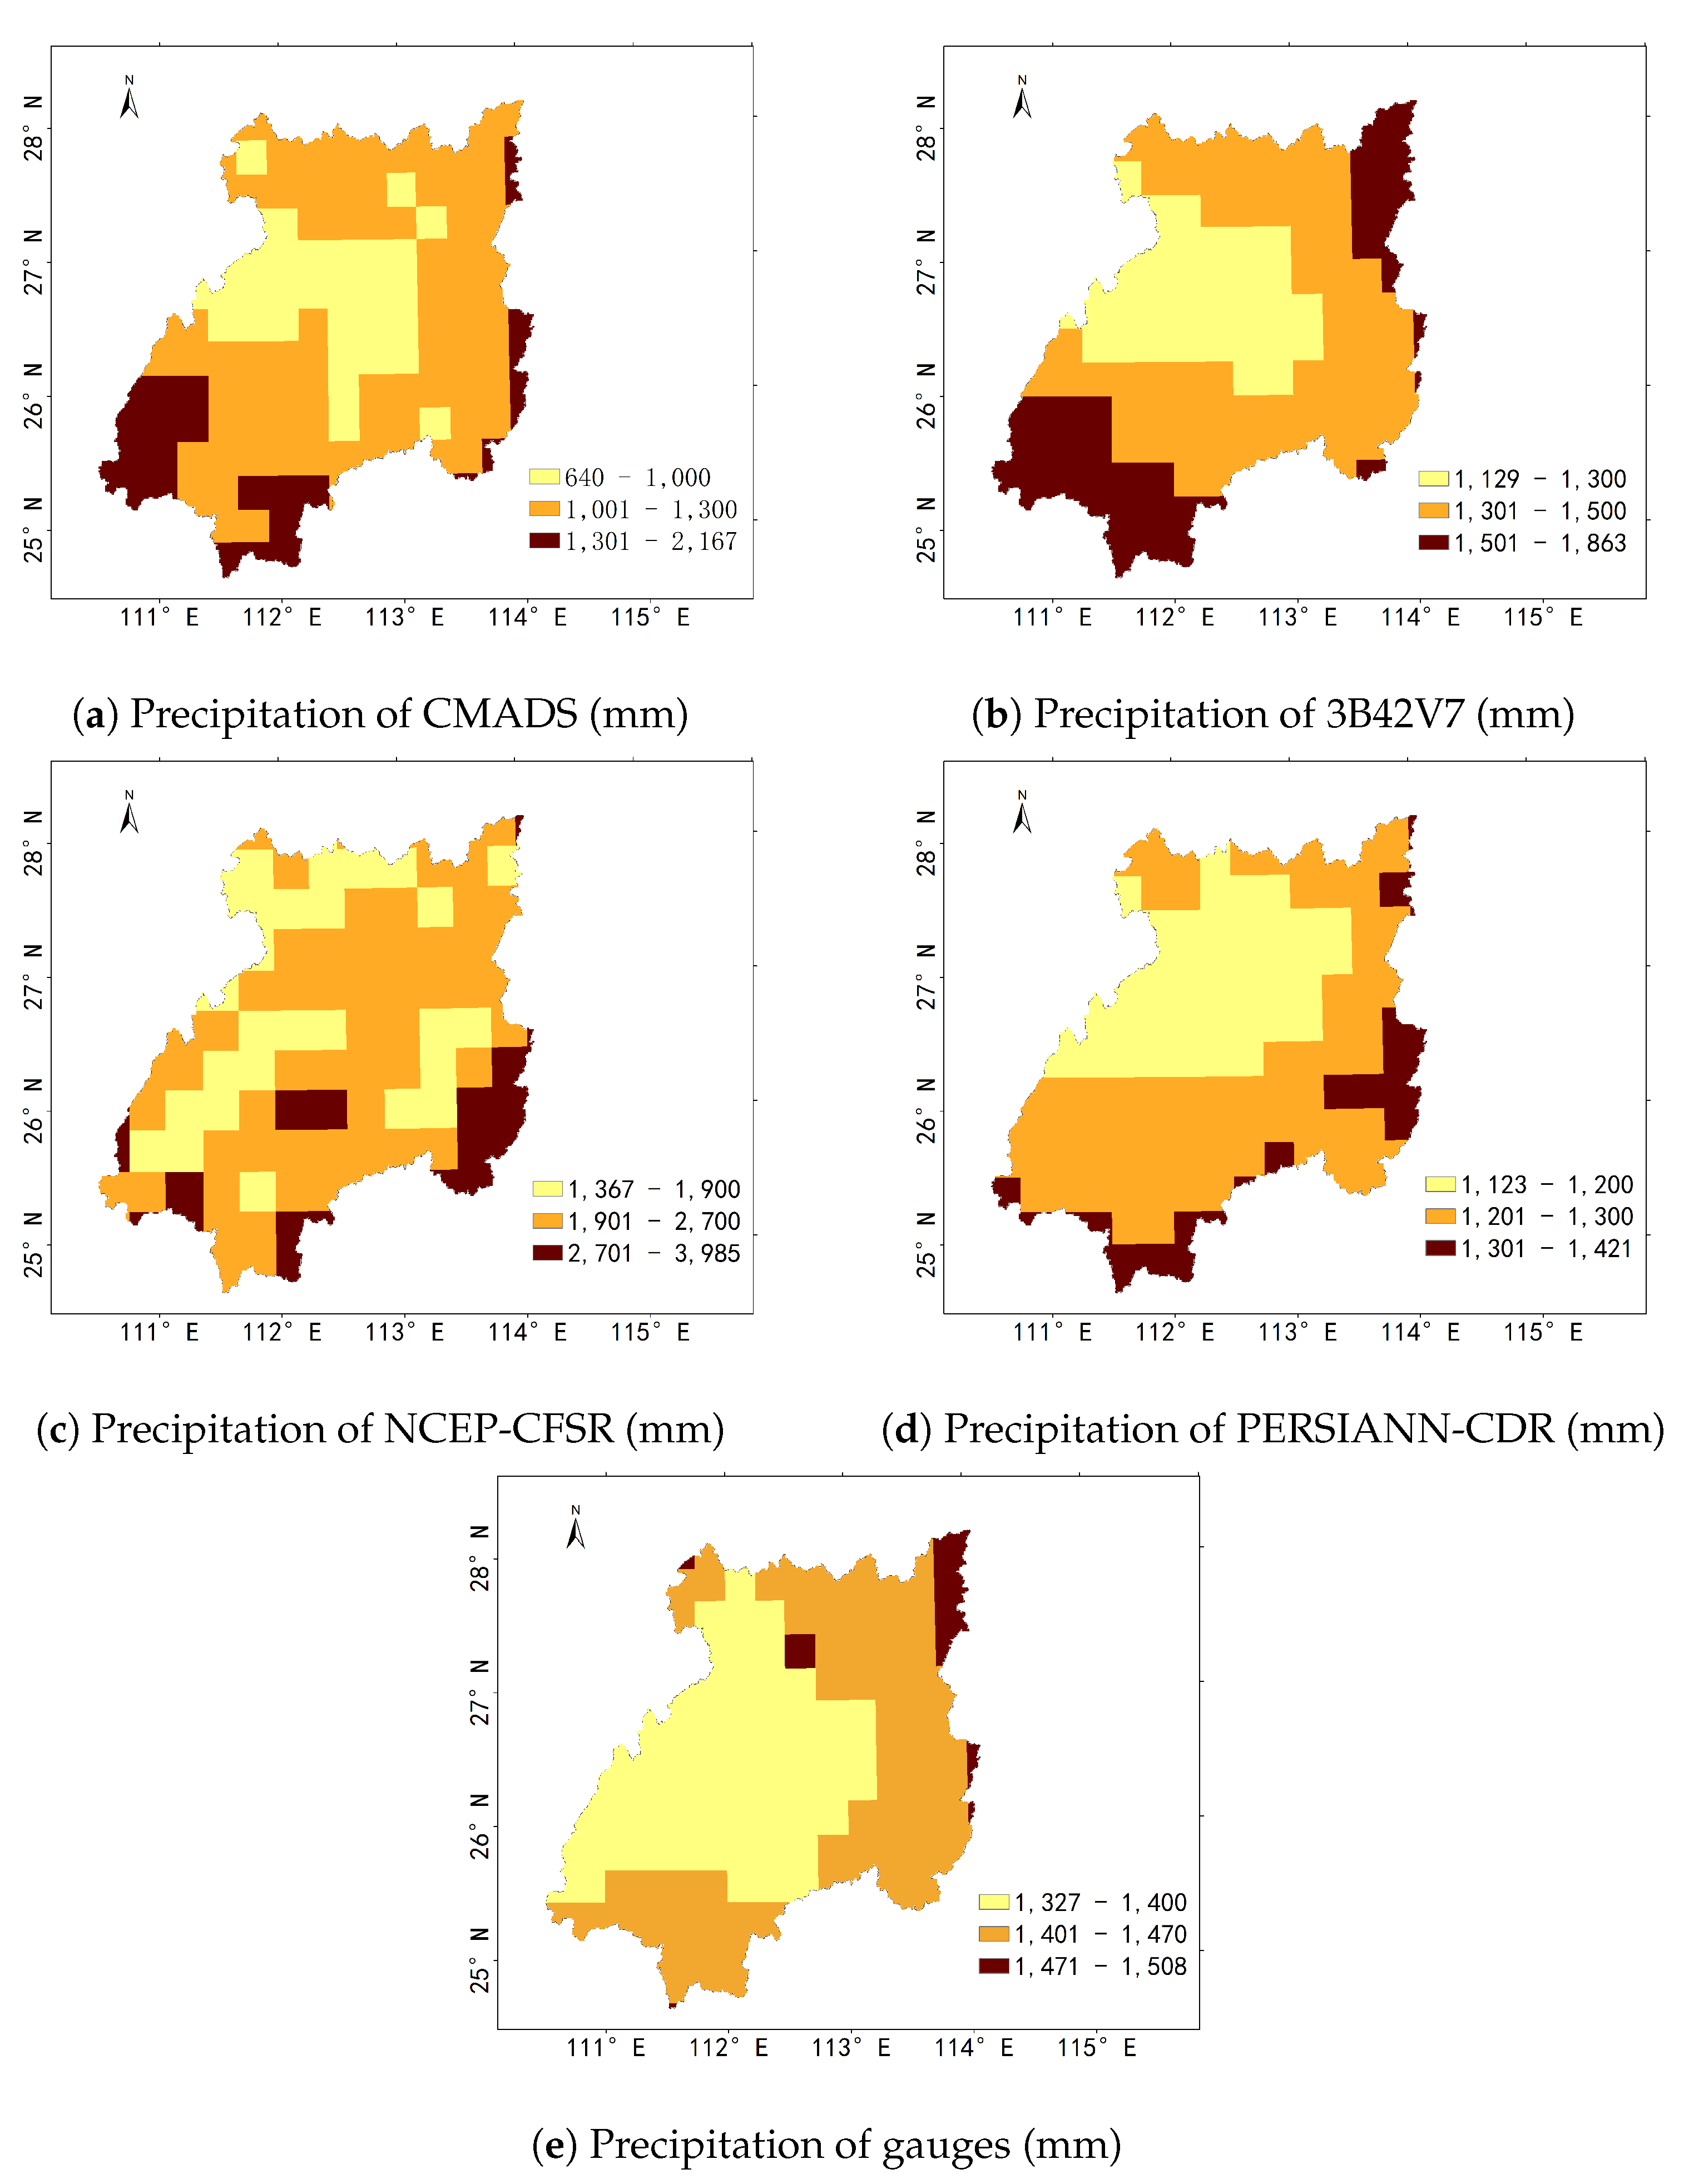
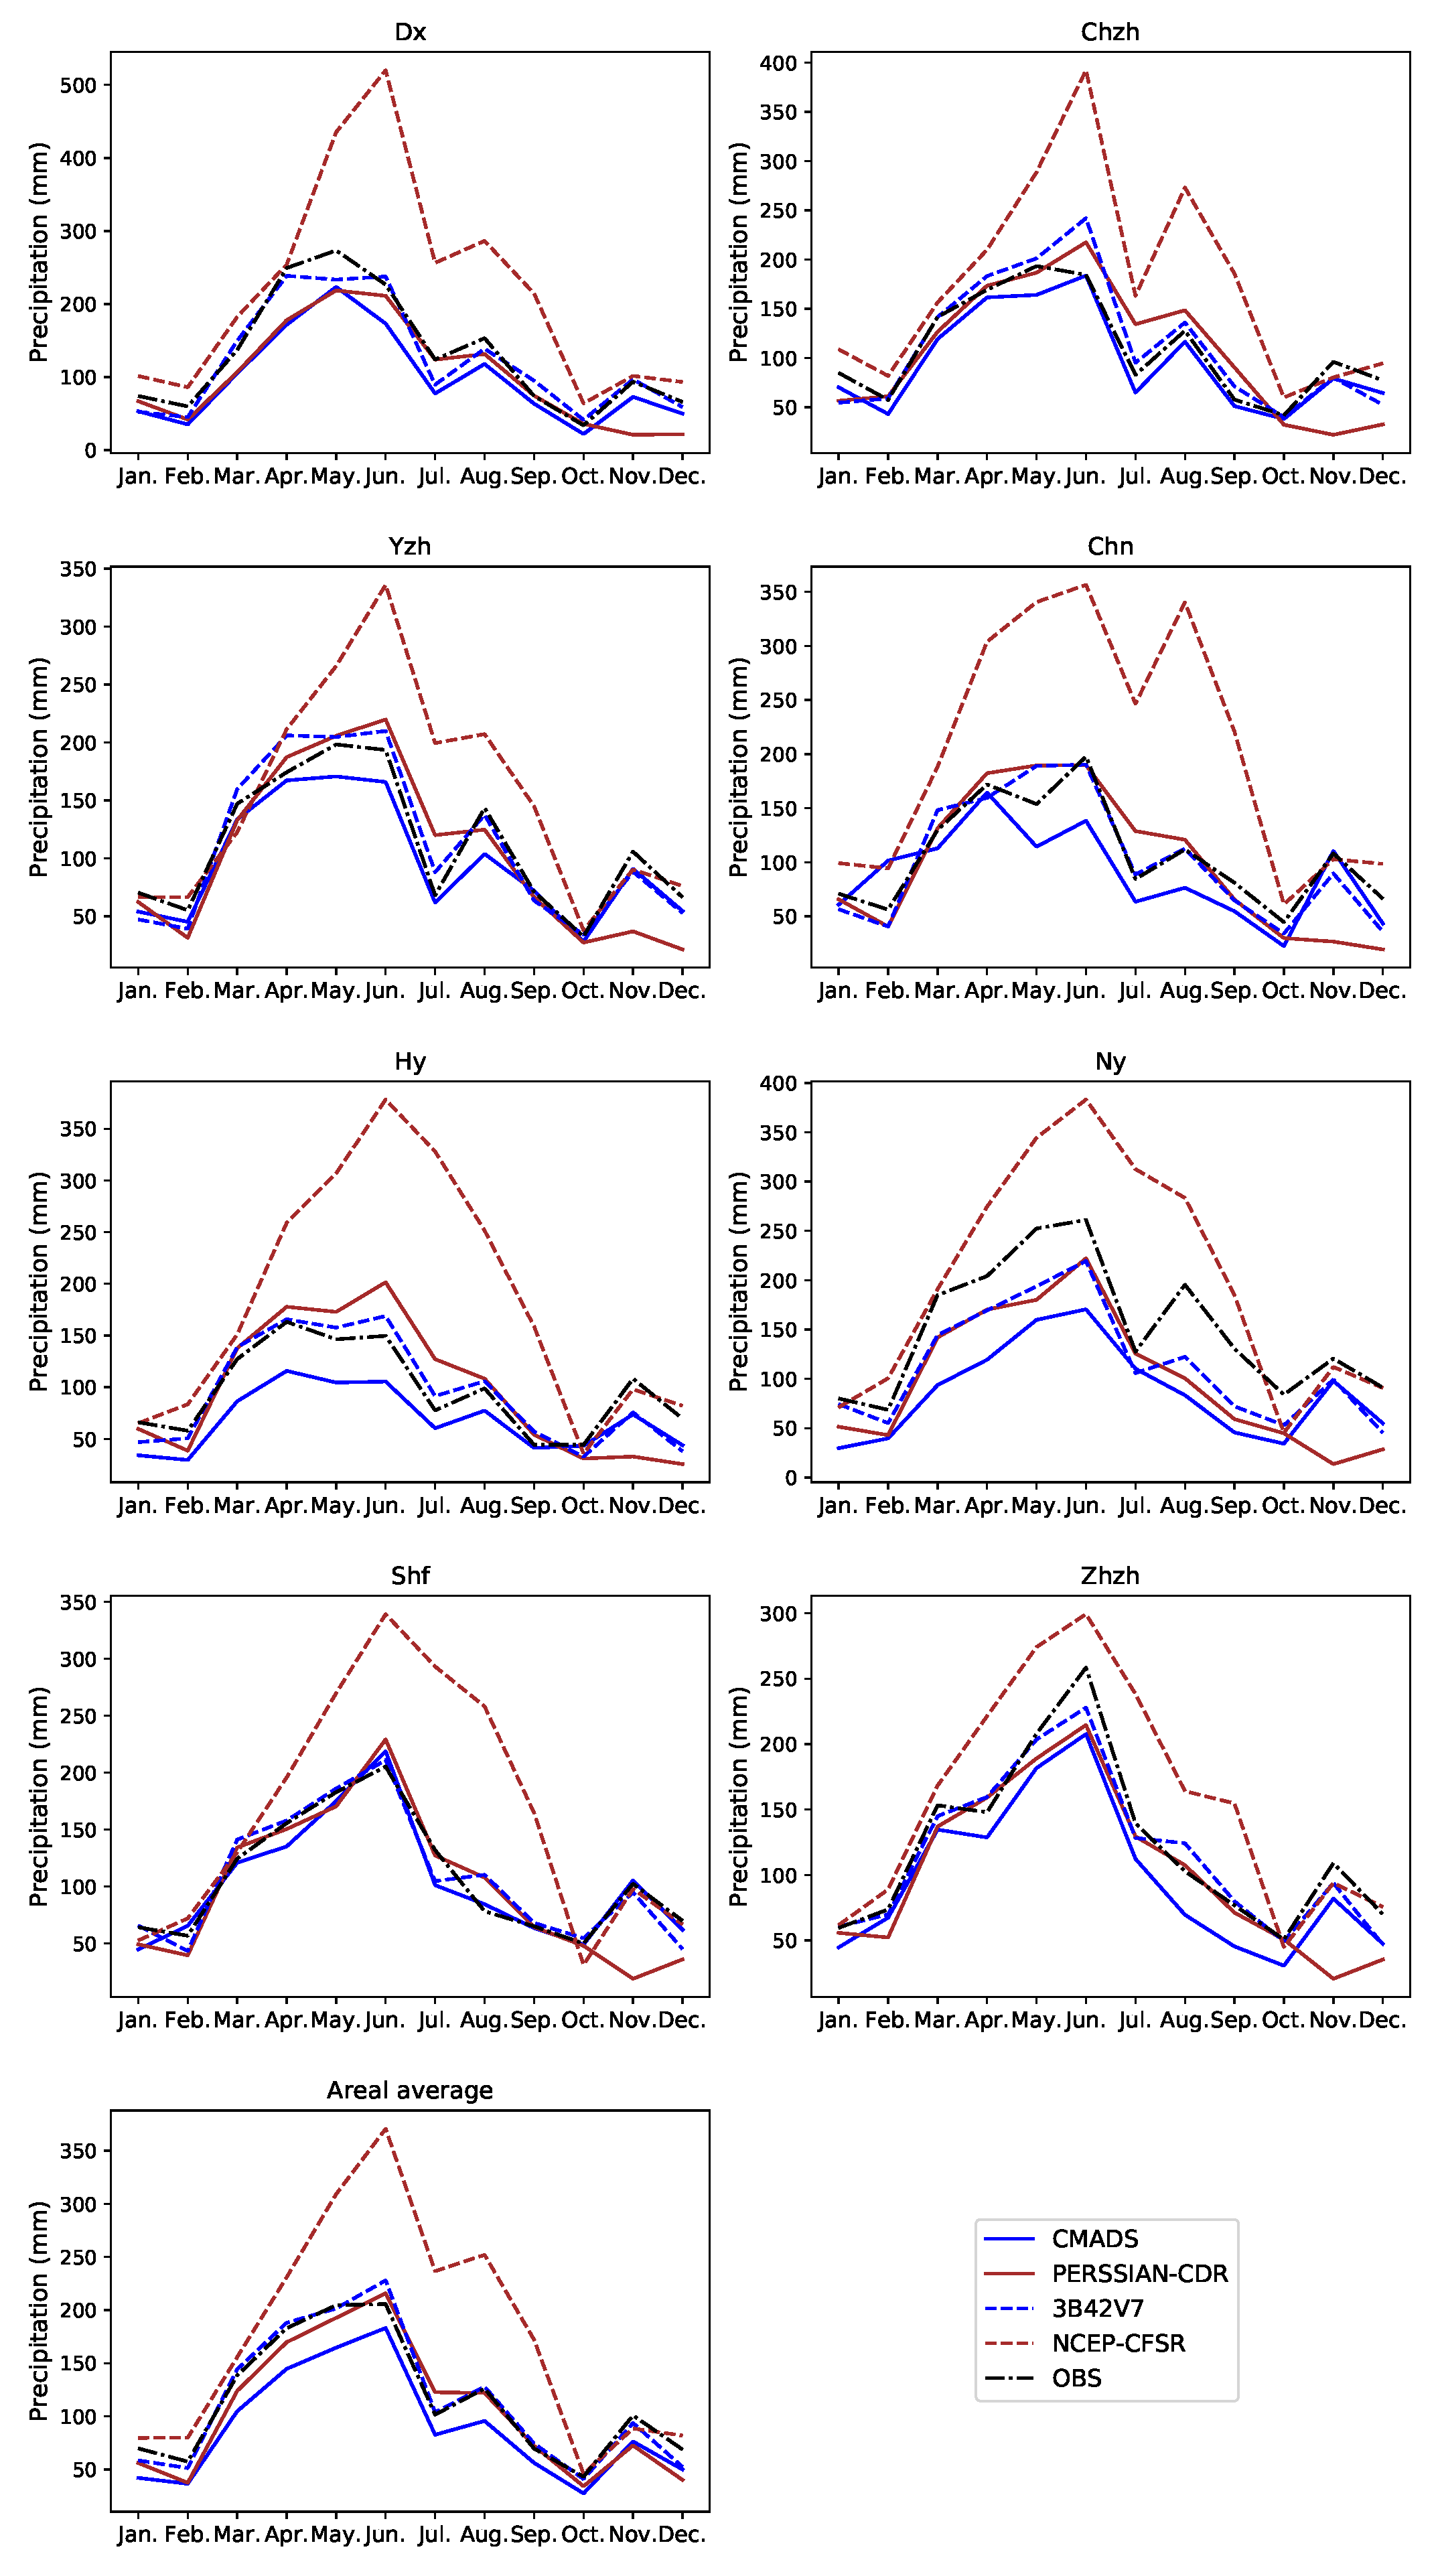
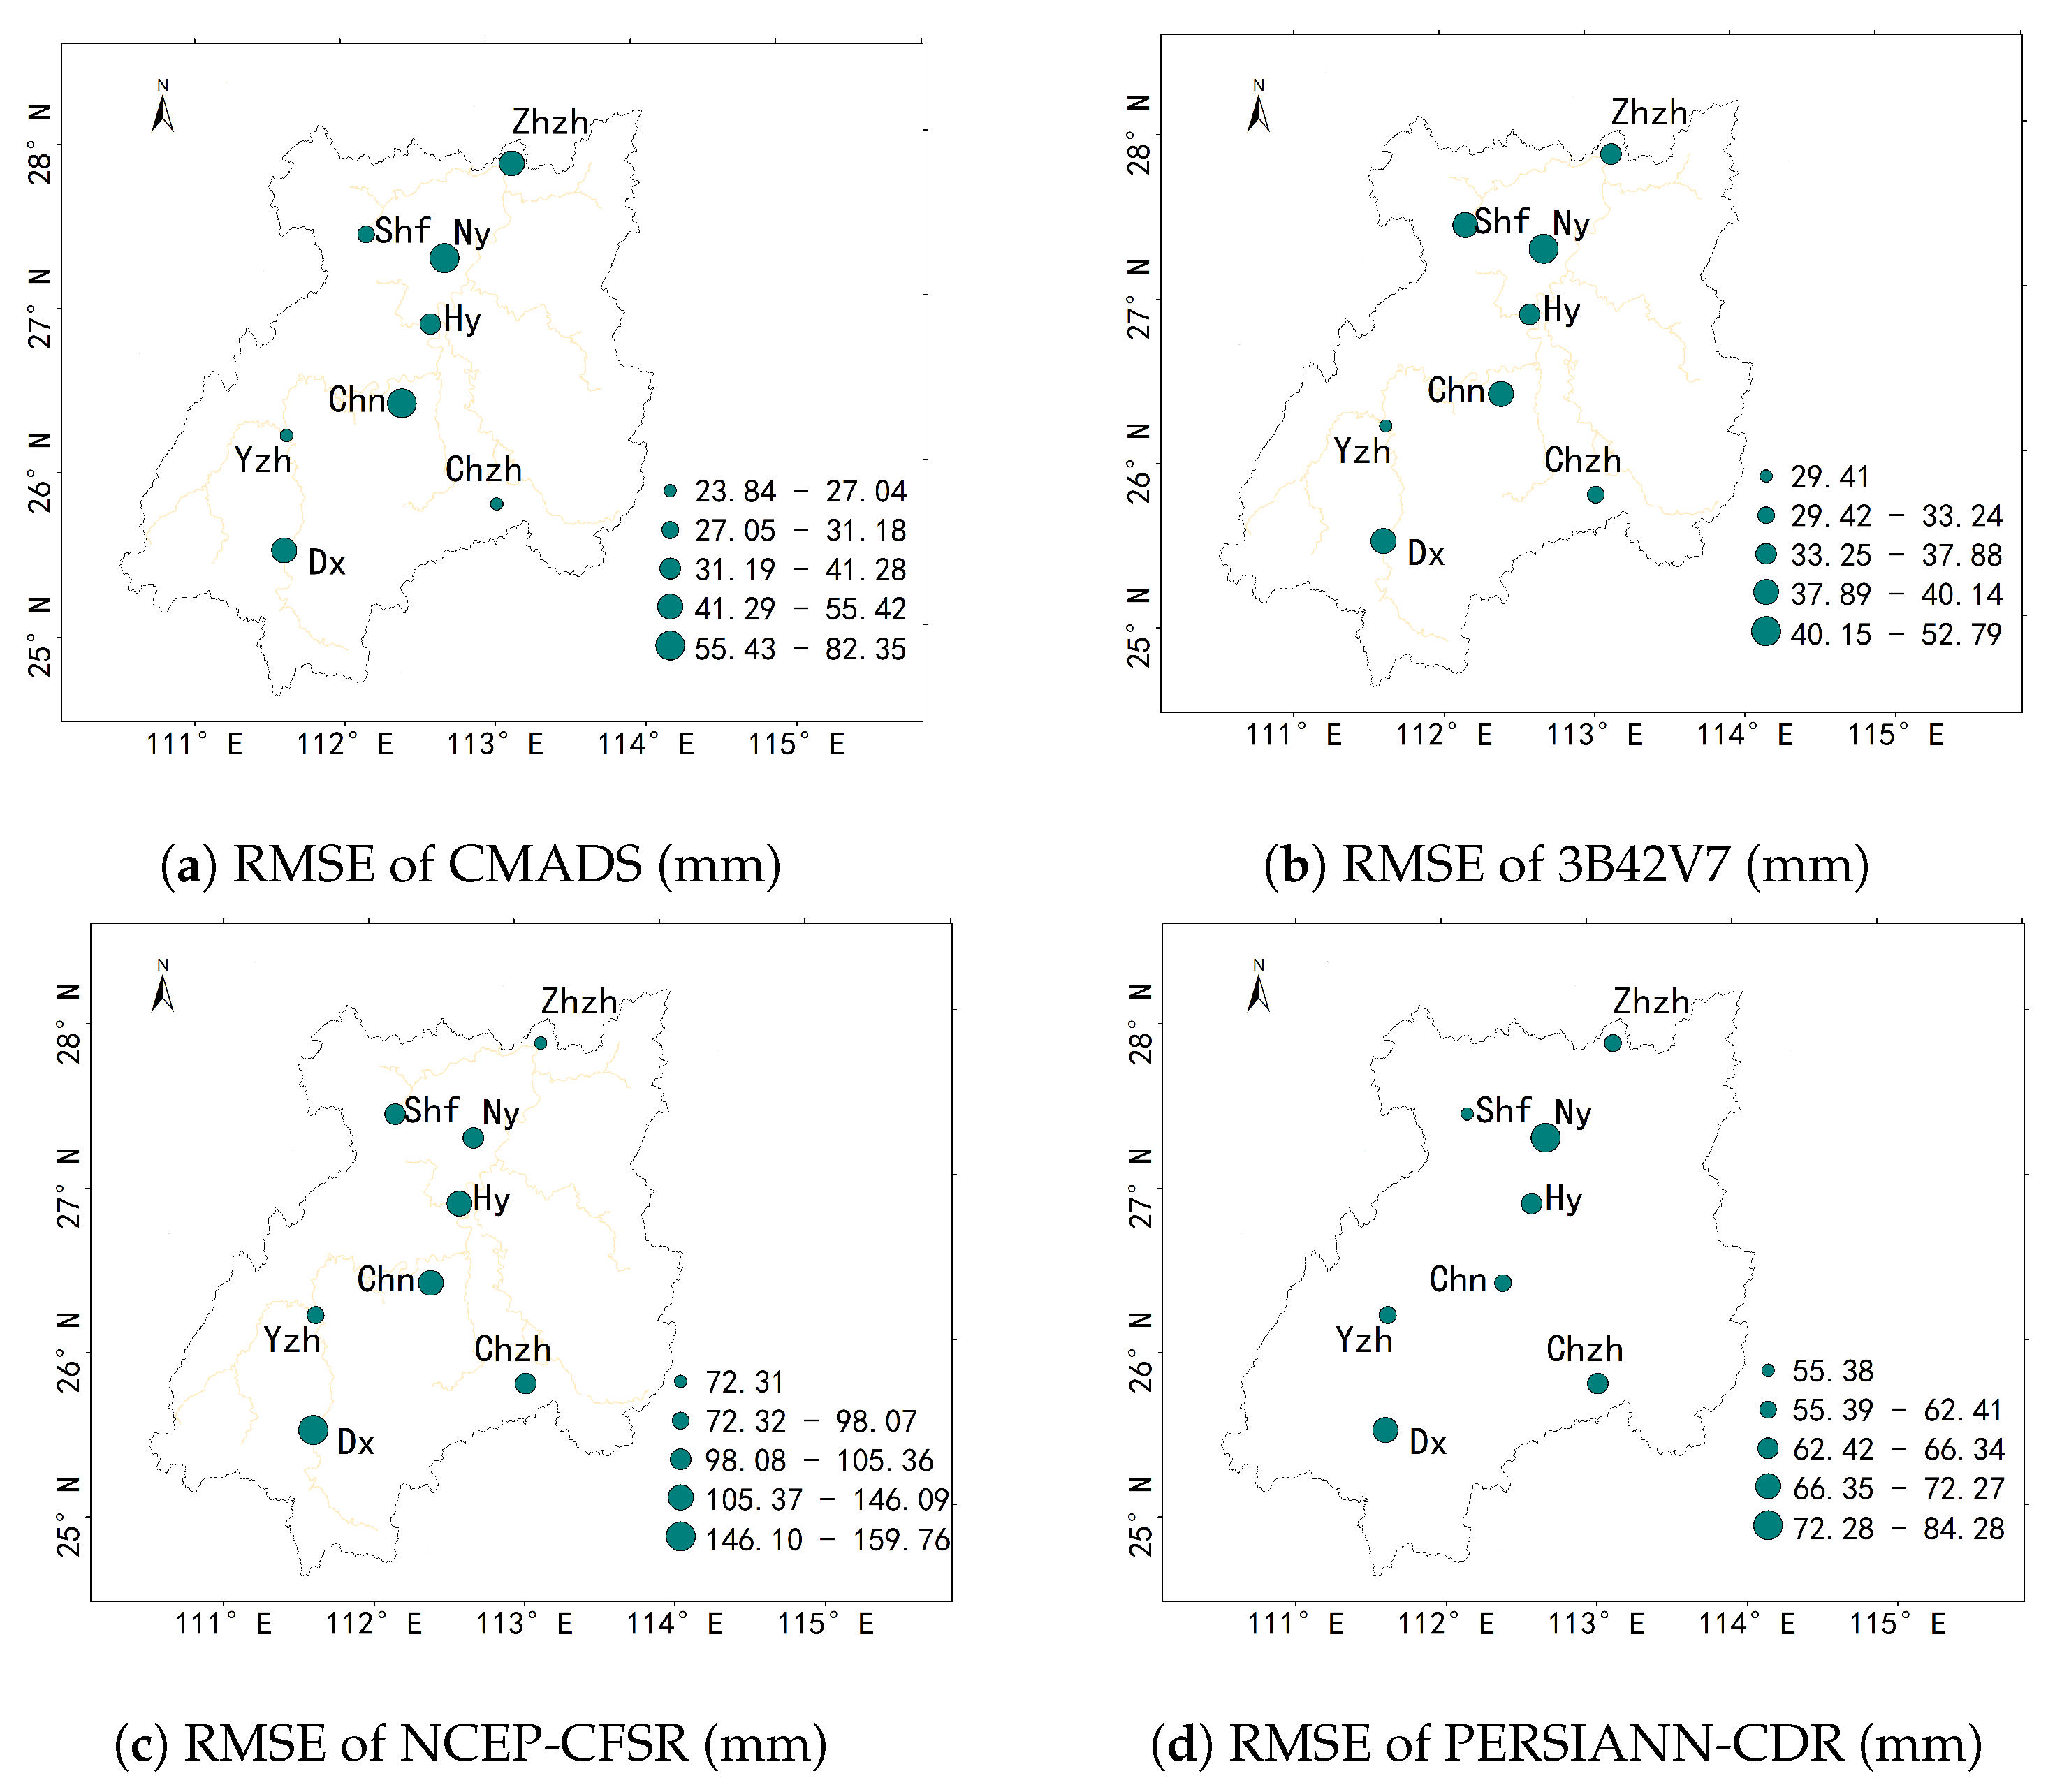
The performance of two reanalysis precipitation datasets (CMADS and NCEP-CFSR) and two satellite-based precipitation datasets (PERSIANN-CDR and 3B42V7) was evaluated at two spatial scales (a grid square and the whole basin) and two timesteps (daily and monthly), and the ability of these datasets to simulate streamflow is assessed for both temporal scales. The results show that: (1) for daily timesteps, the reanalysis datasets perform better than satellite-based datasets in terms of correlation with gauge observations, while satellite-based datasets perform better than reanalysis datasets in most situations in terms of bias. The correlations between reanalysis datasets and gauge observations at both spatial scales are >0.55. The absolute bias values of the two satellite-based datasets are <10% at most grid squares and also for the whole basin. CMADS underestimates precipitation while NCEP-CFSR overestimates it. PERSIANN-CDR cannot accurately detect the spatial distribution of precipitation events compared with other datasets. The POD of PERSIANN-CDR at most grid squares is <0.50; (2) CMADS and 3B42V7 perform better than PERSIANN-CDR and NCEP-CFSR in most situations in terms of correlation with gauge observations and satellite-based datasets perform better than reanalysis datasets in terms of bias; (3) CMADS and 3B42V7 simulate both daily (NS > 0.70) and monthly (NS > 0.80) streamflow well; CMADS performs a little better than 3B42V7 at a daily timestep according to the weights of BMA model, and vice versa for a monthly timestep; NCEP-CFSR performs worst because of its substantial overestimation; PERSIANN-CDR performs badly because of its poor capability to capture the characteristics of streamflow during validation.
Some other studies have shown that precipitation products tend to underestimate flood peaks by directly comparing modeled streamflow driven by precipitation products to observed streamflow. In this study, we eliminated the effects of the model structure on underestimation by comparing modeled streamflow driven by precipitation data from products with streamflow driven by observed precipitation, and we found that there is no obvious underestimation of flood peaks when using precipitation products such as CMADS and 3B42V7 in the Xiang River basin. On the whole, CMADS has great potential in hydrological application in the studied area because that (1) the accuracy of simulated streamflow forced by CMADS is good in the studied area; (2) the dataset is well organized and can be used as inputs of SWAT model directly; (3) as a reanalysis dataset, CMADS can be used in areas with sparse gauges and improved in spatiotemporal resolution in further versions with relatively small cost. (4) Compared with satellite-based datasets, reanalysis datasets such as CMADS usually have much longer time series.


