Article

Sea Water Contamination in the Vicinity of the Italian Minor Islands Caused by Microplastic Pollution

1
Institute for Coastal Marine Environment of Italian Research Council (IAMC-CNR), 09170 Oristano, Italy
2
Section of Water and Environment, Department of Civil Engineering, Aalborg University, Thomas Manns Vej 23, 9220 Aalborg Øst, Denmark
3
ISPRA, Italian Institute for Environmental Protection and Research, 00144 Roma, Italy
4
Department of Ecology and Biology, University of Tuscia, 01100 Viterbo, Italy
5
LEGAMBIENTE, 00100 Roma, Italy
*
Author to whom correspondence should be addressed.
Water 2018, 10(8), 1108; https://doi.org/10.3390/w10081108
Submission received: 15 May 2018 / Revised: 14 August 2018 / Accepted: 15 August 2018 / Published: 20 August 2018

Abstract

:
The abundance and distribution of microplastics (MP) were evaluated in six “clean” sites (Italian minor islands) and in two “polluted” areas (near the mouth of two major Italian rivers). Samples of MP, plankton and persistent organic pollutants (POPs) were collected using a manta trawl (MA) and a plankton net (WP2), both lined with a 333 µm mesh net. MP have been confirmed to be ubiquitous since they were found at each site, showing an average density of 0.3 ± 0.04 items/m3 (values ranged from 0.641 to 0.119 ). When comparing the clean sites with the polluted ones, a significantly higher value of MP was found near the river mouths. The most common types of MP were synthetic filaments (50.24%), followed by fragments (30.39%), thin plastic films (16.98%) and spheres (2.39%). Infrared spectroscopy analysis highlighted that the most abundant polymers were polyethylene (PE-26%), polypropylene (PP-11%), polyethylene-terephthalate/polyester (PET/PEST-8%) and ethylene-vinyl-acetate (EVA-5%). Polychlorinated biphenyls and organochlorine pesticides were detected in all the samples with a high variability among sites and depths. This study adds to the existing information on the distribution of contaminants across the Mediterranean Sea, and is useful to policy makers who wish to implement effective measures to reduce MP pollution.

1. Introduction

Plastics are synthetic organic polymers, which are derived from the polymerization of monomers extracted from oil and gas [1,2]. Thompson [3] estimates up to 10% of plastic ends up in the oceans, where it may persist and accumulate while it undergoes fragmentation due to combined physical-chemical processes. The derived fragments smaller than 5 mm have been defined as secondary microplastics (MP), while purposely made micron-sized plastics are primary MP, these represent a new threat to the environment [4]. MP enter the marine environment via multiple pathways, including river systems and waste-water discharged into the sea [5,6] and their dispersion is greatly increased by their progressive fragmentation [7]. The distribution and abundance of plastic debris are influenced by hydrodynamics and show spatial variability in the open ocean, as well as in coastal waters [8,9]. It has been estimated that plastic requires several centuries or even thousands of years to degrade in the marine environment [1,8,10,11]. As a result, MP are ubiquitous and have been shown to preferentially accumulate on the sea surface and in sediments [12,13,14,15,16]. To date, the most common types of MP encountered in the marine environment are fragments, films, spheres and fibres [6,17,18]. Plastic pollution has been associated with a range of negative effects on the environment: from physical harm to accumulation in the gut of marine fauna, to leaching of additives and absorbance/adsorbance of persistent organic pollutants (POPs) and metals [16,19,20]. Therefore, it is essential to detect MP in order to evaluate the magnitude of this environmental pollutant [19,20,21,22,23,24].
Due to the difficulty in identifying smaller fragments of MP [18,25], analytical techniques such as spectroscopy (micro-Fourier transform infrared spectroscopy (µFT-IR) and Raman spectroscopy) and gas-chromatography/mass-spectrometry (Pyr-GC/MS, TD-GC/MS, TGA-GC/MS, TGA-TD-Pyr-GC/MS) [6,16,26,27,28,29] are employed. Moreover, by adopting a robust analytical approach, sensitivity and accuracy are increased in the analysis.
In the last five years, there has been a rapid increase in studies investigating marine microplastic abundance and distribution [5,6,16]. Plastic pollution is considered by the United Nations Environmental Program to be one of the most important environmental issues, especially in the marine environment. The European Commission (EC) in the Marine Strategy Framework Directive (MSFD/2008/56/EC) has highlighted the major contaminant issues to be addressed in order to reach Good Environmental Status (GES). “Marine Litter” has been chosen as one of the 11 descriptors to estimate the environmental status. The Marine Strategy describes GES as the condition when “Properties and quantities of marine litter do not cause harm to the coastal and marine environment” [30].
The aim of this work was to investigate, for the first time, the distribution of MP in distinct areas of the Italian coast, including two MP sources (river mouths) and six sites supposedly far from MP sources (minor islands). Moreover, a comparison between sampling gears a manta trawl (MA) and a plankton net (WP2), was made and took into consideration the surface and a water column (0–20 m) layer. Type and colour were assessed for each MP sample and the polymer composition was taken into consideration to evaluate spatial differences between areas. The number of individuals and the number of taxa of plankton were evaluated using both sampling gears. Finally, levels of polychlorinated biphenyl (PCB) and organochlorine (OC) pesticides were estimated to determine the level of POPs in the study area.

2. Materials and Methods

This study was carried out in 2015 in areas along the Italian coast from June to September (Figure 1).
Given that the Mediterranean Sea is a semi-closed basin, where MP are widespread, it was decided to choose areas where pollution is higher (major Italian river mouths as sources: the Po and the Tevere), and compare the results with areas that are far away from these types of sources (the minor islands: Tremiti, Eolie, Ischia, Ventotene, Asinara and Elba). For each site, 4 replicates with MA and 4 replicates with WP2 were performed, with the exception of rivers mouths below a minimum depth of 20 m and in Tremiti and Elba where only 4 samples were collected for POPs analysis. As a result, 52 linear transects (MA = 32; WP2 = 20 replicates) were performed.
Samples of water were collected on board the Green Schooner (Legambiente’s vessel) by employing a MA and a WP2, both lined with a 333 µm mesh net. The MA sampled the top 25 cm of the sea surface while the WP2 started sampling from 20 m and finished at the sea surface. Linear transects were carried out at an average speed of 2 knots for 20 min. The volume of filtered sea-water (m3) was calculated by a flow meter.
Plastic items were separated from plankton and other organic matter for a total of 28 linear transects, and subsequently sorted and measured under a binocular stereoscope (AxioCam ERc5s for image analysis, Carl Zeiss Micro-imaging GmbH. Only micro-fragments (less than 5 mm) were considered and their density was expressed as items/m3. PERMANOVA analysis was employed to highlight differences between areas (polluted vs. clean), gears (MA vs. WP2) and among the minor islands. The items were subdivided into different types: Synthetic filaments, plastic films, fragments and spheres. Moreover, they have been catalogued according to the following colours: transparent, white, red (pink, orange), blue (light blue, light cyan), yellow, black (brown), green, and grey (silver). To avoid contamination, during the laboratory procedures 100% cotton clothes were worn and the colour of the clothes worn underneath the lab coat was recorded. Finally, particles smaller than 300 µm were not taken into consideration in order to avoid overestimation. The plankton, which had been preserved in 4% buffered formalin, was divided into taxa, identified to the lowest taxon level by a specialist and the density per site (individuals/m3) was measured.
All MP particles were analyzed with micro-Fourier transform infrared spectroscopy (μFT-IR) to identify the polymeric composition. The analysis was performed with an infrared microscope Nicolet iN10 (Thermo Fisher Scientific, Madison, WI, USA) with a single mercury cadmium telluride (MCT) detector cooled with liquid nitrogen and equipped with a motorised stage. The analyses were carried out by acquiring the signal in SR-ATR (Single Reflection-Attenuated Total Reflectance) mode using a germanium crystal (refractive index n = 4), with a micro-tip of 350 µm diameter (Micro-Tip ATR). The polymer identification was carried out by comparing the acquired spectra with reference ones from both commercial and specifically developed spectral libraries, and by checking each result using the spectrum’s peak by peak identification. This analytical approach was possible because almost all the single microparticles were in the range of 5000–300 µm, therefore allowing visual sorting and manipulation [24,31]. Some polymers (e.g., polyethylene-terephthalate and polyester) were grouped in the μFT-IR results, as well as other natural/man-made materials (cellulose, wood, rayon). This was due to their spectral similarities, which did not allow a clear differentiation.
The water, including suspended organic material and the MP collected (the second subset of 24 replicates) were analyzed for polychlorinated biphenyls (PCBs) and organochlorine pesticides. This was carried out according to the Environmental Protection Agency (EPA) methods [32] 3546 (microwave extraction), 8081B (organochlorine pesticides by gas chromatography) and 8082A (polychlorinated biphenyls by gas chromatography). The organic extract was cleaned on a silica gel column and eluted with 10 mL of n-hexane:dichloromethane (50:50). The purified extract was analyzed by HRGC/ECD (high-resolution gas chromatography with electron capture detection) using an Agilent Technologies gas chromatograph 6890 coupled with two ECD detectors and two columns at different polarities. The PCBs analyzed were PCB 28, 31, 35, 52, 77, 81, 101, 105, 110, 118, 126, 128, 138, 153, 156, 169, and 180. The pesticides considered were DDT (dichloro diphenyls trichloroethane) and its metabolites (isomers alpha, beta and gamma) HCH (hexachlorocycloexane), HCB (hexachlorobenzene), aldrin and dieldrin.

3. Results

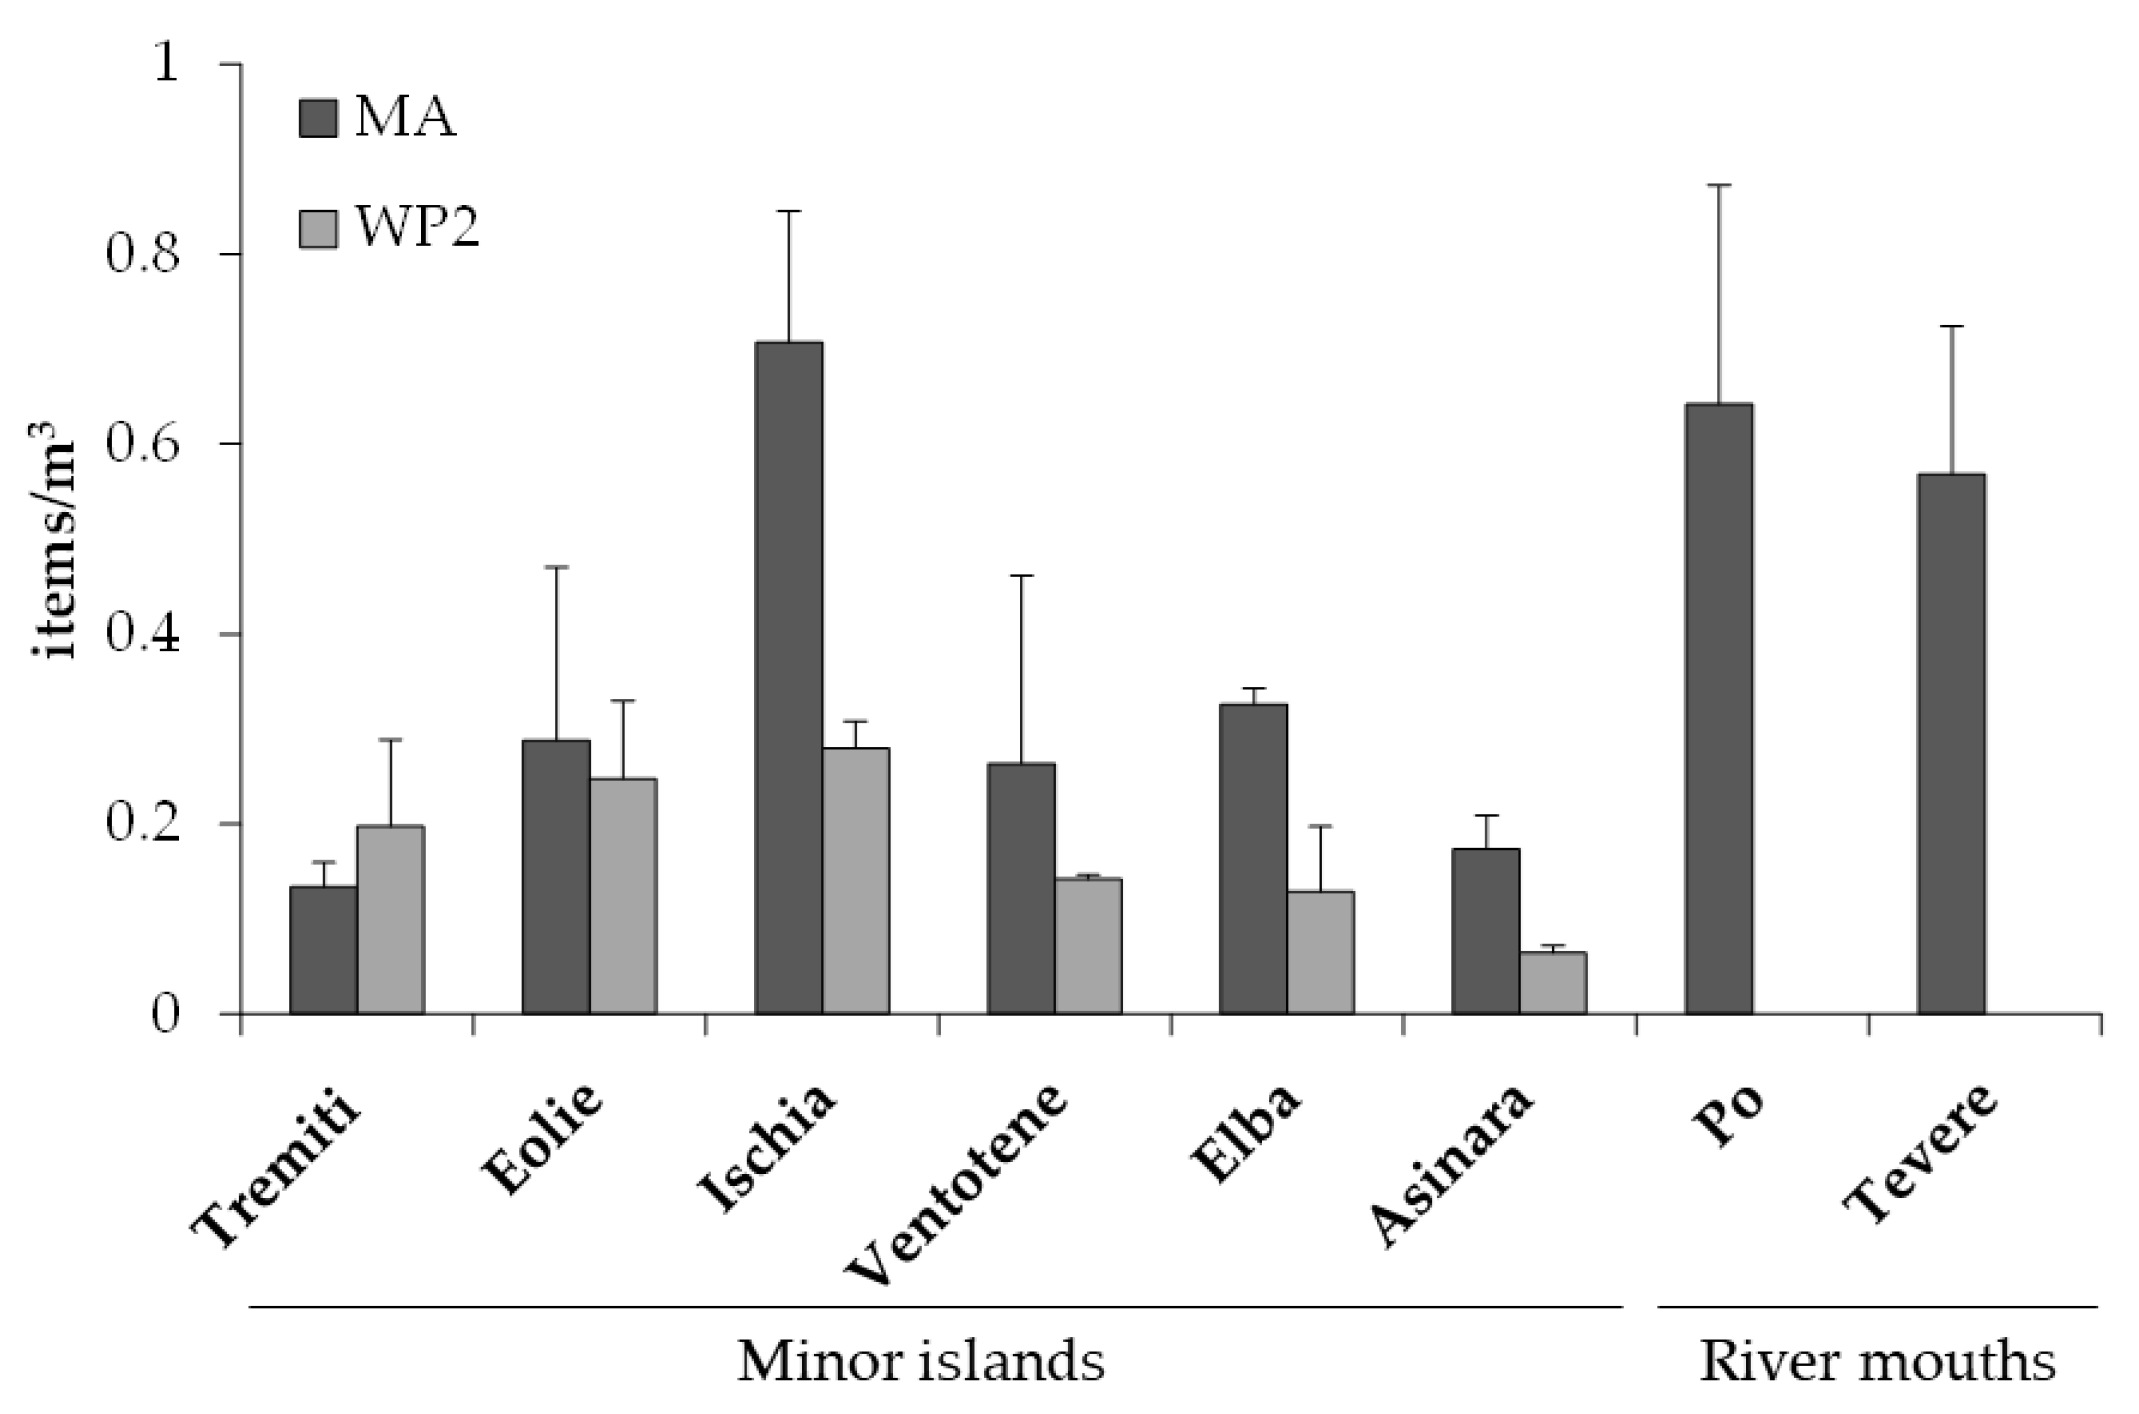
MP were detected at each site with a mean value of 0.297 ± 0.044 items/m3. No significant differences were found between MA and WP2 (pseudo F = 3.3671, p(MC) = 0.0827; Figure 2 and Table S1 in supplementary material), consequently, replicates of both gears were combined in order to detect differences among the islands. Although there was a high variability between sites ((MP ± standard error items/m3): Tremiti (0.165 ± 0.043), Eolie (0.268 ± 0.083), Ischia (0.493 ± 0.136), Ventotene (0.203 ± 0.088), Elba (0.228 ± 0.064), Asinara (0.119 ± 0.043)), the PERMANOVA analysis did not show any significant difference amid the minor islands (pseudo F = 2.5103; p(MC) = 0.0645). On the other hand, when the above clean sites were compared with the polluted ones (Po: 0.641 ± 0.231; Tevere: 0.568 ± 0.156), a significantly higher value of MP was found in the river mouths (pseudo F = 4.608; p(MC) = 0.0466).
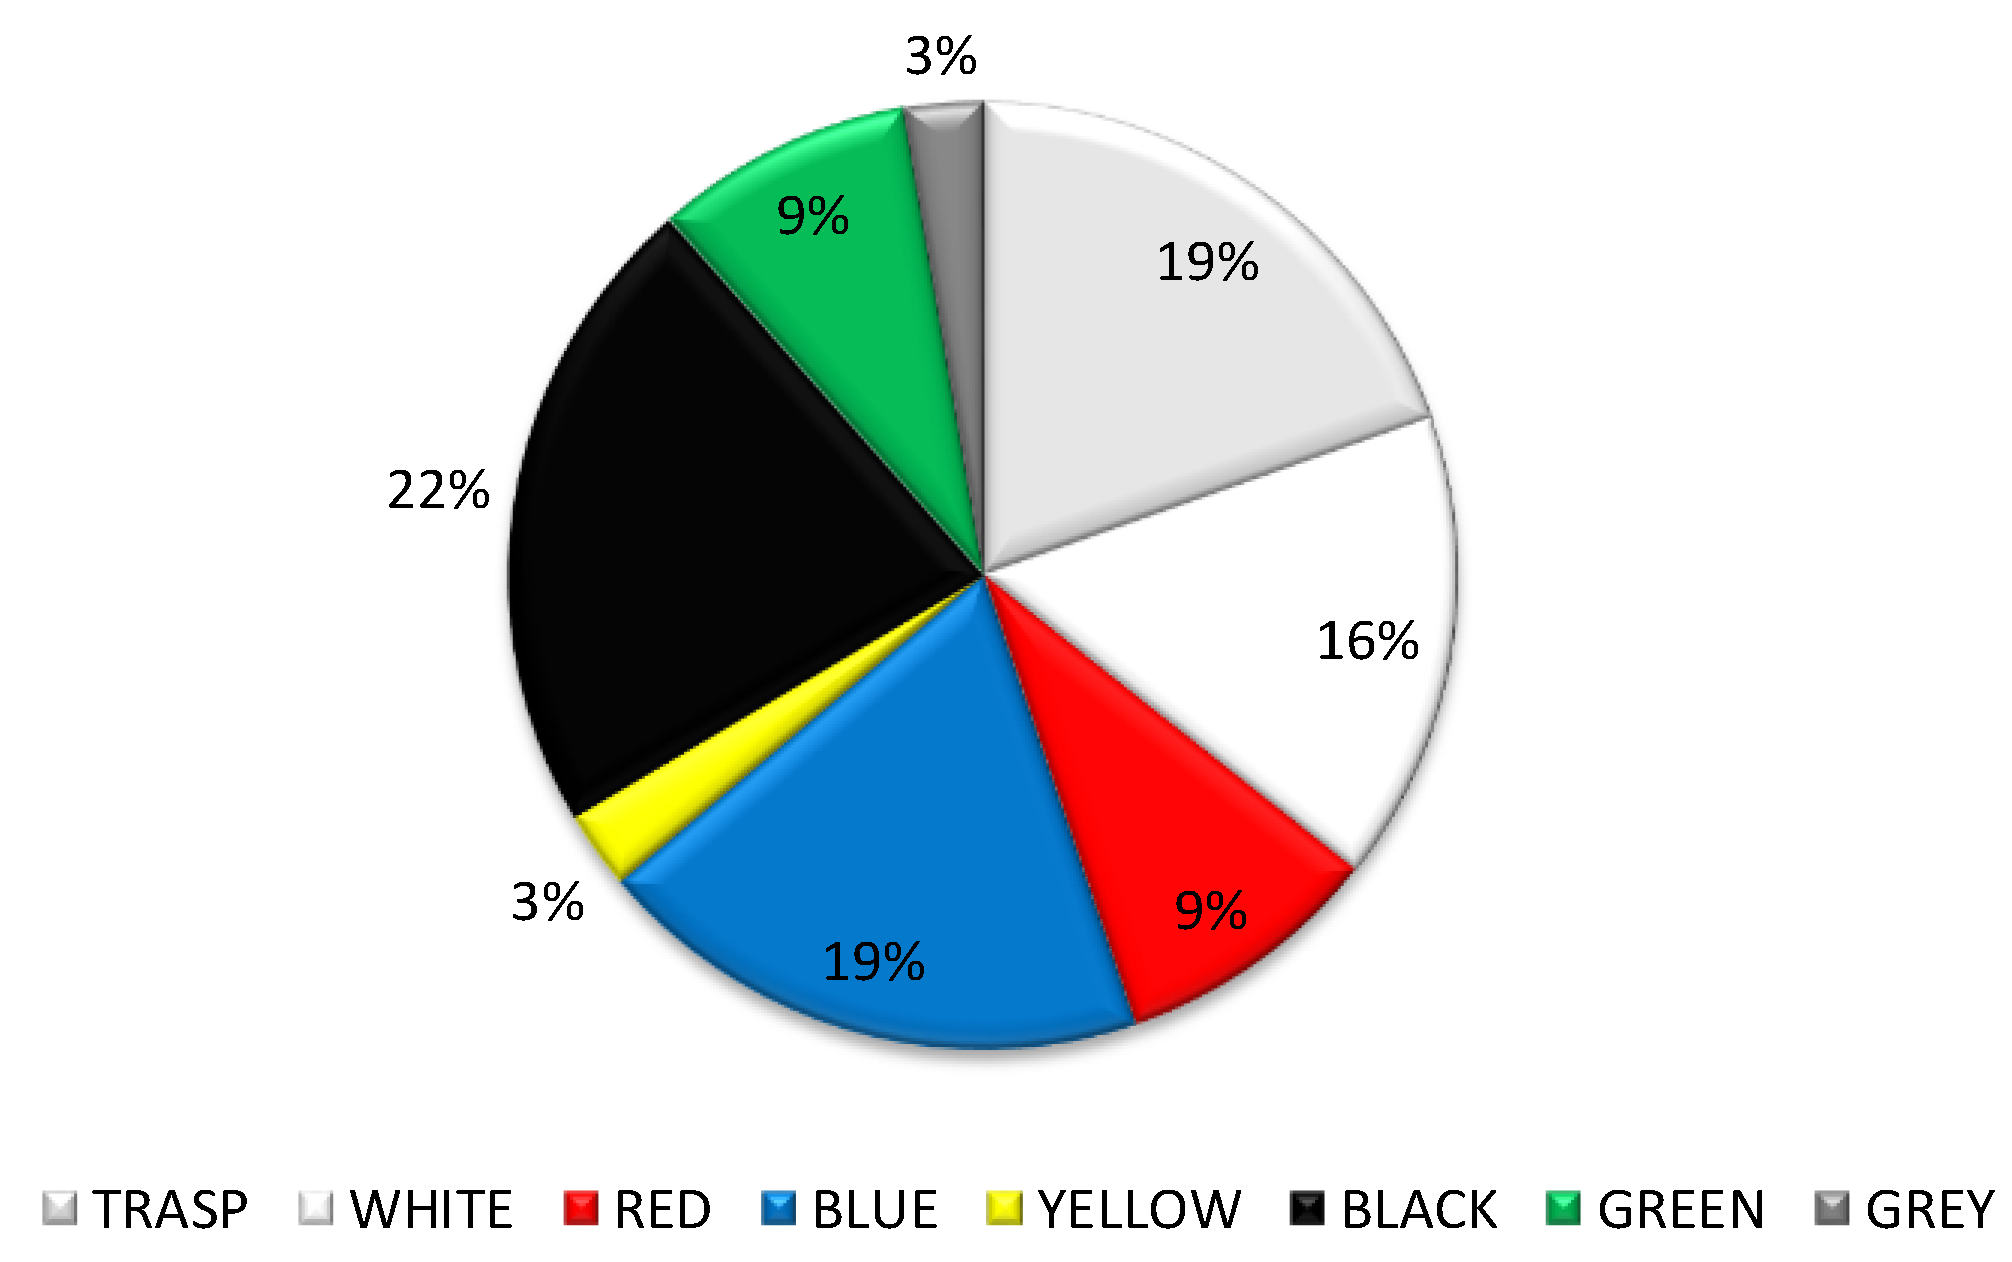
The most common type of MP were synthetic filaments (50.24%), followed by fragments (30.39%), thin plastic films (16.98%) and spheres (2.39%). Most of the collected items were black, blue and transparent (Figure 3).
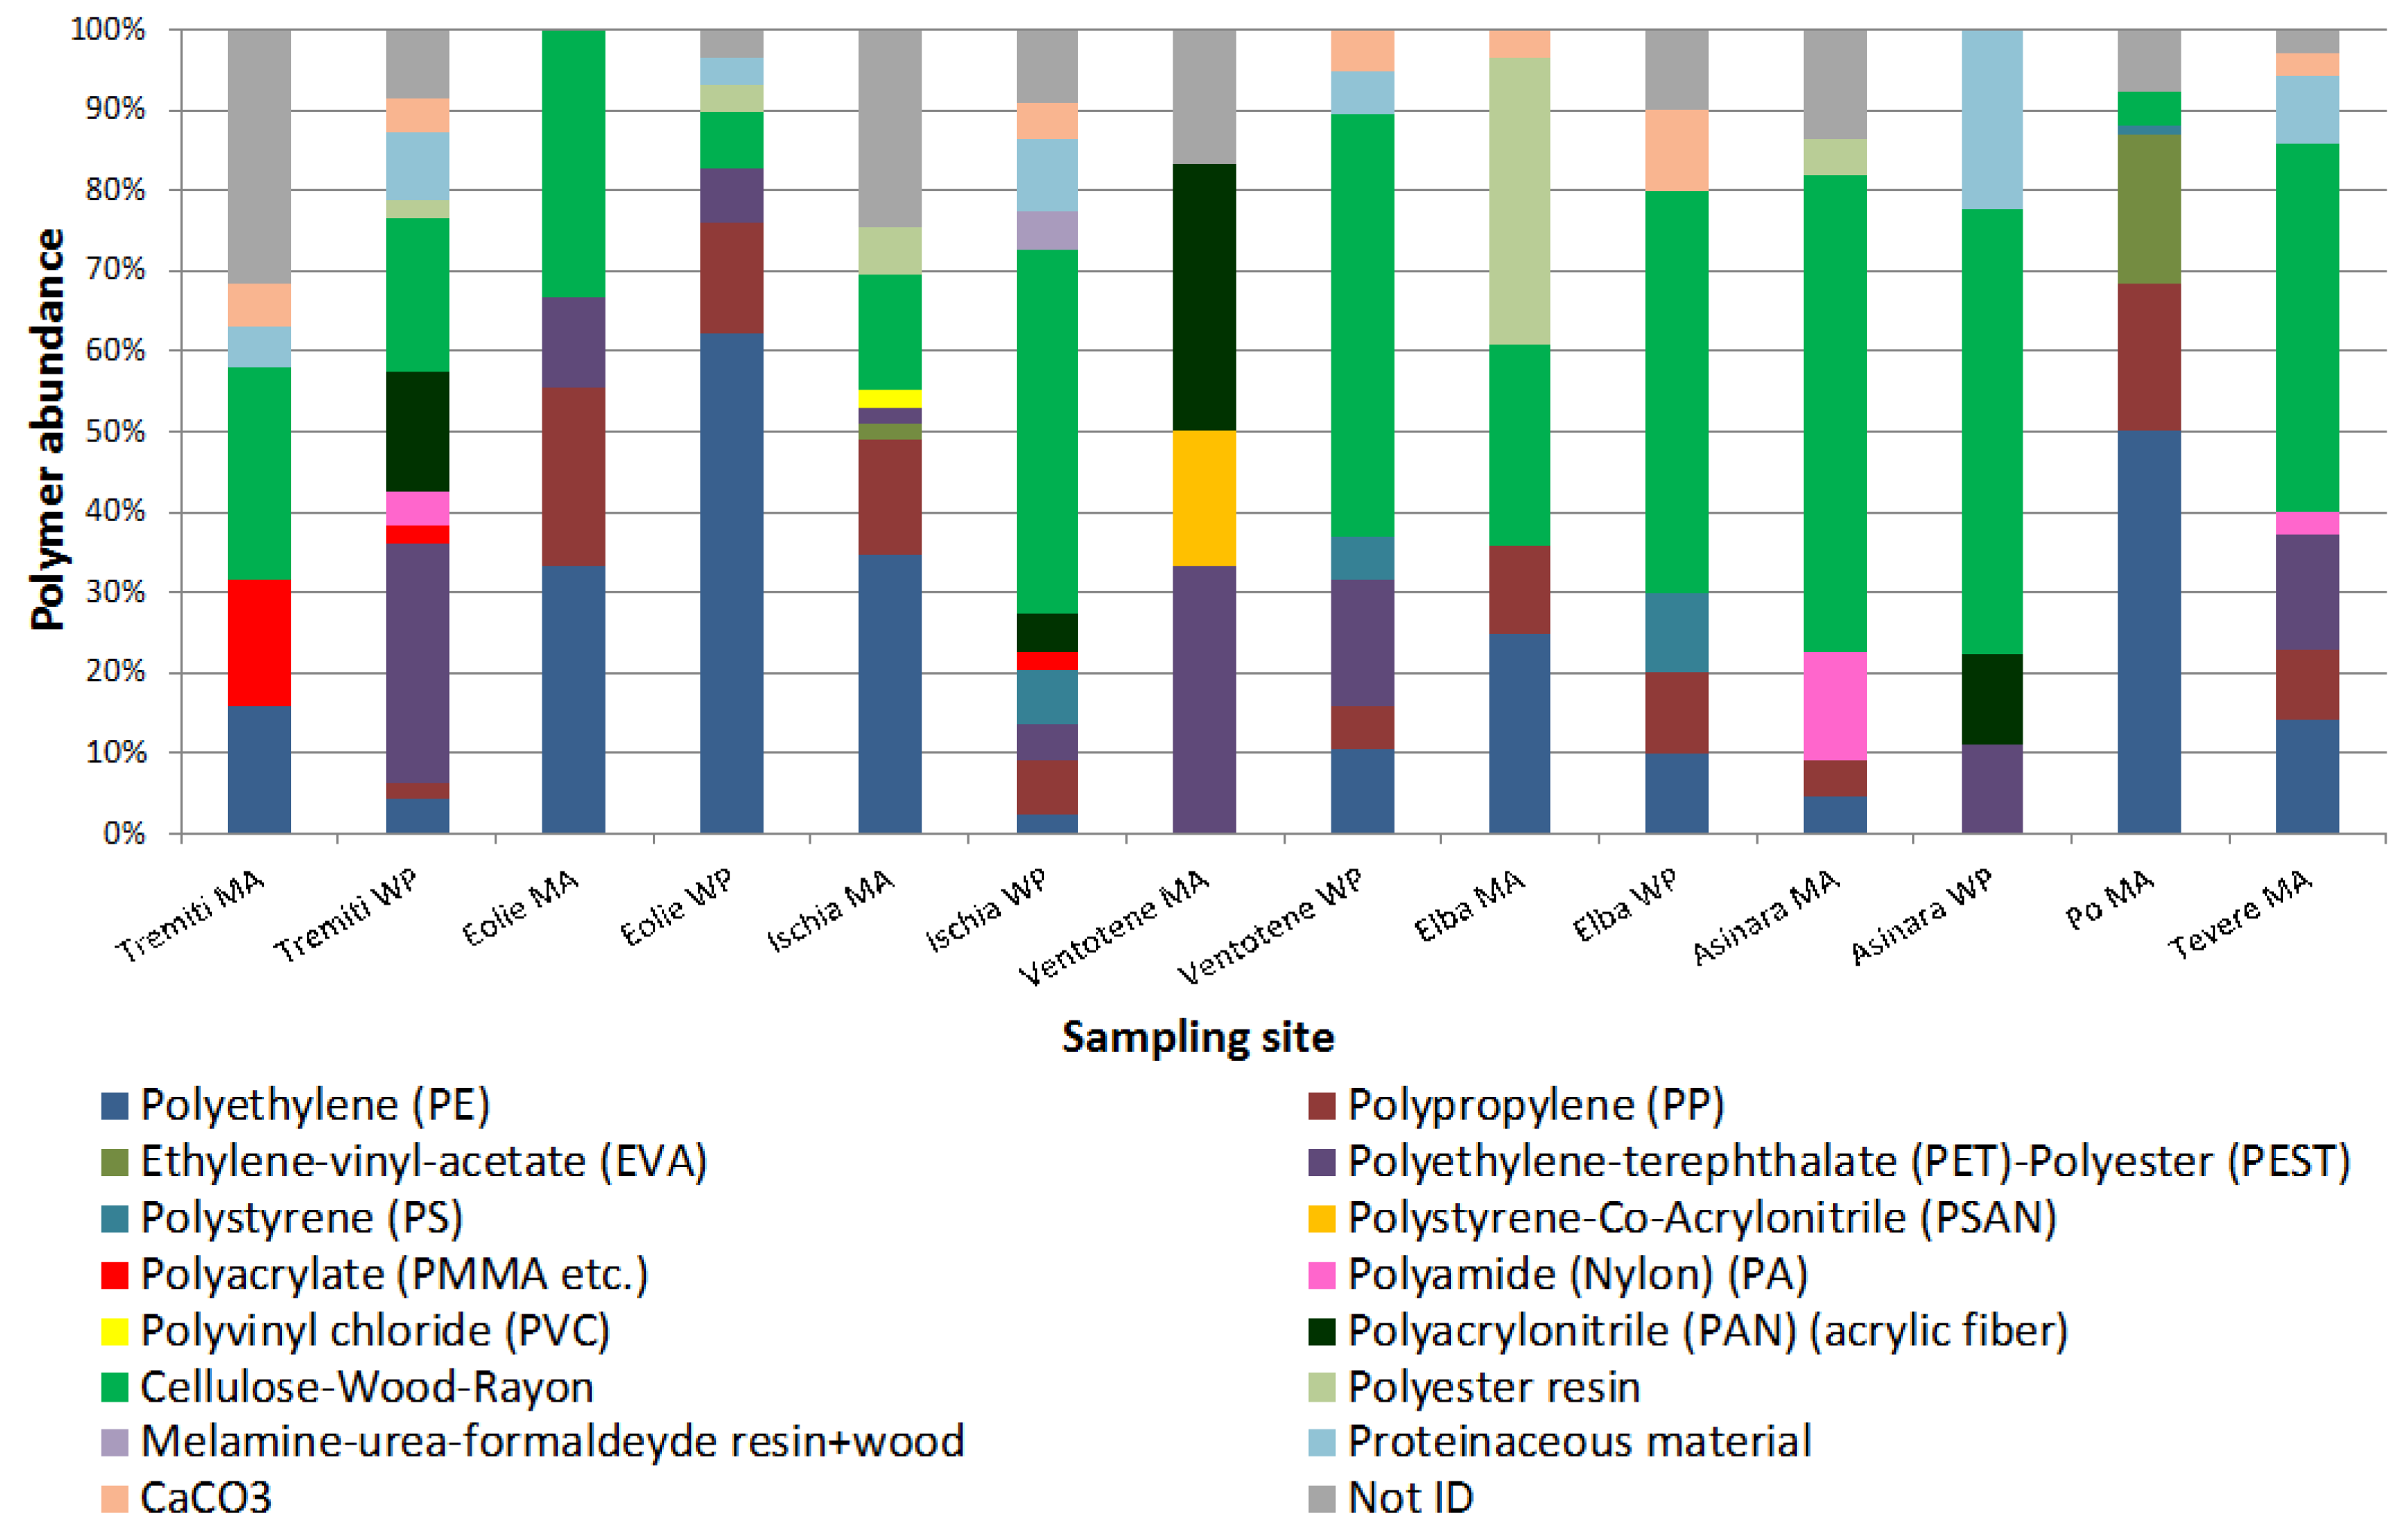
The synthetic polymeric and the natural/man-made materials found in all samples (MA and WP2) were polyethylene (PE–26%), polypropylene (PP–11%), polyethylene-terephthalate/polyester (PET-polyester–8%) and ethylene-vinyl-acetate (EVA–5%). These polymers were distributed as follows: Tremiti (PET-Polyester 21%, cellulose-rayon-wood 21%, Not ID 15%, PAN 11%), Eolie (PE 55%, PP 16%, cellulose-wood-rayon 13%, PET-polyester 8%), Ischia (cellulose-wood-rayon 29%, PE 19%, Not ID 17%, PP 11%), Ventotene (cellulose-wood rayon 40%, PET-Polyester 20%, PAN 8%, PE 8%), Elba (cellulose-wood-rayon 32%, polyester resin 26%, PE 21%, PP 11%) and Asinara (cellulose-wood-rayon 58% PA 10%, Not-ID 10%, proteinaceous material 6%). Data for Po and Tevere sites were obtained only through MA samples: Po (PE 50%, PP 18%, EVA 18%, Not ID 5%), Tevere (cellulose-wood-rayon 46%, PET-polyester 14%, PE 14%, PP 9%). Comparing the abundance of polymer types (MA vs. WP2); MA showed a major abundance of PE (32%), cellulose–rayon–wood (21%), PP (13%), EVA (7%), PET-polyester (5%) and polyester resin (5%); while WP2 showed a distribution dominated by cellulose–rayon–wood (32%), PE (15%), PET-polyester (14%), proteinaceous particles (8%), PAN (6%), PP (6%), PS (3%) (Figure 4).
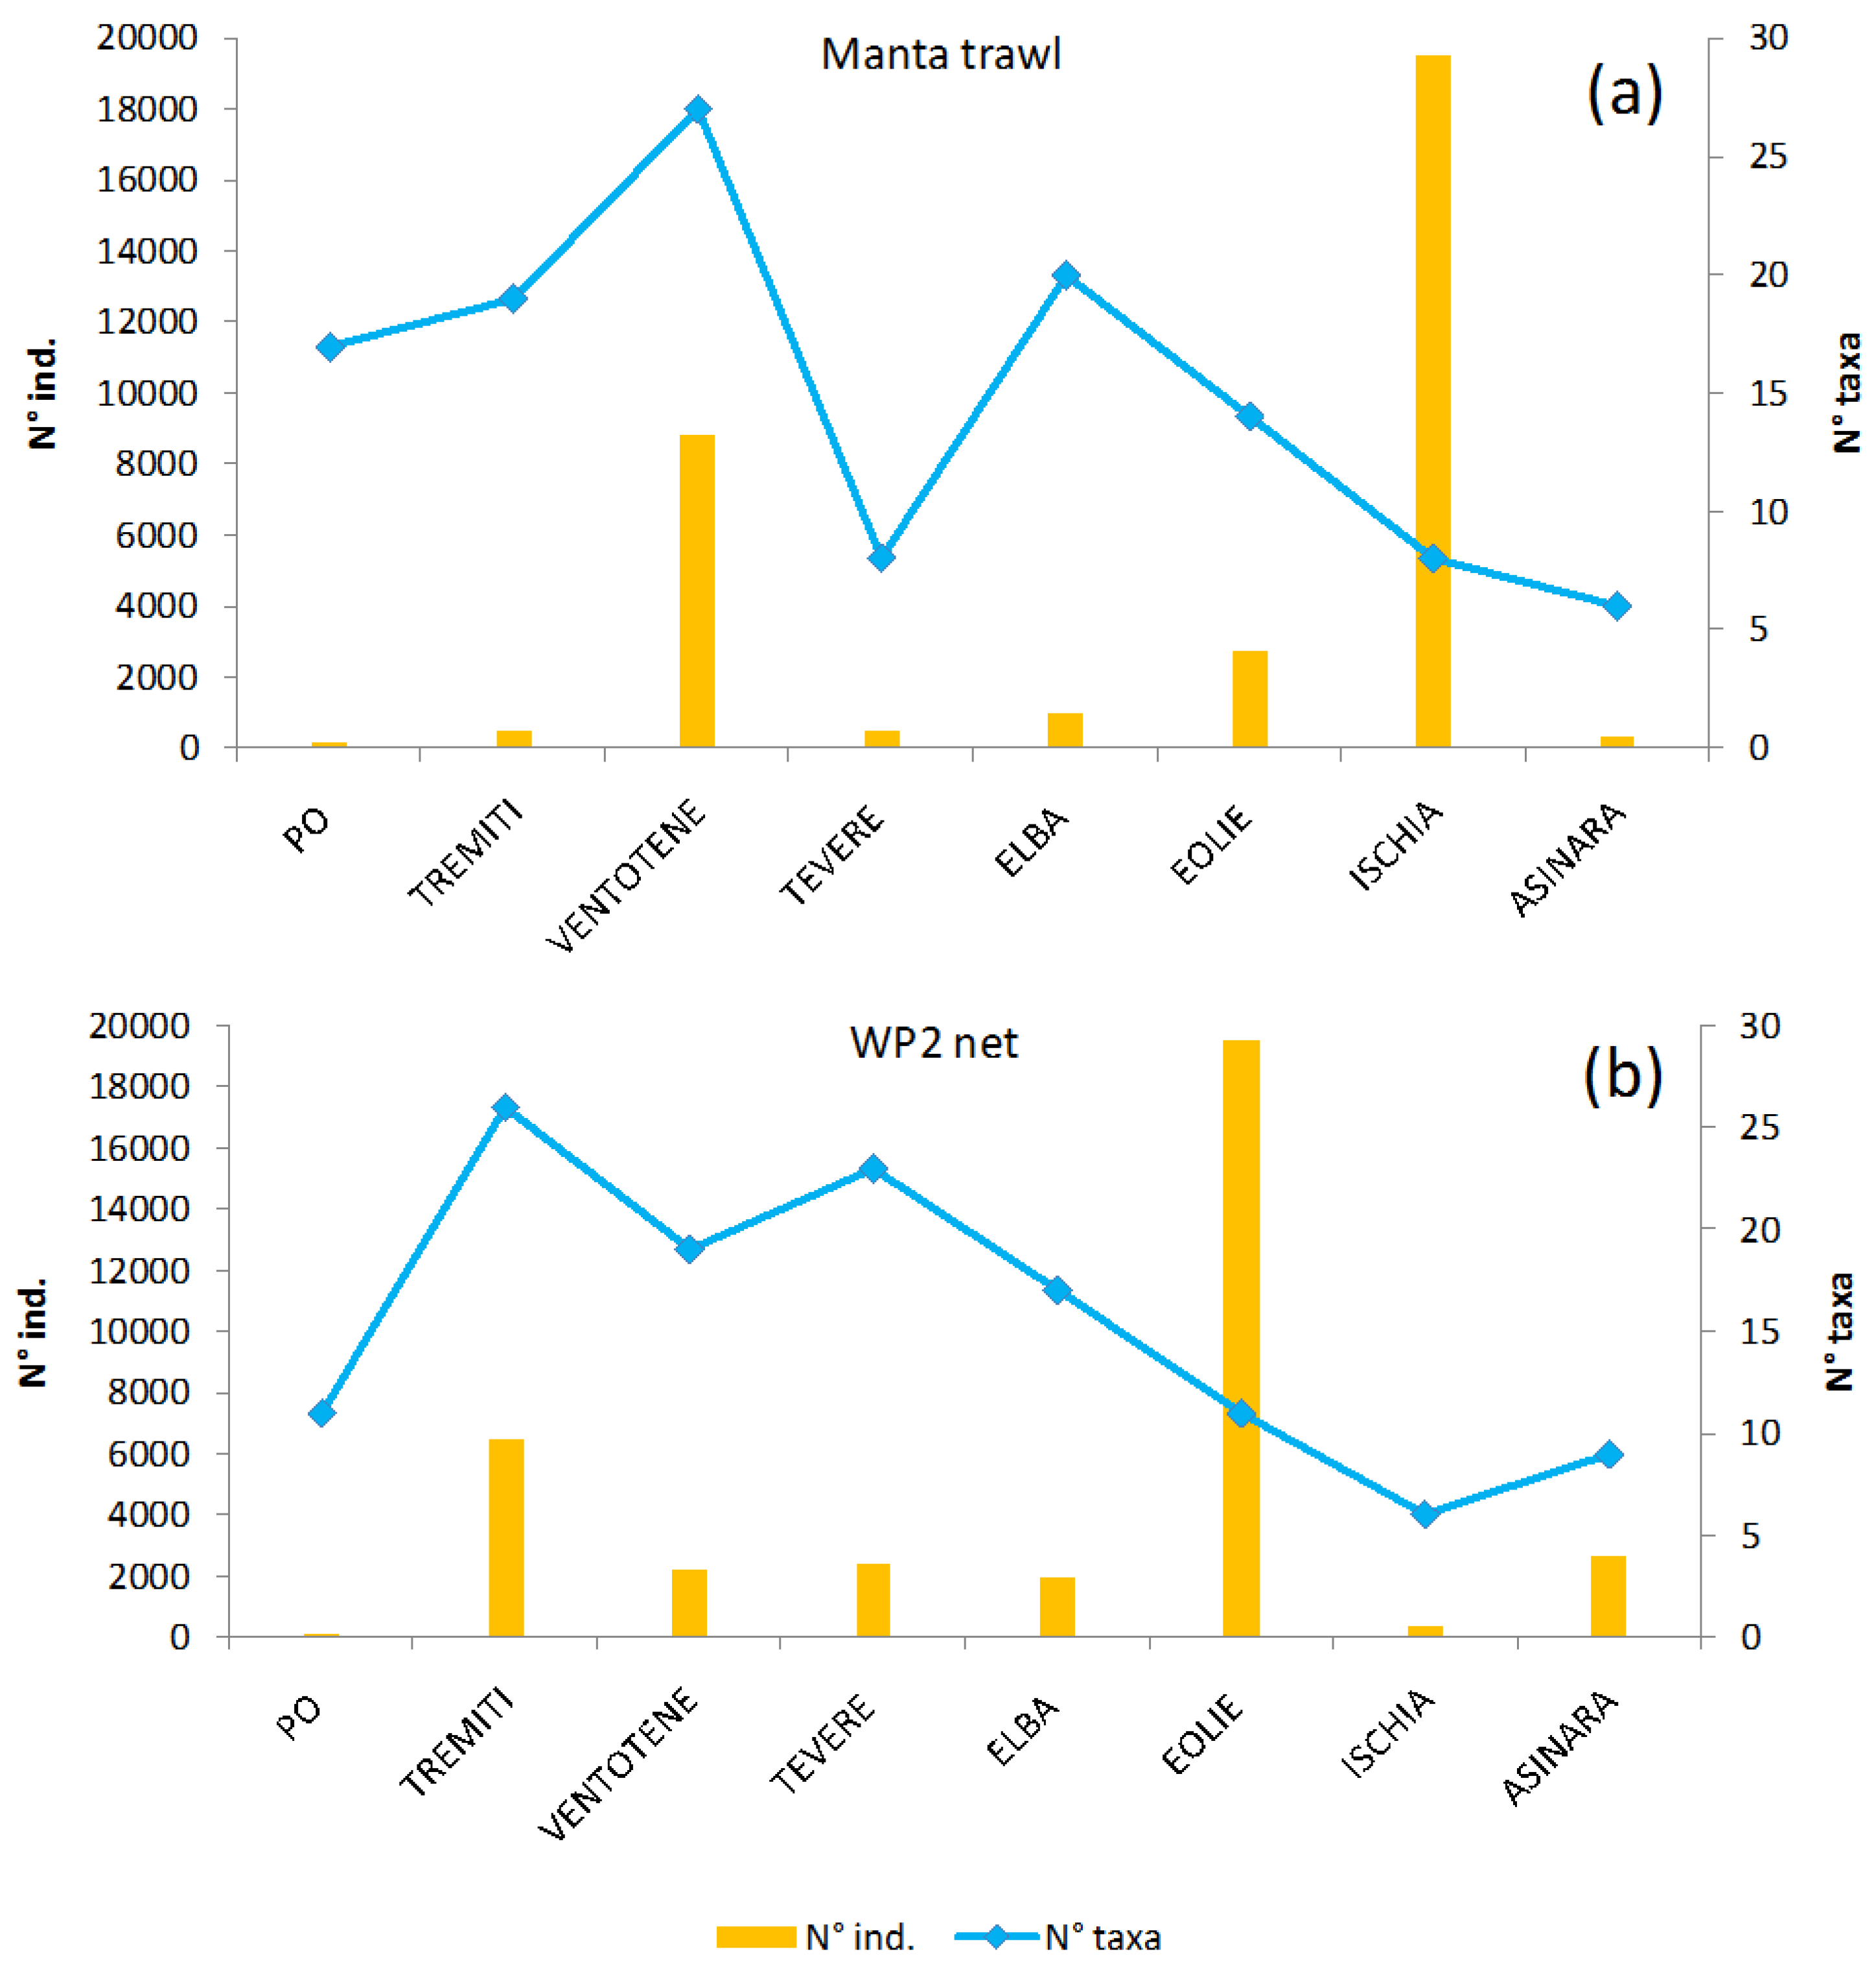
The data obtained from plankton showed a high variability in the number of taxa and individuals for both gears and sites (Figure 5). The results for PCBs and pesticides are shown in Table 1. The highest values of PCBs in relation to the weight of extracted matter (ng/g) were found in Asinara (MA = 2504 ng/g; WP2 = 849.3 ng/g), while the lowest were in Ischia (MA = 93.80 ng/g; WP2 = 59.29 ng/g). If we consider the volume of water filtered (ng/m3), MA samples showed higher values in Elba (0.83 ng/m3) and the lowest in Tremiti (MA = 0.026 ng/ m3). WP2 values were higher in Ventotene (0.77 ng/m3), while the lowest were in Ischia (0.32 ng/m3). Most of the surface waters analyzed showed high concentrations of PCBs, except in Ventotene (WP2 = 0.77 ng/m3; MA = 0.36 ng/m3) and Asinara (WP2 = 0.47 ng/m3; MA = 0.36 ng/m3).

4. Discussion

Plastic litter density has been demonstrated to be correlated with human population [5,8]. This study confirms the hypothesis that MP are found in larger quantities in proximity to litter sources such as river systems. In particular, it has been confirmed that sewage outfalls are a major source of MP dispersion into the environment [15].
Our results demonstrate a high value of MP average abundance among the sites, which is in accordance with other areas in the Mediterranean Sea [13,33,34]. Although a high variability of MP density was found between the different sites, this was not significant, as shown by statistical analysis. On the other hand, if we consider that the minor islands are far from major sources of pollution (rivers), our results prove and confirm the correlation between the higher density of MP and proximity to major river systems [5,9]. It is important to note that the input of MP from the rivers during the sampling period is to be considered “de minimis” since previous studies have shown a higher abundance during the rainy seasons [5]. In the future, it would be desirable to give further attention to the relationship between different seasons and MP density in proximity to sources such as rivers.
Another important outcome is the overall uniformity of the MP density obtained by the two different sampling gears, where MA was sampling surface waters and WP2 from 20 m to the surface layer. This comparison between the two sampling gears, over a wide portion of the Mediterranean Sea, is an original datum for the area and makes an important contribution to a finer assessment of the distribution of MP in areas that are not close to major sources of pollution. It is plausible that the hydrodynamics around the minor islands are constantly mixing the waters; therefore, it is less probable that accumulation zones are present in the study area [35].
The polymers distribution was extremely variable among the sampling sites; thus, drawing attention to their high spatial variability throughout the study area. The μFT-IR polymeric analysis has allowed us to clearly identify all the polymeric, organic and semisynthetic materials (Figure 2); therefore, giving a more accurate quantification of the MP sample size. As a result, the ubiquity of the most common polymer types, such as polyethylene and polypropylene, was confirmed in accordance with Endo et al. [36]. Moreover, it is important to point out that our study found low values of polystyrene and polyvinyl-chloride. The polymer variability was also observed between the samples collected with MA and WP2 gears. It is probable that a relevant percentage of cellulose-based fibres and particles are attributable to different sources of impact, for example, the progressive fragmentation of wood chips in the marine environment. Fibres may derive from fabrics and could be related to washing machine discharge, as previously highlighted by Browne et al. [35]. Moreover, in some of the samples, polymeric resin particles were detected, these are probably derived from paint particles that come off ships and boats. This hypothesis is confirmed by data previously published by Song et al. [37]. PCBs and pesticides detected in Asinara are high compared to the literature, since Scarpato et al. [38] showed medium levels of contamination in this area in the North of Sardinia. The plankton taxa did not suggest any direct connection with MP, and showed a different composition at both levels, the surface layer (MA) and the deeper one (WP2) (Figure 5). The absence of any relation between marine litter and plankton has been evident since the first studies on this topic as shown by Moore et al. [39]. Moreover, the total density of MP and plankton abundance was shown to differ significantly over the seasons, among areas and by depth [40]. Therefore, long-term studies carried out at different water depths and on a suitable spatial scale need to be developed in order to improve our understanding of the relationship between MP and plankton.
By categorizing the MP colors, black was the most commonly found in the study area. This color has been demonstrated to adsorb PCBs and PAHs (polycyclic aromatic hydrocarbons) in greater concentrations compared to other colors [22,41]. Another important parameter to better categorize MP could be the ageing process since it has been demonstrated to influence the adsorbance of pollutants [22]. These aspects are crucial since MP become carriers of other types of pollutants, thereby aiding their dispersion across the oceans.
For POPs analysis, we considered PCBs (17 Congeners) and pesticides of greater environmental concern (Directive 2013/39/EU; Italian Legislative Decree 172/2015). PCB 101, 110 and 52 had the greater percentages in the samples analyzed, ranging from 20 to 30%, while PCB 118, PCB 153, PCB 138 and 105 varied between 5% and 10%. This is in accordance with previous studies where PCB 110 and PCB 138 showed the highest percentages in China, and PCB 138, PCB 153, PCB 180 were the most common in Greece and Portugal [35]. However, our results slightly differ from what is generally detected in environmental samples, particularly for biota and sediment, where the PCB 153 and 138 are usually the predominant ones [38]. The sum of DDs (dichloro diphenyls) for the sea surface showed values ranging from 271 ng/g for Asinara to 9.89 ng/g for Tremiti, whereas, for the deep layer, the values ranged from 91.5 ng/g for Asinara to 5.78 ng/g for Ischia. The isomers of DDT were often under the limit of quantification (LOQ), evidencing that these products are no longer in use, although their metabolites are still present in the environment. An analysis of the distribution of metabolite products (4,4’, 2,4’ DDE and 4,4’, 2,4’ DDD) determined that 4,4’ DDE had the highest percentage, followed by 2,4’ DDE. These findings are in accordance with the distribution of DDT and its metabolites noticed in environmental samples and marine biota [42,43,44]. The sum of the congeners of HCH show a low contamination range, varying from 14 ng/g for Asinara to <0.10 ng/g for Tremiti. Although these values are representative of low contamination, they are still high compared to the literature regarding marine environments [42].
This piece of work shows that the analysis of “clean waters” in remote areas is another important step in the assessment of MP distribution. Further attention should be given to the study of MP distribution in deep waters, as well as in the sediments [15], since an accurate analysis of this type of pollution should not be limited to surface waters.

5. Conclusions

The abundance and distribution of MP were evaluated in six “clean” sites (Italian minor islands) and in two “polluted” areas (near river mouths) and results show that all the sites are contaminated by this type of pollution. As highlighted by other studies [8,9,31,45,46], a quite high spatial variability was detected in polymer distribution and plastic concentration. The samples were also analyzed to determine PCB and OC contamination, both derived from natural and anthropogenic sources. Results demonstrate that the concentration of contaminants does not match with MP presence, highlighting that the contamination of water bodies is the result of multiple contributors. It is important to take this into consideration when evaluating the multiple negative effects on marine fauna and in the implementation of mitigation measures to protect and preserve marine ecosystems. To conclude, in order to reduce these kinds of pollution and to improve the conservation status of the sea, we think that the utmost attention should be given to informing communities and schools. As stated by Derraik et al. [1], acting locally and changing attitudes is a fundamental step towards increasing awareness.

Supplementary Materials

The following are available online at https://www.mdpi.com/2073-4441/10/8/1108/s1, Table S1: Number of MP and m3 of filtered water for each site and replicate.

Author Contributions

All the authors contributed to field activities and to the general revision of the paper; in particular G.A.d.L. has written the paper, A.V. was in charge of FTIR processing and data analysis, P.T. and D.V. analyzed the plankton assemblages, M.A. and G.R. assessed POP levels.

Funding

The monitoring campaign and lab analyses were funded by Legambiente ONLUS and JPI-Ocean BASEMAN Project (Defining the baselines and standards for microplastics analyses in European waters).

Acknowledgments

The monitoring campaign and lab analyses were funded by Legambiente ONLUS and JPI-Ocean BASEMAN Project (Defining the baselines and standards for microplastics analyses in European waters). We are also grateful to the anonymous referees who have greatly improved the original version of the manuscript.

Conflicts of Interest

The authors declare no conflict of interest regarding the publication of this paper.

References

  1. Derraik, J.G.B. The pollution of the marine environment by plastic debris: A review. Mar. Pollut. Bull. 2002, 44, 842–852. [Google Scholar] [CrossRef]
  2. Thompson, R.C.; Swan, S.H.; Moore, C.J.; vom Saal, F.S. Our plastic age. Philos. Trans. R. Soc. B Biol. Sci. 2009, 364, 1973–1976. [Google Scholar] [CrossRef] [PubMed] [Green Version]
  3. Thompson, R.C. Plastic debris in the marine environment: Consequences and solutions. In Marine Nature Conservation in Europe; Krause, J.C., Nordheim, H., Bräger, S., Eds.; Federal Agency for Nature Conservation: Stralsund, Germany, 2006; pp. 107–115. [Google Scholar]
  4. Thompson, R.C.; Olsen, Y.; Mitchell, R.P.; Davis, A.; Rowland, S.J.; Anthony, W.G.J.; McGonigle, D.; Russell, A. Lost at Sea: Where Is All the Plastic? Science 2004, 304, 838. [Google Scholar] [CrossRef] [PubMed]
  5. Cheung, P.K.; Fok, L.; Hung, P.L.; Cheung, L.T.O. Spatio-temporal comparison of neustonic microplastic density in Hong Kong waters under the influence of the Pearl River Estuary. Sci. Total Environ. 2018, 628, 731–739. [Google Scholar] [CrossRef] [PubMed]
  6. Gray, A.D.; Leads, R.; Wertz, H.; Weinstein, J.E. Microplastic in two South Carolina Estuaries: Occurrence, distribution, and composition. Mar. Pollut. Bull. 2018, 128, 223–233. [Google Scholar] [CrossRef] [PubMed]
  7. Gregory, M.R. Environmental implications of plastic debris in marine settings: Entanglement, ingestion, smothering, hangers-on, hitch-hiking and alien invasions. Philos. Trans. R. Soc. B Biol. Sci. 2009, 364, 2013–2025. [Google Scholar] [CrossRef] [PubMed]
  8. Barnes, D.K.A.; Galgani, F.; Thompson, R.C.; Barlaz, M. Accumulation and fragmentation of plastic debris in global environments. Philos. Trans. R. Soc. B 2009, 364, 1985–1998. [Google Scholar] [CrossRef] [PubMed] [Green Version]
  9. Browne, M.A.; Galloway, T.S.; Thompson, R.C. Spatial patterns of plastic debris along Estuarine shorelines. Environ. Sci. Technol. 2010, 44, 3404–3409. [Google Scholar] [CrossRef] [PubMed]
  10. Arthur, C.; Baker, J.; Bamford, H. NOAA Technical Memorandum NOS-OR & R-30. In Proceedings of the International Research Workshop on the Occurrence, Effects and Fate of Microplastic Marine Debris, Tacoma, WA, USA, 9–11 September 2009; NOAA: Silver Spring, MD, USA. [Google Scholar]
  11. Moore, C.J. Synthetic polymers in the marine environment: A rapidly increasing, long-term threat. Environ. Res. 2008, 108, 131–139. [Google Scholar] [CrossRef] [PubMed]
  12. Claessens, M.; Meester, S.D.; Landuyt, L.V.; Clerck, K.D.; Janssen, C.R. Occurrence and distribution of microplastics in marine sediments along the Belgian coast. Mar. Pollut. Bull. 2011, 62, 2199–2204. [Google Scholar] [CrossRef] [PubMed]
  13. Collignon, A.; Hecq, J.H.; Galgani, F.; Voisin, P.; Collard, F.; Goffart, A. Neustonic microplastic and zooplankton in the North Western Mediterranean Sea. Mar. Pollut. Bull. 2012, 64, 861–864. [Google Scholar] [CrossRef] [PubMed] [Green Version]
  14. Rochman, C.M.; Browne, M.A.; Halpern, B.S.; Hentschel, B.T.; Hoh, E.; Karapanagioti, H.; Rios-Mendoza, L.; Takada, H.S.; Thompson, R.C. Policy: Classify plastic waste as hazardous. Nature 2013, 494, 169–171. [Google Scholar] [CrossRef] [PubMed]
  15. Eriksen, M.; Lebreton, L.C.M.; Carson, H.S.; Thiel, M.; Moore, C.J.; Borerro, J.C.; Galgani, F.; Ryan, P.G.; Reisser, J. Plastic pollution in the World’s oceans: More than 5 trillion plastic pieces weighing over 250,000 tons afloat at sea. PLoS ONE 2014, 9, e111913. [Google Scholar] [CrossRef] [PubMed] [Green Version]
  16. Wieczorek, A.M.; Morrison, L.; Croot, P.L.; Allcock, A.L.; MacLoughlin, E.; Savard, O.; Brownlow, H.; Doyle, T.K. Frequency of Microplastics in Mesopelagic Fishes from the Northwest Atlantic. Front. Mar. Sci. 2018, 5, 39. [Google Scholar] [CrossRef]
  17. Wright, S.L.; Thompson, R.C.; Galloway, T.S. The physical impacts of microplastics on marine organisms: A review. Environ. Pollut. 2013, 178, 483–492. [Google Scholar] [CrossRef] [PubMed]
  18. Hidalgo-Ruz, V.; Gutow, L.; Thompson, R.C.; Thiel, M. Microplastics in the marine environment: A review of the methods used for identification and quantification. Environ. Sci. Technol. 2012, 46, 3060–3075. [Google Scholar] [CrossRef] [PubMed]
  19. Rochman, C.M.; Hoh, E.; Kurobe, T.; Teh, S.J. Ingested plastic transfers hazardous chemicals to fish and induces hepatic stress. Sci. Rep. 2013, 3, 3263. [Google Scholar] [CrossRef] [PubMed]
  20. Tanaka, K.; Takada, H.; Yamashita, R.; Mizukawa, K.; Fukuwaka, M.A.; Watanuki, Y. Accumulation of plastic-derived chemicals in tissues of seabirds ingesting marine plastics. Mar. Pollut. Bull. 2013, 69, 219–222. [Google Scholar] [CrossRef] [PubMed]
  21. Farrell, P.; Nelson, K. Trophic level transfer of microplastic: Mytilus edulis (L) to Carcinus maenas (L.). Environ. Pollut. 2013, 177, 1–3. [Google Scholar] [PubMed]
  22. Frias, J.P.G.L.; Sobral, P.; Ferreira, M. Organic pollutants in microplastics from two beaches of the Portuguese coast. Mar. Pollut. Bull. 2010, 60, 1988–1992. [Google Scholar] [CrossRef] [PubMed]
  23. Bakir, A.; Rowland, S.J.; Thompson, R.C. Competitive sorption of persistent organic pollutants onto microplastics in the marine environment. Mar. Pollut. Bull. 2012, 64, 2782–2789. [Google Scholar] [CrossRef] [PubMed]
  24. Rocha-Santos, T.; Duarte, A.C. A critical overview of the analytical approaches to the occurrence, the fate and the behavior of microplastics in the environment. Trends Analyt. Chem. 2014, 65, 47–53. [Google Scholar] [CrossRef]
  25. Renner, G.; Schmidt, T.C.; Schram, J. Analytical methodologies for monitoring micro(nano)plastics: Which are fit for purpose? Curr. Opin. Environ. Sci. Health 2018, 1, 55–61. [Google Scholar] [CrossRef]
  26. Fries, E.; Dekiff, J.H.; Willmeyer, J.; Nuelle, M.T.; Ebert, M.; Remy, D. Identification of polymer types and additives in marine microplastic particles using pyrolysis-GC/MS and scanning electron microscopy. Environ. Sci. Process. Impacts 2013, 15, 1949–1956. [Google Scholar] [CrossRef] [PubMed]
  27. Browne, M.A.; Chapman, M.G.; Thompson, R.C.; Amaral Zettler, L.A.; Jambeck, J.; Mallos, N.J. Spatial and Temporal Patterns of Stranded Intertidal Marine Debris: Is There a Picture of Global Change? Environ. Sci. Technol. 2015, 49, 7082–7094. [Google Scholar] [CrossRef] [PubMed]
  28. Dümichen, E.; Barthel, A.K.; Braun, U.; Bannick, C.G.; Brand, K.; Jekel, M.; Senz, R. Analysis of polyethylene microplastics in environmental samples, using a thermal decomposition method. Water Res. 2015, 85, 451–457. [Google Scholar] [CrossRef] [PubMed]
  29. Fischer, M.; Scholz-Böttcher, B.M. Simultaneous Trace Identification and Quantification of Common Types of Microplastics in Environmental Samples by Pyrolysis-Gas Chromatography-Mass Spectrometry. Environ. Sci. Technol. 2017, 51, 5052–5060. [Google Scholar] [CrossRef] [PubMed]
  30. Galgani, F.; Feet, D.; Van Franeker, J.; Katsanevakis, S.; Maes, T.; Oosterbaan, L.; Poito, I.; Hanke, G.; Thompson, R.; Amato, E.; et al. Marine Strategy Framework Directive; Task Group 10, Marine Litter Report; European Commission Joint Research Center, IFREMER & ICES: Nantes, France, 2010; p. 58. [Google Scholar]
  31. Käppler, A.; Windrich, F.; Löder, M.G.; Malanin, M.; Fischer, D.; Labrenz, M.; Voit, B. Identification of microplastics by FTIR and Raman microscopy: A novel silicon filter substrate opens the important spectral range below 1300 cm−1 for FTIR transmission measurements. Anal. Bioanal. Chem. 2015, 407, 6791–6801. [Google Scholar] [PubMed]
  32. US. EPA. The Risk Assessment Guidelines of 1986; EPA/600/8-87/045; Office of Health and Environmental Assessment: Washington, DC, USA, 1987.
  33. De Lucia, G.A.; Caliani, I.; Marra, S.; Camedda, A.; Coppa, S.; Alcaro, L.; Campani, T.; Giannetti, M.; Coppola, D.; Cicero, A.M.; et al. Amount and distribution of neustonic micro-plastic off the western Sardinian coast (Central-Western Mediterranean Sea). Mar. Environ. Res. 2014, 100, 10–16. [Google Scholar] [CrossRef] [PubMed]
  34. Fossi, M.C.; Panti, C.; Guerranti, C.; Coppola, D.; Giannetti, M.; Marsili, L.; Minutoli, R. Are baleen whales exposed to the threat of microplastics? A case study of the Mediterranean fin whale (Balaenoptera physalus). Mar. Pollut. Bull. 2012, 64, 2374–2379. [Google Scholar] [PubMed]
  35. Browne, M.A.; Crump, P.; Niven, S.J.; Teuten, E.; Tonkin, A.; Galloway, T.; Thompson, R. Accumulation of microplastic on shorelines worldwide: Sources and sinks. Environ. Sci. Technol. 2011, 45, 9175–9179. [Google Scholar] [CrossRef] [PubMed]
  36. Endo, S.; Takizawa, R.; Okuda, K.; Takada, H.; Chiba, K.; Kanehiro, H.; Ogi, H.; Yamashita, R.; Date, T. Concentration of polychlorinated biphenyls (PCBs) in beached resin pellets: Variability among individual particles and regional differences. Mar. Pollut. Bull. 2005, 50, 1103–1114. [Google Scholar] [CrossRef] [PubMed]
  37. Song, Y.K.; Hong, S.H.; Jang, M.; Kang, J.H.; Kwon, O.Y.; Han, G.M.; Shim, W.J. Large Accumulation of Micro-sized Synthetic Polymer Particles in the Sea Surface Microlayer. Environ. Sci. Technol. 2014, 48, 9014–9021. [Google Scholar] [CrossRef] [PubMed]
  38. Scarpato, A.; Romanelli, G.; Galgani, F.; Giovanardi, F.; Giordano, P.; Calvo, M.; Caixap, J.; BenBrahim, S.; Sammari, C.; Deudero, S.; et al. Western Mediterranean coastal waters-Monitoring PCBs and pesticides accumulation in Mytilus galloprovincialis by active mussel watching: The Mytilos project. J. Environ. Monit. 2010, 12, 924–935. [Google Scholar] [CrossRef] [PubMed] [Green Version]
  39. Moore, C.J.; Moore, S.L.; Leecaster, M.K.; Weisberg, S.B. A comparison of plastic and plankton in the North Pacific Central Gyre. Mar. Pollut. Bull. 2001, 42, 1297–1300. [Google Scholar] [CrossRef]
  40. Lima, A.R.A.; Costa, M.F.; Barletta, M. Distribution patterns of microplastics within the plankton of a tropical estuary. Environ. Res. 2014, 132, 146–155. [Google Scholar] [CrossRef] [PubMed]
  41. Antunes, J.C.; Frias, J.G.L.; Micaelo, A.C.; Sobral, P. Resin pellets from beaches of the Portuguese coast and adsorbed persistent organic pollutants. Estuar. Coast. Shelf Sci. 2013, 130, 62–69. [Google Scholar] [CrossRef]
  42. Wang, F.W.; Charle, C.; Da, L.; Xingwen, W.; Fei, Y.; Zeng, E. Interaction of toxic chemicals with microplastics: A critical review. Water Res. 2018, 139, 208–219. [Google Scholar] [CrossRef] [PubMed]
  43. Turci, R.; Businaro, J.; Minoia, C.; Sturchio, E.; Ficociello, B.; Signorini, S.; Colosio, C.; Imbriani, M. Interferenti endocrini, schede monografiche: DDT, DDE e DDD. G. Ital. Med. Lav. Erg. 2010, 32, 93–144. [Google Scholar]
  44. Storelli, M.M.; Storelli, A.; Marcotrigiano, G.O. Polychlorinated biphenyls, hexachlorobenzene, hexachlorocyclohexane isomers, and pesticide organochlorine residues in cod-liver oil dietary supplements. J. Food Prot. 2004, 67, 1787–1791. [Google Scholar] [CrossRef] [PubMed]
  45. Zhang, W.; Zhang, S.; Wang, J.; Wang, Y.; Mu, J.; Wang, P.; Xinzhen, L.; Ma, D. Microplastic pollution in the surface waters of the Bohai Sea, China. Environ. Pollut. 2017, 231, 541–548. [Google Scholar] [CrossRef] [PubMed]
  46. Cózar, A.; Sanz-Martín, M.; Martí, E.; González-Gordillo, J.I.; Ubeda, B.; Gálvez, J.Á.; Irigoien, X.; Duarte, C.M. Plastic Accumulation in the Mediterranean Sea. PLoS ONE 2015, 10, e0121762. [Google Scholar] [CrossRef] [PubMed]
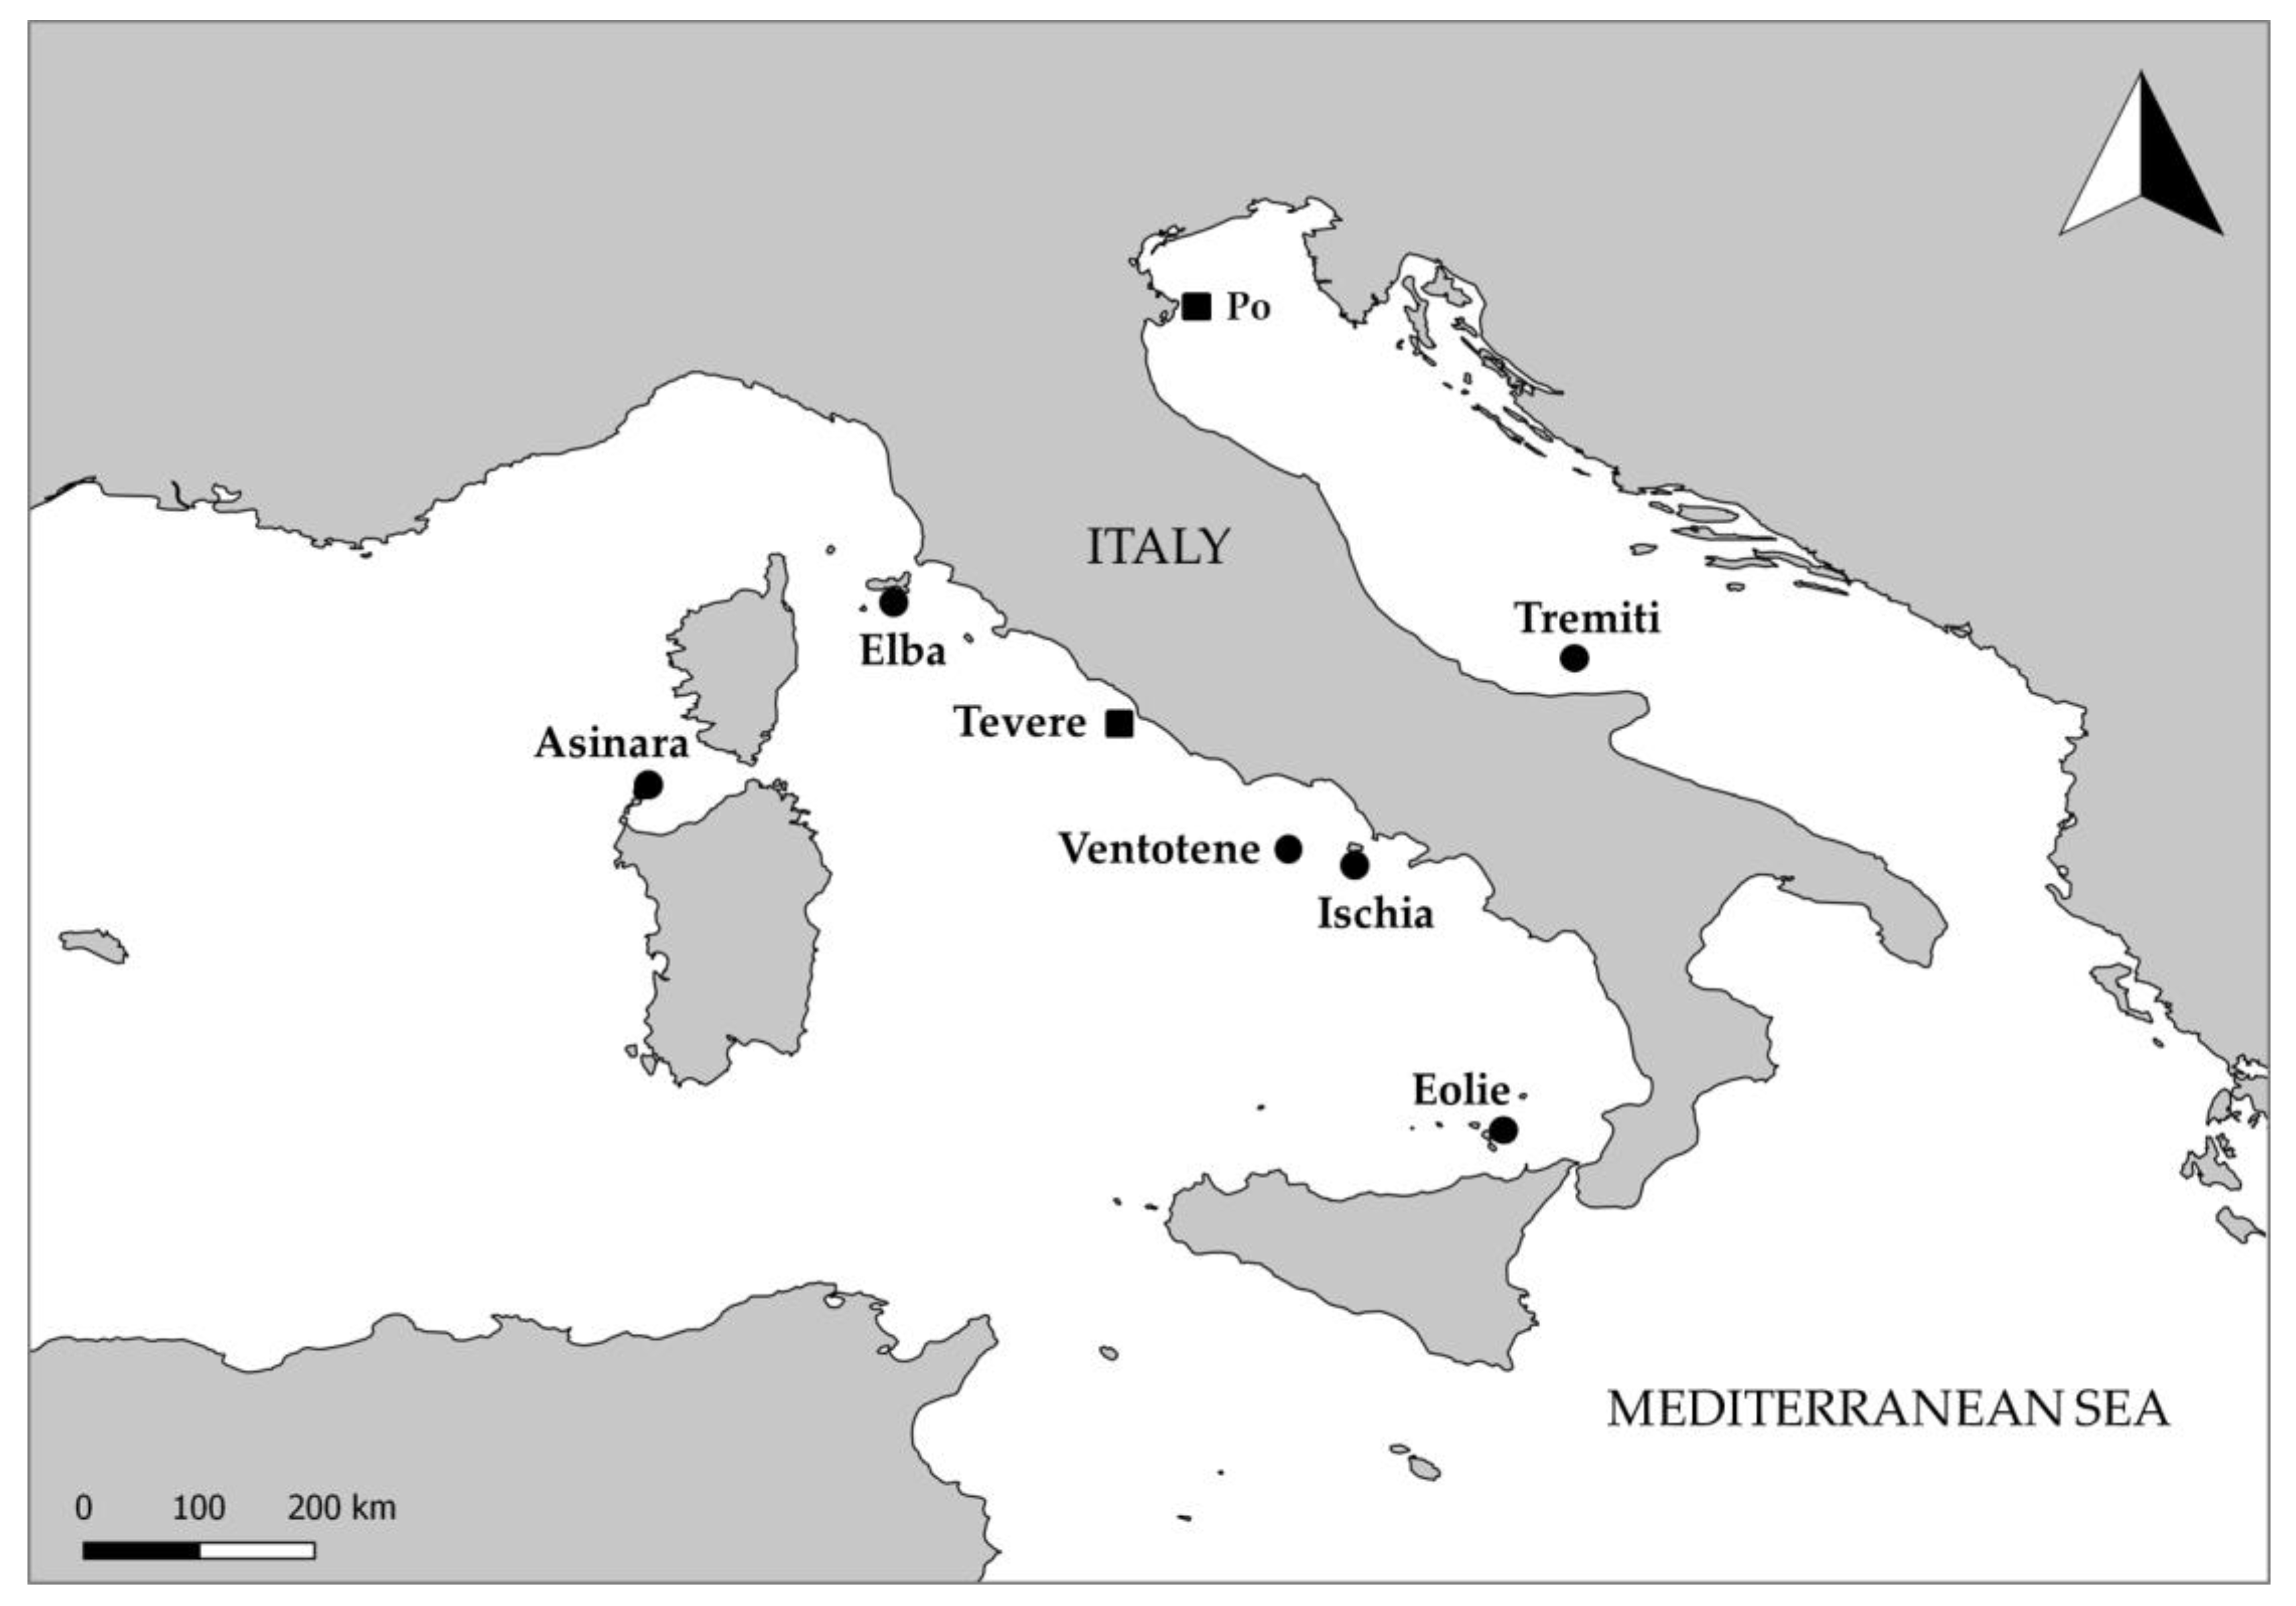
Figure 1. Map of the study area. In each site, 8 replicates (4 mantra trawl (MA) + 4 plankton net (WP2)) were performed, with the exception of the Tevere and Po sites where only MA was employed. The minor islands are shown as circles and the river mouths as squares.
Water 10 01108 g001
Figure 2. Microplastics (MP) density (items/m3) found at the minor islands with two sampling gears (MA and WP2) and at river mouths with MA.
Water 10 01108 g002
Figure 3. Color percentages found in the samples collected by MA and WP2.
Water 10 01108 g003
Figure 4. The abundance of polymeric, semi-synthetic, natural/man-made and biogenic materials found at the sampling sites, identified by micro-Fourier transform infrared spectroscopy (μFT-IR) analysis. MA indicates manta trawl samples and WP indicates WP2 samples.
Water 10 01108 g004
Figure 5. Plankton abundance and diversity with MA (a) and WP2 (b) in the different sampling sites.
Water 10 01108 g005
Table 1. Polychlorinated biphenyls and organochlorine pesticides in filtered water samples. MA was used to sample surface water and WP2 for deep water.
PCB ng/g in Surface WaterPCB ng/g in Deep Water
SiteAsinaraIschia VentoteneTevereTremitiEoliePo ElbaAsinaraIschiaVentoteneElba
PCB 3110.871.284.451.40.457.23514.248.010.413.397.12
PCB 286.340.513.891.180.626.044.397.294.210.412.464.42
PCB 52286.1121.08116.5140.7218.09160.1381.78251.9168.158.5180.04123.03
PCB 35<0.10<0.10<0.10<0.10<0.10<0.10<0.10<0.10<0.10<0.10<0.10<0.10
PCB 101623.5825.31211.5885.1824.71314.52149.59427.35242.5713.06135.49163.36
PCB 81<0.10<0.10<0.10<0.10<0.10<0.10<0.10<0.10<0.10<0.10<0.10<0.10
PCB 110654.5820.34194.979.125.63293.95143.9361.22198.5412.96119.58135.27
PCB 771.440.1<0.10<0.10<0.10<0.101.133.753.140.411.2<0.10
PCB 118348.249.1986.7134.338.43129.4966.08158.1186.427.1552.5157.01
PCB 153200.246.1645.2817.575.1162.0945.3381.9947.64.7825.6530.63
PCB 105115.582.7528.369.64.4837.5920.4247.225.622.7215.0316.63
PCB 138172.184.4438.4914.193.1351.1834.0664.1736.735.2325.8924.93
PCB 1260.12<0.100.85<0.10<0.100.38<0.100.313.110.49<0.10<0.10
PCB 12847.191.137.532.172.2411.777.6313.497.991.514.195.11
PCB 15614.060.433.850.571.065.022.293.112.230.551.011.37
PCB 18023.951.114.431.862.11.968.185.823.391.091.082.68
PCB 169<0.10<0.10<0.10<0.10<0.10<0.10<0.10<0.101.54<0.10<0.10<0.10
∑ PCBs ng/g2504.0993.8748.56287.8796.051081.32569.771439.95849.3559.29467.51571.56
OC pesticides ng/g in surface waterOC pesticides ng/g in deep water
a-HCH5.21<0.10<0.10<0.10<0.10<0.10<0.101.81<0.10<0.10<0.10<0.10
b-HCH<0.100.31<0.10<0.10<0.10<0.10<0.10<0.10<0.100.14<0.10<0.10
g-HCH8.80.251.991.19<0.102.71.233.222.08<0.101.361.23
d-HCH<0.10<0.10<0.10<0.10<0.10<0.10<0.10<0.10<0.10<0.10<0.10<0.10
∑ HCHs ng/g14.010.411.991.19<0.102.71.235.032.080.141.361.23
2,4 DDE16.620.775.412.23<0.106.265.979.745.850.433.523.94
4,4 DDE237.228.4671.0130.5610.26109.6757.36134.978.074.744.4752.58
2,4 DDD6.370.533.33<0.10<0.10<0.10<0.102.184.840.331.222.41
4,4 DDD10.830.396.361.34<0.102.3135.522.730.322.721.21
2,4 DDT<0.10<0.102.48<0.10<0.10<0.100.63<0.10<0.10<0.10<0.10<0.10
4,4 DDT<0.10<0.10<0.10<0.10<0.10<0.10<0.10<0.10<0.10<0.10<0.10<0.10
∑ DDs ng/g271.059.8982.5134.1410.26118.2466.95152.3491.495.7851.9460.14
HCB5.73<0.10<0.10<0.10<0.10<0.10<0.10<0.10<0.100.11<0.10<0.10
Aldrin<0.10<0.10<0.10<0.10<0.10<0.10<0.10<0.10<0.10<0.10<0.10<0.10
Dieldrin<0.10<0.10<0.10<0.10<0.10<0.10<0.10<0.100.96<0.10<0.10<0.10
PCB and OC pesticides ng/g in surface waterPCB and OC pesticides ng/g in deep water
AsinaraIschia VentoteneTevereTremitiEoliePo ElbaAsinaraIschiaVentoteneElba
∑ PCBs ng/m³0.360.540.390.250.0260.430.50.830.470.320.770.36
∑ HCHs ng/m³0.0020.0020.0010.001-0.0010.0010.0030.0010.0010.0020.001
∑ DDs ng/m³0.0390.0560.0430.030.0030.0470.0580.0880.0510.0320.0840.038