Article

Extraction of Urban Water Bodies from High-Resolution Remote-Sensing Imagery Using Deep Learning

1
School of Geomatics, Liaoning Technical University, Fuxin 123000, China
2
Chinese Academy of Surveying and Mapping, Beijing 100830, China
3
ICube Laboratory, University of Strasbourg, 67000 Strasbourg, France
4
Institute of Geographic Sciences and Natural Resources Research, University of Chinese Academy of Sciences, Beijing 10010, China
*
Author to whom correspondence should be addressed.
Water 2018, 10(5), 585; https://doi.org/10.3390/w10050585
Submission received: 21 March 2018 / Revised: 20 April 2018 / Accepted: 23 April 2018 / Published: 1 May 2018
(This article belongs to the Special Issue Flood Forecasting Using Machine Learning Methods)

Abstract

:
Accurate information on urban surface water is important for assessing the role it plays in urban ecosystem services in the context of human survival and climate change. The precise extraction of urban water bodies from images is of great significance for urban planning and socioeconomic development. In this paper, a novel deep-learning architecture is proposed for the extraction of urban water bodies from high-resolution remote sensing (HRRS) imagery. First, an adaptive simple linear iterative clustering algorithm is applied for segmentation of the remote-sensing image into high-quality superpixels. Then, a new convolutional neural network (CNN) architecture is designed that can extract useful high-level features of water bodies from input data in a complex urban background and mark the superpixel as one of two classes: an including water or no-water pixel. Finally, a high-resolution image of water-extracted superpixels is generated. Experimental results show that the proposed method achieved higher accuracy for water extraction from the high-resolution remote-sensing images than traditional approaches, and the average overall accuracy is 99.14%.

1. Introduction

Urban water bodies are important parts of the urban ecosystem that are of great significance for urban environmental testing, urban heat-island effects, and urban ecosystem maintenance [1]. The changes in urban water bodies make a huge difference to human lives and may cause disasters, such as surface subsidence, urban inland inundation and health problems [2]. Therefore, it is necessary to know about urban water distribution and changes in the water area.
In recent years, satellite remote-sensing technology has developed rapidly and has the characteristics of a wide observation range, short return period, and so on [3]. It has been widely used in many fields such as military reconnaissance, environmental protection, mapping and geography [4]. Among current urban water-extraction technologies, a mainstream method uses remote-sensing imagery to gather urban water information in a timely and accurate way [5]. Previous urban water-resource surveys have been based on low- and medium-resolution images [6]. However, small water bodies such as small ponds and narrow rivers cannot be extracted due to the limited spatial resolution of these remote-sensing images. With the improvement of the spatial resolution of remote-sensing images, many remote-sensing satellites (such as Gaofeng-2, Ziyuan-3, WorldView-2, IKONOS and RapidEye) can provide high-resolution images. Most high-resolution remote-sensing images only have four bands (blue, green, red and near-infrared), lacking the SWIR necessary to compute the modified normalized difference water index (MNDWI) and the automated water extraction index (AWEI) indices [7]. A high-resolution spatial multi-spectral image has more detailed spatial features information, which can greatly improve the accuracy of urban water body extraction [8].
Many algorithms have been proposed for identifying water bodies with remote-sensing imagery including single-band threshold and multi-band threshold methods, water body index methods, sub-pixel water mapping methods, and supervised and unsupervised classification methods [9,10]. The water body index method has the characteristics of fast calculation and high precision, so it is widely used in practical applications. McFeeters proposed the normalized difference water index (NDWI) model and the basic idea of this model is based on a normalized difference vegetation index (NDVI) [11]. However, this model is unable to distinguish between dark shadow and water bodies [12]. Xu proposed the MNDWI which uses mid-infrared bands for normalization instead of near-infrared and green bands, and has better results for urban water body extraction [13]. These improvements in the water index are generally difficult to apply in high-resolution remote-sensing images due to limited spectral resolution. Image classification methods such as supervised or machine learning are often used to extract water bodies from remote-sensing images [14]. Generally, machine-learning methods include neural network and support vector machine, and unsupervised classification methods include k-means clustering and ISODATA clustering methods [15,16]. The above algorithms are mainly used on low spatial resolution remote-sensing images. The existing algorithms have undergone less research for urban water body extraction in high-resolution satellite images. At present, the main problem for extracting an urban water body by low spectral resolution remote-sensing images is the ability to distinguish between the building shadows and the water bodies which is one of the most difficult tasks [17].
Deep learning is the learning process that simulates the human brain [18]. It can automatically extract high-level features from low-level features of the input image [19,20]. In this study, a novel method for the extraction of urban water bodies based on deep learning is proposed for high spatial resolution multi-spectral images. A new convolutional neural network (CNN) architecture is designed that can extract water and detect building shadows effectively even in complex circumstances and predict the superpixel as one of two classes including water and no water.
The major contributions of this paper are:
(1)
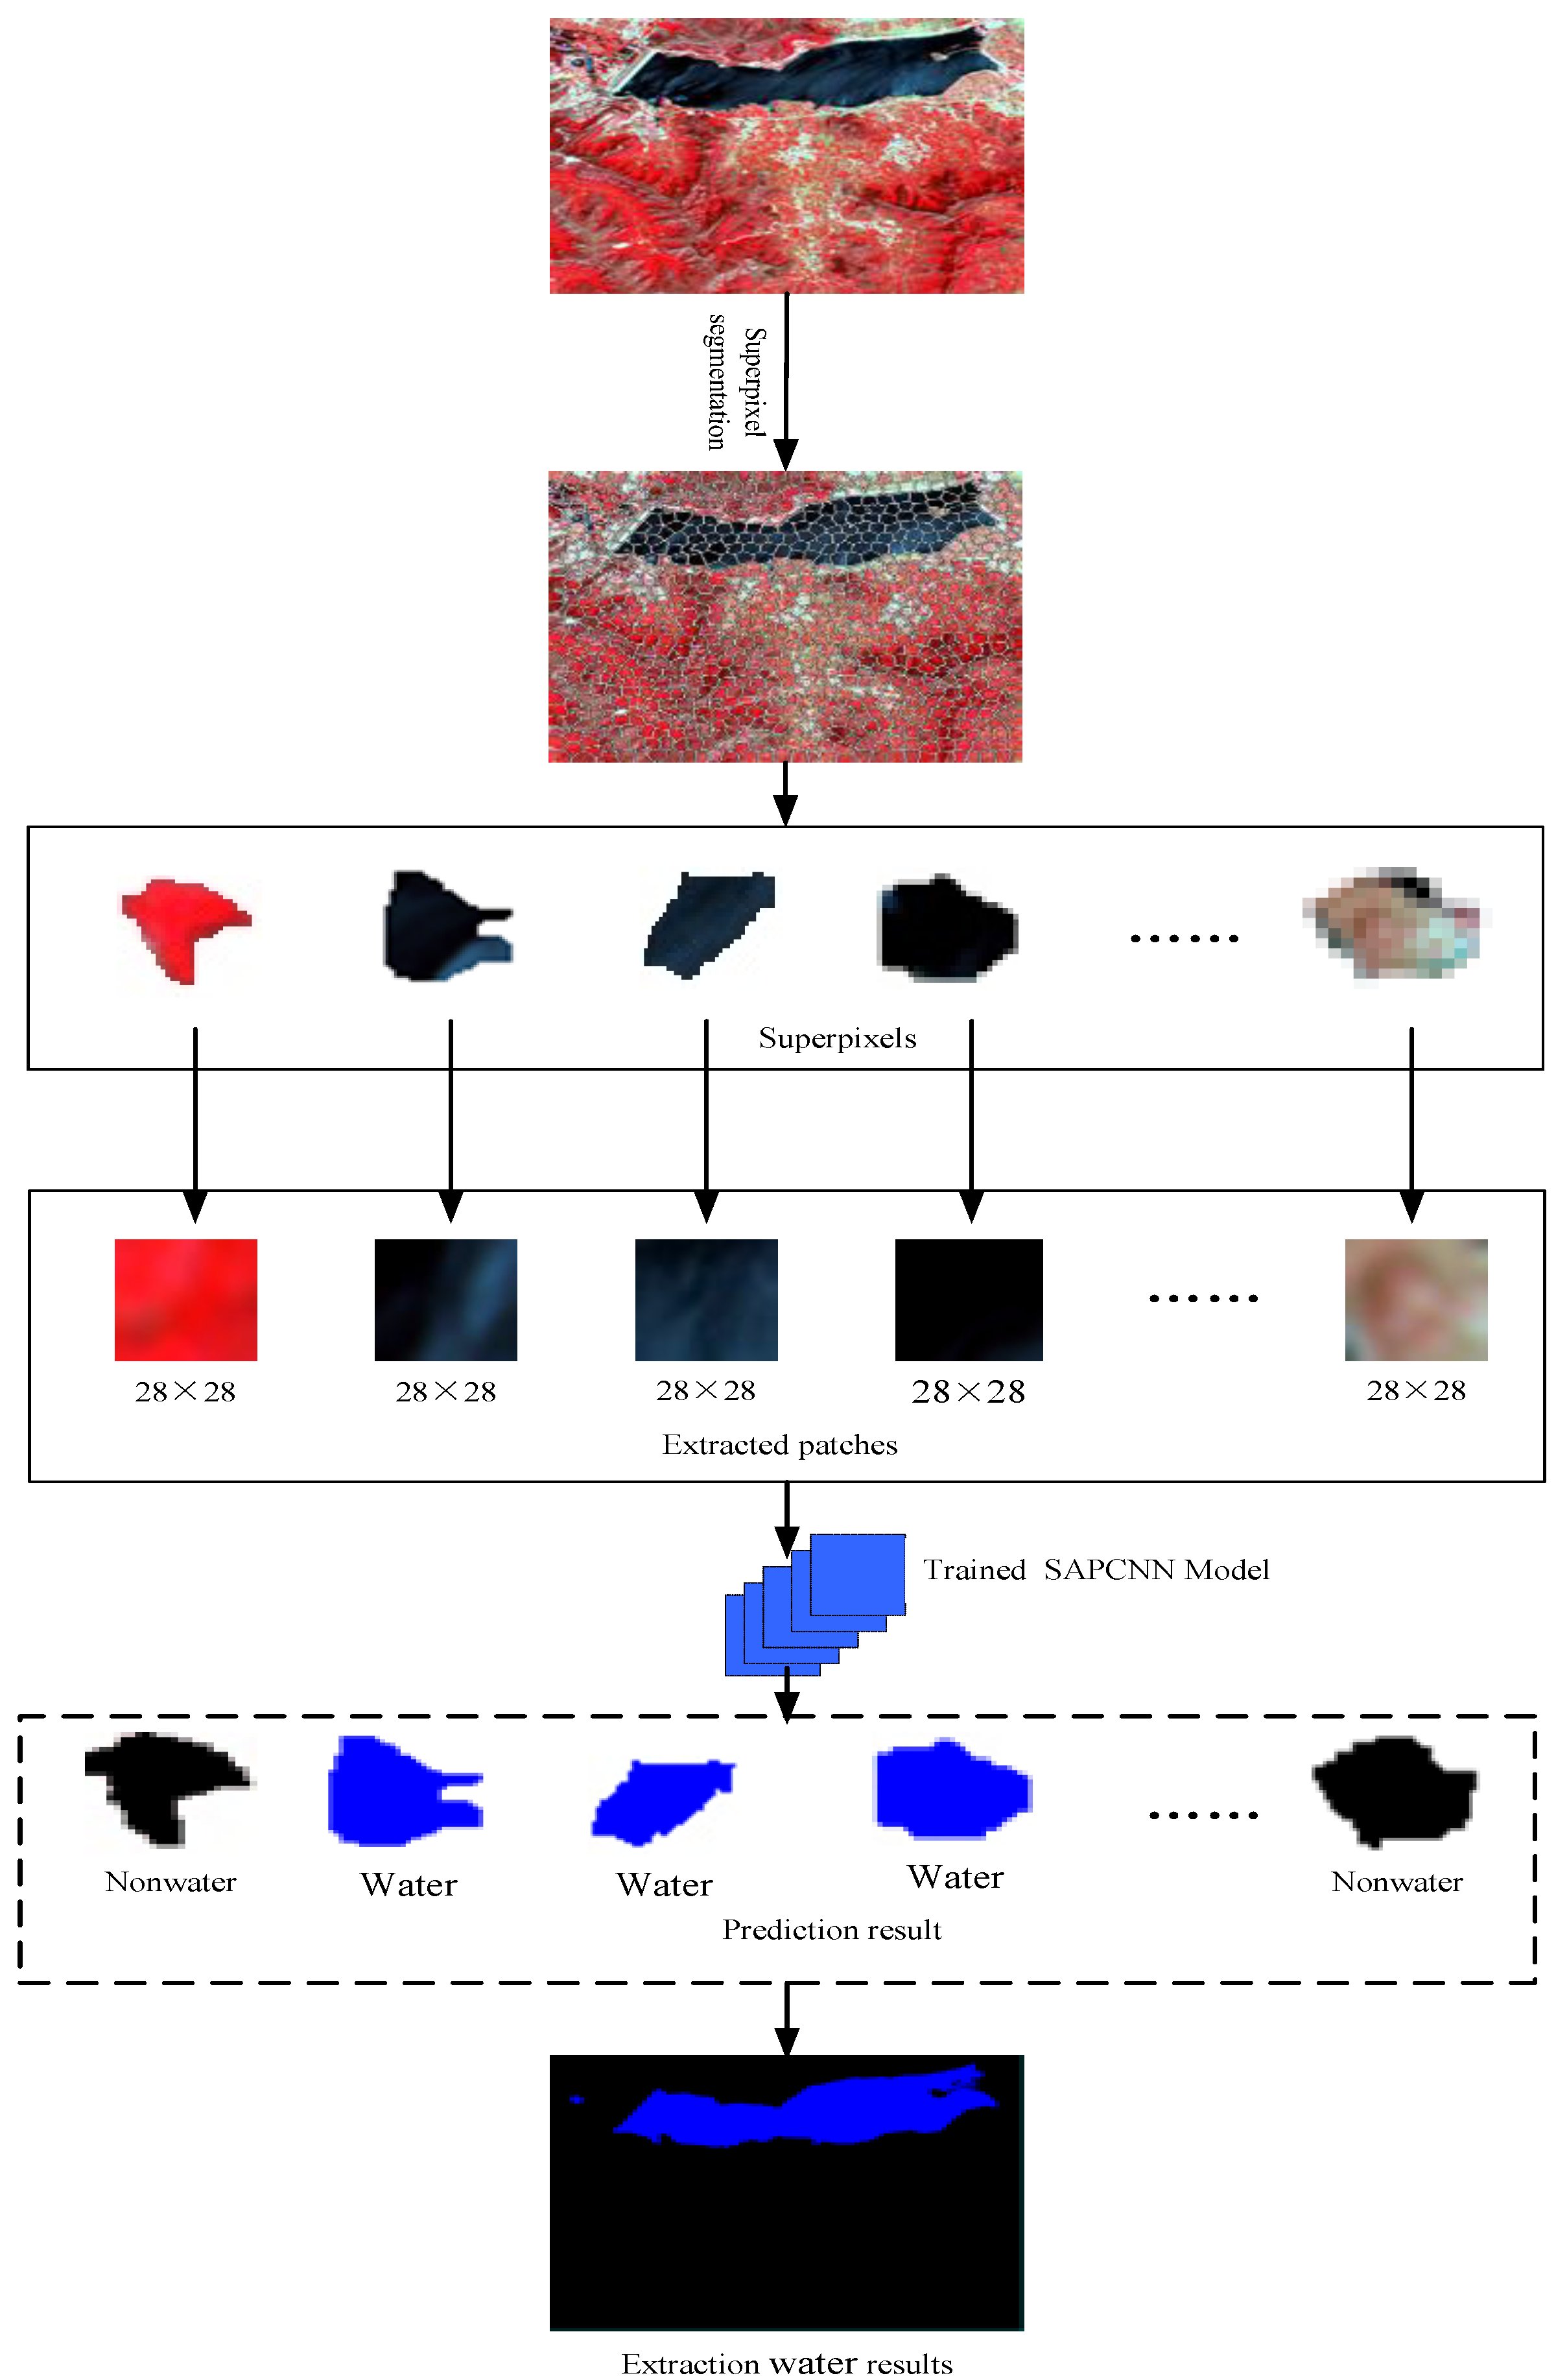
A novel extraction method for urban water bodies based on deep learning is proposed for remote-sensing images. The proposed method combines the superpixel method with deep learning to extract urban water bodies and distinguish shadow from water.
(2)
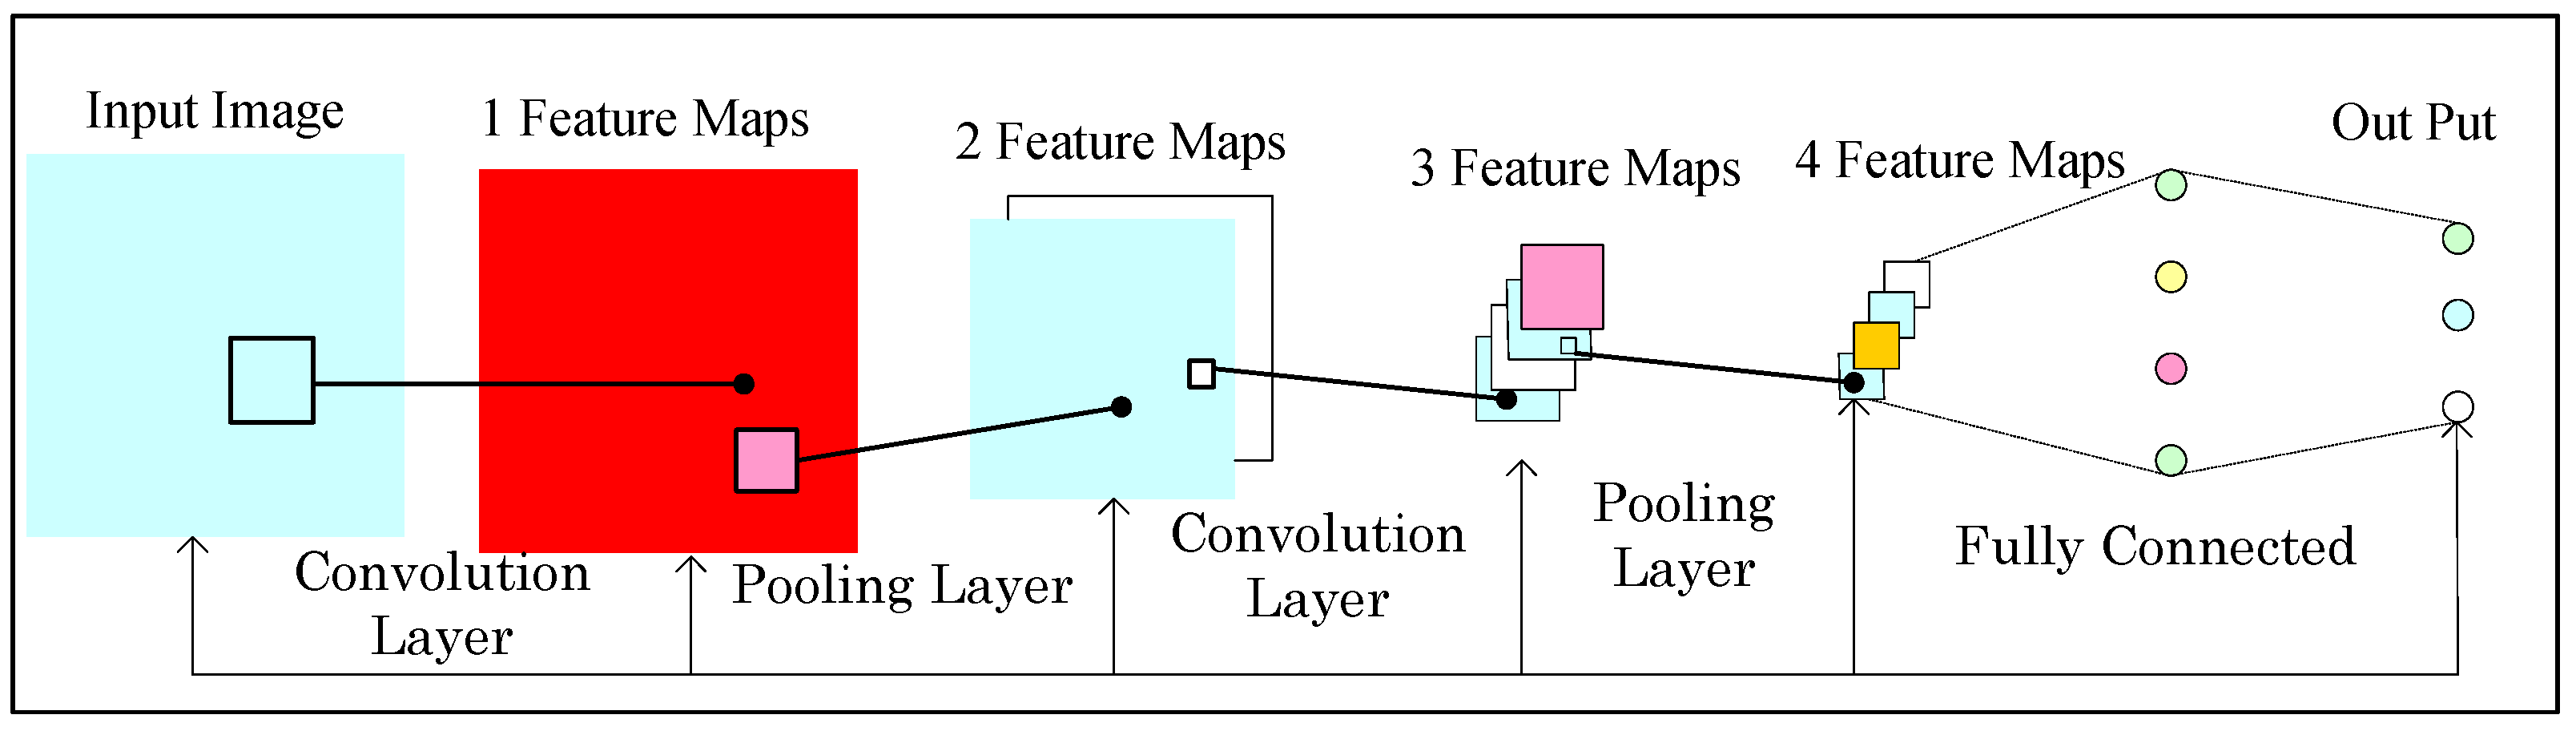
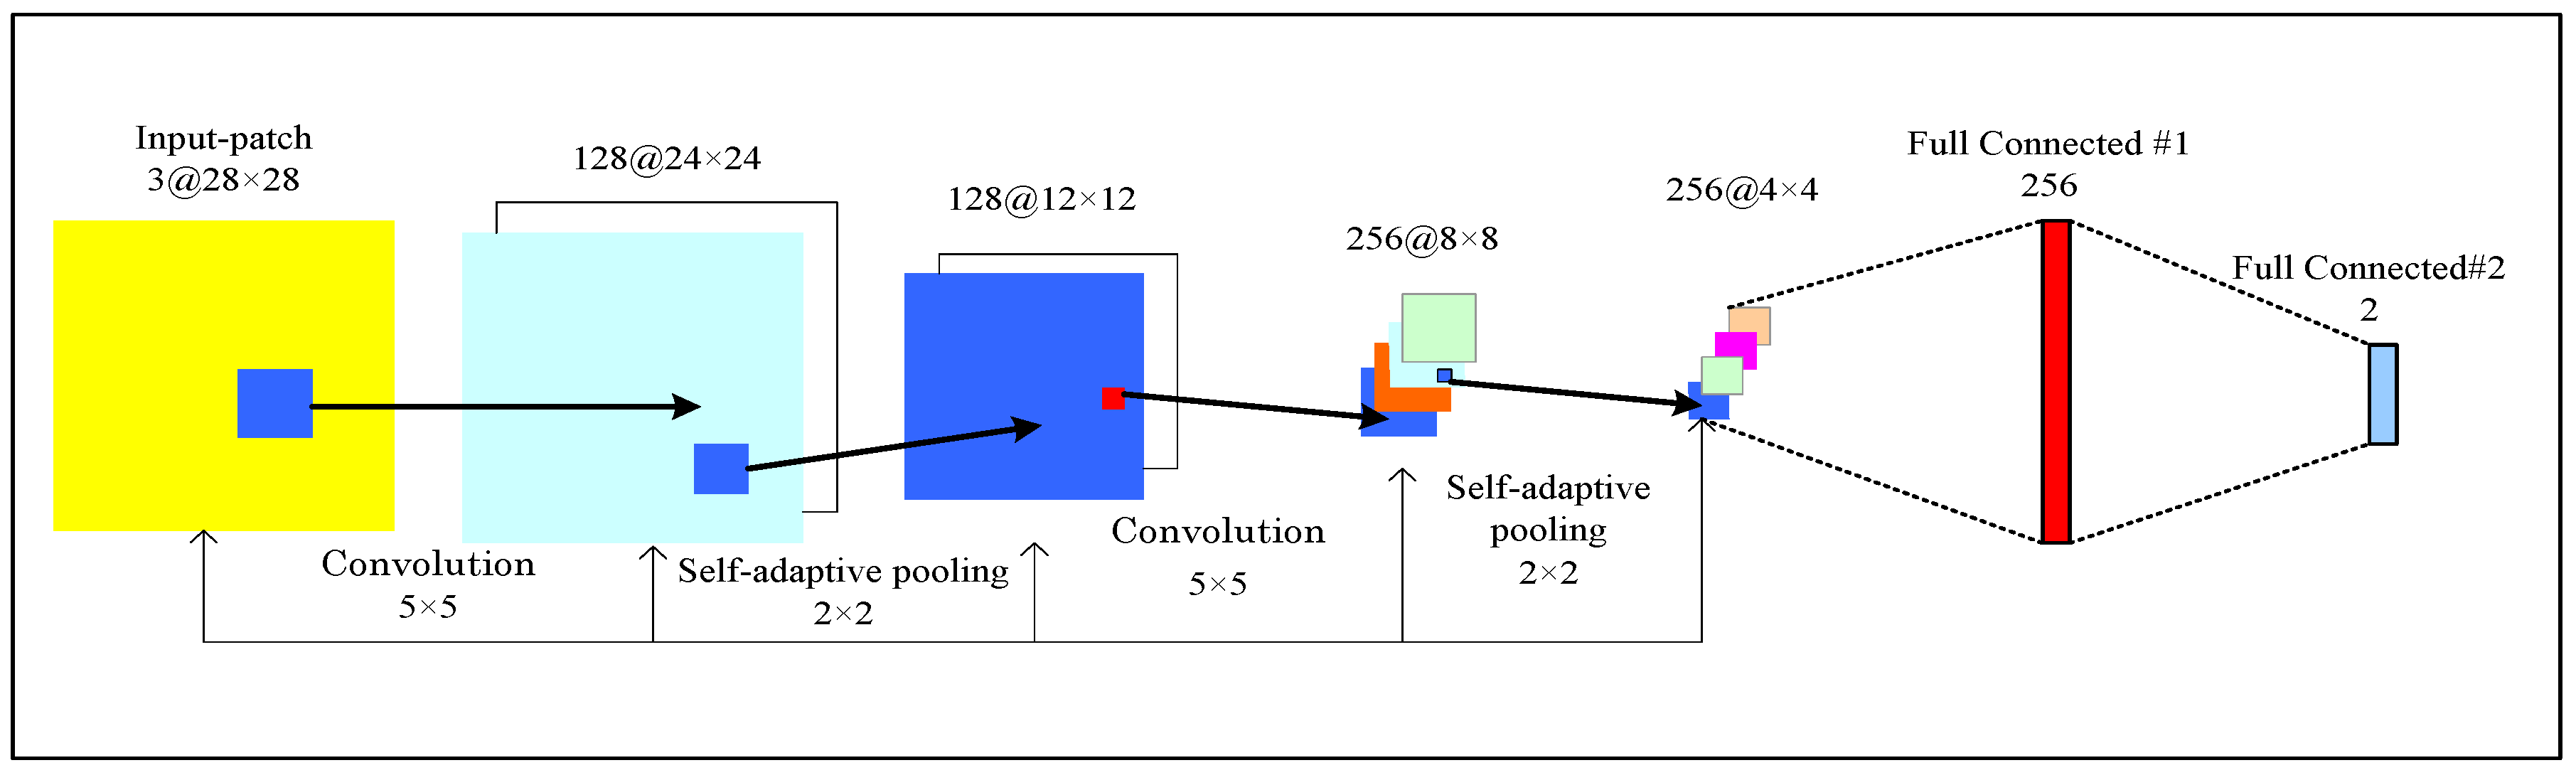
A new CNN architecture is designed, which can learn the characteristics of water bodies from the input data.
(3)
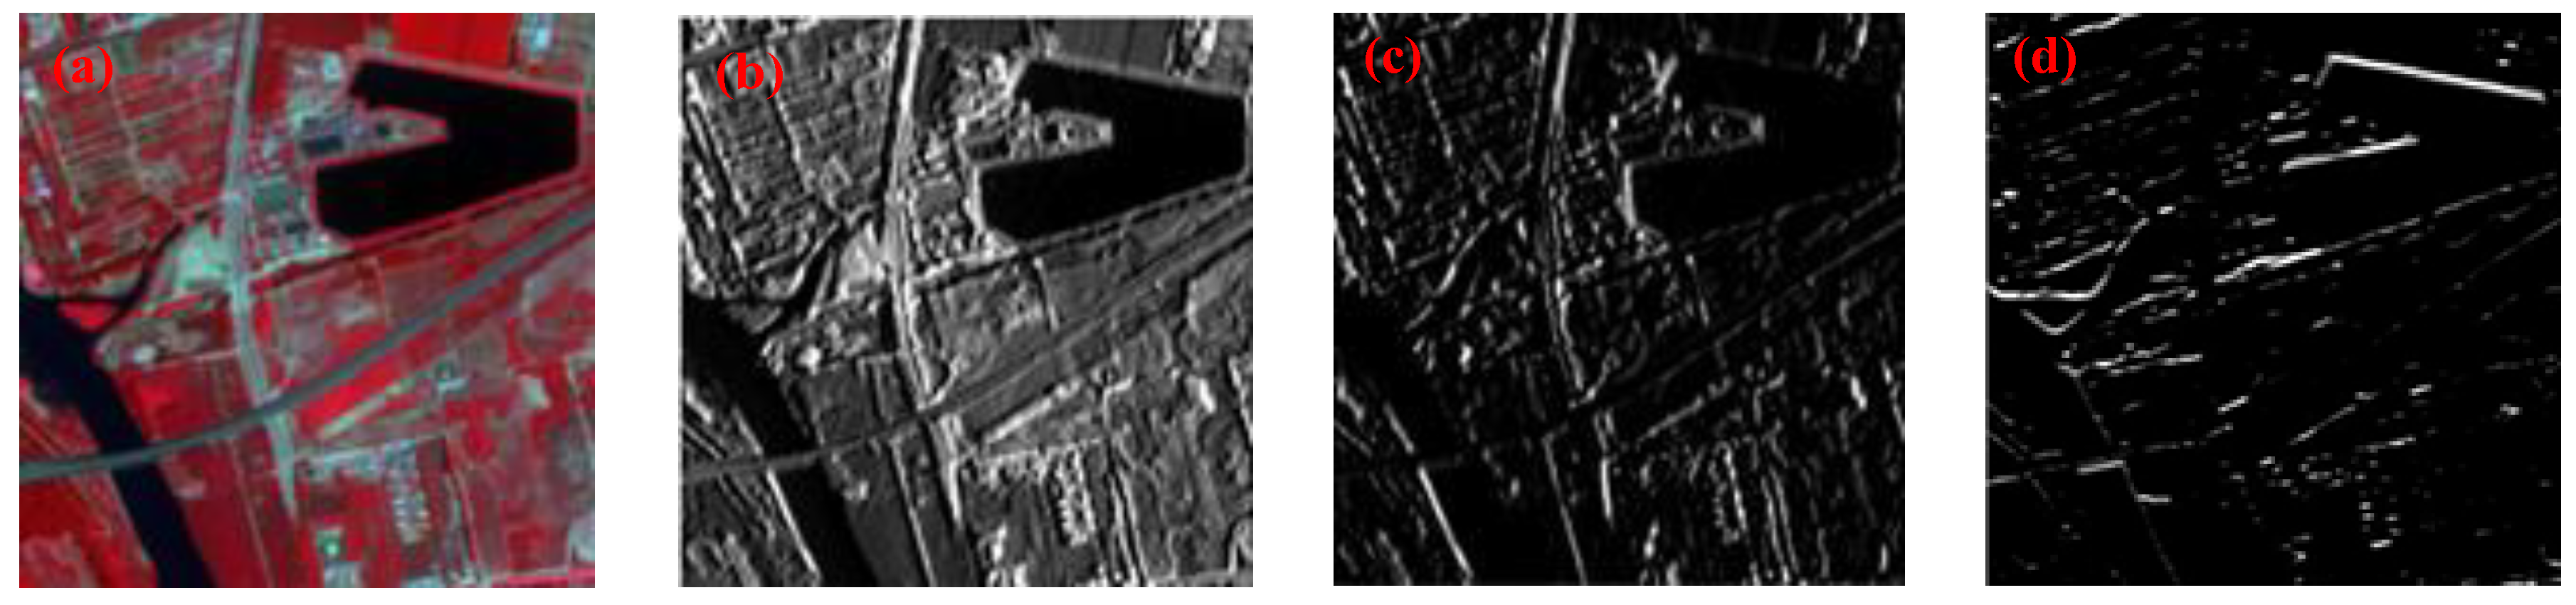
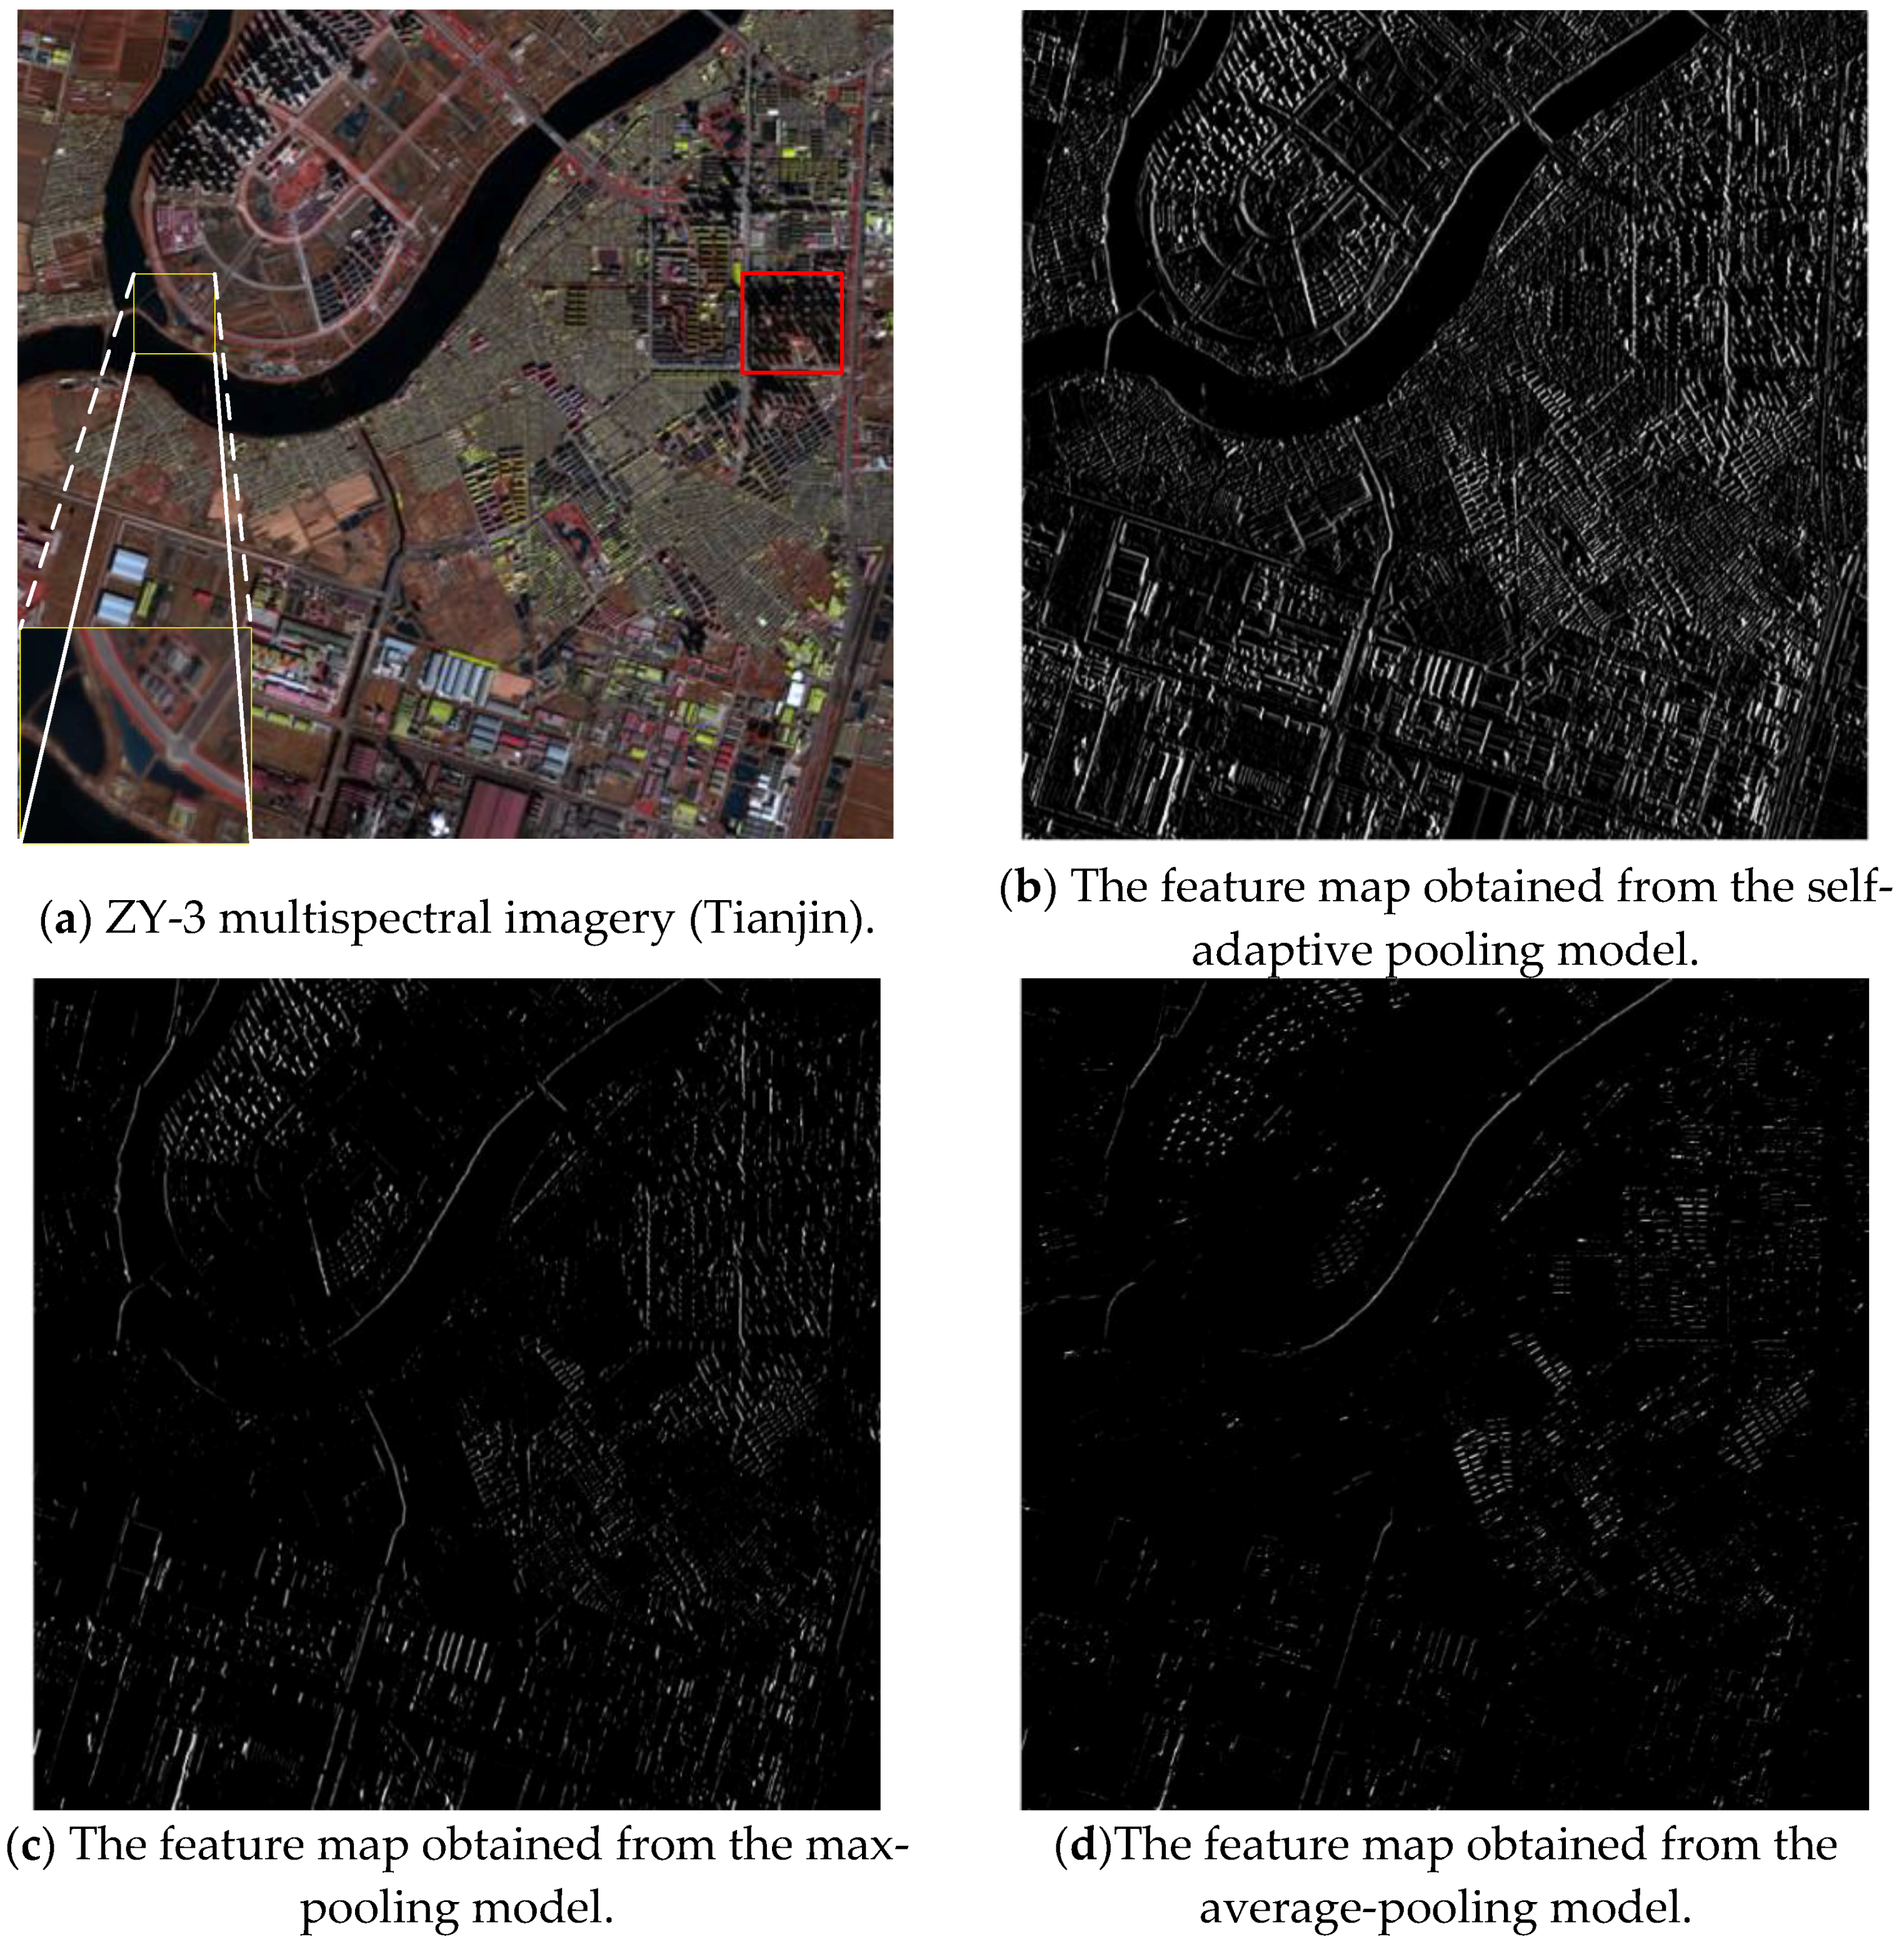
In order to reduce the loss of image features during the process of pooling, we propose self-adaptive pooling (SAP).

2. Materials and Methods
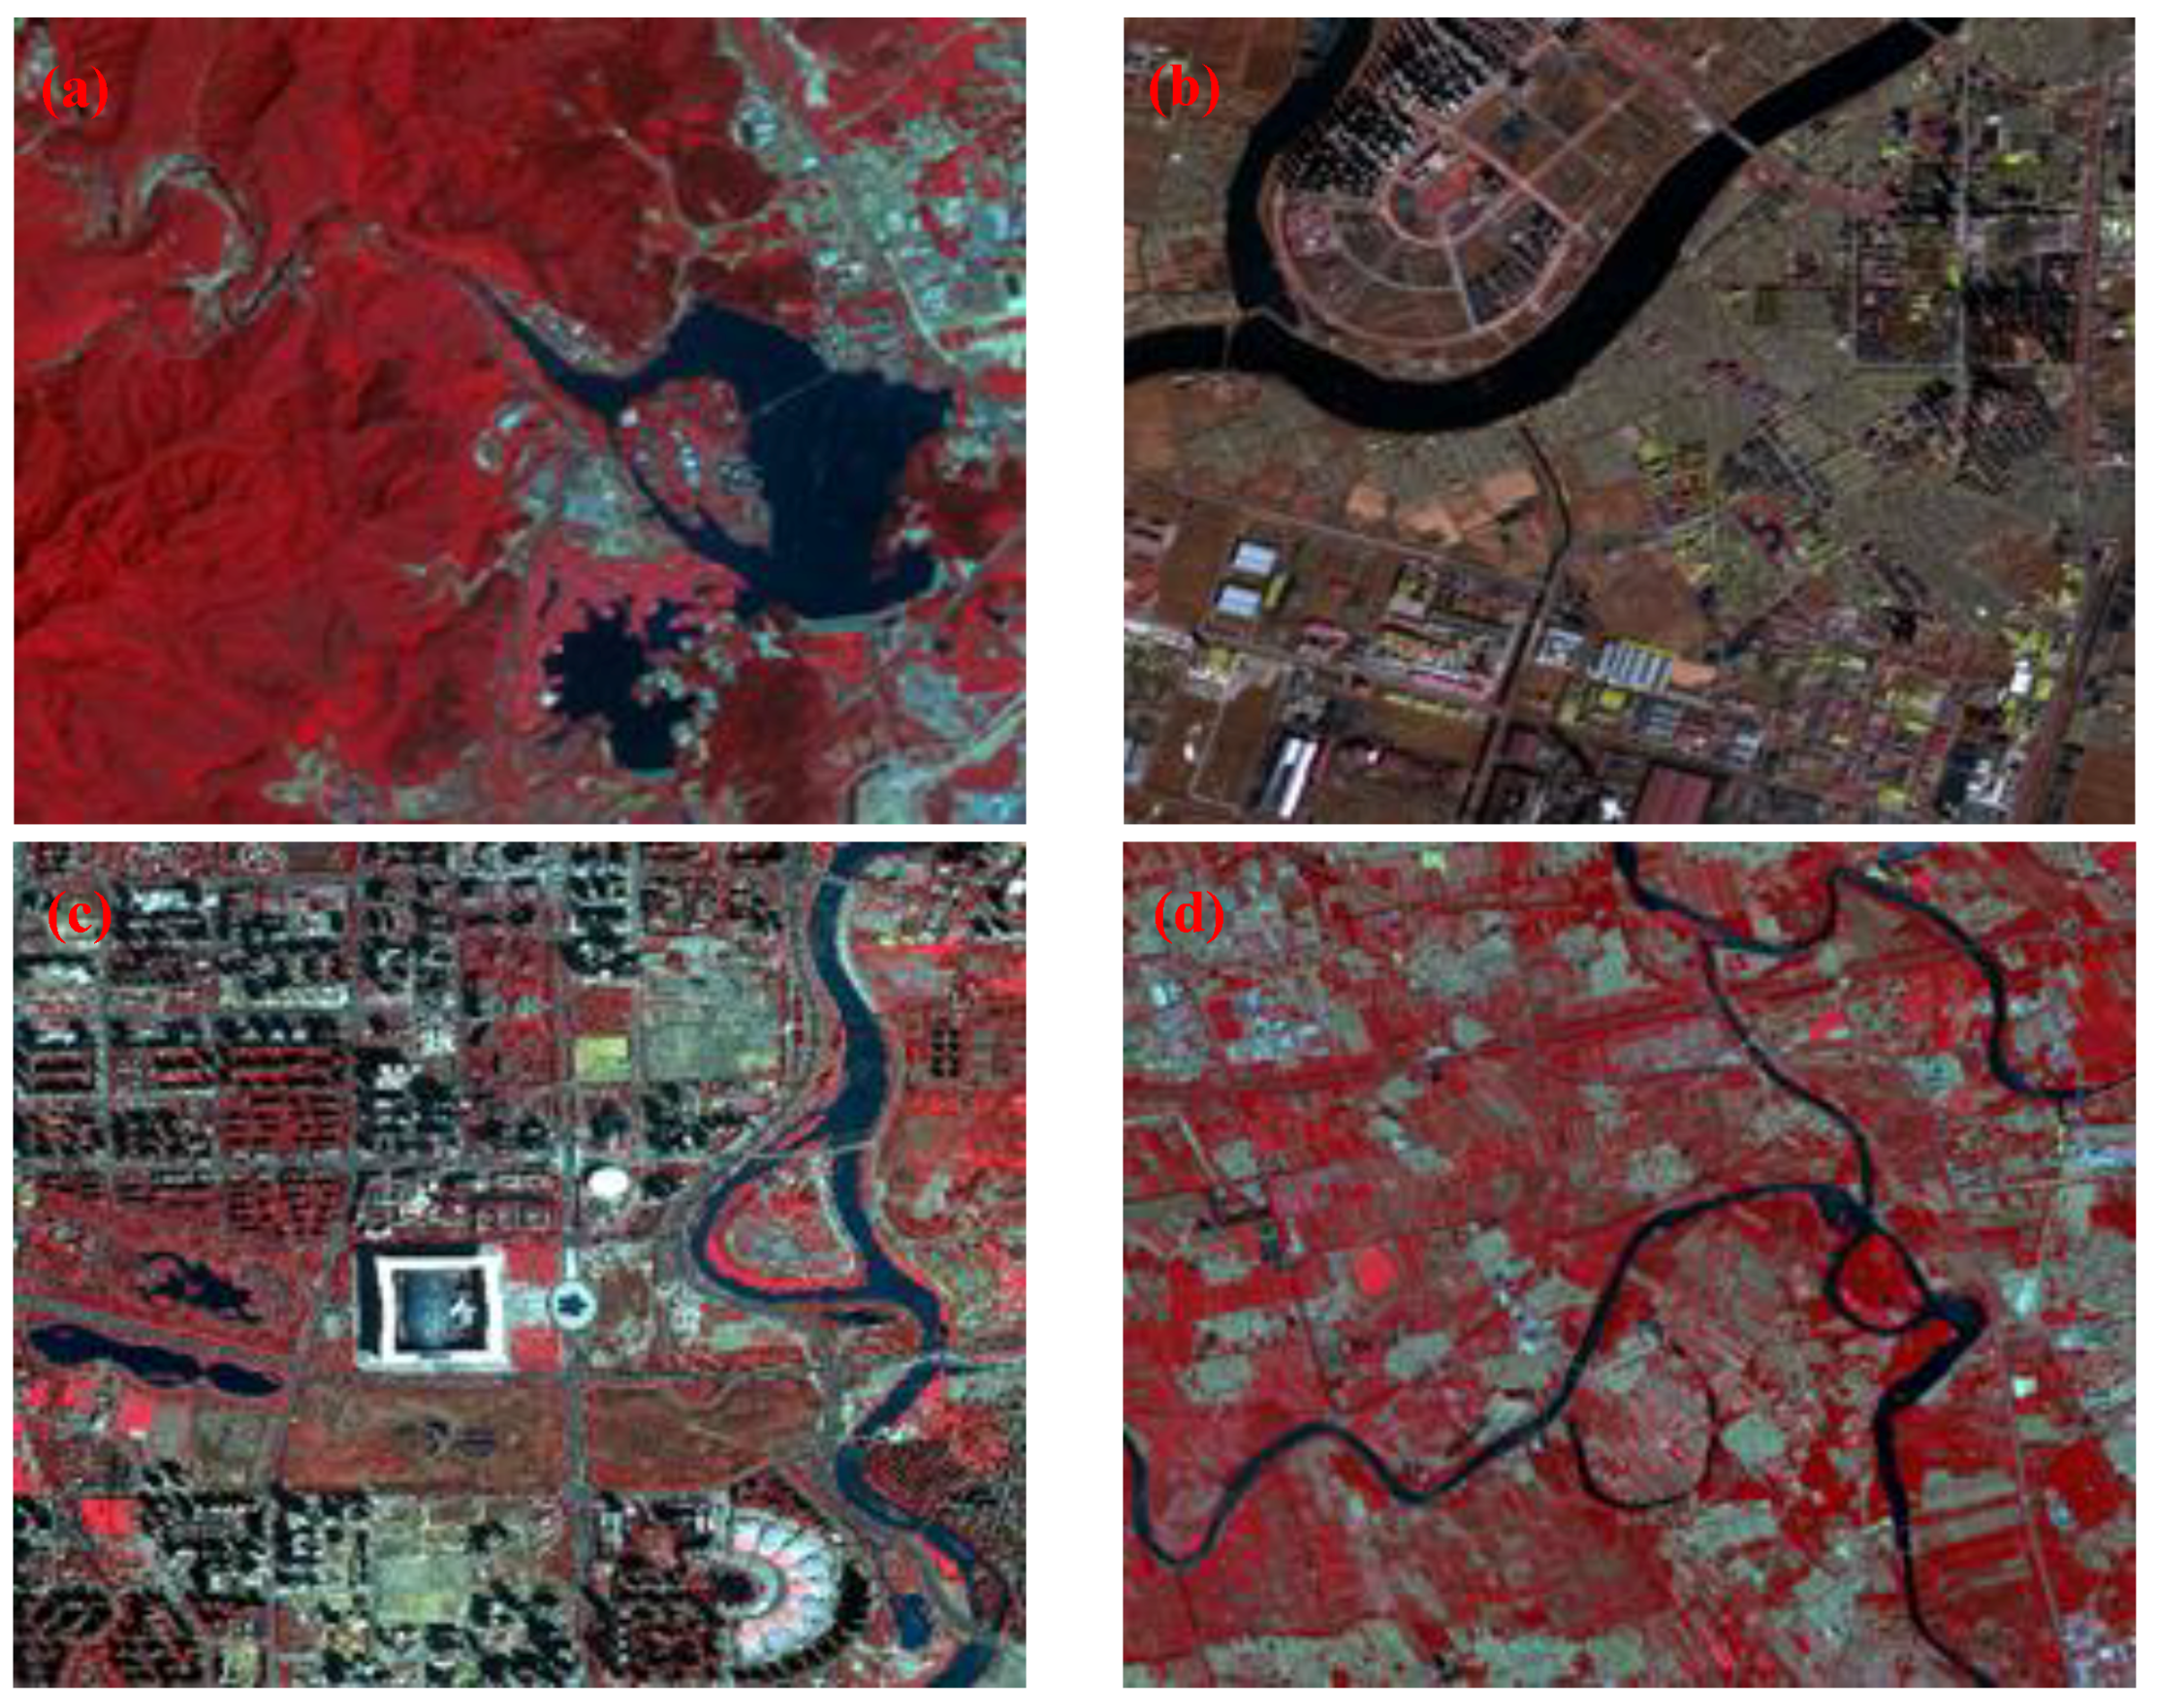
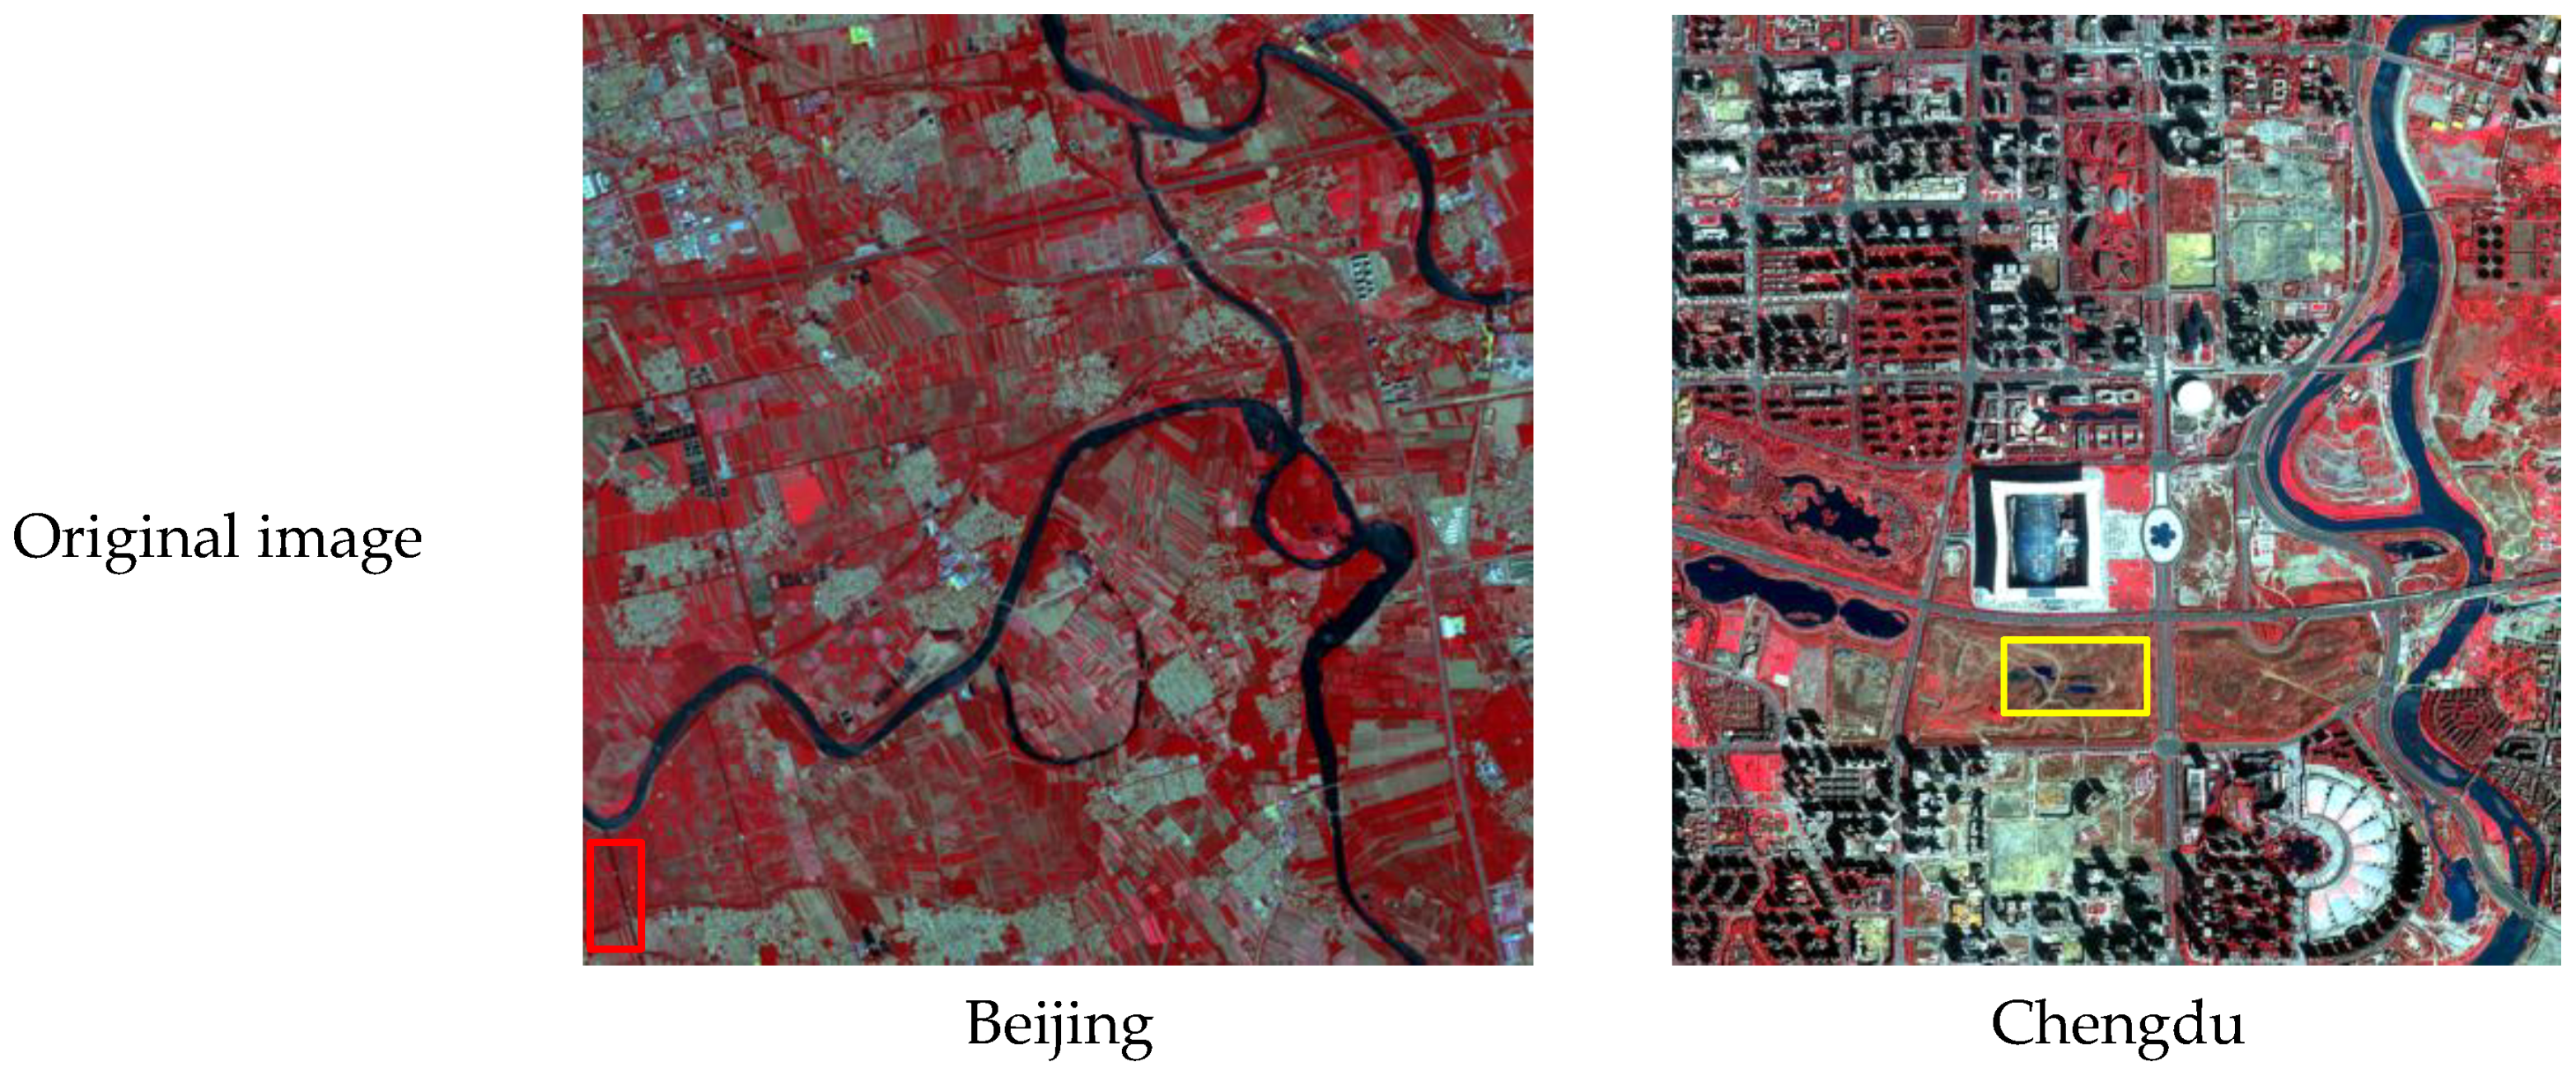
2.1. Study Areas

In this study, two categories of Chinese high-spatial resolution remote-sensing images were used for urban water extraction: ZY-3 and GF-2 multispectral images. The detailed parameters of these images are provided in Table 1, considering the complex urban water network differences in China. The selected areas were located in Beijing, Tianjin and Chengdu. Four remote-sensing multispectral images acquired from the ZY-3 and Gaofeng-2 satellites having different scene sizes (2000 pixels× 1800 pixels to 2000 pixels × 1900 pixels) are analyzed in this study as shown in Figure 1. The study area covers three downtown districts which are surrounded by suburban water bodies such as lakes, ponds, narrow rivers and aquatic parks.
All experiment images are Level 1A products, which have been adjusted for radiometric and geometric correction. Reference water mapping is manually digitized by a visual interpretation process of the high-resolution imagery with reference to Google Earth.

2.2. Self-Adaptive Pooling Convolutional Neural Networks (CNN) Architecture

A convolutional neural network (CNN) is a type of artificial neural network that draws inspiration from the biological visual cortex [21,22,23]. Compared with the shallow machine-learning algorithm, it has the advantages of strong applicability, parallel processing ability, and weight sharing, meaning global optimization training parameters are greatly reduced. CNN has become a hot topic in the field of deep learning [24]. The CNN architecture often consists of the input layer, convolution layer, pooling layer, full connection layer and output layer, as shown in Figure 2.
The convolutional layer consists of multiple feature maps which consist of multiple neurons. Each neuron is connected to the local area of the previous feature map by the convolution kernel [25]. The convolution kernel is a matrix of weights (such as 3 × 3 or 5 × 5 matrices for two-dimensional images). The convolutional layer extracts different features of the input layer through convolution operations. The first convolution layer extracts lower-level features such as edges, lines, corners, and higher-level convolution layers extract more advanced features.
The input image is convolved in the convolutional and filtering layers. Generally, convolutional and filtering layers require an activation function to connect [26]. We use G i to represent the feature map of the i th layer of the convolutional neural network. The convolution process can be described as:
G i = f ( G i 1 W i + b i )
where, W i represents the weight feature vector of the i th convolution kernel, the operation symbol represents a convolution operation of the i th layer of the image and the i 1 th layer of the image, and b i is the offset vector. Finally, the feature map G i of the i th layer is obtained by a linear activation function f ( ) .
There are two kinds of activation functions, one is a linear activation function, and the other is a non-linear activation function, such as sigmoid, hyperbolic and rectified functions. The rectified function is currently the most used in the literature because neurons, with a rectified function, work better to avoid saturation during the learning process, induce sparsity in the hidden units and do not face the gradient vanishing problem, which occurs when the gradient norm becomes smaller after successive updates in the back-propagation process [27]. So, in this paper, we use rectified linear unit (ReLU) f ( x ) = max ( x ) as an activation function.
The pooling performs a sampling along the spatial dimensions of feature maps via a predefined function (e.g., maximum, average, etc.) on a local region. Although the high-level feature maps are more abstract, they lose a lot of detail due to the pooling operation. In order to reduce the loss of image features during the process of pooling, this paper presents an adaptive pooling model.
Due to the complexity of the objects in high-resolution images, the traditional pooling model cannot extract the image features very well. Therefore, this research takes two kinds of pooling areas in the pooling layer as shown in Figure 3. The blank space indicates that the pixel value is 0, the shaded area is composed of different pixel values, and a represents the maximum value area. The features of the whole feature map are mainly concentrated at A as shown in Figure 3a. If pooling is done with the average pooling model, the features of the entire feature map will be weakened. The features of the feature map are mainly distributed in A, B, C as shown in Figure 3b. In the case of the unknown relationship between A, B and C, the features of the entire feature map will be weakened by using the maximum pooling model. This will eventually affect the extraction accuracy of the water body in remote-sensing images.
There are two main models of pooling layer: one is the max pooling model as shown in Equation (2), and the other is an average pooling model as shown in Equation (3). The feature map obtained by convolution layer is G i j , the size of the pooling area is c × c , the pooling step length is c , and b i is the offset. The max pooling model can be expressed as:
F i j = max i = 1 , j = 1 c ( G i j ) + b i
The average pooling model can be expressed as:
F i j = 1 c 2 ( i = 1 c j = 1 c G i j ) + b i
where, max i = 1 , j = 1 c ( G i j ) represents the max element from the feature map G in the pooled region size c × c .
In order to reduce the loss of image features during the process of pooling, this paper presents an adaptive pooling model according to the principle of interpolation, based on the maximum pool model and the average model. The model can adaptively adjust the pooling process through the pooling factors u in the complex pooled area. The expression is:
F i j = u c 2 ( i = 1 c j = 1 c G i j ) + ( 1 u ) max i = 1 , j = 1 c ( G i j ) + b i
where, u indicates pooling factor. The role of u is to dynamically optimize the traditional pooling model based on different pooled areas. The expression is:
u = a ( b max - a ) b max 2
where, a is the average of all elements except for the max element in the pooled area, b max is the max element in the pooled area. The range of u is (0, 1). The model takes into account the advantages of both the max pooling model and the average model. According to the characteristics of different pooling regions, the adaptive optimization model can be used to extract the features of the map as much as possible, so as to improve the removal accuracy of the convolution neural network.
In order to verify that the self-adaptive pooling model can reduce the loss of features in the pooling process that this paper proposes, an example image with the size of 300 × 300 pixels is input into a simple network with a network structure of four layers. Figure 4a is the original image. Figure 4b is the feature map obtained from the self-adaptive pooling model, Figure 4c is the feature map obtained from the max pooling model, and Figure 4d is the feature map obtained from the average pooling model.
From Figure 4b–d, the feature map obtained from the adaptive pooling model has obvious features, but the max pooling model and the average pooling model weaken the image features.
As demonstrated in Figure 5, the overall architecture of the designed self-adaptive pooling convolutional neural network (SAPCNN) contains one input patch, two convolutional layers, two self-adaptive pooling layers, and two fully connected layers. An input patch is 3@28 × 28, consisting of three channels, each with a dimension of 28 × 28. The first convolution layer is 128@24 × 24, composed of 128 filters, followed by self-adaptive pooling of dimension 2 × 2 resulting in 128@12 × 12. This process is followed by convolution layer and self-adaptive pooling; the convolution layer is 256@8 × 8, composed of 256 filters, and self-adaptive pooling is 256@4 × 4. All convolution layers have a stride of one pixel, and the size of filters is 5 × 5. In this paper, the output of the last fully connected layer indicates the probabilities that the input patch belongs to water or no water. This means that the unit number of the output layer is two.

2.3. Pre-Processing

The convolutional neural networks extracts water bodies, but it does not guarantee continuous water bodies and water boundaries. Similarly, with building shadow, vegetation shadow, and mountain shadow, it does not guarantee compact contours and, hence, may misclassify water bodies. Therefore, a pre-processing step is required to reduce misclassified water bodies.
Superpixel refers to the adjacent image blocks with similar color and brightness characteristics [28]. It groups the pixels based on the similarities of features between pixels and obtains the redundant information of the image, which greatly reduces the complexity of subsequent image-processing tasks.
In this work, the image is segmented into superpixels, which are used as basic units to extract water bodies. As a widely used superpixel algorithm [29], the simple linear iterative clustering (SLIC) algorithm can output superpixels of good quality that are compact and roughly equally sized, but there are still some problems such as the facrt that the number of superpixels should be designed artificially and the ultra-pixel edges are divided vaguely. However, because SLIC obtains initial cluster centers by dividing the image into several equal-size grids and its search space is limited to a local region [30], the superpixels produced cannot adhere to weak water boundaries well and the water bodies will be over-segmented. In this paper, the SLIC algorithm was improved by affinity propagation clustering and by expanding the search space.

2.3.1. Color Space Transformation

Generally speaking, the color of water bodies is black and azure, with low reflectivity and high saturation. According to the features of the reflection spectrum of water bodies, a water body’s region is prominent in B1, B2, and B4 to the data used in this study. Similar to the RGB color model, the color space transformation to the hue, saturation, and intensity (HSI) color model is first performed using these 3 bands [31]. The transformation from the RGB to the HSI color model is expressed as follows:
H = { θ 360 θ B G B > G
S = 1 3 × min ( R , G , B ) R + G + B
I = R + G + B 3
θ = cos 1 { [ ( R G ) + ( R B ) ] / 2 ( R G ) 2 + ( R B ) ( G B ) }
where R , G , and B are the values of B1, B2, and B4 channels of input remote sensing image. H , S , and I are the values of hue, saturation, and intensity components in the HSI space.
Figure 6 shows the HSI color space of an example remote sensing image. Figure 6a is original RGB color image. Figure 6b is the intensity component image, Figure 6c is the hue component image, and Figure 6d is the saturation component image. From Figure 6b–d, it can be seen that the water bodies region is prominent in the H and S components. Therefore, the H and S components are used in our improved SLIC algorithm.

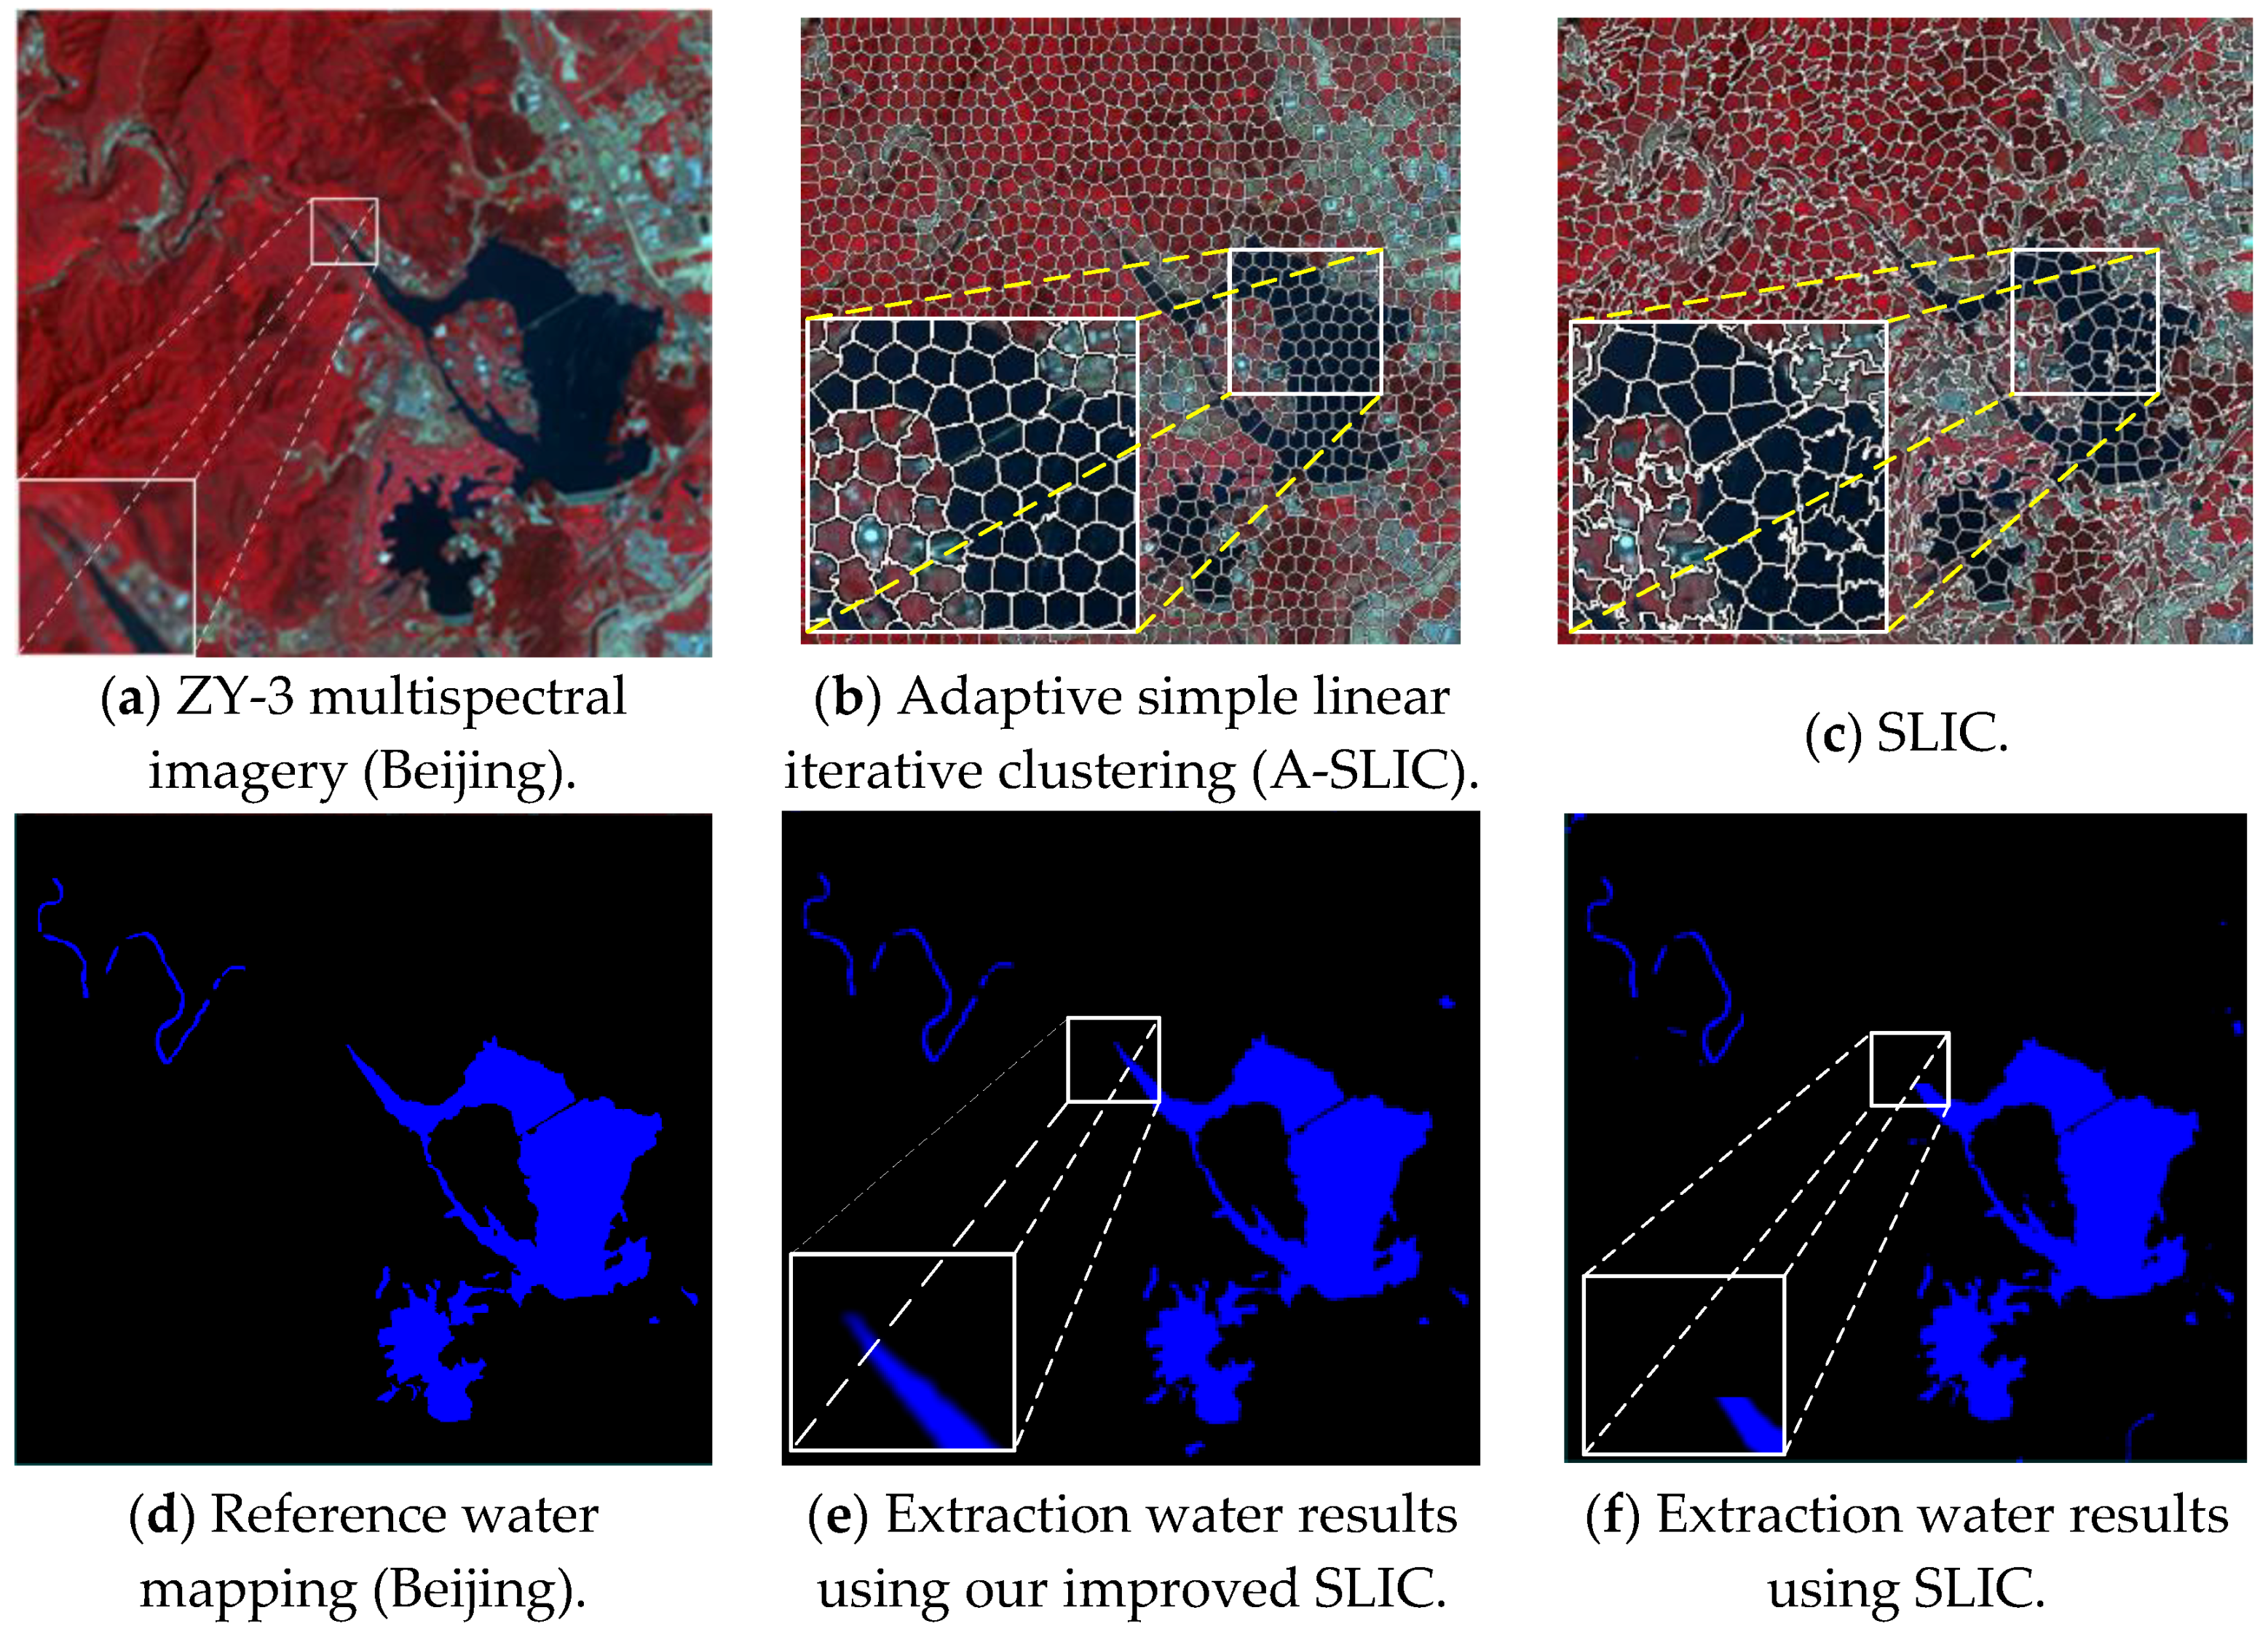
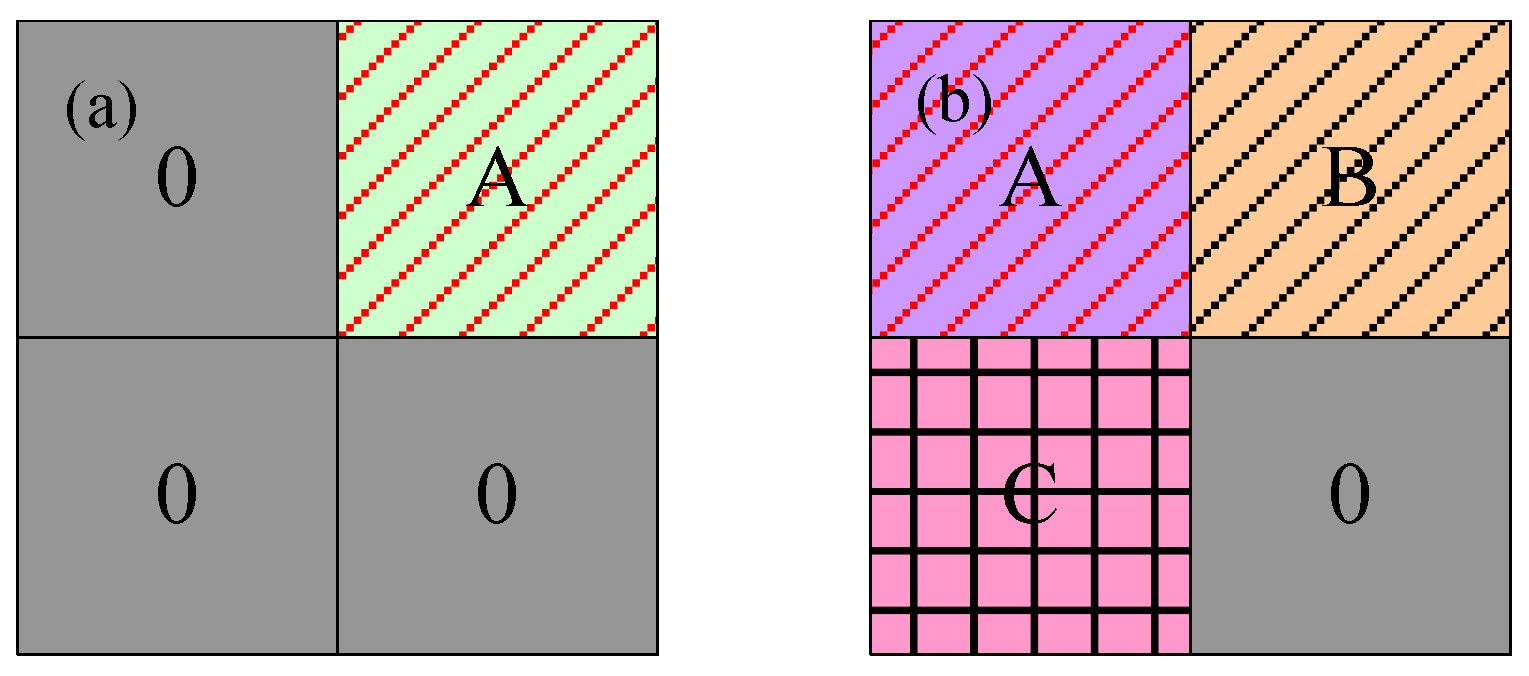
2.3.2. Adaptive Simple Linear Iterative Clustering (A-SLIC) Algorithm

The number of superpixels should be designed artificially as well as initial clustering. In this paper, the idea of affinity propagation algorithm is introduced to reduce the dependence of segmentation on initial conditions.
Usually, a weighted similarity measure combining color and spatial proximity is needed for the SLIC algorithm. In this study, the i th pixel and j th pixel space distance is expressed as follows:
d x y = ( x i x c j ) 2 + ( y i y c j ) 2
where, c j is the j th pixel cluster center.
We define the color difference between i th and j th pixels as:
d x y = ( x i x c j ) 2 + ( y i y c j ) 2
We define the similarity measure between the i th pixel and j th cluster center c j is expressed as follows:
d ( i , j ) = d c + α S d x y
where, S is the area of the j th cluster in the current loop. The α parameter is used to control the relative importance between color similarity and spatial proximity.
By defining the attribution function (Equation (13)) and the attraction function (Equation (15)), the number and location of cluster centers are adjusted during the iteration to complete the superpixel adaptive segmentation. The attribution function reflects the possibility that pixel i attracts pixel j into its cluster [32]. The attribution function is expressed as:
β ( i , j ) = { min i j { 0 , α ( j , j ) + i i , j max [ 0 , α ( i , j ) ] }    i j i j max [ 0 , α ( i , j ) ]            i = j
The iteration relationship of the attribution function is expressed as:
β t ( i , j ) = { min i j { 0 , α t 1 ( j , j ) + i i , j max [ 0 , α t 1 ( i , j ) ] }    i j i j max [ 0 , α t 1 ( i , j ) ]            i = j
The attraction function reflects the possibility of the j pixel attracting i pixel as its cluster [33]. The attraction function is expressed as:
α ( i , j ) = s ( i , j ) max j j { β ( i , j ) + s ( i , j ) }
The iteration relationship of the attraction function is expressed as:
α t ( i , j ) = s ( i , j ) max j j { β t 1 ( i , j ) + s ( i , j ) }
where, s ( i , j ) = d ( i , j ) is the similarity between i pixel and j pixel, s ( i , j ) = d ( i , j ) is the similarity between i pixel and non-j pixel, and t is the number of iterations.
Using both attraction and attribution functions, two types of messages are continuously transmitted to possible clustering centers to increase their likelihood of becoming cluster centers. So, the larger the sum of α ( i , j ) and β ( i , j ) , the more likely the j pixel is a cluster center. In this case, the greater the probability that the i pixel belongs to this class, then the point is updated as a new cluster center. In order to reduce the computation complexity, the image is divided into n regions firstly and calculates α ( i , j ) and β ( i , j ) in the local area. In this study, the main process of the A-SLIC algorithm is as follows:
  • Step 1. For an image containing M pixels, the size of the pre-divided region in this algorithm is N , then the number of regions is n . Each pre-divided area is labeled as η . In this paper, α ( i , j ) and β ( i , j ) are defined zero, and t is defined one.
  • Step 2. HIS transformation is performed on each pre-divided area. In the η th region, according to Equation (10), the similarity between two pixels is calculated in turn.
  • Step 3. According to Equations (14) and (16), the sum of β t ( i , j ) and α t ( i , j ) is calculated and the iteration begins.
  • Step 4. If β t ( i , j ) and α t ( i , j ) no longer change or reach the maximum number of iterations, the iteration is terminated. The point where the sum of β t ( i , j ) and α t ( i , j ) is max is regarded as the cluster center ( R i η , where i = 1 , 2 , 3 W η ).
  • Step 5. Repeat steps 3 to 4 until the entire image is traversed, and adaptively determine the number of superpixels ( R = η = 1 n W η ). In this paper, the HSI value are the center of the pixel. Finally, complete the superpixel segmentation.

2.4. Network Semi-Supervised Training and Extraction Waters

Convolution neural network training requires a large number of samples, but building a sample library requires a lot of time and manpower. In this paper, semi-supervised training is proposed. We use principal component analysis (PCA) to initialize the network structure [9], and then the entire network will be fine-tuned through the water label data.
Assume the input image has N scenes, its size is m × n . The convolution filter size is g 1 × g 2 . In the i th scene of the training image, all the image blocks of size g 1 × g 2 are extracted and expressed as a vector form X i = { x i , 1 , x i , 2 , x i , 3 , x i , n m } . Then the algorithm removes the mean of x i , n m and expressed as a vector form X ¯ i = { x ¯ i , 1 , x ¯ i , 2 , x ¯ i , 3 , x ¯ i , n m } . So the image block of training data can be expressed as [9]:
X = { x ¯ 1 , x ¯ 2 , x ¯ 3 , x ¯ n } R g 1 g 2 × N n m
where, i is the number of the scene image.
The principal component analysis method can minimize the reconstruction error to solve the feature vector:
{ min V R g 1 g 2 × H 1 X V V Τ X 2 s , t . V Τ V = I H
where, I H is a unit matrix, V is the H feature vector of the covariance matrix ( X X Τ ). V represents the main features of the input image block. The convolutional neural network W h filter were initialized by the principal component analysis, which can be expressed as follows:
W h = m g 1 g 2 ( V h ) ,   h = 1 , 2 , 3 , 4 , 5 H
where, m g 1 g 2 ( V h ) represents that vector V is mapped to W h , V h represents the h th main feature of the image.
In the training stage, we use a semi-supervised training method to train networks. First, the image of the training set is cut into the same size as the filter 5 × 5 according to Equation (17) to create the training data set. According to Equations (18) and (19), the principal component analysis is used to obtain the initialized filter weight. Training is carried out by optimizing the logistic regression function using a stochastic gradient descent and mini-batch size of 128 with the momentum of 0.8. The training is regularized by weight decay set to 0.0001, and dropout regularization for all fully connected layers with the dropout ratio set to 0.1. The learning rate starts from 0.01 and is divided by 10 when the error plateaus. Finally, the algorithm fine-tunes the entire network through the water label data to complete the final network training. Through training, a SAPCNN classifier with two class predictions is generated for the extraction of urban water bodies.
In the extraction stage, superpixels are first obtained from the test remote-sensing image using the adaptive simple linear iterative clustering algorithm described in Section 2.3.2. Image patches with a size of 28 × 28 centered at its geometric center pixel are extracted. Finally, image patches size of 28 × 28 are inputted into the trained SAPCNN model. The procedure of water extraction is demonstrated in Figure 7.

2.5. Accuracy Assessment Method

Reference water mapping is manually digitized by a visual interpretation process of the high-resolution imagery with reference to Google Earth. We evaluate the algorithm performance for the water extraction in two aspects: (i) water classification accuracy, and (ii) water edge pixel extraction accuracy. Therefore, six metrics are used including overall accuracy (OA), producer’s accuracy (PA), user’s accuracy (UA), edge overall accuracy (EOA), edge omission error (EOE), and edge commission error (ECE).
Unit rates (Equation (20)) based on the confusion matrix are utilized to evaluate the final water maps produced using different method, including PA, UA and OA [4]. The definition is as follows:
P A = T P T P + F N ,   U A = T P T P + F P ,   O A = T P + T N T
where, T is the total number of the pixels in the experimental remote sensing image, and T P , F N , F P , and T N are the pixels categorized by comparing the extracted water pixels with ground truth reference:
  • T P : true positives, i.e., the number of correct extraction pixels;
  • F N : false negatives, i.e., the number of the water pixels not extracted;
  • F P : false positives, i.e., the number of incorrect extraction pixels;
  • T N : true negatives, i.e., the number of no-water bodies pixels that were correctly rejected.
This paper defines the evaluation water edge pixel extraction accuracy as follows: (1) Firstly, obtain the boundary of water body by manual drawing. (2) The morphological expansion is performed in the water body boundary obtained in step (1) to create a buffer zone centered on the boundary line and having a radius of 3 pixels. (3) Finally, the pixels in the buffer area are judged. Suppose the total number of pixels in the buffer area is M , the number of correctly classified pixels is M R , the number of missing pixels is M O , and the number of false alarm pixels is M c . Then EOA, EOE and ECE are defined as:
E O A = M R M × 100 %
E O E = M O M × 100 %
E C E = M C M × 100 %

3. Experiments and Discussion

The proposed algorithm was implemented using python on the PC with a Intel(R) Xeon(R) E5-2630 CPU and GPU Nvidia Tesla M40 12G memory, and the designed SAPCNN algorithm was implemented through the software library tensorflow [10]. Our training dataset was collected from three ZY-3 multispectral images (south-west Beijing, China), two ZY-3 multispectral images (north-west Tianjin, China), and two Gaofeng-2 multispectral image (south-west Chengdu, China). In all experiments, the input patch was 3@28 × 28, and the output of the last fully connected layer indicated the probabilities of the input patch, belonging to water or non-water. This means that the unit number of the output layer is two. In this way, 8000 couples of patches are obtained from the training set, where the number of water and non-water patches are 3000 and 5000, respectively. For a test remote-sensing image, superpixels are first obtained by the adaptive simple linear iterative clustering algorithm. Then, image patches size of 28 × 28 centered at its geometric center pixel are extracted from each superpixel and input into the trained SAPCNN model to predict the class of this superpixel. Finally, the extraction of the water bodies result from the test remote-sensing image is achieved by using the predictions of all its superpixels.

3.1. Impact of the Superpixel Segmentation on the Performance of Water Mapping

In the proposed extraction water framework, the SLIC algorithm was used to cluster the remote sensing image into small regions, which is improved through affinity propagation clustering and expanding searching space. In order to verify the effectiveness of the A-SLIC method, we compared it with SLIC.
Figure 8b–c shows some superpixel segmentation results using different superpixel segmentation methods. Visual inspection of Figure 8b–c indicated that A-SLIC method and SLIC can obtain compact superpixels, but the A-SLIC method can obtain more regular superpixels than the SLIC method. The A-SLIC method can not only avoid over-segmentation in homogeneous sub-regions but can also obtain regular superpixels (in the white box).
We used water extraction results to evaluate the two superpixel methods. Figure 8e–f shows the extraction water results for the ZY-3 multispectral imagery (Beijing) in Figure 8a using the SAPCNN structure (see the Figure 4) combined with different superpixel methods, where Figure 8d represents the ground truth. It is obvious that all methods can extract most of the water bodies. However, for the blurry water boundaries and small water regions, our improved superpixel method can achieve more accurate results through leading affinity propagation clustering, expanding searching space, and the produced superpixels are easier to adhere to blurry water boundaries.
Six metrics (OA, PA, UA, EOA, EOE, and ECE) are used to evaluate the performance of water extraction using different superpixel segmentation methods. Table 2 shows the statistical results for SAPCNN framework using different superpixel segmentation methods.
From Table 2, compared with the SLIC method, the overall accuracy of water extraction and the PA are the highest for the superpixel segmentation method proposed in this paper for the pre-treatment of high-resolution images before water extraction. This is because the superpixel segmentation method introduced the idea of affinity propagation and adaptively determined the number of superpixels and the center of clustering, and the superpixel can well contain the water body boundary. Through the aforementioned visual evaluation and quantitative evaluation, it is verified that the SAPCNN method can effectively improve the water extraction accuracy and efficiency.

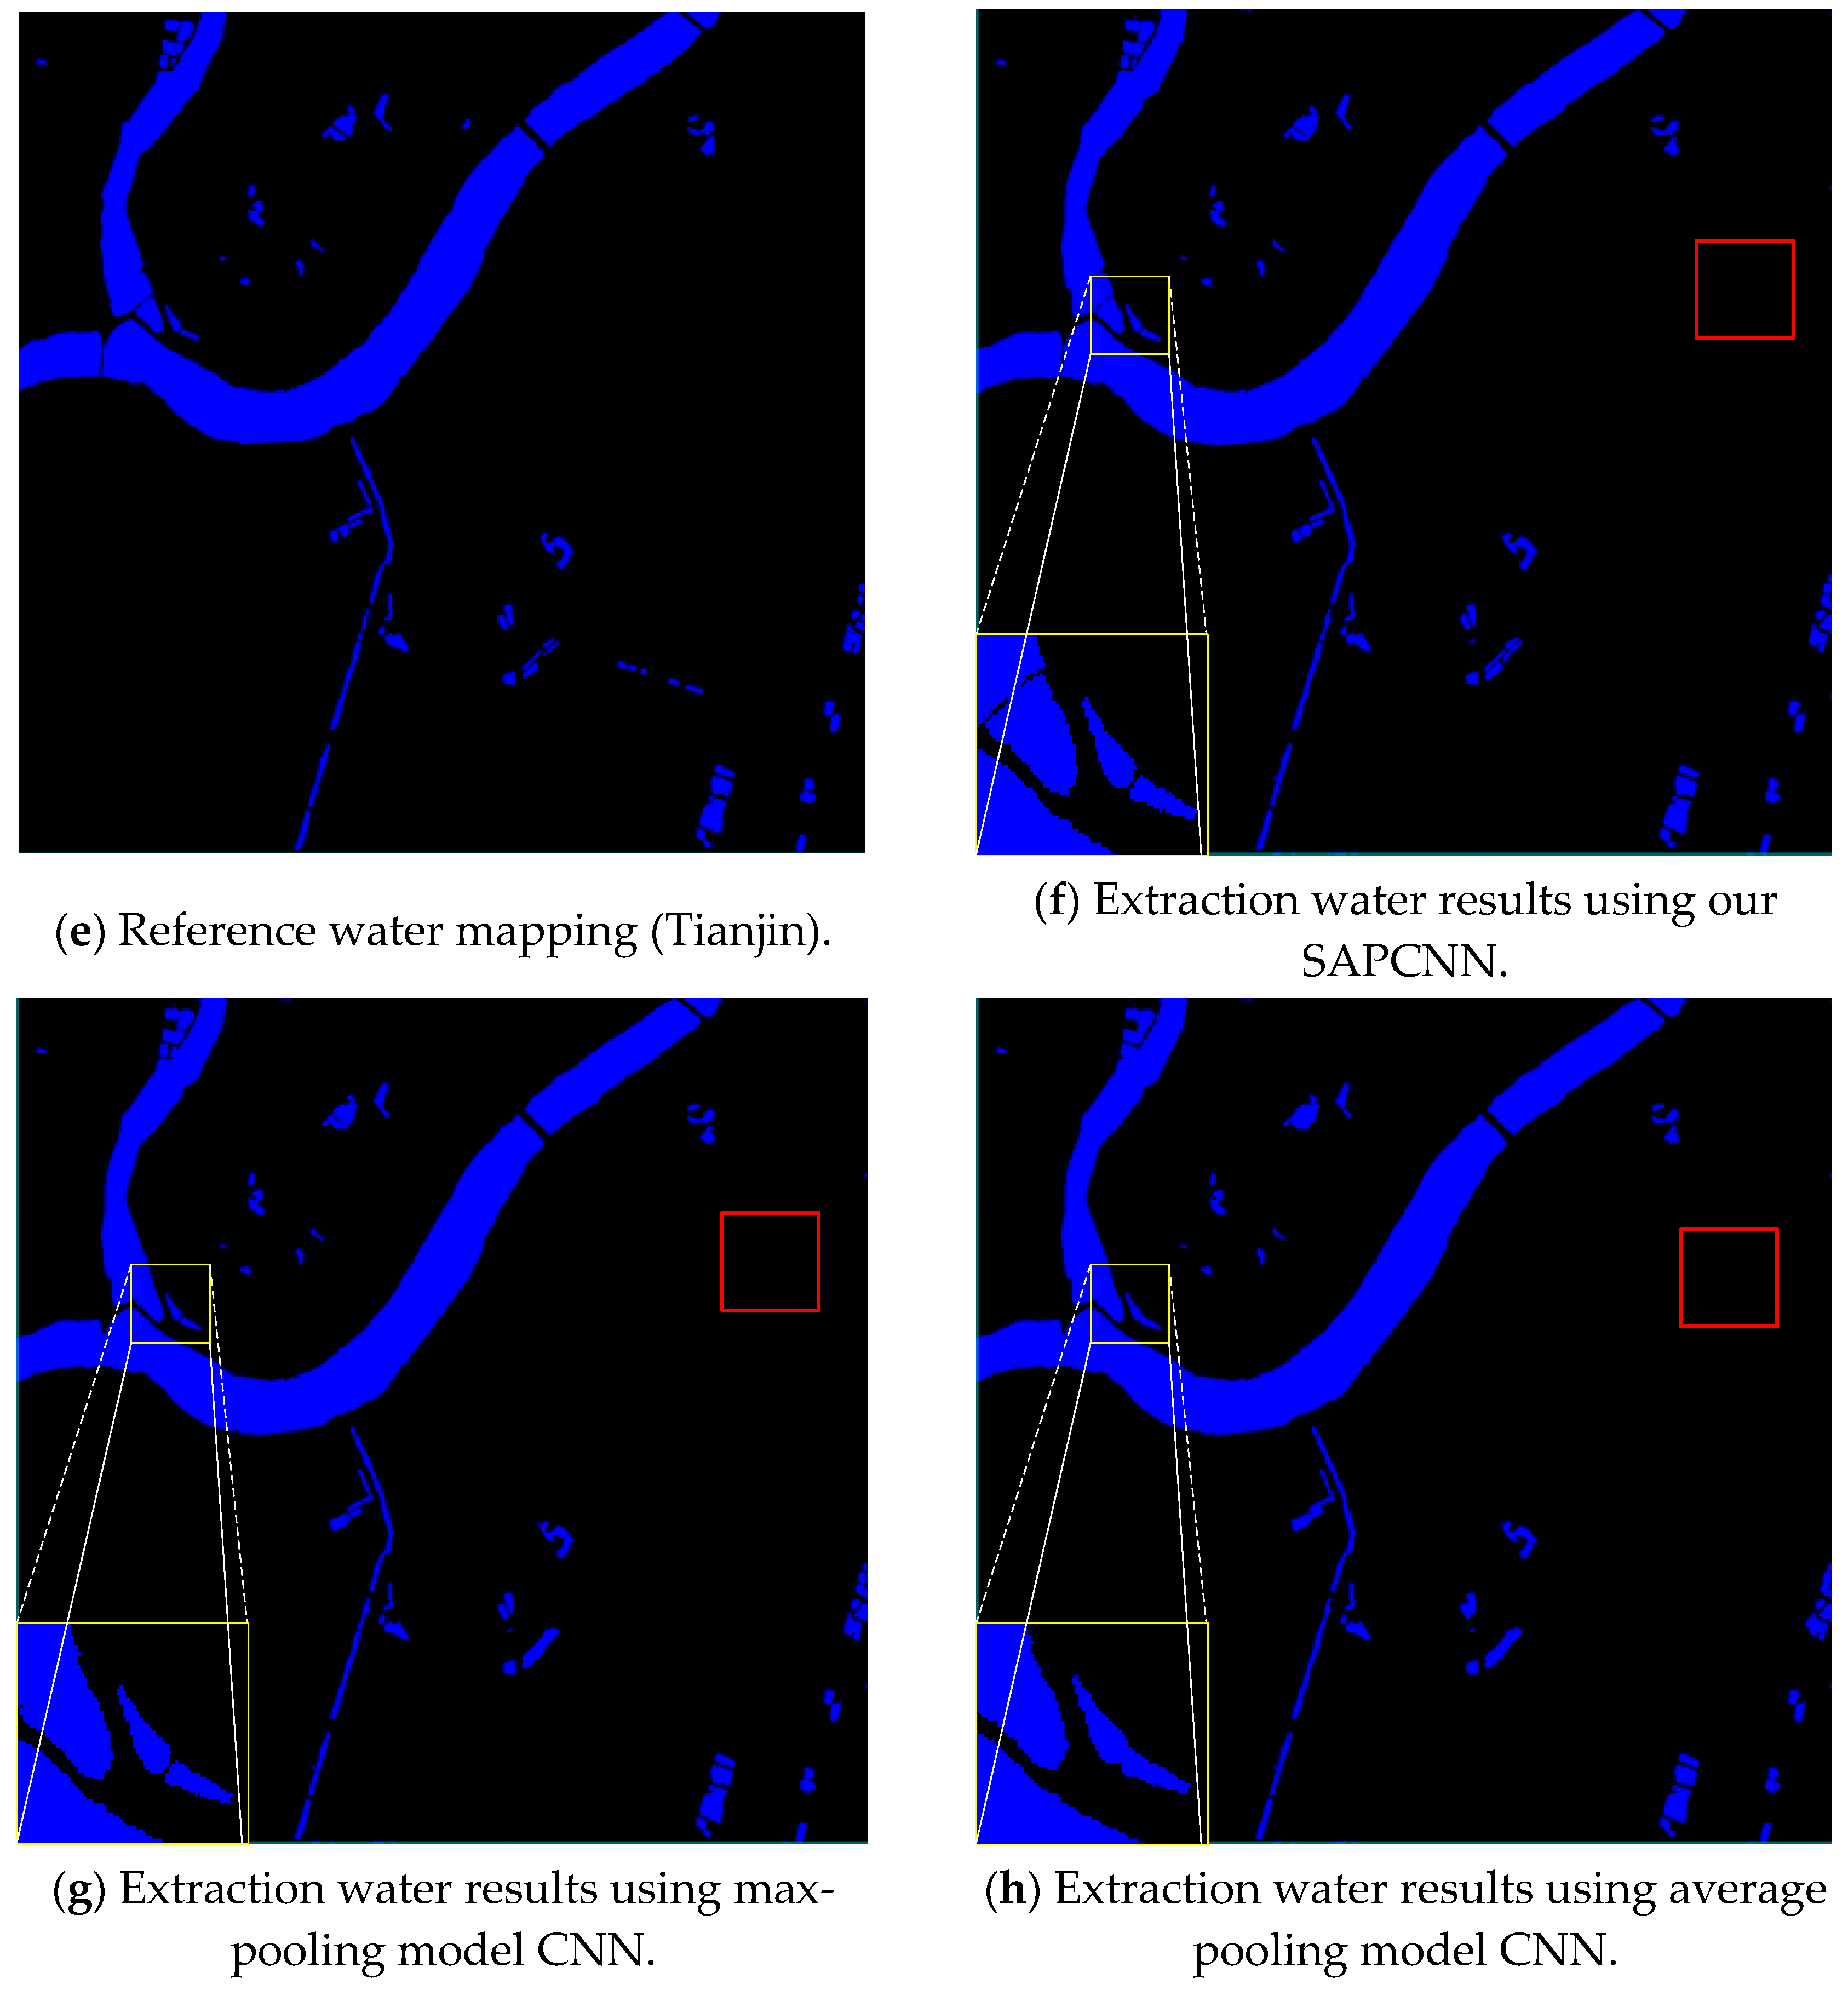
3.2. Comparison between Different Model CNN Architectures

In this paper, SAPCNN is designed to extract water bodies. We compare our SAPCNN with two different pooling model CNNs including a max pooling model CNN (the overall architecture of the designed max pooling CNN contains one input patch, two convolutional layers, two max pooling layers, and two fully connected layer) and an average pooling model CNN (the overall architecture of the designed max pooling CNN contains one input patch, two convolutional layers, two max-pooling layers, and two fully connected layer).
From Figure 9b–d, the feature map obtained from the adaptive pooling model has an obvious water boundary. While the max pooling model and the average pooling model weaken the water boundary. From Figure 9f–h, the CNNs is used to enhance the separation and difference between water and non-water, as well as to avoid spectral similarity between dark shadow and roads (in the red box). However, water extraction results using traditional pooling model CNNs blurred the water boundary.
In order to evaluate objectively the edge-detection accuracy of the three kinds of water-extraction algorithms, three metrics are used: EOA, EOE, and ECE. Table 3 lists the boundary accuracy from different pooling model CNNs in which the self-adaptive pooling CNN method yields good results in two study areas. This is because the model can adaptively adjust the pooling process through the pooling factors in the complex pooled area. Therefore, the self-adaptive pooling CNN has more effective water extraction results compared with two tradition pooling CNNs.

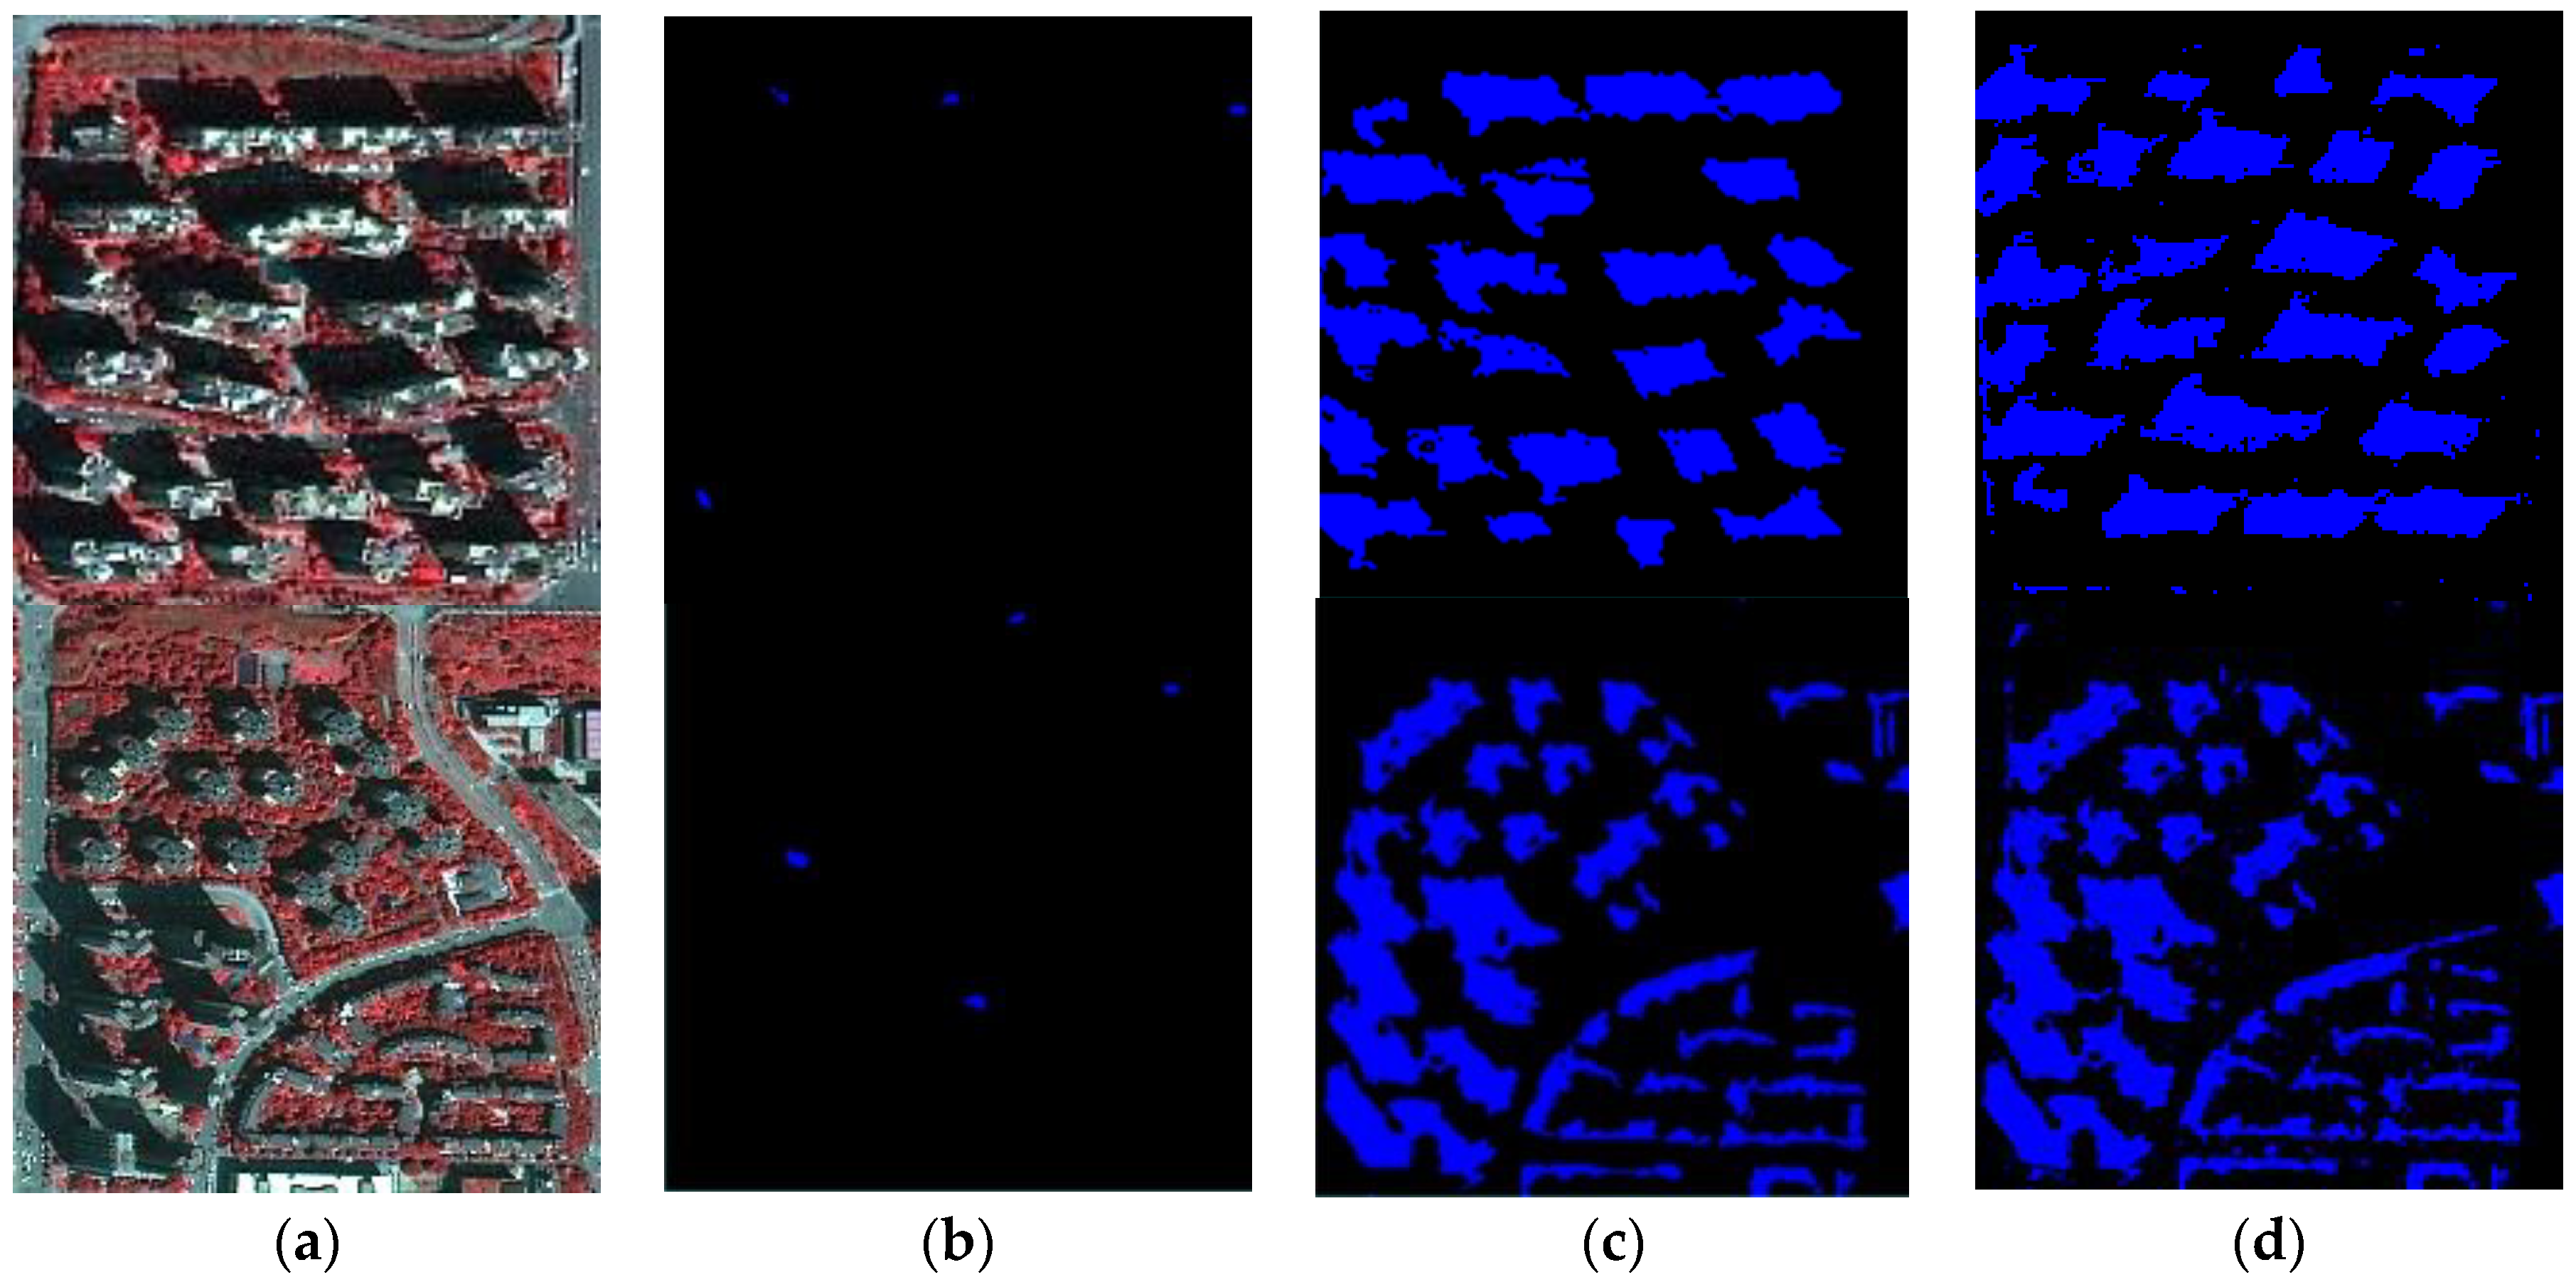
3.3. Distinguishing Shadow Ability of Different Methods

In order to verify that our improved methods can distinguish between water bodies and shadows, we compare our improved algorithm with SVM and NDWI. Two no-water bodies images were selected as experimental image. Figure 10 shows the water extraction results using SAPCNN, SVM and NDWI at the two no-water bodies’ images.
Visual inspection of Figure 10b indicated SAPCNN methods can distinguish between water bodies and shadows. But, visual inspection of Figure 10c,d indicated SVM and NDWI methods cannot distinguish between water bodies and shadows. Through the above mentioned visual evaluation, it is verified that SAPCNN method can effectively distinguish between water bodies and shadows.

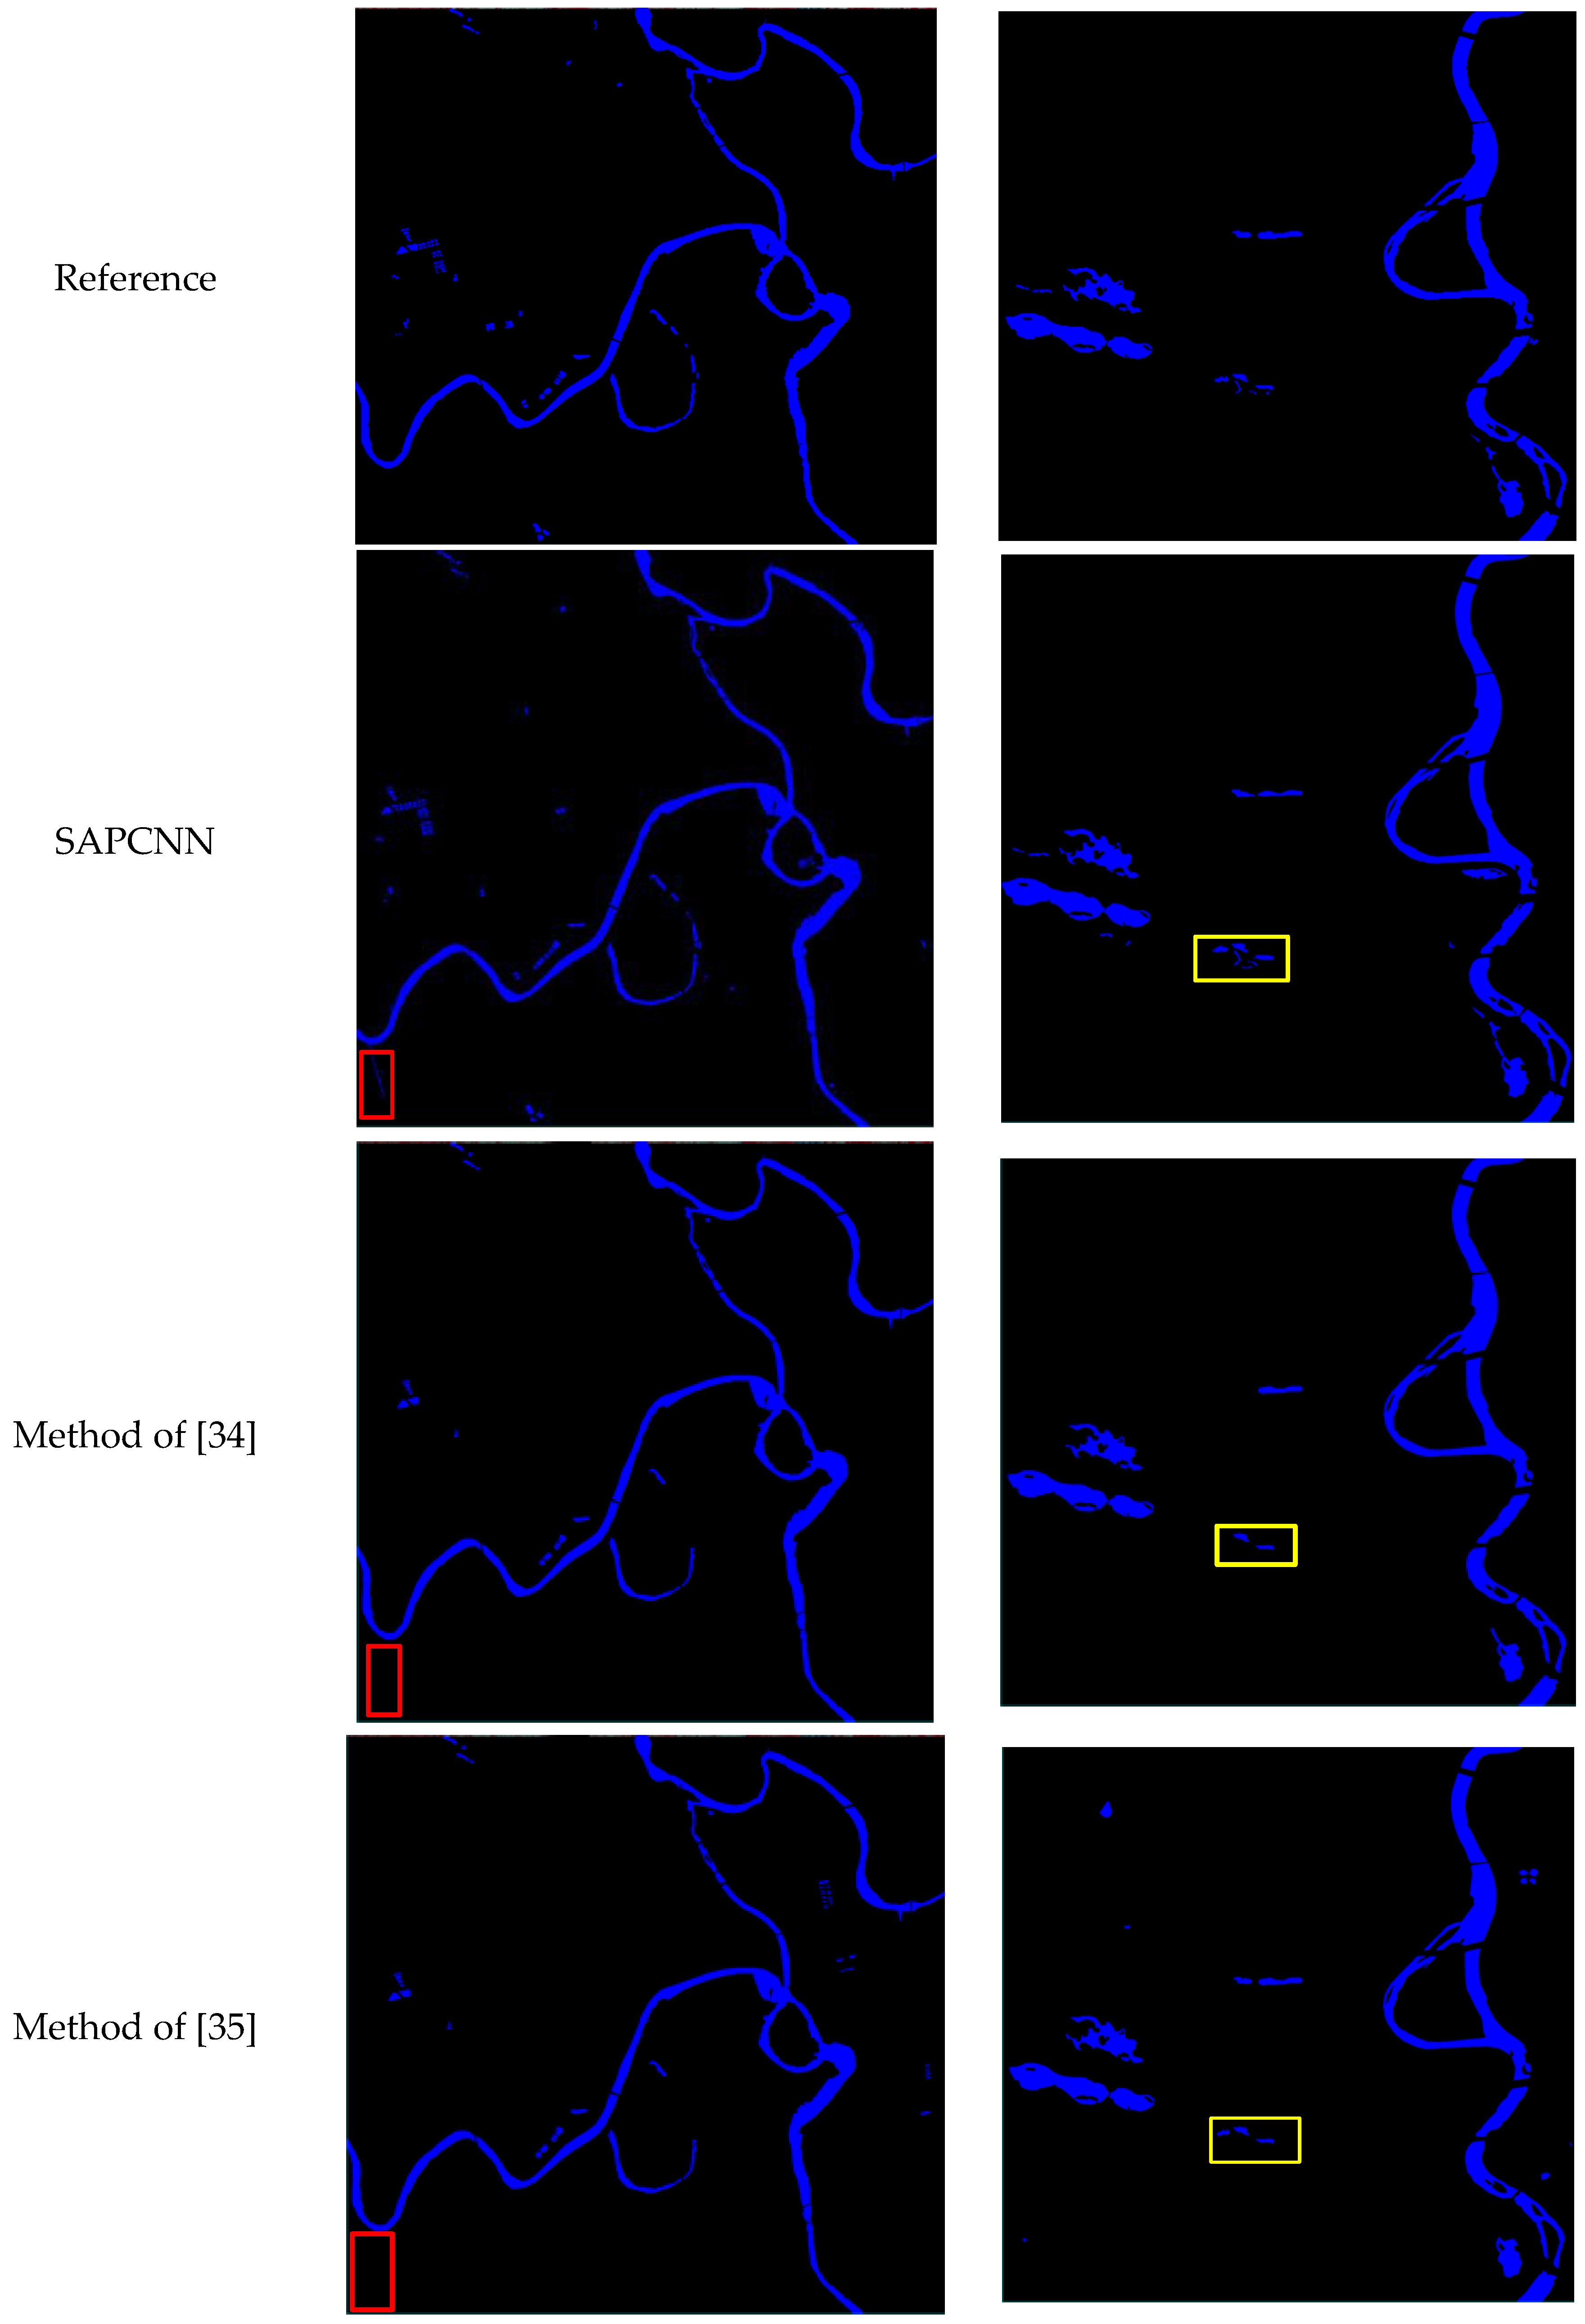
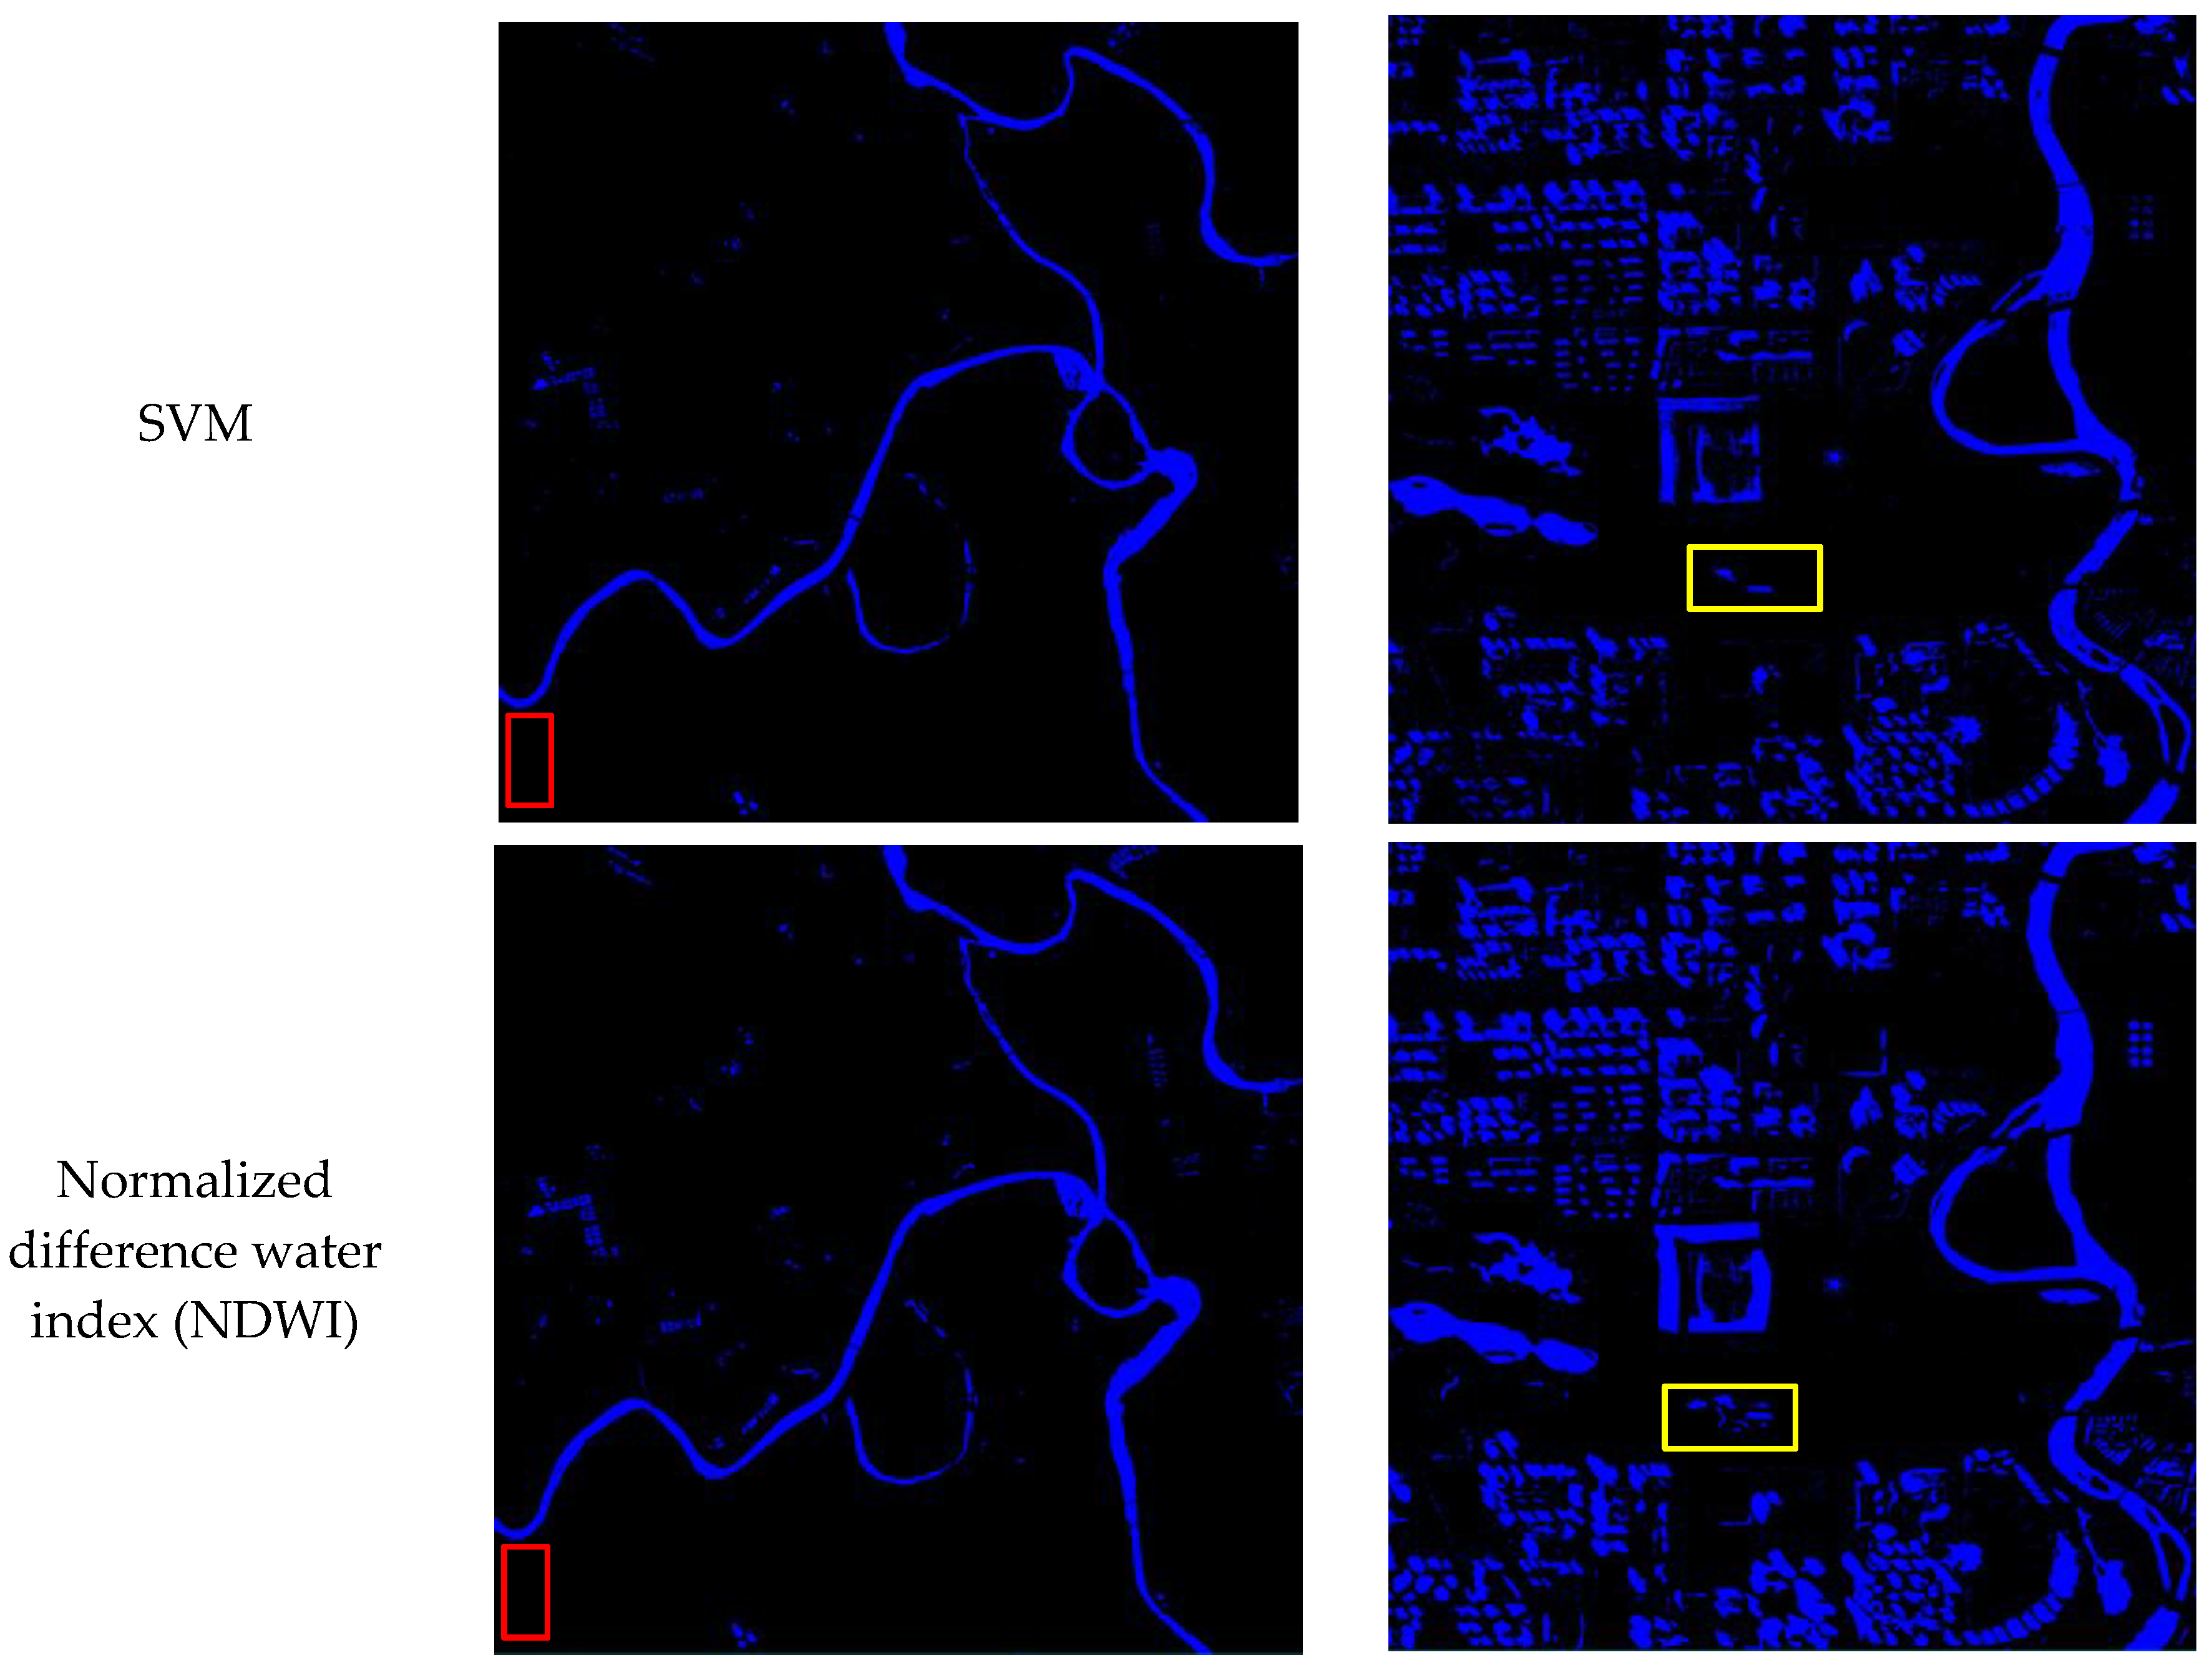
3.4. Comparison with Other Water Bodies Extraction Methods

In this paper, our algorithm uses three band images (B1, B2, and B4), the remote sensing is image first segmented into superpixels using the A-SLIC method, and the classes of these superpixels are then predicted using our designed SAPCNN model to obtain the water extraction result. We compare SAPCNN algorithm with SVM, the normalized difference water index (NDWI), and two extraction water methods in [34,35]. Figure 11 shows the water extraction results using SAPCNN, SVM, NDWI, and two extraction water methods in [34,35].
From Figure 11, it can be seen that SAPCNN successfully extracted most of the urban water bodies with complete shapes, while the extracted results by SVM, NDWI, the method of [34], and the method of [35] were incomplete. For example, SAPCNN extracted small ponds with complete shapes, whereas the results on the extracted ponds in NDWI, SVM and two water extraction methods in [34,35] were discontinuous (in the red box). From Figure 11, the water extraction results from the SAPCNN are visually cleaner, but the water extraction results from the NDWI and the SVM cannot distinguish between shadow pixels and water pixels. Here, the misidentified water pixels are found in residential areas, particularly in shadows and dark roads (in Chengdu). The extra shadow reduction procedure in the SAPCNN, the method of [34], and the method of [35] provides a larger improvement.
We evaluate the algorithm performance for the water extraction. Here, six metrics are used including OA, PA, UA, EOA, EOE and ECE. Table 4 shows statistical results for different water extraction algorithms on the test set. A good water extraction method has high values of OA and PA and low values of EOE and ECE.
Accuracy assessments (Table 4) indicate that the SAPCNN has a good accuracy when extracting urban water bodies. For the study area in Beijing, in the classification-level evaluation, we compared the SAPCNN with SVM, NDWI, the method of [34], and the method of [35], and found that the SAPCNN has a much higher overall accuracy (99.81%). In boundary evaluation of water bodies, in comparison to the SVM and the NDWI, our method has a much lower total edge omission and edge commission error (1.85%) and a much higher edge overall accuracy (98.15%). However, for the study area in Chengdu with a large number of shadow areas, we compared the NDWI with the SVM and the SAPCNN, and found that the NDWI has a much lower OA (69.17%) and PA (58.63%), and the SVM has a much higher total EOE and ECE (9.56%). The total ECE and EOE of SAPCNN was only 2.68% of that of SVM. The reason for this result is that the SVM and NDWI are more vulnerable to shadow pixels than the SAPCNN.

4. Conclusions

In this research, a novel water body extraction method based on deep learning is proposed for high-resolution remote-sensing images. The proposed method combines an enhanced superpixel method with deep learning to extract urban water bodies and distinguishes between shadow pixels and water pixels. The remote-sensing image is first segmented into superpixels using the A-SLIC method, and then a new CNN architecture is designed, which can mine high-level water features. The proposed method was tested for three different cities of China having different water-body types and topography, and results showed that the proposed method performed well with an accuracy of 98.31% to 99.81% and total EOE and ECE (2.68%). In addition, superpixel pre-processing reduces the size of feature maps of the SAPCNN and computation complexity. This study concludes that the proposed deep-learning methods can significantly improve urban surface water detection accuracy for high-resolution remote-sensing imagery.

Author Contributions

Yang Chen was responsible for the research design, experiment and analysis, and drafting of the manuscript. Rongshuang Fan collected the dataset. Xiucheng Yang and Jingxue Wang built the model. Aamir Latif wrote the paper. All authors reviewed the manuscript.

Acknowledgments

This work was supported by the Nation key R&D Program of China (No. 2016YFC0803100), the National Natural Science Foundation of China (No. 41101452), and the Doctoral Program Foundation of Institutions of Higher Education of China (No. 20112121120003).

Conflicts of Interest

The authors declare no conflict of interest.

References

  1. Fletcher, T.D.; Andrieu, H.; Hamel, P. Understanding, management and modelling of urban hydrology and its consequences for receiving waters: A state of the art. Adv. Water Res. 2013, 51, 261–279. [Google Scholar] [CrossRef]
  2. Rizzo, P. Water and Wastewater Pipe Nondestructive Evaluation and Health Monitoring: A Review. Adv. Civ. Eng. 2010, 2010, 818597. [Google Scholar] [CrossRef]
  3. Byun, Y.; Han, Y.; Chae, T. Image fusion-based change detection for flood extent extraction using bi-temporal very high-resolution satellite images. Remote Sens. 2015, 7, 10347–10363. [Google Scholar] [CrossRef]
  4. Yang, X.; Zhao, S.; Qin, X.; Zhao, N.; Liang, L. Mapping of Urban Surface Water Bodies from Sentinel-2 MSI Imagery at 10 m Resolution via NDWI-Based Image Sharpening. Remote Sens. 2017, 9, 596. [Google Scholar] [CrossRef]
  5. Du, Y.; Zhang, Y.; Ling, F.; Wang, Q.; Li, W.; Li, X. Water bodies’ mapping from Sentinel-2 imagery with Modified Normalized Difference Water Index at 10-m spatial resolution produced by sharpening the SWIR band. Remote Sens. 2016, 8, 354. [Google Scholar] [CrossRef] [Green Version]
  6. Zhou, Y.; Luo, J.; Shen, Z.; Hu, X.; Yang, H. Multiscale water body extraction in urban environments from satellite images. IEEE J. Sel. Top. Appl. Earth Obs. Remote Sens. 2014, 7, 4301–4312. [Google Scholar] [CrossRef]
  7. Zeng, C.; Bird, S.; Luce, J.J.; Wang, J. A natural-rule-based-connection (NRBC) method for river network extraction from high-resolution imagery. Remote Sens. 2015, 7, 14055–14078. [Google Scholar] [CrossRef]
  8. Zhang, Y.; Gao, J.; Wang, J. Detailed mapping of a salt farm from Landsat TM imagery using neural network and maxi-mum likelihood classifiers: A comparison. Int. J. Remote Sens. 2007, 28, 2077–2089. [Google Scholar] [CrossRef]
  9. Yan, Y.; Zhao, H.; Chen, C.; Zou, L.; Liu, X.; Chai, C.; Wang, C.; Shi, J.; Chen, S. Comparison of Multiple Bioactive Constituents in Different Parts of Eucommia ulmoides Based on UFLC-QTRAP-MS/MS Combined with PCA. Molecules 2018, 23, 643. [Google Scholar] [CrossRef]
  10. Li, L.; Chen, Y.; Xu, T.; Liu, R.; Shi, K.; Huang, C. Super-Resolution Mapping of Wetland Inundation from Remote Sensing Imagery Based on Integration of Back-Propagation Neural Network and Genetic Algorithm. Remote Sens. Environ. 2015, 164, 142–154. [Google Scholar] [CrossRef]
  11. McFeeters, S.K. The use of the Normalized Difference Water Index (NDWI) in the delineation of open water features. Int. J. Remote Sens. 1996, 17, 1425–1432. [Google Scholar] [CrossRef]
  12. Huang, C.; Chen, Y.; Wu, J.; Li, L.; Liu, R. An evaluation of Suomi NPP-VIIRS data for surface water detection. Remote Sens. Lett. 2015, 6, 155–164. [Google Scholar] [CrossRef]
  13. Xu, H. Modification of normalised difference water index (NDWI) to enhance open water features in remotely sensed imagery. Int. J. Remote Sens. 2006, 27, 3025–3033. [Google Scholar] [CrossRef]
  14. Feyisa, G.L.; Meilby, H.; Fensholt, R.; Proud, S.R. Automated Water Extraction Index: A new technique forsurface water mapping using Landsat imagery. Remote Sens. Environ. 2013, 140, 23–35. [Google Scholar] [CrossRef]
  15. Katz, D. Undermining demand management with supply management: Moral hazard in Israeli water policies. Water 2016, 8, 159. [Google Scholar] [CrossRef]
  16. Kang, L.; Zhang, S.; Ding, Y.; He, X. Extraction and preference ordering of multireservoir water supply rules in dry years. Water 2016, 8, 28. [Google Scholar] [CrossRef]
  17. Niroumand-Jadidi, M.; Vitti, A. Reconstruction of river boundaries at sub-pixel resolution: Estimation and spatial allocation of water fractions. ISPRS Int. J. Geo-Inf. 2017, 6, 383. [Google Scholar] [CrossRef]
  18. Vieira, S.; Pinaya, W.H.L.; Mechelli, A. Using deep learning to investigate the neuroimaging correlates of psychiatric and neurological disorders: Methods and applications. Neurosci. Biobehav. Rev. 2017, 74, 58–75. [Google Scholar] [CrossRef] [PubMed]
  19. Singh, P.; Verma, A.; Chaudhari, N.S. Deep Convolutional Neural Network Classifier for Handwritten Devanagari Character Recognition. In Information Systems Design and Intelligent Applications; Springer: New Delhi, India, 2016. [Google Scholar]
  20. Zhou, F.-Y.; Jin, L.-P.; Dong, J. Review of Convolutional Neural Network. Chin. J. Comput. 2017, 40, 1229–1251. [Google Scholar]
  21. Hu, F.; Xia, G.-S.; Hu, J.; Zhang, L. Transferring Deep Convolutional Neural Networks for the Scene Classification of High-Resolution Remote Sensing Imagery. Remote Sens. 2015, 7, 14680–14707. [Google Scholar] [CrossRef]
  22. Chen, J.; Wang, C.; Ma, Z.; Chen, J.; He, D.; Ackland, S. Remote Sensing Scene Classification Based on Convolutional Neural Networks Pre-Trained Using Attention-Guided Sparse Filters. Remote Sens. 2018, 10, 290. [Google Scholar] [CrossRef]
  23. Krizhevsky, A.; Sutskever, I.; Hinton, G. ImageNet classification with deep convolutional neural networks. In Proceedings of the 25th International Conference on Neural Information Processing Systems, Lake Tahoe, NV, USA, 3–6 December 2012. [Google Scholar]
  24. Vedeldi, A.; Lenc, K. MatConvNet: Convolutional neural networks for MATLAB. In Proceedings of the 23rd ACM International Conference on Multimedia, Brisbane, Australia, 26–30 October 2015. [Google Scholar]
  25. Yang, L.; Tian, S.; Yu, L.; Ye, F.; Qian, J.; Qian, Y. Deep learning for extracting water body from Landsat imagery. Int. J. Innov. Comput. Inf. Control 2015, 11, 1913–1929. [Google Scholar]
  26. Yang, J.; Yang, G. Modified Convolutional Neural Network Based on Dropout and the Stochastic Gradient Descent Optimizer. Algorithms 2018, 11, 28. [Google Scholar] [CrossRef]
  27. Pouliot, D.; Latifovic, R.; Pasher, J.; Duffe, J. Landsat Super-Resolution Enhancement Using Convolution Neural Networks and Sentinel-2 for Training. Remote Sens. 2018, 10, 394. [Google Scholar] [CrossRef]
  28. Csillik, O. Fast Segmentation and Classification of Very High Resolution Remote Sensing Data Using SLIC Superpixels. Remote Sens. 2017, 9, 243. [Google Scholar] [CrossRef]
  29. Li, Z.; Chen, J. Superpixel segmentation using linear spectral clustering. In Proceedings of the 2015 IEEE Conference on Computer Vision and Pattern Recognition (CVPR), Boston, MA, USA, 7–12 June 2015; pp. 1356–1363. [Google Scholar]
  30. Achanta, R.; Shaji, A.; Smith, K.; Lucchi, A.; Fua, P.; Süsstrunk, S. Slic superpixels compared to state-of-the-art superpixel methods. IEEE Trans. Pattern Anal. Mach. Intell. 2012, 34, 2274–2282. [Google Scholar] [CrossRef] [PubMed]
  31. Zollhöfer, M.; Izadi, S.; Rehmann, C.; Zach, C.; Fisher, M.; Wu, C.; Fitzgibbon, A.; Loop, C.; Theobalt, C.; Stamminger, M. Real-time non-rigid reconstruction using an RGB-D camera. ACM Trans. Graph. 2014, 33, 156. [Google Scholar] [CrossRef]
  32. Li, H.; Liu, J.; Liu, R.W.; Xiong, N.; Wu, K.; Kim, T.-H. A Dimensionality Reduction-Based Multi-Step Clustering Method for Robust Vessel Trajectory Analysis. Sensors 2017, 17, 1792. [Google Scholar] [CrossRef] [PubMed]
  33. Guangyun, Z.; Xiuping, J.; Jiankun, H. Superpixel-based graphical model for remote sensing image mapping. IEEE Trans. Geosci. Remote Sens. 2015, 53, 5861–5871. [Google Scholar]
  34. Isikdogan, F.; Bovik, A.C.; Passalacqua, P. Surface water mapping by deep learning. IEEE J. Sel. Top. Appl. Earth Obs. Remote Sensi. 2017, 10, 4909–4918. [Google Scholar] [CrossRef]
  35. Yu, L.; Wang, Z.; Tian, S.; Ye, F.; Ding, J.; Kong, J. Convolutional neural networks for water body extraction from landsat imagery. Int. J. Comput. Intell. Appl. 2017, 16, 1750001. [Google Scholar] [CrossRef]
Figure 1. Study area and imagery materials. (a) ZY-3 multispectral imagery (Beijing, area coverage 2000 pixels × 1800 pixels), (b) ZY-3 multispectral imagery (Tianjin, area coverage 2000 pixels × 1800 pixels), (c) Gaofeng-2 multispectral imagery (Beijing, area coverage 2000 pixels × 1900 pixels), (d) ZY-3 multispectral imagery (Beijing, area coverage 2000 pixels × 1900 pixels).
Water 10 00585 g001
Figure 2. The standard architecture of the convolutional neural network (CNN).
Water 10 00585 g002
Figure 3. Different pooling areas. (a) The features of the whole feature map are mainly concentrated at A; (b) The features of the feature map are mainly distributed in A, B, C.
Water 10 00585 g003
Figure 4. The feature map from the different pooling models. (a) the original image; (b) the feature map obtained from the self-adaptive pooling model; (c) the feature map obtained from the max pooling model; (d) the feature map obtained from the average pooling model.
Water 10 00585 g004
Figure 5. Architecture of our designed CNN.
Water 10 00585 g005
Figure 6. Hue, saturation, and intensity (HSI) color space of a remote-sensing image. (a) Original image. (b) Intensity component image. (c) Hue component image. (d) Saturation component image.
Water 10 00585 g006
Figure 7. Processing chain of water bodies extraction in the proposed framework.
Water 10 00585 g007
Figure 8. Extraction water results using different superpixel segmentation methods. (a) ZY-3 multispectral imagery (Beijing); (b) Adaptive simple linear iterative clustering (A-SLIC); (c) SLIC; (d) Reference water mapping (Beijing); (e) Extraction water results using our improved SLIC; (f) Extraction water results using SLIC.
Water 10 00585 g008
Figure 9. Extraction water results using different pooling models.
Water 10 00585 g009aWater 10 00585 g009b
Figure 10. Comparison of water extraction results using SAPCNN, SVM and NDWI. (a) No-water bodies images, (b) Extraction water results using SAPCNN, (c) Extraction water results using SVM, (d) Extraction water results using NDWI.
Water 10 00585 g010
Figure 11. Comparison of water extraction results using SAPCNN, SVM, NDWI and two extraction water methods in [34,35].
Water 10 00585 g011aWater 10 00585 g011bWater 10 00585 g011c
Table 1. Overview of Chinese ZY-3 and GF-2 multispectral datasets.
Satellite ParametersZY-3 Multispectral ImageryGF-2 Multispectral Imagery
Product Level1A1A
Number of bands44
Wavelength (nm)Blue: 450–520; Green: 520–590Red: 630–690; NIR: 770–890
Spatial resolution (m)5.84
Radiometric resolution (bit)10241024
Table 2. Parameters of different superpixel segmentation water extraction method.
Image NameParameterOur MethodSLIC
Overall accuracy (OA) (%)99.2997.29
User’s accuracy (UA) (%)92.1693.46
ZY-3 multispectral imagery(Beijing)Producer’s accuracy (PA) (%)87.1982.06
Edge overall accuracy (EOA) (%)98.8296.49
Edge omission error (EOE) (%)0.421.39
Edge commission error (ECE) (%)0.762.12
Table 3. Parameters of different pooling CNNs water extraction method.
Image NameParameterSelf-Adaptive Pooling + CNNMax Pooling + CNNAverage Pooling + CNN
EOA (%)97.8294.2191.27
ZY-3 multispectral imagery(Tianjin)EOE (%)0.942.636.24
ECE (%)1.243.162.49
Table 4. Water mapping accuracy assessment results.
Study AreaApproachOAPAUAECEEOEEOA
BeijingSAPCNN99.81%90.24%94.18%1.13%0.72%98.15%
Method of [34]98.27%89.21%92.37%2.61%1.02%96.37%
Method of [35]97.38%91.32%88.91%2.10%0.83%97.07%
SVM88.21%79.23%81.54%5.17%1.34%93.49%
NDWI89.36%83.54%80.09%4.14%1.27%94.59%
ChengduSAPCNN98.31%92.33%91.87%1.64%1.04%97.32%
Method of [34]97.04%91.79%89.37%3.03%0.93%96.04%
Method of [35]96.21%90.37%88.26%2.95%1.04%96.01%
SVM71.23%59.34%63.54%7.39%2.17%90.44%
NDWI69.17%58.63%65.27%5.21%3.57%91.22%

